Grundlæggende statistik
| Institutionelle aktier (lange) | 142.791.734 - 99,86% (ex 13D/G) - change of -11,54MM shares -7,48% MRQ |
| Institutionel værdi (lang) | $ 51.763.210 USD ($1000) |
Institutionelt ejerskab og aktionærer
Carvana Co. (US:CVNA) har 870 institutionelle ejere og aktionærer, der har indsendt 13D/G- eller 13F-formularer til Securities Exchange Commission (SEC). Disse institutioner har i alt 142,791,734 aktier. Største aktionærer omfatter Price T Rowe Associates Inc /md/, Vanguard Group Inc, BlackRock, Inc., Susquehanna International Group, Llp, Jpmorgan Chase & Co, Fmr Llc, Citigroup Inc, State Street Corp, Capital Research Global Investors, and CAS Investment Partners, LLC .
Carvana Co. (NYSE:CVNA) institutionel ejerskabsstruktur viser aktuelle positioner i virksomheden efter institutioner og fonde, samt seneste ændringer i positionsstørrelse. Større aktionærer kan omfatte individuelle investorer, investeringsforeninger, hedgefonde eller institutioner. Skema 13D angiver, at investoren besidder (eller besidder) mere end 5 % af virksomheden og har til hensigt (eller har til hensigt at) aktivt at forfølge en ændring i forretningsstrategi. Skema 13G indikerer en passiv investering på over 5%.
The share price as of April 24, 2026 is 409,08 / share. Previously, on April 28, 2025, the share price was 241,53 / share. This represents an increase of 69,37% over that period.

Fondens stemningsscore
Fund Sentiment Score (fka Ownership Accumulation Score) finder de aktier, der bliver mest købt af fonde. Det er resultatet af en sofistikeret, multi-faktor kvantitativ model, der identificerer virksomheder med de højeste niveauer af institutionel akkumulering. Scoringsmodellen bruger en kombination af den samlede stigning i oplyste ejere, ændringerne i porteføljeallokeringer i disse ejere og andre målinger. Tallet går fra 0 til 100, hvor højere tal indikerer et højere niveau af akkumulering for sine jævnaldrende, og 50 er gennemsnittet.
Opdateringsfrekvens: Dagligt
Se Ownership Explorer, som giver en liste over højest rangerende virksomheder.
AI+ Ask Fintel’s AI assistant about Carvana Co..
Select a question to share a public post with an AI-crafted answer.
Thinking of good questions…
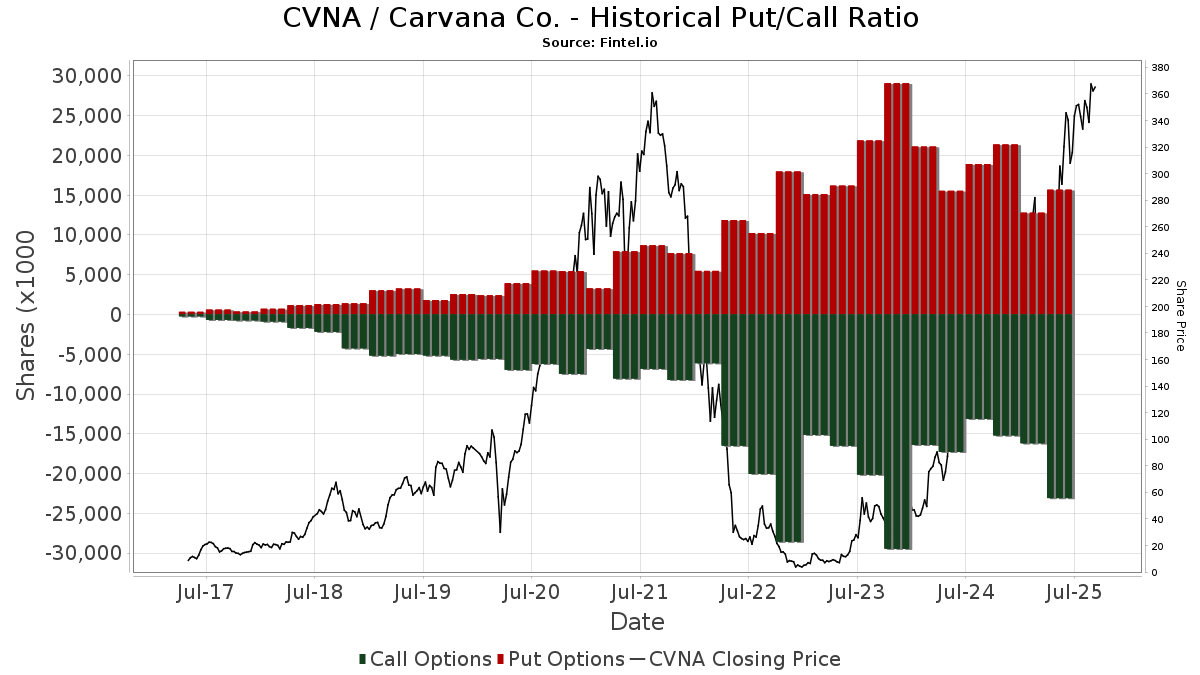
Institutionel Put/Call-forhold
Ud over at indberette standardaktie- og gældsudstedelser skal institutter med mere end 100 mill. aktiver under forvaltning også oplyse deres put- og call-optionsbeholdninger. Da salgsoptioner generelt indikerer negativ stemning, og købsoptioner indikerer positiv stemning, kan vi få en fornemmelse af den overordnede institutionelle stemning ved at plotte forholdet mellem put og kald. Diagrammet til højre viser det historiske put/call-forhold for dette instrument.
Brug af Put/Call Ratio som en indikator for investorernes stemning overvinder en af de vigtigste mangler ved at bruge totalt institutionelt ejerskab, som er, at en betydelig mængde af aktiver under forvaltning investeres passivt for at spore indekser. Passivt forvaltede fonde køber typisk ikke optioner, så indikatoren for put/call-forholdet følger mere nøje følelsen af aktivt forvaltede fonde.
13D/G-arkivering
Vi præsenterer 13D/G ansøgninger separat fra 13F ansøgninger på grund af den forskellige behandling af SEC. 13D/G-ansøgninger kan indgives af grupper af investorer (med én ledende), hvorimod 13F-ansøgninger ikke kan. Dette resulterer i situationer, hvor en investor kan indsende en 13D/G, der rapporterer én værdi for de samlede aktier (der repræsenterer alle de aktier, der ejes af investorgruppen), men derefter indsender en 13F, der rapporterer en anden værdi for de samlede aktier (der udelukkende repræsenterer deres egne) ejendomsret). Det betyder, at aktieejerskab af 13D/G-arkiver og 13F-arkiveringer ofte ikke er direkte sammenlignelige, så vi præsenterer dem separat.
Bemærk: Fra den 16. maj 2021 viser vi ikke længere ejere, der ikke har indsendt en 13D/G inden for det seneste år. Tidligere viste vi den fulde historie af 13D/G-arkiver. Generelt skal enheder, der er forpligtet til at indgive 13D/G-ansøgninger, indgive mindst årligt, før de indsender en afsluttende ansøgning. Dog forlader fonde nogle gange positioner uden at indsende en afsluttende ansøgning (dvs. de afvikler), så visning af den fulde historie resulterede nogle gange i forvirring om det nuværende ejerskab. For at undgå forvirring viser vi nu kun 'aktuelle' ejere - det vil sige - ejere, der har anmeldt inden for det seneste år.
Upgrade to unlock premium data.
| Fil dato | Form | Investor | Forrige Aktier |
Seneste Aktier |
Δ Aktier (Procent) |
Ejendomsret (Procent) |
Δ Ejerskab (Procent) |
|
|---|---|---|---|---|---|---|---|---|
| 2026-03-26 | VANGUARD GROUP INC | 16,783,099 | 0 | -100.00 | 0.00 | -100.00 | ||
| 2026-02-17 | PRICE T ROWE ASSOCIATES INC /MD/ | 13,729,435 | 17,787,942 | 29.56 | 12.60 | 13.51 | ||
| 2026-01-21 | BlackRock, Inc. | 7,378,929 | 10,760,106 | 45.82 | 7.60 | 38.18 | ||
| 2025-08-15 | CVAN Holdings LLC | 6,445,377 | 6,195,377 | -3.88 | 4.30 | -10.23 | ||
| 2025-08-14 | GREENOAKS CAPITAL PARTNERS LLC | 6,040,032 | 5,657,525 | -6.33 | 4.20 | -20.75 | ||
| 2025-08-06 | FMR LLC | 9,661,673 | 6,085,125 | -37.02 | 4.50 | -40.00 | ||
| 2025-08-01 | GARCIA ERNEST C. III | 30,640,009 | 30,299,174 | -1.11 | 18.20 | -7.00 | ||
| 2025-08-01 | GARCIA ERNEST C. II | 45,442,317 | 43,342,792 | -4.62 | 23.90 | -5.16 | ||
| 2025-05-15 | CAS Investment Partners, LLC | 6,453,594 | 5,685,029 | -11.91 | 4.20 | -16.00 |
13F og NPORT arkivering
Detaljer om 13F-arkivering er gratis. Detaljer om NP-ansøgninger kræver et premium-medlemskab. Grønne rækker angiver nye positioner. Røde rækker angiver lukkede positioner. Klik på linket ikon for at se den fulde transaktionshistorik.
Opgrader
for at låse premium-data op og eksportere til Excel ![]() .
.
Important Note
In an effort to reduce load times for our mobile users, we are testing some ways to deliver lighter pages.
In this first test, we will deliver only the most recent 750 transactions (out of 1211 for this stock). If you are interested in loading *all* the transactions for this company, click the "load all" button below. This is just a test and if you don't like it, please let us know by submitting some gentle feedback via the link at the bottom of this page.
Load All| Fil dato | Kilde | Investor | Type | Gennemsnitlig pris (Øst) |
Aktier | Δ Aktier (%) |
Rapporteret Værdi ($1000) |
Δ Værdi (%) |
Port Alloc (%) |
|
|---|---|---|---|---|---|---|---|---|---|---|
| 2026-02-12 | 13F | Hollencrest Capital Management | 0 | -100,00 | 0 | -100,00 | ||||
| 2026-02-17 | 13F | KP Management LLC | 6.500 | 0,00 | 2.743 | 11,87 | ||||
| 2026-03-04 | 13F | SHP Wealth Management | 21 | 9 | ||||||
| 2026-04-24 | 13F | IFM Investors Pty Ltd | 27.664 | 8,41 | 8.697 | 86.870,00 | ||||
| 2026-01-22 | 13F | Premier Path Wealth Partners, LLC | 625 | -2,65 | 264 | 8,68 | ||||
| 2026-01-07 | 13F | Aventura Private Wealth, LLC | 382 | 487,69 | 161 | 570,83 | ||||
| 2026-02-17 | 13F | Qube Research & Technologies Ltd | Put | 16.500 | -33,47 | 6.963 | -25,57 | |||
| 2026-02-17 | 13F | Qube Research & Technologies Ltd | Call | 11.000 | -71,43 | 4.642 | -68,04 | |||
| 2026-02-11 | 13F | Meeder Advisory Services, Inc. | 1.918 | 809 | ||||||
| 2026-02-13 | 13F | Towarzystwo Funduszy Inwestycyjnych Pzu Sa | 0 | -100,00 | 0 | |||||
| 2025-11-14 | 13F | Lone Pine Capital Llc | Call | 0 | -100,00 | 0 | -100,00 | |||
| 2026-04-14 | 13F | Drive Wealth Management, Llc | 0 | -100,00 | 0 | |||||
| 2026-02-17 | 13F | Trexquant Investment LP | 0 | -100,00 | 0 | -100,00 | ||||
| 2026-01-30 | 13F | State of New Jersey Common Pension Fund D | 45.048 | 5,59 | 19.011 | 18,12 | ||||
| 2026-04-21 | 13F | SLT Holdings LLC | 0 | -100,00 | 0 | |||||
| 2026-02-12 | 13F | Swiss National Bank | 359.460 | 2,61 | 151.699 | 14,80 | ||||
| 2026-02-17 | 13F | Fred Alger Management, Llc | 169.480 | -8,28 | 71.524 | 2,61 | ||||
| 2026-02-13 | 13F | Schroder Investment Management Group | 62.347 | 187,43 | 26.781 | 214,44 | ||||
| 2026-02-10 | 13F | Kentucky Retirement Systems | 8.287 | 0,00 | 3.497 | 11,87 | ||||
| 2026-02-10 | 13F | Peapack Gladstone Financial Corp | 1.433 | 1 | ||||||
| 2026-02-11 | 13F | Arrowpoint Investment Partners (Singapore) Pte. Ltd. | 0 | -100,00 | 0 | -100,00 | ||||
| 2026-02-13 | 13F | Charles Schwab Investment Management Inc | 1.002.364 | 56,93 | 423.018 | 75,56 | ||||
| 2026-02-13 | 13F | Mufg Securities Americas Inc. | 3.810 | 1.608 | ||||||
| 2026-02-11 | 13F | Buckingham Strategic Partners | 1.875 | -74,40 | 792 | -66,69 | ||||
| 2026-02-11 | 13F | SOUTH STATE Corp | 59 | -3,28 | 25 | 4,35 | ||||
| 2025-11-12 | 13F | Aster Capital Management (DIFC) Ltd | 0 | -100,00 | 0 | -100,00 | ||||
| 2026-02-17 | 13F | Balyasny Asset Management Llc | 2.116 | -92,40 | 893 | -91,51 | ||||
| 2026-02-04 | 13F | Versor Investments LP | 0 | -100,00 | 0 | |||||
| 2026-02-17 | 13F | Balyasny Asset Management Llc | Call | 46.400 | 11,81 | 19.582 | 25,08 | |||
| 2026-02-17 | 13F | Balyasny Asset Management Llc | Put | 62.800 | -34,52 | 26.503 | -26,74 | |||
| 2026-02-13 | 13F | Quarry LP | Put | 0 | -100,00 | 0 | -100,00 | |||
| 2026-02-17 | 13F | Creative Planning | 27.566 | 38,15 | 11.634 | 54,55 | ||||
| 2025-11-13 | 13F | Roberts Capital Advisors, LLC | 0 | -100,00 | 0 | -100,00 | ||||
| 2026-04-03 | 13F | Investors Research Corp | 3 | 1 | ||||||
| 2026-02-17 | 13F | Quadrature Capital Ltd | 0 | -100,00 | 0 | -100,00 | ||||
| 2026-02-17 | 13F | Quantinno Capital Management LP | 41.366 | 19,16 | 17.457 | 33,31 | ||||
| 2026-02-13 | 13F | Ostrum Asset Management | 187 | -25,50 | 79 | -17,02 | ||||
| 2026-02-09 | 13F | Frazier Financial Advisors, LLC | 0 | -100,00 | 0 | |||||
| 2026-04-20 | 13F | Assenagon Asset Management S.A. | 43.596 | -73,70 | 13.706 | -80,41 | ||||
| 2026-02-17 | 13F | Boothbay Fund Management, Llc | 13.931 | 313,14 | 5.879 | 362,19 | ||||
| 2026-02-17 | 13F | Clear Street Markets Llc | 211 | 89 | ||||||
| 2026-01-27 | 13F | First Horizon Corp | 418 | 6,36 | 176 | 18,92 | ||||
| 2026-02-02 | 13F | Danske Bank A/s | 60.212 | 20,30 | 25.411 | 34,58 | ||||
| 2026-02-17 | 13F | Graham Capital Management, L.P. | 0 | -100,00 | 0 | -100,00 | ||||
| 2026-02-13 | 13F | Greenline Wealth Management LLC | 141 | 60 | ||||||
| 2025-12-15 | 13F | FNY Investment Advisers, LLC | Put | 0 | -100,00 | 0 | ||||
| 2026-02-17 | 13F | Greenland Capital Management LP | 742 | -52,13 | 313 | -46,40 | ||||
| 2026-02-17 | 13F | MIRAE ASSET GLOBAL ETFS HOLDINGS Ltd. | 32.922 | 46,05 | 13.894 | 63,39 | ||||
| 2026-04-13 | 13F | Clayton Financial Group LLC | 24 | 380,00 | 8 | 250,00 | ||||
| 2026-04-16 | 13F | Toth Financial Advisory Corp | 41 | 0,00 | 13 | -29,41 | ||||
| 2026-02-10 | 13F | Lido Advisors, LLC | 1.527 | 3,95 | 579 | 4,51 | ||||
| 2026-04-21 | 13F | Huntleigh Advisors, Inc. | 4.479 | 2,21 | 1.408 | -23,85 | ||||
| 2026-02-12 | 13F | CIBC Private Wealth Group, LLC | 178 | 147,22 | 75 | 177,78 | ||||
| 2026-02-11 | 13F | Allianz Asset Management GmbH | Call | 100 | 42 | |||||
| 2026-02-10 | 13F | Bank of New York Mellon Corp | 693.572 | 81,69 | 292.701 | 103,25 | ||||
| 2026-02-12 | 13F | Massachusetts Institute Of Technology | 578.300 | 0,07 | 244.054 | 11,94 | ||||
| 2026-02-17 | 13F | CAS Investment Partners, LLC | 4.610.200 | -5,72 | 1.945.597 | 5,48 | ||||
| 2026-02-11 | 13F | Allianz Asset Management GmbH | 10.397 | -80,78 | 4.388 | -78,50 | ||||
| 2026-02-11 | 13F | Allianz Asset Management GmbH | Put | 80.300 | 33.888 | |||||
| 2026-04-07 | 13F | Signaturefd, Llc | 1.951 | -1,22 | 613 | -26,41 | ||||
| 2026-02-12 | 13F | Nuveen, LLC | 458.545 | 16,04 | 193.515 | 29,82 | ||||
| 2026-01-13 | 13F | Dream Peak Capital Ltd | 44.353 | 18.718 | ||||||
| 2026-02-12 | 13F | Jane Street Group, Llc | Call | 2.811.900 | 67,90 | 1.186.678 | 87,84 | |||
| 2026-02-12 | 13F | Jane Street Group, Llc | 13.235 | -94,45 | 5.585 | -93,80 | ||||
| 2026-02-12 | 13F | Jane Street Group, Llc | Put | 1.117.000 | 7,91 | 471.396 | 20,72 | |||
| 2026-02-09 | 13F | Geode Capital Management, Llc | 3.880.711 | 55,36 | 1.632.763 | 73,64 | ||||
| 2026-02-05 | 13F | Bessemer Group Inc | 173.048 | 69,42 | 73 | 92,11 | ||||
| 2026-04-16 | 13F | Davis Capital Management | 0 | -100,00 | 0 | |||||
| 2026-01-23 | 13F | Steigerwald, Gordon & Koch Inc. | 113 | 13,00 | 48 | 27,03 | ||||
| 2026-02-06 | 13F | Pinkerton Retirement Specialists, LLC | 0 | -100,00 | 0 | |||||
| 2026-02-10 | 13F | Ellevest, Inc. | 723 | -57,17 | 305 | -52,04 | ||||
| 2026-02-02 | 13F | Truist Financial Corp | 12.069 | 41,74 | 5.093 | 58,56 | ||||
| 2025-11-14 | 13F | Cubist Systematic Strategies, LLC | Put | 47.500 | -9,35 | 17.919 | 1,48 | |||
| 2025-11-14 | 13F | Cubist Systematic Strategies, LLC | Call | 8.600 | -62,45 | 3.244 | -57,96 | |||
| 2026-04-13 | 13F | Massmutual Trust Co Fsb/adv | 259 | 77,40 | 81 | 32,79 | ||||
| 2026-02-13 | 13F | Transamerica Financial Advisors, Inc. | 39 | 178,57 | 17 | 220,00 | ||||
| 2025-10-30 | 13F | Twin Peaks Wealth Advisors, LLC | 0 | -100,00 | 0 | -100,00 | ||||
| 2026-02-11 | 13F | Fjarde Ap-fonden /fourth Swedish National Pension Fund | 27.820 | 2,66 | 11.741 | 117.300,00 | ||||
| 2026-02-12 | 13F | JPL Wealth Management, LLC | 0 | -100,00 | 0 | |||||
| 2026-04-20 | 13F | Friedenthal Financial | 35 | 0,00 | 11 | -21,43 | ||||
| 2026-02-13 | 13F | Barclays Plc | Call | 1.308.000 | -21,81 | 552.002 | -12,53 | |||
| 2026-02-13 | 13F | Barclays Plc | Put | 118.500 | -7,35 | 50.009 | 3,65 | |||
| 2026-04-10 | 13F | Armstrong Advisory Group, Inc | 160 | 0,00 | 50 | -25,37 | ||||
| 2026-02-11 | 13F | Metis Global Partners, LLC | 5.622 | 119,70 | 2.373 | 145,80 | ||||
| 2026-02-13 | 13F | Barclays Plc | 261.063 | 140,62 | 110.174 | 169,18 | ||||
| 2026-04-15 | 13F | Blue Square Asset Management, Llc | 0 | -100,00 | 0 | |||||
| 2026-01-29 | 13F | Rakuten Securities, Inc. | 192 | 255,56 | 81 | 305,00 | ||||
| 2026-02-13 | 13F | Dai-Ichi Life Insurance Company, Ltd | 4.873 | 0,00 | 2.057 | 11,86 | ||||
| 2026-02-17 | 13F | Schonfeld Strategic Advisors LLC | 0 | -100,00 | 0 | -100,00 | ||||
| 2026-02-09 | 13F | Investors Portfolio Services LLC | 6 | 3 | ||||||
| 2026-02-17 | 13F | Sora Investors Llc | 5.312 | -58,42 | 2.242 | -53,50 | ||||
| 2026-02-13 | 13F | Kestra Advisory Services, LLC | 0 | -100,00 | 0 | |||||
| 2026-04-13 | 13F | Mather Group, Llc. | 90 | 28 | ||||||
| 2026-02-12 | 13F | Penserra Capital Management LLC | 12.841 | 1,21 | 5 | 25,00 | ||||
| 2026-01-12 | 13F | Rialto Wealth Management, LLC | 160 | 0,00 | 68 | 11,67 | ||||
| 2026-02-17 | 13F | Jump Financial, LLC | 883 | -59,35 | 373 | -54,58 | ||||
| 2025-11-14 | 13F | Scientech Research LLC | 0 | -100,00 | 0 | |||||
| 2026-04-24 | 13F | Yousif Capital Management, Llc | 13.571 | -2,11 | 4.266 | -30,42 | ||||
| 2026-04-17 | 13F | Cache Advisors, LLC | 0 | -100,00 | 0 | |||||
| 2026-02-17 | 13F | General Equity Holdings LP | 212.096 | -18,43 | 89.509 | -8,74 | ||||
| 2026-01-26 | 13F | Mirae Asset Global Investments Co., Ltd. | 29.054 | 269,97 | 12.261 | 313,94 | ||||
| 2026-02-17 | 13F | Spyglass Capital Management Llc | 180.668 | 76.246 | ||||||
| 2026-04-23 | 13F | Marquette Asset Management, LLC | 22 | 83,33 | 7 | 20,00 | ||||
| 2026-01-15 | 13F | Allspring Global Investments Holdings, LLC | 229.533 | 18,39 | 91.871 | 19,84 | ||||
| 2026-04-16 | 13F | SG Americas Securities, LLC | Put | 15.800 | -34,98 | 1 | ||||
| 2026-01-21 | 13F | Sound Income Strategies, LLC | 22 | 10 | ||||||
| 2026-02-05 | 13F | Northwestern Mutual Investment Management Company, Llc | 4.519 | 1.907 | ||||||
| 2026-04-22 | 13F | Patriot Financial Group Insurance Agency, LLC | 9.672 | 3.041 | ||||||
| 2026-02-13 | 13F | AlTi Global, Inc. | 1.003 | 423 | ||||||
| 2026-02-12 | 13F | Skandinaviska Enskilda Banken AB (publ) | 25.716 | 3,03 | 10.853 | 15,26 | ||||
| 2025-11-14 | 13F | WealthTrak Capital Management LLC | 0 | -100,00 | 0 | -100,00 | ||||
| 2026-02-17 | 13F | Numerai GP LLC | 1.502 | -70,32 | 634 | -66,82 | ||||
| 2026-02-17 | 13F | Tcw Group Inc | 2.173 | 917 | ||||||
| 2026-02-11 | 13F | Simplex Trading, Llc | 3.923 | 1.656 | ||||||
| 2026-02-11 | 13F | Simplex Trading, Llc | Call | 400.400 | -1,55 | 168.977 | 110.341,83 | |||
| 2026-02-05 | 13F | RiverFront Investment Group, LLC | 2.472 | 1.043 | ||||||
| 2026-02-11 | 13F | Simplex Trading, Llc | Put | 469.200 | 2,13 | 198.012 | 114.357,23 | |||
| 2026-02-12 | 13F | MetLife Investment Management, LLC | 40.320 | 377,10 | 17.016 | 433,72 | ||||
| 2026-02-10 | 13F | Exor Capital LLP | 2.855.140 | -7,71 | 1.204.926 | 3,25 | ||||
| 2026-02-17 | 13F | Woodline Partners LP | 30.281 | 505,86 | 12.779 | 577,93 | ||||
| 2026-02-06 | 13F | HighTower Advisors, LLC | 4.681 | 2,99 | 1.976 | 15,23 | ||||
| 2026-02-02 | 13F | Fifth Third Bancorp | 388 | 660,78 | 164 | 757,89 | ||||
| 2026-02-12 | 13F | Voya Investment Management Llc | 116.716 | 10,52 | 49.256 | 23,63 | ||||
| 2026-02-13 | 13F | Intrepid Financial Planning Group LLC | 500 | 211 | ||||||
| 2026-02-11 | 13F | Picton Mahoney Asset Management | 23.616 | 43,21 | 9.966 | 166.000,00 | ||||
| 2026-01-20 | 13F | Stratos Wealth Partners, LTD. | 2.159 | 22,53 | 911 | 37,20 | ||||
| 2026-03-16 | 13F | Osbon Capital Management Llc | 36 | 15 | ||||||
| 2026-02-10 | 13F | Monaco Asset Management SAM | Put | 15.000 | 6.330 | |||||
| 2026-04-16 | 13F | Beese Fulmer Investment Management, Inc. | 1.175 | 369 | ||||||
| 2026-02-05 | 13F | Amalgamated Bank | 31.155 | 192,70 | 13 | 225,00 | ||||
| 2026-02-13 | 13F | KPS Global Asset Management UK Ltd | 1.500.000 | 0,00 | 633.030 | 11,87 | ||||
| 2025-11-13 | 13F | Jefferies Financial Group Inc. | Call | 0 | -100,00 | 0 | -100,00 | |||
| 2026-04-10 | 13F/A | PBU - The Pension Fund of Early Childhood & Youth Educators | 40.703 | 268,42 | 12.796 | 174,47 | ||||
| 2026-02-13 | 13F | RH Tailwind Management, LLC | 14.500 | 6.119 | ||||||
| 2026-02-11 | 13F | Parallel Advisors, LLC | 752 | 2,45 | 317 | 14,44 | ||||
| 2026-02-13 | 13F | RH Tailwind Management, LLC | Put | 40.000 | 16.881 | |||||
| 2026-02-10 | 13F | Moors & Cabot, Inc. | 1.178 | 44,90 | 497 | 62,42 | ||||
| 2026-01-14 | 13F | ORG Partners LLC | 61 | -30,68 | 26 | -24,24 | ||||
| 2026-02-17 | 13F | Alta Park Capital, LP | 45.412 | -24,69 | 19.165 | -15,76 | ||||
| 2026-02-05 | 13F | Qsemble Capital Management, LP | 0 | -100,00 | 0 | -100,00 | ||||
| 2026-02-04 | 13F | HighPoint Advisor Group LLC | 631 | 7,68 | 266 | 20,36 | ||||
| 2026-02-13 | 13F | Mml Investors Services, Llc | 20.498 | 12,56 | 8.651 | 25,93 | ||||
| 2026-02-09 | 13F | Legal & General Group Plc | 654.019 | 11,64 | 276.009 | 24,89 | ||||
| 2026-02-18 | 13F | Mackenzie Financial Corp | 20.516 | 97,50 | 8.795 | 124,48 | ||||
| 2026-02-12 | 13F | Cliffwater LLC | 1.865 | 0,00 | 787 | 11,95 | ||||
| 2026-04-20 | 13F | Louisiana State Employees Retirement System | 7.200 | 0,00 | 2.264 | -25,51 | ||||
| 2026-04-22 | 13F | WestEnd Advisors, LLC | 1 | 0,00 | 0 | |||||
| 2026-02-13 | 13F | Polymer Capital Management (HK) LTD | 0 | -100,00 | 0 | |||||
| 2026-02-17 | 13F | Hunting Hill Global Capital, LLC | 4.756 | 150,32 | 2.007 | 180,31 | ||||
| 2026-02-10 | 13F | Rothschild Investment Llc | 19 | 72,73 | 8 | 100,00 | ||||
| 2026-02-12 | 13F | M&G Plc | 0 | -100,00 | 0 | |||||
| 2026-02-06 | 13F | Tortoise Investment Management, LLC | 0 | -100,00 | 0 | |||||
| 2026-02-17 | 13F | D. E. Shaw & Co., Inc. | 68.708 | -94,42 | 28.996 | -93,75 | ||||
| 2026-02-17 | 13F | D. E. Shaw & Co., Inc. | Put | 592.000 | 8,33 | 249.836 | 21,18 | |||
| 2026-02-17 | 13F | Utah Retirement Systems | 21.977 | 0,71 | 9.275 | 12,66 | ||||
| 2026-02-17 | 13F | D. E. Shaw & Co., Inc. | Call | 492.500 | 7,65 | 207.845 | 20,43 | |||
| 2026-01-23 | 13F | Sage Mountain Advisors LLC | 545 | 230 | ||||||
| 2026-02-17 | 13F | Hunting Hill Global Capital, LLC | Put | 100 | 42 | |||||
| 2026-02-12 | 13F | Alaethes Wealth LLC | 5 | 24 | ||||||
| 2025-11-14 | 13F | AXA Investment Managers S.A. | 3.373 | 1.272 | ||||||
| 2026-04-22 | 13F | Morris Retirement Advisors, LLC | 1.871 | 4,94 | 588 | -21,81 | ||||
| 2025-10-29 | 13F | Donoghue Forlines LLC | 0 | -100,00 | 0 | -100,00 | ||||
| 2026-02-17 | 13F | Mirabella Financial Services Llp | 96.199 | 1,20 | 40.598 | 13,21 | ||||
| 2026-02-13 | 13F | Motiv8 Investments LLC | 78 | 0 | ||||||
| 2026-02-09 | 13F | Optimist Retirement Group LLC | 1.016 | 0,00 | 429 | 11,75 | ||||
| 2026-02-13 | 13F | American Century Companies Inc | 371.356 | 0,23 | 156.720 | 12,13 | ||||
| 2026-01-27 | 13F | MASTERINVEST Kapitalanlage GmbH | 537 | 0,00 | 231 | 13,86 | ||||
| 2026-01-30 | 13F | Rachor Investment Advisory Services, LLC | 2 | 1 | ||||||
| 2026-02-13 | 13F | First Sabrepoint Capital Management Lp | Put | 0 | -100,00 | 0 | ||||
| 2026-02-19 | 13F | CI Private Wealth, LLC | 157.893 | 1.849,54 | 2.845 | -6,87 | ||||
| 2026-01-28 | 13F | Salomon & Ludwin, LLC | 85 | 112,50 | 37 | 140,00 | ||||
| 2026-02-17 | 13F | FIL Ltd | 477 | 201 | ||||||
| 2026-02-10 | 13F | Foundations Investment Advisors, LLC | 1.024 | 432 | ||||||
| 2026-02-17 | 13F | Ancora Advisors, LLC | 25 | 11 | ||||||
| 2026-02-13 | 13F | Chevy Chase Trust Holdings, Inc. | 71.712 | 30.264 | ||||||
| 2026-02-17 | 13F | Maytus Capital Management, LLC | 8.000 | 3.376 | ||||||
| 2026-02-17 | 13F | Two Sigma Advisers, Lp | 309.275 | -60,64 | 130.520 | -55,97 | ||||
| 2026-02-13 | 13F | Volterra Technologies LP | Call | 0 | -100,00 | 0 | -100,00 | |||
| 2026-01-16 | 13F | Crewe Advisors LLC | 83 | 18,57 | 35 | 34,62 | ||||
| 2026-02-10 | 13F | Daiwa Securities Group Inc. | 21.987 | 72,58 | 9 | 125,00 | ||||
| 2026-02-13 | 13F | Schf (gpe), Llc | 28.818 | 12.162 | ||||||
| 2026-02-17 | 13F | Whale Rock Capital Management LLC | 1.070.802 | 88,62 | 451.900 | 111,01 | ||||
| 2026-02-17 | 13F | Mangrove Partners | 3.183 | 1.343 | ||||||
| 2026-02-03 | 13F | Ethic Inc. | 7.384 | -28,35 | 3.116 | -19,84 | ||||
| 2026-04-21 | 13F | Aaron Wealth Advisors LLC | 718 | -27,77 | 226 | -46,30 | ||||
| 2026-02-12 | 13F | Polen Capital Management Llc | 0 | -100,00 | 0 | |||||
| 2026-02-11 | 13F | BIT Capital GmbH | Call | 7.500 | 3.165 | |||||
| 2026-02-13 | 13F | Hudson Bay Capital Management LP | 0 | -100,00 | 0 | |||||
| 2026-02-17 | 13F | Engineers Gate Manager LP | 0 | -100,00 | 0 | |||||
| 2026-02-11 | 13F | BIT Capital GmbH | 1.105 | -99,25 | 466 | -99,16 | ||||
| 2026-02-13 | 13F | Alyeska Investment Group, L.P. | 134.502 | -78,79 | 56.763 | -76,27 | ||||
| 2026-02-13 | 13F | Volterra Technologies LP | Put | 0 | -100,00 | 0 | -100,00 | |||
| 2026-04-23 | 13F | CBOE Vest Financial, LLC | 650 | 7,08 | 204 | -20,31 | ||||
| 2026-02-13 | 13F | Boreal Capital Management LLC | 0 | -100,00 | 0 | |||||
| 2026-04-22 | 13F | Motco | 0 | -100,00 | 0 | |||||
| 2026-02-11 | 13F | Loup Funds, LLC | 26.879 | 11.343 | ||||||
| 2026-02-13 | 13F | Cornerstone Financial Management LLC | 25 | 11 | ||||||
| 2026-02-17 | 13F | State Of Wisconsin Investment Board | 68.111 | 6,64 | 28.744 | 19,30 | ||||
| 2026-02-10 | 13F | State of Wyoming | 0 | -100,00 | 0 | |||||
| 2026-02-13 | 13F | Public Sector Pension Investment Board | 19.600 | 8.272 | ||||||
| 2026-02-13 | 13F | Baird Financial Group, Inc. | 2.171 | 916 | ||||||
| 2026-02-10 | 13F | Envestnet Asset Management Inc | 113.964 | -6,18 | 48.095 | 4,96 | ||||
| 2026-02-17 | 13F | Cape Investment Advisory, Inc. | 2 | 1 | ||||||
| 2026-02-09 | 13F | Atlantic Trust, LLC | 15 | 0,00 | 6 | 20,00 | ||||
| 2026-02-18 | 13F | Zazove Associates Llc | 3.000 | 11 | ||||||
| 2026-02-13 | 13F | Pathstone Holdings, LLC | 18.023 | 56,80 | 7.606 | 75,46 | ||||
| 2026-02-12 | 13F | Campbell & CO Investment Adviser LLC | 0 | -100,00 | 0 | |||||
| 2026-01-15 | 13F | Mn Services Vermogensbeheer B.V. | 47.018 | 2,88 | 20 | 11,76 | ||||
| 2026-02-12 | 13F | Qtron Investments LLC | 1.240 | -16,78 | 523 | -6,94 | ||||
| 2026-02-12 | 13F | Insigneo Advisory Services, Llc | 696 | 4,82 | 294 | 17,20 | ||||
| 2026-02-02 | 13F | Caisse Des Depots Et Consignations | 0 | -100,00 | 0 | -100,00 | ||||
| 2026-02-13 | 13F | Volterra Technologies LP | 0 | -100,00 | 0 | -100,00 | ||||
| 2026-04-24 | 13F | Semus Wealth Partners LLC | 0 | -100,00 | 0 | |||||
| 2026-02-13 | 13F | Sachem Head Capital Management LP | 625.000 | 263.762 | ||||||
| 2026-02-13 | 13F | Maplelane Capital, Llc | Call | 55.000 | -68,57 | 23.818 | -63,92 | |||
| 2026-03-13 | 13F/A | Pensionmark Financial Group, Llc | 793 | 14,76 | 335 | 28,46 | ||||
| 2026-02-13 | 13F | Maplelane Capital, Llc | 48.000 | -75,38 | 20.257 | -72,46 | ||||
| 2026-02-12 | 13F | Cibc World Markets Corp | 30.080 | 497,42 | 12.694 | 648,47 | ||||
| 2026-02-17 | 13F | Css Llc/il | Put | 1.600 | 220,00 | 675 | 259,04 | |||
| 2026-02-17 | 13F | Css Llc/il | Call | 1.200 | 20,00 | 506 | 34,22 | |||
| 2025-11-14 | 13F | Point72 Italy, S.r.l. | 0 | -100,00 | 0 | -100,00 | ||||
| 2026-04-15 | 13F | Avanza Fonder AB | 11.058 | 0,00 | 3.476 | -25,50 | ||||
| 2026-02-13 | 13F | Healthcare Of Ontario Pension Plan Trust Fund | 5.590 | 365,83 | 2.359 | 421,90 | ||||
| 2025-10-30 | 13F | Traub Capital Management LLC | 0 | -100,00 | 0 | -100,00 | ||||
| 2026-04-22 | 13F | Avantra Family Wealth, Inc. | 0 | -100,00 | 0 | |||||
| 2026-02-17 | 13F | Optiver Holding B.V. | 237 | 100 | ||||||
| 2025-11-13 | 13F | Winton Capital Group Ltd | 0 | -100,00 | 0 | -100,00 | ||||
| 2026-01-22 | 13F | Personal Cfo Solutions, Llc | 801 | 19,91 | 338 | 34,66 | ||||
| 2026-02-17 | 13F | Optiver Holding B.V. | Call | 37.000 | 15.615 | |||||
| 2026-02-17 | 13F | Mane Global Capital Management Lp | 178.693 | -36,00 | 75.412 | -28,41 | ||||
| 2025-11-19 | 13F | Caitong International Asset Management Co., Ltd | 0 | -100,00 | 0 | -100,00 | ||||
| 2026-02-17 | 13F | Nissay Asset Management Corp /japan/ /adv | 16.590 | 6,93 | 7.001 | 19,63 | ||||
| 2026-03-05 | 13F | Gunpowder Capital Management, LLC dba Oliver Wealth Management | 250 | 106 | ||||||
| 2026-02-13 | 13F | Wilkerson Advisory Group LLC | 19 | 8 | ||||||
| 2026-01-30 | 13F | Wealth High Governance Capital Ltda | 36.641 | 205,34 | 15.463 | 241,65 | ||||
| 2026-02-17 | 13F | Janus Henderson Group Plc | 14.294 | 46,41 | 6.035 | 63,70 | ||||
| 2026-02-04 | 13F | Tsfg, Llc | 23 | -25,81 | 0 | |||||
| 2026-04-14 | 13F | Yarbrough Capital, LLC | 0 | -100,00 | 0 | |||||
| 2026-04-02 | 13F | Aspect Partners, LLC | 1 | 0 | ||||||
| 2026-04-07 | 13F | CoreCap Advisors, LLC | 11 | -97,62 | 3 | -98,46 | ||||
| 2026-02-13 | 13F | Gavilan Investment Partners LLC | 86.000 | 24,64 | 36.294 | 39,43 | ||||
| 2026-02-17 | 13F | Royal Bank Of Canada | Call | 40.000 | 16.881 | |||||
| 2026-02-23 | 13F | Mv Capital Management, Inc. | 35 | 12,90 | 15 | 40,00 | ||||
| 2026-04-14 | 13F | Nova Wealth Management, Inc. | 0 | -100,00 | 0 | |||||
| 2026-02-17 | 13F | Royal Bank Of Canada | 250.037 | -5,54 | 105.520 | 5,68 | ||||
| 2025-11-13 | 13F | Clear Street Markets Llc | Call | 0 | -100,00 | 0 | -100,00 | |||
| 2026-02-17 | 13F | Capital Fund Management S.a. | Call | 64.400 | -8,26 | 27.178 | 2,63 | |||
| 2026-02-17 | 13F | Optiver Holding B.V. | Put | 22.200 | 9.369 | |||||
| 2026-02-13 | 13F | Van Eck Associates Corp | 20.078 | 7,52 | 8 | 14,29 | ||||
| 2026-02-17 | 13F | Equitable Holdings, Inc. | 543 | 0,00 | 229 | 12,25 | ||||
| 2026-02-17 | 13F | Capital Fund Management S.a. | Put | 156.000 | 55,69 | 65.835 | 74,17 | |||
| 2026-02-13 | 13F | Sands Capital Management, Llc | 2.442.534 | 44,40 | 1.030.798 | 61,54 | ||||
| 2025-11-13 | 13F | Clear Street Markets Llc | Put | 0 | -100,00 | 0 | -100,00 | |||
| 2026-02-12 | 13F | Keel Point, LLC | 854 | -0,70 | 360 | 11,11 | ||||
| 2026-04-23 | 13F | First Pacific Financial | 4 | 1 | ||||||
| 2026-02-17 | 13F | Banco Bilbao Vizcaya Argentaria, S.a. | 4.020 | 1.697 | ||||||
| 2026-02-17 | 13F | Cresset Asset Management, LLC | Put | 500 | 211 | |||||
| 2026-02-12 | 13F | DRW Securities, LLC | Put | 0 | -100,00 | 0 | -100,00 | |||
| 2026-02-17 | 13F | Cresset Asset Management, LLC | 3.149 | 9,68 | 1.329 | 22,62 | ||||
| 2025-11-20 | 13F | Maven Securities LTD | Call | 0 | -100,00 | 0 | -100,00 | |||
| 2026-04-10 | 13F | Perigon Wealth Management, LLC | 0 | -100,00 | 0 | |||||
| 2026-01-29 | 13F | Sanctuary Advisors, LLC | 5.596 | -10,13 | 2.362 | 0,51 | ||||
| 2025-11-20 | 13F | Maven Securities LTD | Put | 0 | -100,00 | 0 | -100,00 | |||
| 2026-02-12 | 13F | Triumph Capital Management | 1 | 0 | ||||||
| 2025-11-14 | 13F | Point72 (DIFC) Ltd | 4.386 | 1.655 | ||||||
| 2026-02-17 | 13F | Alliancebernstein L.p. | 218.658 | 152,68 | 92.278 | 182,68 | ||||
| 2026-02-06 | 13F | Berbice Capital Management LLC | 80 | 14,29 | 34 | 26,92 | ||||
| 2026-02-17 | 13F | Credit Agricole S A | 83.256 | 1.965,39 | 35.136 | 2.211,51 | ||||
| 2026-04-10 | 13F | Finivi Inc. | 0 | -100,00 | 0 | |||||
| 2026-01-21 | 13F | Flagship Harbor Advisors, Llc | 100 | 42 | ||||||
| 2026-02-06 | 13F | Resona Asset Management Co.,Ltd. | 39.169 | 5,66 | 16.611 | 18,14 | ||||
| 2026-04-23 | 13F | Oppenheimer Asset Management Inc. | 2.486 | -19,44 | 782 | -40,02 | ||||
| 2026-02-17 | 13F | Private Advisor Group, LLC | Put | 100 | 8 | |||||
| 2026-02-03 | 13F | Generali Asset Management SPA SGR | 0 | -100,00 | 0 | -100,00 | ||||
| 2025-10-30 | 13F | Ridgewood Investments LLC | 0 | -100,00 | 0 | -100,00 | ||||
| 2026-04-16 | 13F | BI Asset Management Fondsmaeglerselskab A/S | 2.369 | -86,63 | 1 | -100,00 | ||||
| 2026-02-17 | 13F | Tower Research Capital LLC (TRC) | 2.817 | -27,32 | 1.189 | -18,74 | ||||
| 2026-02-13 | 13F | L2 Asset Management, LLC | 667 | 8,63 | 281 | 21,65 | ||||
| 2026-02-17 | 13F | California State Teachers Retirement System | 203.894 | 5,80 | 86.047 | 18,36 | ||||
| 2026-02-11 | 13F | West Family Investments, Inc. | 482 | 203 | ||||||
| 2026-02-17 | 13F | Metavasi Capital LP | 11.105 | -65,84 | 4.687 | -61,79 | ||||
| 2026-02-04 | 13F | Asahi Life Asset Management Co., Ltd. | 0 | -100,00 | 0 | |||||
| 2026-02-12 | 13F | Dimensional Fund Advisors Lp | 547.689 | -0,02 | 231.167 | 11,81 | ||||
| 2026-02-17 | 13F | Shay Capital LLC | 1.150 | 485 | ||||||
| 2026-04-15 | 13F | Fortitude Family Office, LLC | 188 | 840,00 | 59 | 637,50 | ||||
| 2026-02-12 | 13F | Xponance, Inc. | 33.565 | 27,06 | 14.165 | 42,15 | ||||
| 2026-02-05 | 13F | Atria Investments Llc | 5.478 | -5,36 | 2.312 | 5,86 | ||||
| 2026-02-17 | 13F | Science & Technology Partners, L.P. | 3.800 | 1.604 | ||||||
| 2025-11-14 | 13F | Elequin Capital Lp | Call | 0 | -100,00 | 0 | ||||
| 2026-02-12 | 13F | UniSuper Management Pty Ltd | 53.800 | 22,27 | 22.705 | 36,79 | ||||
| 2026-02-10 | 13F | Commonwealth Of Pennsylvania Public School Empls Retrmt Sys | 32.896 | 13.883 | ||||||
| 2026-01-20 | 13F | Independence Bank of Kentucky | 3 | 1 | ||||||
| 2026-02-05 | 13F | High Note Wealth, LLC | 5 | 2 | ||||||
| 2026-02-11 | 13F | Zions Bancorporation, National Association /ut/ | 202 | -45,41 | 85 | -38,85 | ||||
| 2026-02-17 | 13F | Private Advisor Group, LLC | 18.989 | -15,31 | 8.014 | -5,26 | ||||
| 2026-02-06 | 13F | Vestmark Advisory Solutions, Inc. | 7.579 | 402,92 | 3.198 | 463,03 | ||||
| 2026-02-17 | 13F | XTX Topco Ltd | 6.251 | 2.638 | ||||||
| 2025-11-14 | 13F | Beck Bode, LLC | 0 | -100,00 | 0 | -100,00 | ||||
| 2026-01-29 | 13F | Calamos Advisors LLC | 7.805 | 0,00 | 3.294 | 11,85 | ||||
| 2026-02-17 | 13F | Citadel Advisors Llc | Call | 4.494.100 | 10,37 | 1.896.600 | 23,47 | |||
| 2026-02-17 | 13F | Citadel Advisors Llc | 31.511 | 46,37 | 13.298 | 63,75 | ||||
| 2026-03-06 | 13F | Hsbc Holdings Plc | 221.727 | 239,57 | 93.748 | 280,20 | ||||
| 2026-02-13 | 13F | Advyzon Investment Management, LLC | 968 | -1,83 | 409 | 9,97 | ||||
| 2025-11-12 | 13F | Headlands Technologies LLC | 0 | -100,00 | 0 | -100,00 | ||||
| 2026-02-09 | 13F | Jackson Creek Investment Advisors LLC | 4.572 | -0,13 | 2 | 0,00 | ||||
| 2026-02-17 | 13F | Advisor Group Holdings, Inc. | Put | 1 | 0,00 | 4 | -25,00 | |||
| 2026-02-20 | 13F | Kovitz Investment Group Partners, LLC | 0 | -100,00 | 0 | |||||
| 2026-01-29 | 13F | Teachers Retirement System Of The State Of Kentucky | 11.000 | 5 | ||||||
| 2026-02-17 | 13F | Electron Capital Partners, LLC | 90.864 | 38.346 | ||||||
| 2026-02-14 | 13F | POM Investment Strategies, LLC | 4 | 2 | ||||||
| 2025-11-07 | 13F | Gsa Capital Partners Llp | 0 | -100,00 | 0 | |||||
| 2026-01-15 | 13F | Private Advisory Group LLC | 0 | -100,00 | 0 | |||||
| 2026-02-17 | 13F | Russell Investments Group, Ltd. | 107.362 | 8,41 | 45.404 | 20,86 | ||||
| 2026-01-20 | 13F | Cigna Investments Inc /new | 1.282 | 0,00 | 1 | |||||
| 2026-02-09 | 13F | Fidelis Capital Partners, LLC | 1.057 | -5,20 | 446 | 6,19 | ||||
| 2026-02-24 | 13F/A | Pacer Advisors, Inc. | 11.300 | 3.355,66 | 4.769 | 3.776,42 | ||||
| 2026-04-16 | 13F | Annex Advisory Services, LLC | 2.104 | 4,78 | 661 | -21,96 | ||||
| 2026-01-26 | 13F | Whittier Trust Co Of Nevada Inc | 43 | -15,69 | 19 | -5,26 | ||||
| 2026-01-27 | 13F | Prakash Investment Advisors Llc | 6.650 | -9,15 | 2.806 | 1,63 | ||||
| 2026-02-11 | 13F | GW&K Investment Management, LLC | 138 | 155,56 | 0 | |||||
| 2026-02-17 | 13F | Citadel Advisors Llc | Put | 2.717.200 | 119,93 | 1.146.713 | 146,03 | |||
| 2026-04-09 | 13F | IFG Advisors, LLC | 0 | -100,00 | 0 | |||||
| 2026-04-15 | 13F | Tema Etfs Llc | 2.526 | 10,98 | 794 | -17,29 | ||||
| 2025-11-13 | 13F | FORA Capital, LLC | 0 | -100,00 | 0 | -100,00 | ||||
| 2025-11-17 | 13F | Sender Co & Partners, Inc. | 0 | -100,00 | 0 | -100,00 | ||||
| 2026-02-17 | 13F | Driehaus Capital Management Llc | 226.963 | -28,61 | 95.783 | -20,13 | ||||
| 2026-02-13 | 13F | Royal London Asset Management Ltd | 57.805 | -0,50 | 24.395 | 11,31 | ||||
| 2026-02-04 | 13F | Securian Asset Management, Inc | 3.846 | 1.623 | ||||||
| 2026-02-18 | 13F | Achmea Investment Management B.V. | 0 | -100,00 | 0 | -100,00 | ||||
| 2026-02-05 | 13F | Wakefield Asset Management LLLP | 5.588 | -0,59 | 2.358 | 11,23 | ||||
| 2026-02-23 | 13F | Beaird Harris Wealth Management, LLC | 8 | 0,00 | 3 | 50,00 | ||||
| 2026-02-09 | 13F | Kingsview Wealth Management, LLC | 4.576 | -0,85 | 1.931 | 10,98 | ||||
| 2026-02-12 | 13F | Wagner Wealth Management, Corp | 888 | 375 | ||||||
| 2026-02-17 | 13F | Styrax Capital, LP | 225.272 | -26,62 | 95.069 | -17,91 | ||||
| 2026-02-17 | 13F | Hampton Road Capital Management LP | 0 | -100,00 | 0 | |||||
| 2025-11-17 | 13F/A | Proficio Capital Partners LLC | 0 | -100,00 | 0 | -100,00 | ||||
| 2026-01-22 | 13F | Brookwood Investment Group LLC | 0 | -100,00 | 0 | -100,00 | ||||
| 2026-02-11 | 13F | Gordian Capital Singapore Pte Ltd | 300 | -25,00 | 127 | -16,00 | ||||
| 2026-02-17 | 13F | Harvest Investment Services, LLC | 5.999 | -25,35 | 2.532 | -16,50 | ||||
| 2026-02-13 | 13F | Mariner, LLC | 544 | -94,30 | 231 | -93,61 | ||||
| 2026-02-13 | 13F | Capula Management Ltd | 3.162 | -71,49 | 1.334 | -68,11 | ||||
| 2026-02-13 | 13F | Resources Investment Advisors, LLC. | 920 | 19,48 | 388 | 33,79 | ||||
| 2026-02-09 | 13F/A | Swedbank AB | 79.390 | 3,53 | 33.504 | 15,82 | ||||
| 2026-01-28 | 13F | Barrett & Company, Inc. | 75 | 0,00 | 32 | 10,71 | ||||
| 2026-01-29 | 13F | Quadcap Wealth Management, LLC | 1.340 | -2,62 | 566 | 8,86 | ||||
| 2026-02-13 | 13F | Verition Fund Management LLC | Put | 4.100 | -68,70 | 1.730 | -64,99 | |||
| 2026-02-13 | 13F | Verition Fund Management LLC | Call | 4.600 | -50,54 | 1.941 | -44,67 | |||
| 2025-10-31 | 13F | Symphony Financial, Ltd. Co. | 0 | -100,00 | 0 | -100,00 | ||||
| 2026-02-17 | 13F | Tremblant Capital Group | 141.135 | 59.562 | ||||||
| 2026-02-12 | 13F | Marex Group plc | 6.622 | 118,40 | 2.795 | 144,44 | ||||
| 2026-02-06 | 13F | EverSource Wealth Advisors, LLC | 917 | 6,13 | 387 | 18,77 | ||||
| 2026-02-10 | 13F | Td Asset Management Inc | 171.735 | 28,34 | 72.476 | 43,58 | ||||
| 2026-02-13 | 13F | Kayne Anderson Rudnick Investment Management Llc | 9 | 0,00 | 4 | 0,00 | ||||
| 2026-02-13 | 13F | Sei Investments Co | 103.240 | -57,51 | 43.567 | -52,47 | ||||
| 2026-02-09 | 13F | Hantz Financial Services, Inc. | 155 | 43,52 | 0 | |||||
| 2026-02-10 | 13F | Connor, Clark & Lunn Investment Management Ltd. | 37.990 | -72,81 | 16.033 | -69,59 | ||||
| 2026-04-06 | 13F | GAMMA Investing LLC | 1.977 | 39,13 | 622 | 3,67 | ||||
| 2026-02-11 | 13F | Erste Asset Management GmbH | 0 | 0 | ||||||
| 2026-02-02 | 13F | Varma Mutual Pension Insurance Co | 0 | -100,00 | 0 | |||||
| 2026-02-12 | 13F | Affinity Investment Advisors, Llc | 0 | -100,00 | 0 | |||||
| 2026-02-17 | 13F | SageView Advisory Group, LLC | 481 | 203 | ||||||
| 2026-04-08 | 13F | Wealth Enhancement Trust Services, Inc. | 15 | 0,00 | 5 | -33,33 | ||||
| 2026-02-18 | 13F | Alpha Capital Advisors Inc /adv | 500 | 234 | ||||||
| 2025-11-07 | 13F | Shell Asset Management Co | 1.503 | 3,30 | 1 | |||||
| 2026-02-14 | 13F | American Trust | 620 | -38,61 | 262 | -31,50 | ||||
| 2026-02-13 | 13F | Goodnow Investment Group, Llc | 710.091 | 9,03 | 299.673 | 21,98 | ||||
| 2026-02-02 | 13F | Sachetta, LLC | 43 | 0,00 | 18 | 12,50 | ||||
| 2026-02-12 | 13F | New York State Common Retirement Fund | 69.874 | -28,10 | 29.488 | -19,56 | ||||
| 2026-02-17 | 13F | Moore Capital Management, Lp | 24.656 | -85,49 | 10.405 | -83,77 | ||||
| 2026-02-17 | 13F | Insight Wealth Partners, LLC | 2.165 | 169,28 | 914 | 201,32 | ||||
| 2026-01-22 | 13F | Bartlett & Co. Wealth Management Llc | 30 | -33,33 | 13 | -25,00 | ||||
| 2026-02-18 | 13F | VGI Partners Ltd | 5.550 | 113,46 | 2.342 | 138,98 | ||||
| 2026-02-17 | 13F | Greenoaks Capital Partners Llc | 4.235.613 | -19,53 | 1.787.513 | -9,98 | ||||
| 2025-11-14 | 13F | Massar Capital Management, LP | 0 | -100,00 | 0 | -100,00 | ||||
| 2026-02-13 | 13F | Verition Fund Management LLC | 9.645 | -56,27 | 4.070 | -51,08 | ||||
| 2026-02-09 | 13F | CBIZ Investment Advisory Services, LLC | 21 | -12,50 | 9 | -11,11 | ||||
| 2025-11-06 | 13F | Oppenheimer & Co Inc | 0 | -100,00 | 0 | -100,00 | ||||
| 2026-01-23 | 13F | Freestone Capital Holdings, LLC | 0 | -100,00 | 0 | -100,00 | ||||
| 2026-02-04 | 13F | Meridian Wealth Management, LLC | 1.672 | 0,06 | 706 | 11,90 | ||||
| 2026-02-17 | 13F | Steadfast Capital Management Lp | 87.958 | -27,72 | 37.120 | -19,14 | ||||
| 2026-01-16 | 13F | Standard Life Aberdeen plc | 33.673 | 28,30 | 14.211 | 37,89 | ||||
| 2026-02-13 | 13F | Centiva Capital, LP | Call | 7.900 | 172,41 | 3.334 | 204,94 | |||
| 2026-04-17 | 13F | CENTRAL TRUST Co | 0 | -100,00 | 0 | |||||
| 2026-02-05 | 13F | Mount Lucas Management LP | 1.782 | -1,82 | 752 | 9,94 | ||||
| 2026-02-02 | 13F | Principal Financial Group Inc | 155.858 | 2.850,18 | 65.775 | 3.201,96 | ||||
| 2026-01-28 | 13F | Arizona State Retirement System | 36.218 | 0,45 | 15.285 | 12,37 | ||||
| 2026-02-06 | 13F | GPS Wealth Strategies Group, LLC | 0 | -100,00 | 0 | -100,00 | ||||
| 2026-02-12 | 13F/A | Pinebridge Investments Llc | 739 | 312 | ||||||
| 2026-02-13 | 13F | National Bank Of Canada /fi/ | Call | 400 | 16.881 | |||||
| 2026-02-13 | 13F | Centiva Capital, LP | Put | 16.700 | 0,00 | 7.048 | 11,87 | |||
| 2026-02-17 | 13F | Price T Rowe Associates Inc /md/ | 17.726.838 | 8,63 | 7.481 | 21,52 | ||||
| 2025-11-13 | 13F | Fuller & Thaler Asset Management, Inc. | 0 | -100,00 | 0 | -100,00 | ||||
| 2026-02-17 | 13F | Davidson Kempner Capital Management Lp | 131.750 | -13,18 | 55.601 | -2,87 | ||||
| 2026-02-14 | 13F | Rockefeller Capital Management L.P. | 2.588 | 26,00 | 1.092 | 40,90 | ||||
| 2026-04-15 | 13F | Valley National Advisers Inc | 27 | -10,00 | 0 | |||||
| 2026-02-05 | 13F | iA Global Asset Management Inc. | 0 | -100,00 | 0 | -100,00 | ||||
| 2026-04-17 | 13F | Krilogy Financial LLC | 0 | -100,00 | 0 | |||||
| 2026-02-02 | 13F | Wolverine Asset Management Llc | 3.600 | 0,00 | 1.519 | 11,86 | ||||
| 2026-02-17 | 13F | NorthRock Partners, LLC | 815 | 344 | ||||||
| 2026-02-10 | 13F | Natixis Advisors, L.p. | 152.017 | 11,42 | 64 | 25,49 | ||||
| 2026-04-07 | 13F | Retirement Wealth Solutions LLC | 20 | -13,04 | 6 | -33,33 | ||||
| 2026-02-10 | 13F | CIBC World Markets Inc. | 0 | -100,00 | 0 | |||||
| 2026-02-04 | 13F | Advisor OS, LLC | 533 | 225 | ||||||
| 2025-11-04 | 13F | Privium Fund Management B.V. | 0 | -100,00 | 0 | -100,00 | ||||
| 2025-11-14 | 13F | PineBridge Investments, L.P. | 1.069 | 403 | ||||||
| 2026-02-05 | 13F | New York Life Investment Management Llc | 19.337 | 8.161 | ||||||
| 2026-01-29 | 13F | Focused Wealth Management, Inc | Call | 0 | -100,00 | 0 | -100,00 | |||
| 2026-01-26 | 13F | Private Trust Co Na | 9 | -25,00 | 4 | -25,00 | ||||
| 2026-02-17 | 13F | RDST Capital LLC | 122.262 | 14,05 | 51.597 | 27,58 | ||||
| 2026-02-05 | 13F | Cambridge Investment Research Advisors, Inc. | 6.431 | 18,22 | 3 | 0,00 | ||||
| 2026-04-23 | 13F | Ewa, Llc | 971 | -9,76 | 305 | -32,82 | ||||
| 2026-02-10 | 13F | Mutual Of America Capital Management Llc | 15.181 | 6.407 | ||||||
| 2026-02-17 | 13F | Quantitative Investment Management, LLC | 38.322 | 16 | ||||||
| 2026-04-07 | 13F | Central Pacific Bank - Trust Division | 1.963 | 0,00 | 617 | -25,48 | ||||
| 2026-04-14 | 13F | Nbc Securities, Inc. | 12 | 0,00 | 4 | -40,00 | ||||
| 2026-01-12 | 13F | Lee Johnson Capital Management, Llc | 0 | -100,00 | 0 | -100,00 | ||||
| 2025-11-14 | 13F | Point72 Europe (London) LLP | 863 | 325 | ||||||
| 2025-11-14 | 13F | Nomura Holdings Inc | Call | 0 | -100,00 | 0 | -100,00 | |||
| 2026-02-17 | 13F | Lighthouse Investment Partners, LLC | 0 | -100,00 | 0 | -100,00 | ||||
| 2026-04-24 | 13F | CHICAGO TRUST Co NA | 0 | -100,00 | 0 | |||||
| 2026-02-17 | 13F | Jones Financial Companies Lllp | 5.012 | 22,30 | 2.115 | 39,79 | ||||
| 2026-01-28 | 13F | DekaBank Deutsche Girozentrale | 1.486 | 0,00 | 0 | |||||
| 2026-02-09 | 13F | Hartland & Co., LLC | 415 | 5.828,57 | 175 | 8.650,00 | ||||
| 2026-02-17 | 13F/A | Kovack Advisors, Inc. | 1.514 | 639 | ||||||
| 2026-02-17 | 13F | Vinva Investment Management Ltd | 0 | -100,00 | 0 | |||||
| 2025-11-14 | 13F | Concentric Capital Strategies, LP | 0 | -100,00 | 0 | -100,00 | ||||
| 2026-02-12 | 13F | APG Asset Management N.V. | 70.400 | 25.297 | ||||||
| 2026-02-13 | 13F | Seneschal Advisors, LLC | 2 | 0,00 | 1 | |||||
| 2026-02-13 | 13F | National Bank Of Canada /fi/ | Put | 440 | 18.569 | |||||
| 2026-02-10 | 13F | Dynasty Wealth Management, Llc | 646 | -23,19 | 273 | -14,20 | ||||
| 2026-02-17 | 13F | Cannell Capital Llc | Put | 109 | 4.600 | |||||
| 2026-04-22 | 13F | Patton Fund Management, Inc. | 8.090 | 1.373,59 | 2.543 | 1.000,87 | ||||
| 2026-02-02 | 13F | Cornerstone Planning Group LLC | 45 | 18,42 | 18 | 63,64 | ||||
| 2026-02-17 | 13F | Point72 Asset Management, L.P. | 8.822 | -98,40 | 3.723 | -98,21 | ||||
| 2026-04-24 | 13F | Root Financial Partners, LLC | 289 | 114,07 | 91 | 60,71 | ||||
| 2026-01-23 | 13F | Rsm Us Wealth Management Llc | 1.579 | -28,68 | 678 | -18,80 | ||||
| 2026-02-17 | 13F | Point72 Asset Management, L.P. | Put | 97.600 | 550,67 | 41.189 | 627,98 | |||
| 2026-02-17 | 13F | Point72 Asset Management, L.P. | Call | 23.600 | 3,06 | 9.960 | 15,29 | |||
| 2026-02-13 | 13F | Umb Bank N A/mo | 521 | 45,94 | 220 | 63,43 | ||||
| 2026-02-13 | 13F | Lifeworks Advisors, LLC | 672 | 0,00 | 284 | 11,86 | ||||
| 2025-11-14 | 13F | Imprint Wealth LLC | 0 | -100,00 | 0 | -100,00 | ||||
| 2026-02-17 | 13F | Blair William & Co/il | 38.313 | -0,57 | 16.169 | 11,23 | ||||
| 2026-01-22 | 13F | Harwood Advisory Group, LLC | 6 | 0,00 | 3 | 0,00 | ||||
| 2026-02-17 | 13F | Kingdon Capital Management, L.l.c. | 0 | -100,00 | 0 | -100,00 | ||||
| 2026-02-17 | 13F | Kemnay Advisory Services Inc. | 53 | 22 | ||||||
| 2026-01-26 | 13F | Taylor Frigon Capital Management LLC | 7.838 | -19,41 | 3.308 | -9,87 | ||||
| 2026-02-13 | 13F | First Trust Advisors Lp | 474.847 | -5,38 | 200.395 | 5,85 | ||||
| 2026-02-17 | 13F | Laird Norton Trust Company, Llc | 2.055 | 867 | ||||||
| 2025-11-13 | 13F | West Michigan Advisors, Llc | 0 | -100,00 | 0 | -100,00 | ||||
| 2026-01-28 | 13F | Legacy Capital Group California, Inc. | 4.445 | -1,09 | 1.876 | 10,62 | ||||
| 2026-02-11 | 13F | Rise Advisors, LLC | 0 | -100,00 | 0 | |||||
| 2026-02-12 | 13F | Great Valley Advisor Group, Inc. | 10.709 | 1,32 | 4.519 | 13,34 | ||||
| 2026-02-13 | 13F | Victory Capital Management Inc | 42.916 | 4,41 | 18.111 | 16,80 | ||||
| 2026-04-08 | 13F | Arlington Trust Co LLC | 4 | 300,00 | 1 | |||||
| 2026-02-10 | 13F | Main Management ETF Advisors, LLC | 5.481 | 1,03 | 2 | 0,00 | ||||
| 2025-11-14 | 13F | Capula Management Ltd | Put | 0 | -100,00 | 0 | -100,00 | |||
| 2026-02-04 | 13F | Plato Investment Management Ltd | 1.048 | -72,03 | 444 | -68,33 | ||||
| 2026-02-17 | 13F | Avala Global LP | 214.136 | 11,68 | 90.370 | 24,94 | ||||
| 2026-02-09 | 13F | Annis Gardner Whiting Capital Advisors, LLC | 38 | 16 | ||||||
| 2025-11-12 | 13F | Okabena Investment Services Inc | 0 | -100,00 | 0 | |||||
| 2026-02-13 | 13F | Clear Street Group Inc. | 1.312 | -65,56 | 2.242 | 55,95 | ||||
| 2026-02-17 | 13F | Dauntless Investment Group, LLC | Put | 4.900 | 2.068 | |||||
| 2026-02-17 | 13F | Pinnacle Financial Partners, Inc. | 747 | 315 | ||||||
| 2026-01-30 | 13F | Bogart Wealth, LLC | 4 | -20,00 | 2 | 0,00 | ||||
| 2026-04-23 | 13F | SMART Wealth LLC | 2.828 | 278,07 | 889 | 182,22 | ||||
| 2026-02-12 | 13F | Aristides Capital LLC | Put | 33.700 | 0,00 | 14.222 | 11,88 | |||
| 2026-02-12 | 13F | Bank Of Montreal /can/ | Put | 0 | -100,00 | 0 | -100,00 | |||
| 2026-02-12 | 13F | Aviva Plc | 109.481 | 13,17 | 46.203 | 26,61 | ||||
| 2026-02-10 | 13F | Smith Group Asset Management, LLC | 3.560 | -14,73 | 1.502 | -4,57 | ||||
| 2025-11-14 | 13F | J. Goldman & Co LP | Put | 0 | -100,00 | 0 | -100,00 | |||
| 2026-01-20 | 13F | Wall Street Access Asset Management, LLC | 0 | -100,00 | 0 | |||||
| 2026-02-04 | 13F | LRI Investments, LLC | 241 | -14,23 | 102 | -4,72 | ||||
| 2026-04-16 | 13F | E. Ohman J:or Asset Management AB | 4.200 | 2,44 | 1.320 | -23,70 | ||||
| 2026-02-06 | 13F | Steadview Capital Management LLC | 286.575 | -7,43 | 120.940 | 3,56 | ||||
| 2026-04-17 | 13F | RFG Advisory, LLC | 962 | 302 | ||||||
| 2026-04-23 | 13F | American National Bank | 5 | -50,00 | 2 | -75,00 | ||||
| 2026-02-13 | 13F | Stifel Financial Corp | 15.168 | 0,52 | 6.401 | 12,46 | ||||
| 2026-02-09 | 13F | Huntington National Bank | 98 | 5,38 | 41 | 17,14 | ||||
| 2026-02-17 | 13F | Fairscale Capital, LLC | 11 | 0,00 | 5 | 0,00 | ||||
| 2026-02-13 | 13F | Gts Securities Llc | 1.267 | 535 | ||||||
| 2026-02-13 | 13F | MAI Capital Management | 987 | -27,64 | 417 | -19,07 | ||||
| 2025-11-14 | 13F | Point72 (DIFC) Ltd | Put | 0 | -100,00 | 0 | -100,00 | |||
| 2025-11-14 | 13F | Axa S.a. | 0 | -100,00 | 0 | |||||
| 2026-02-09 | 13F | Studio Investment Management Llc | 862 | 0,00 | 364 | 11,69 | ||||
| 2026-01-22 | 13F | Westbourne Investments, Inc. | 500 | 211 | ||||||
| 2026-04-09 | 13F | Everhart Financial Group, Inc. | 715 | 21,39 | 225 | -9,68 | ||||
| 2026-02-13 | 13F | Walleye Capital LLC | Put | 13.300 | -41,92 | 5.613 | -35,03 | |||
| 2026-02-13 | 13F | Walleye Capital LLC | 6.207 | 2.443,85 | 2.619 | 2.746,74 | ||||
| 2026-02-13 | 13F | Walleye Capital LLC | Call | 13.700 | -3,52 | 5.782 | 7,94 | |||
| 2026-02-13 | 13F | Rhumbline Advisers | 266.523 | 53,22 | 112.478 | 71,41 | ||||
| 2026-01-29 | 13F | Comerica Bank | 13.413 | 361,40 | 5.660 | 416,42 | ||||
| 2026-04-06 | 13F | CX Institutional | 239 | 291,80 | 0 | |||||
| 2026-02-06 | 13F | BloombergSen Inc. | 15.208 | 0,00 | 6.418 | 11,87 | ||||
| 2026-02-17 | 13F | Bayesian Capital Management, LP | 648 | 273 | ||||||
| 2026-02-09 | 13F | Allstate Corp | 9.781 | 128,10 | 4.128 | 155,23 | ||||
| 2026-02-10 | 13F | National Pension Service | 254.113 | 31,72 | 107.241 | 47,36 | ||||
| 2026-04-17 | 13F | Vermillion Wealth Management, Inc. | 7 | 2 | ||||||
| 2026-02-17 | 13F | Main Street Financial Solutions, LLC | 0 | -100,00 | 0 | |||||
| 2026-04-16 | 13F | SG Americas Securities, LLC | Call | 7.700 | -93,82 | 0 | -100,00 | |||
| 2026-04-16 | 13F | SG Americas Securities, LLC | 83.752 | -66,96 | 26 | -75,47 | ||||
| 2026-02-09 | 13F | Genus Capital Management Inc. | 2.978 | -76,23 | 1.257 | -73,42 | ||||
| 2026-04-24 | 13F | Strs Ohio | 34.833 | -0,01 | 10.951 | -25,52 | ||||
| 2026-01-30 | 13F | New York State Teachers Retirement System | 102.214 | 43 | ||||||
| 2026-02-17 | 13F | Prelude Capital Management, Llc | 1.116 | -71,09 | 471 | -67,72 | ||||
| 2026-02-11 | 13F | Ameritas Investment Partners, Inc. | 1.266 | 534 | ||||||
| 2026-02-17 | 13F | Crawford Fund Management, LLC | Put | 6.800 | 54,55 | 2.870 | 72,94 | |||
| 2026-02-09 | 13F | Jefferies Financial Group Inc. | Put | 53.000 | 22.367 | |||||
| 2026-02-09 | 13F | Berkshire Capital Holdings Inc | 10 | -99,96 | 4 | -99,96 | ||||
| 2026-02-11 | 13F | Capital Research Global Investors | 5.700.953 | 42,89 | 2.405.959 | 59,84 | ||||
| 2025-11-14 | 13F | Symmetry Investments LP | Call | 0 | -100,00 | 0 | -100,00 | |||
| 2026-02-09 | 13F | Jefferies Financial Group Inc. | 53.633 | 1.711,31 | 22.634 | 1.926,32 | ||||
| 2026-02-12 | 13F | Callan Family Office, LLC | 2.981 | 16,13 | 1.258 | 29,96 | ||||
| 2026-02-03 | 13F | Carlson Capital L P | Put | 7.000 | 2.954 | |||||
| 2026-02-10 | 13F | Tidemark, LLC | 113 | 0,00 | 48 | 11,90 | ||||
| 2026-02-09 | 13F | Harbour Investments, Inc. | 173 | -19,91 | 73 | -9,88 | ||||
| 2026-04-23 | 13F | North Star Investment Management Corp. | 2 | -83,33 | 1 | -100,00 | ||||
| 2026-02-17 | 13F | Symmetry Investments LP | Put | 0 | -100,00 | 0 | ||||
| 2026-02-17 | 13F | Symmetry Investments LP | 0 | -100,00 | 0 | |||||
| 2026-01-29 | 13F | UBS Group AG | 660.079 | 227,35 | 278.567 | 266,21 | ||||
| 2026-01-28 | 13F | Fiduciary Wealth Partners, LLC | 538 | 227 | ||||||
| 2026-02-13 | 13F | Scge Management, L.p. | 208.000 | 37,75 | 87.780 | 54,10 | ||||
| 2026-01-27 | 13F | Evergreen Capital Management Llc | 2.114 | 189,99 | 892 | 224,36 | ||||
| 2026-02-17 | 13F | Caption Management, LLC | Put | 335.400 | -43,34 | 141.546 | -36,61 | |||
| 2026-04-16 | 13F | Diversified Trust Co | 1.824 | -13,68 | 573 | -35,69 | ||||
| 2026-02-17 | 13F | Caption Management, LLC | Call | 646.800 | -7,99 | 272.963 | 2,93 | |||
| 2026-02-09 | 13F | Bellwether Advisors, LLC | 7.634 | -30,10 | 3.222 | -21,82 | ||||
| 2026-04-23 | 13F | J.w. Cole Advisors, Inc. | 0 | -100,00 | 0 | |||||
| 2026-01-29 | 13F | Warren Street Wealth Advisors, LLC | 0 | -100,00 | 0 | |||||
| 2026-04-23 | 13F | SJS Investment Consulting Inc. | 183 | 29,79 | 58 | -3,39 | ||||
| 2026-04-15 | 13F | Hartford Investment Management Co | 8.061 | -1,19 | 2.534 | -26,38 | ||||
| 2026-01-30 | 13F/A | M&t Bank Corp | 18.033 | 10,89 | 7.610 | 24,06 | ||||
| 2026-02-06 | 13F | Pnc Financial Services Group, Inc. | 4.748 | 66,36 | 2.004 | 86,15 | ||||
| 2026-02-17 | 13F | Engle Capital Management, L.P. | 6.000 | -86,19 | 2.532 | -84,55 | ||||
| 2026-02-06 | 13F | Tortoise Investment Management, LLC | Put | 0 | -100,00 | 0 | ||||
| 2026-02-10 | 13F | Kentucky Retirement Systems Insurance Trust Fund | 3.473 | 0,00 | 1.466 | 11,83 | ||||
| 2026-03-12 | 13F/A | Peak6 Llc | Call | 225.600 | -31,16 | 95.208 | -22,98 | |||
| 2026-02-12 | 13F | Great Lakes Advisors, Llc | 3.090 | -3,29 | 1.304 | 8,22 | ||||
| 2026-02-17 | 13F | Fmr Llc | 5.961.989 | 4,33 | 2.516.078 | 16,72 | ||||
| 2026-03-12 | 13F/A | Peak6 Llc | Put | 233.900 | 46,74 | 98.710 | 64,16 | |||
| 2026-02-03 | 13F | Ballentine Partners, LLC | 1.261 | -3,15 | 532 | 8,35 | ||||
| 2026-04-07 | 13F | Farther Finance Advisors, LLC | 7.455 | 13,50 | 2.327 | -16,06 | ||||
| 2026-02-17 | 13F | Polar Asset Management Partners Inc. | 0 | -100,00 | 0 | -100,00 | ||||
| 2026-01-29 | 13F | UBS Group AG | Put | 10.900 | -61,21 | 4.600 | -56,60 | |||
| 2026-01-29 | 13F | UBS Group AG | Call | 36.000 | -88,52 | 15.193 | -87,15 | |||
| 2026-02-17 | 13F | Canada Pension Plan Investment Board | 184.978 | 13,05 | 78.064 | 26,46 | ||||
| 2026-02-13 | 13F | Change Path, LLC | 703 | -12,34 | 297 | -1,99 | ||||
| 2026-02-20 | 13F | Sunbelt Securities, Inc. | 0 | -100,00 | 0 | |||||
| 2026-02-13 | 13F | Bornite Capital Management LP | 0 | -100,00 | 0 | |||||
| 2026-01-26 | 13F | KBC Group NV | 202.714 | -37,02 | 86 | -29,75 | ||||
| 2026-02-13 | 13F | National Bank Of Canada /fi/ | 95.938 | 8.693,58 | 40.486 | 9.750,61 | ||||
| 2026-02-10 | 13F | Globeflex Capital L P | 0 | -100,00 | 0 | |||||
| 2026-04-20 | 13F | Cardinal Point Capital Management, ULC | 0 | -100,00 | 0 | |||||
| 2026-02-13 | 13F | Bank Of Nova Scotia | 20.459 | 276,71 | 8.634 | 321,58 | ||||
| 2026-02-17 | 13F | Anson Funds Management LP | 1.000 | 422 | ||||||
| 2025-11-12 | 13F | Mach-1 Financial Group, Inc. | 0 | -100,00 | 0 | -100,00 | ||||
| 2026-02-10 | 13F/A | Northwestern Mutual Wealth Management Co | 1.839 | 9,73 | 776 | 22,78 | ||||
| 2026-02-17 | 13F | National Asset Management, Inc. | 779 | 1,70 | 329 | 13,89 | ||||
| 2026-02-11 | 13F | Jpmorgan Chase & Co | 6.130.229 | -4,09 | 2.587.080 | 7,30 | ||||
| 2026-02-11 | 13F | Jpmorgan Chase & Co | Call | 35.000 | 250,00 | 14.771 | 291,57 | |||
| 2026-02-17 | 13F | Amundi | 497.140 | -39,93 | 209.803 | -31,41 | ||||
| 2026-02-10 | 13F | Private Wealth Asset Management, LLC | 166 | 0,00 | 70 | 12,90 | ||||
| 2026-02-11 | 13F | Jpmorgan Chase & Co | Put | 116.500 | 0,00 | 49.165 | 11,87 | |||
| 2026-02-05 | 13F | Baader Bank INC | 0 | -100,00 | 0 | |||||
| 2026-02-17 | 13F | Viking Global Investors Lp | 1.061.533 | -49,48 | 447.988 | -43,48 | ||||
| 2026-02-17 | 13F | Lone Pine Capital Llc | 1.779.328 | 0,80 | 750.912 | 12,76 | ||||
| 2026-04-10 | 13F | Oak Thistle LLC | 0 | -100,00 | 0 | |||||
| 2026-02-11 | 13F | Arsenal Capital Advisors LLC | 651 | 275 | ||||||
| 2026-02-03 | 13F/A | Bank Of America Corp /de/ | Put | 0 | -100,00 | 0 | -100,00 | |||
| 2025-11-10 | 13F | Semanteon Capital Management, LP | 0 | -100,00 | 0 | -100,00 | ||||
| 2026-01-22 | 13F | Massachusetts Financial Services Co /ma/ | 817.775 | 28,29 | 345.117 | 43,51 | ||||
| 2026-02-09 | 13F | Arista Wealth Management, LLC | 0 | -100,00 | 0 | |||||
| 2026-02-05 | 13F | North Dakota State Investment Board | 4.647 | 1.961 | ||||||
| 2026-02-17 | 13F | Sherman Porfolios, Llc | 0 | -100,00 | 0 | -100,00 | ||||
| 2026-02-11 | 13F | LPL Financial LLC | 93.398 | 14,03 | 39.416 | 27,57 | ||||
| 2026-04-22 | 13F | Portus Wealth Advisors, LLC | 2 | 1 | ||||||
| 2026-04-16 | 13F | Allegheny Financial Group LTD | 1.545 | -11,31 | 486 | -34,01 | ||||
| 2026-04-24 | 13F | Sumitomo Mitsui DS Asset Management Company, Ltd | 18.037 | 1,15 | 5.670 | -24,65 | ||||
| 2026-01-15 | 13F | Polianta Ltd | 0 | -100,00 | 0 | -100,00 | ||||
| 2026-04-24 | 13F | Keybank National Association/oh | 5.498 | -3,61 | 1.728 | -28,21 | ||||
| 2026-02-17 | 13F | Contour Asset Management LLC | 0 | -100,00 | 0 | |||||
| 2025-11-13 | 13F | Riggs Asset Managment Co. Inc. | 0 | -100,00 | 0 | |||||
| 2026-02-17 | 13F | Sherbrooke Park Advisers Llc | 0 | -100,00 | 0 | -100,00 | ||||
| 2025-11-10 | 13F | Options Solutions, Llc | 0 | -100,00 | 0 | -100,00 | ||||
| 2026-02-10 | 13F | CIBC Asset Management Inc | 32.947 | 520,12 | 13.904 | 593,81 | ||||
| 2026-02-13 | 13F | Brown Advisory Inc | 5.148 | -6,96 | 2.173 | 4,07 | ||||
| 2026-04-15 | 13F | Bayforest Capital Ltd | 420 | 202,16 | 132 | 127,59 | ||||
| 2026-01-20 | 13F | Sheets Smith Wealth Management | 0 | -100,00 | 0 | |||||
| 2026-02-13 | 13F | Quarry LP | 89 | -92,43 | 38 | -91,65 | ||||
| 2026-01-27 | 13F | Asset Management One Co., Ltd. | 55.353 | 22,51 | 23.988 | 40,73 | ||||
| 2026-01-07 | 13F | Cahaba Wealth Management, Inc. | 492 | 208 | ||||||
| 2026-02-12 | 13F | Renaissance Technologies Llc | 1.407.398 | 38,92 | 593.950 | 55,41 | ||||
| 2026-02-12 | 13F | Brinker Capital Investments, LLC | 3.540 | -39,58 | 1.494 | -32,44 | ||||
| 2026-02-12 | 13F | Alps Advisors Inc | 1.264 | 0,32 | 533 | 12,21 | ||||
| 2026-02-17 | 13F | Aquatic Capital Management LLC | 0 | -100,00 | 0 | |||||
| 2025-11-14 | 13F | Cubist Systematic Strategies, LLC | 0 | -100,00 | 0 | -100,00 | ||||
| 2026-02-13 | 13F | 1832 Asset Management L.P. | 314.050 | -39,54 | 132.535 | -32,37 | ||||
| 2026-02-09 | 13F | Optimize Financial Inc | 1.631 | 1,24 | 688 | 13,34 | ||||
| 2026-02-06 | 13F | Cullen/frost Bankers, Inc. | 372 | -1,59 | 157 | 9,86 | ||||
| 2026-02-17 | 13F | Bank Of America Corp /de/ | Call | 0 | -100,00 | 0 | -100,00 | |||
| 2026-04-23 | 13F | TFC Financial Management | 1.732 | -2,75 | 545 | -27,56 | ||||
| 2026-02-04 | 13F | Dogwood Wealth Management LLC | 14 | 250,00 | 6 | 400,00 | ||||
| 2026-02-17 | 13F | Tabor Asset Management, LP | 5.540 | 4,63 | 2.338 | 17,03 | ||||
| 2026-03-03 | 13F | NWF Advisory Services Inc. | 1.695 | 16,90 | 715 | 30,95 | ||||
| 2026-02-17 | 13F | Susquehanna International Group, Llp | 21.265 | -85,25 | 8.974 | -83,50 | ||||
| 2026-02-13 | 13F | Osmosis Investment Management UK Ltd | 1.238 | 522 | ||||||
| 2025-11-12 | 13F | Transce3nd, LLC | 0 | -100,00 | 0 | -100,00 | ||||
| 2026-04-13 | 13F | GoalVest Advisory LLC | 100 | 0,00 | 31 | -26,19 | ||||
| 2026-02-09 | 13F | Employees Retirement System of Texas | 1.401 | 24,09 | 1 | |||||
| 2026-01-29 | 13F | DecisionPoint Financial, LLC | 2 | 0,00 | 1 | |||||
| 2026-02-11 | 13F | Los Angeles Capital Management Llc | 219.680 | 31,35 | 67.018 | 6,22 | ||||
| 2026-01-26 | 13F | Consolidated Portfolio Review Corp | 0 | -100,00 | 0 | |||||
| 2026-02-17 | 13F | United Capital Financial Advisers, Llc | 2.478 | 5,09 | 1.046 | 17,55 | ||||
| 2026-04-20 | 13F | TFB Advisors LLC | 0 | -100,00 | 0 | |||||
| 2026-02-11 | 13F | Hughes Financial Services, LLC | 20 | 0,00 | 8 | 33,33 | ||||
| 2026-02-13 | 13F | Cynosure Management, Llc | 1.257 | 530 | ||||||
| 2026-02-17 | 13F | Morgens Waterfall Vintiadis & Co Inc | 15.000 | 0,00 | 6.330 | 11,88 | ||||
| 2026-02-17 | 13F | Wiley Bros.-aintree Capital, Llc | 4.194 | -0,76 | 1.773 | 11,23 | ||||
| 2026-04-15 | 13F | DAVENPORT & Co LLC | 1.393 | 32,54 | 438 | -1,35 | ||||
| 2026-02-13 | 13F | Smartleaf Asset Management LLC | 1.060 | 9,84 | 455 | 20,37 | ||||
| 2026-02-18 | 13F | Ctc Llc | Call | 861 | -47,47 | 36.336 | -41,23 | |||
| 2026-02-12 | 13F | Brown Brothers Harriman & Co | 368 | 1.015,15 | 155 | 1.191,67 | ||||
| 2026-04-21 | 13F | Nemes Rush Group LLC | 13.251 | -0,13 | 4.166 | -25,61 | ||||
| 2026-02-18 | 13F | Ctc Llc | Put | 763 | -42,37 | 32.200 | -35,53 | |||
| 2026-02-05 | 13F | DnB Asset Management AS | 25.174 | 8,71 | 10.624 | 21,61 | ||||
| 2026-02-13 | 13F | Parkside Financial Bank & Trust | 262 | -13,53 | 111 | -3,51 | ||||
| 2026-02-05 | 13F | Thrivent Financial For Lutherans | 7.928 | 143,79 | 3 | 200,00 | ||||
| 2026-01-28 | 13F | HB Wealth Management, LLC | 3.190 | 0,98 | 1.346 | 13,01 | ||||
| 2026-02-09 | 13F | Diversified Portfolios, Inc. | 2.775 | 2,02 | 1.171 | 14,13 | ||||
| 2026-01-12 | 13F | CVA Family Office, LLC | 56 | -5,08 | 24 | 4,55 | ||||
| 2026-02-13 | 13F | OMERS ADMINISTRATION Corp | 9.623 | 8,67 | 4.061 | 21,59 | ||||
| 2026-04-20 | 13F | Ritholtz Wealth Management | 1.567 | 0,38 | 493 | -25,23 | ||||
| 2026-04-24 | 13F | UMA Financial Services, Inc. | 45 | -8,16 | 14 | -30,00 | ||||
| 2026-01-30 | 13F | Kondo Wealth Advisors, Inc. | 3.833 | 2,49 | 1.618 | 14,68 | ||||
| 2026-04-22 | 13F | Spire Wealth Management | 3 | -99,34 | 1 | -100,00 | ||||
| 2026-04-22 | 13F | Apollon Wealth Management, LLC | 714 | 224 | ||||||
| 2026-01-28 | 13F/A | TABR Capital Management, LLC | 630 | 266 | ||||||
| 2026-02-12 | 13F | Banco BTG Pactual S.A. | 651 | 275 | ||||||
| 2026-02-13 | 13F | Next Century Growth Investors Llc | 5.604 | 0,23 | 2.365 | 12,14 | ||||
| 2026-02-10 | 13F | United Super Pty Ltd in its capacity as Trustee for the Construction & Building Unions Superannuation Fund | 3.160 | 1.334 | ||||||
| 2026-02-17 | 13F | Adage Capital Partners Gp, L.l.c. | 127.700 | 53.892 | ||||||
| 2026-01-29 | 13F | IMC-Chicago, LLC | Put | 1.563.700 | 51,23 | 659.913 | 69,18 | |||
| 2026-02-17 | 13F | Gilder Gagnon Howe & Co Llc | 2.004 | 7,57 | 846 | 20,37 | ||||
| 2026-01-29 | 13F | IMC-Chicago, LLC | Call | 1.796.800 | 19,38 | 758.286 | 33,55 | |||
| 2026-02-10 | 13F | Bridges Investment Management Inc | 1.548 | 38,34 | 653 | 54,74 | ||||
| 2026-02-17 | 13F | Howard Hughes Medical Institute | 30 | 13 | ||||||
| 2026-03-04 | 13F | AG Campbell Advisory, LLC | 755 | 319 | ||||||
| 2025-11-14 | 13F | Sig Brokerage, Lp | 0 | -100,00 | 0 | -100,00 | ||||
| 2026-02-12 | 13F | Northwest & Ethical Investments L.P. | 1.062 | 6,20 | 456 | 16,33 | ||||
| 2026-02-17 | 13F | Advisory Services Network, LLC | 1.446 | -30,48 | 610 | -22,19 | ||||
| 2026-04-13 | 13F | True Wealth Design, LLC | 13 | 0,00 | 4 | -20,00 | ||||
| 2025-11-04 | 13F | Guerra Advisors Inc | 5 | 2 | ||||||
| 2026-02-12 | 13F | Marex Group plc | Put | 1.100 | -52,17 | 464 | -46,48 | |||
| 2026-02-02 | 13F | Breakwater Investment Management | 0 | -100,00 | 0 | |||||
| 2026-02-11 | 13F | CNB Bank | 3 | 0,00 | 1 | 0,00 | ||||
| 2025-11-14 | 13F | Point72 (DIFC) Ltd | Call | 0 | -100,00 | 0 | -100,00 | |||
| 2026-04-10 | 13F | Abound Wealth Management | 26 | 0,00 | 8 | -20,00 | ||||
| 2026-02-17 | 13F | Newlands Management Operations LLC | 0 | -100,00 | 0 | |||||
| 2026-02-13 | 13F | Walleye Trading LLC | Put | 164.800 | 103,96 | 69.549 | 128,18 | |||
| 2026-02-03 | 13F | Encompass More Asset Management | 2.742 | 1,86 | 1.157 | 13,99 | ||||
| 2026-04-09 | 13F | Wedmont Private Capital | 2.212 | 17,04 | 749 | -11,99 | ||||
| 2026-02-06 | 13F | GLOBALT Investments LLC / GA | 1.866 | -6,89 | 787 | 4,24 | ||||
| 2026-04-21 | 13F | Robeco Institutional Asset Management B.V. | 12.540 | -6,36 | 3.942 | -30,24 | ||||
| 2026-02-17 | 13F | Scopus Asset Management, L.p. | Call | 70.000 | -72,00 | 29.541 | -68,68 | |||
| 2025-11-12 | 13F | Empirical Asset Management, LLC | 0 | -100,00 | 0 | |||||
| 2026-02-13 | 13F | Citigroup Inc | 210.305 | 8,05 | 88.753 | 20,88 | ||||
| 2026-04-10 | 13F | Brucke Financial, Inc. | 1.168 | -25,65 | 367 | -44,56 | ||||
| 2026-02-13 | 13F | Citigroup Inc | Call | 53.000 | 9,28 | 22.367 | 22,25 | |||
| 2026-04-23 | 13F | Phraction Management LLC | 0 | -100,00 | 0 | |||||
| 2026-02-03 | 13F | Everence Capital Management Inc | 4.400 | 0,00 | 2 | 0,00 | ||||
| 2026-02-10 | 13F | Acadian Asset Management Llc | 455 | -96,95 | 0 | -100,00 | ||||
| 2026-02-17 | 13F | No Street GP LP | 239.500 | -18,95 | 101.074 | -9,33 | ||||
| 2026-04-20 | 13F | LVW Advisors, LLC | 0 | -100,00 | 0 | |||||
| 2026-02-05 | 13F | Canada Post Corp Registered Pension Plan | 2.950 | 1.245 | ||||||
| 2026-02-11 | 13F | Manchester Capital Management LLC | 22 | 9 | ||||||
| 2026-02-13 | 13F | Citigroup Inc | Put | 5.833.700 | 22,56 | 2.461.938 | 37,10 | |||
| 2026-02-12 | 13F | Commonwealth Equity Services, Llc | 1.908 | -44,68 | 805 | 80.400,00 | ||||
| 2026-01-28 | 13F | B. Metzler seel. Sohn & Co. AG | 30.874 | 2,17 | 13.209 | 15,88 | ||||
| 2026-02-12 | 13F | BlackRock, Inc. | 11.717.838 | 19,36 | 4.945.162 | 33,53 | ||||
| 2026-01-21 | 13F | Prime Capital Investment Advisors, LLC | 1.283 | 52,56 | 541 | 70,66 | ||||
| 2026-02-04 | 13F | Atlantic Union Bankshares Corp | 18 | -10,00 | 8 | 0,00 | ||||
| 2026-02-17 | 13F | Captrust Financial Advisors | 3.678 | 48,07 | 1.552 | 65,81 | ||||
| 2026-02-11 | 13F | J.Safra Asset Management Corp | 3.570 | -10,46 | 1.507 | 0,13 | ||||
| 2026-04-20 | 13F | Contravisory Investment Management, Inc. | 46 | -11,54 | 14 | -33,33 | ||||
| 2026-02-17 | 13F | Investment Management Corp of Ontario | 11.576 | 102,84 | 4.885 | 127,00 | ||||
| 2026-02-13 | 13F | Aptus Capital Advisors, LLC | 592 | 250 | ||||||
| 2026-04-08 | 13F | DiNuzzo Private Wealth, Inc. | 13 | 0,00 | 4 | -20,00 | ||||
| 2026-02-13 | 13F | Keystone Investors Pte Ltd | 1.181 | 498 | ||||||
| 2026-02-09 | 13F | TRB Advisors LP | 5.465 | 2.306 | ||||||
| 2026-02-10 | 13F | Hazlett, Burt & Watson, Inc. | 10 | -50,00 | 0 | |||||
| 2026-02-11 | 13F | Financiere des Professionnels - Fonds d,investissement inc. | 0 | -100,00 | 0 | |||||
| 2026-02-02 | 13F | Mutual Advisors, LLC | 0 | -100,00 | 0 | -100,00 | ||||
| 2026-02-13 | 13F | Quinn Opportunity Partners LLC | 500 | 211 | ||||||
| 2026-02-17 | 13F | Durable Capital Partners LP | 925.045 | 3,65 | 390.387 | 15,95 | ||||
| 2026-02-04 | 13F | Independent Advisor Alliance | 12.959 | 12,86 | 5.469 | 26,25 | ||||
| 2026-02-13 | 13F | Walleye Trading LLC | Call | 322.100 | -40,38 | 135.933 | -33,31 | |||
| 2026-02-02 | 13F | Horizon Investments, LLC | 2.198 | 928 | ||||||
| 2026-02-11 | 13F | Fox Run Management, L.l.c. | 0 | -100,00 | 0 | |||||
| 2025-11-07 | 13F | Capital CS Group, LLC | 0 | -100,00 | 0 | |||||
| 2026-01-29 | 13F | WT Asset Management Ltd | 0 | -100,00 | 0 | -100,00 | ||||
| 2026-02-12 | 13F | Johnson Financial Group, Inc. | 3 | -62,50 | 1 | -66,67 | ||||
| 2026-01-21 | 13F | Signature Resources Capital Management, LLC | 100 | 0,00 | 42 | 13,51 | ||||
| 2026-01-30 | 13F | Wealthfront Advisers Llc | 27.360 | 16,56 | 11.546 | 30,40 | ||||
| 2026-02-13 | 13F | Ossiam | 0 | -100,00 | 0 | |||||
| 2026-02-17 | 13F | Alpine Global Management, LLC | 44.604 | 3.553,07 | 18.824 | 3.991,96 | ||||
| 2026-02-06 | 13F | Geometric Wealth Advisors | 11.004 | -21,01 | 4.644 | -11,65 | ||||
| 2026-04-22 | 13F | Pictet Asset Management Holding SA | 56.370 | -2,51 | 17.722 | -27,38 | ||||
| 2026-02-18 | 13F | Vident Advisory, LLC | 5.982 | 6,38 | 2.525 | 19,00 | ||||
| 2026-01-27 | 13F | CenterStar Asset Management, LLC | Put | 700 | 295 | |||||
| 2026-04-17 | 13F | Bell Investment Advisors, Inc | 41 | 32,26 | 13 | -7,69 | ||||
| 2026-02-17 | 13F | Rakuten Investment Management, Inc. | 18.170 | 107,25 | 7.878 | 1.286,80 | ||||
| 2026-04-14 | 13F | Bay Harbor Wealth Management, LLC | 9 | -10,00 | 3 | -50,00 | ||||
| 2026-02-09 | 13F | Lind Value II ApS | 120 | 51 | ||||||
| 2026-02-13 | 13F | Palisade Asset Management, LLC | 0 | -100,00 | 0 | |||||
| 2026-02-06 | 13F | Profund Advisors Llc | 7.245 | 35,47 | 3.058 | 51,56 | ||||
| 2026-02-09 | 13F | Mizuho Securities Usa Llc | 10.297 | 4.636 | ||||||
| 2026-02-13 | 13F | Ubs Asset Management Americas Inc | 748.658 | 21,70 | 315.949 | 36,14 | ||||
| 2026-01-23 | 13F | Avion Wealth | 97 | 3,19 | 0 | |||||
| 2026-02-17 | 13F | LMR Partners LLP | 60.000 | 1,68 | 25.321 | 13,75 | ||||
| 2026-02-17 | 13F | LMR Partners LLP | Call | 3.400 | -61,36 | 1.435 | -56,79 | |||
| 2026-02-09 | 13F | Keating Financial Advisory Services, Inc. | 64 | 27 | ||||||
| 2026-02-05 | 13F | Gabelli Funds Llc | 10.000 | 4.220 | ||||||
| 2026-02-09 | 13F | Alta Advisers Ltd | 521 | -13,31 | 220 | -3,10 | ||||
| 2026-02-11 | 13F | Franklin Resources Inc | 929.710 | 87,68 | 392.356 | 109,95 | ||||
| 2026-02-17 | 13F | Adams Wealth Management | 655 | -7,49 | 276 | 3,37 | ||||
| 2026-02-17 | 13F | Par Capital Management Inc | Put | 0 | -100,00 | 0 | ||||
| 2026-02-12 | 13F | Caerus Investment Advisors, LLC | 0 | -100,00 | 0 | |||||
| 2026-02-17 | 13F | Dragoneer Investment Group, LLC | 979.460 | 44,27 | 413.352 | 61,39 | ||||
| 2026-04-10 | 13F/A | OP Asset Management Ltd | 24.161 | 4,25 | 7.596 | -22,35 | ||||
| 2026-02-17 | 13F | LMR Partners LLP | Put | 800 | -96,51 | 338 | -96,10 | |||
| 2026-01-30 | 13F | Simplicity Wealth,LLC | 569 | 240 | ||||||
| 2026-02-11 | 13F | Empowered Funds, LLC | 6.076 | 42,63 | 2.564 | 59,55 | ||||
| 2026-02-17 | 13F | Polymer Capital Management (US) LLC | 0 | -100,00 | 0 | |||||
| 2026-02-06 | 13F | Kingdom Financial Group LLC. | 18 | 8 | ||||||
| 2026-02-09 | 13F | Quest Partners LLC | 367 | -12,83 | 155 | -2,53 | ||||
| 2026-01-29 | 13F | Concurrent Investment Advisors, LLC | Put | 400 | 169 | |||||
| 2026-02-13 | 13F | Arrowstreet Capital, Limited Partnership | 435.471 | -24,08 | 183.777 | -15,07 | ||||
| 2026-01-29 | 13F | Concurrent Investment Advisors, LLC | 10.202 | 1,78 | 4.305 | 13,86 | ||||
| 2026-02-17 | 13F | Raymond James Financial Inc | 521.380 | -8,22 | 222.966 | 4,04 | ||||
| 2026-02-17 | 13F | Par Capital Management Inc | 350.672 | -1,65 | 147.991 | 10,02 | ||||
| 2026-03-12 | 13F/A | Peak6 Llc | 0 | -100,00 | 0 | |||||
| 2026-02-17 | 13F | Abel Hall, LLC | 1.205 | 25,39 | 509 | 40,33 | ||||
| 2026-04-21 | 13F | Creative Capital Management Investments LLC | 10 | 3 | ||||||
| 2026-04-17 | 13F | Fifth Third Wealth Advisors LLC | 1.046 | 24,52 | 329 | -7,34 | ||||
| 2026-02-17 | 13F | Sig Brokerage, Lp | Call | 17.600 | -5,38 | 7.428 | 5,86 | |||
| 2026-02-11 | 13F | Deutsche Bank Ag\ | 316.297 | 21,41 | 133.484 | 35,82 | ||||
| 2026-01-29 | 13F | Coronation Fund Managers Ltd. | 42.860 | 18.088 | ||||||
| 2026-02-17 | 13F | Sig Brokerage, Lp | Put | 20.000 | 8.440 | |||||
| 2026-02-11 | 13F | United Financial Planning Group LLC | 1 | 0 | ||||||
| 2026-02-06 | 13F | CloudAlpha Capital Management Limited/Hong Kong | Put | 0 | -100,00 | 0 | ||||
| 2026-01-27 | 13F | Zurcher Kantonalbank (Zurich Cantonalbank) | 35.899 | 18,14 | 15.150 | 32,16 |