Grundlæggende statistik
| Institutionelle aktier (lange) | 218.009.607 - 43,12% (ex 13D/G) - change of -45,26MM shares -17,19% MRQ |
| Institutionel værdi (lang) | $ 16.655.300 USD ($1000) |
Institutionelt ejerskab og aktionærer
AngloGold Ashanti plc (US:AU) har 524 institutionelle ejere og aktionærer, der har indsendt 13D/G- eller 13F-formularer til Securities Exchange Commission (SEC). Disse institutioner har i alt 218,009,607 aktier. Største aktionærer omfatter BlackRock, Inc., Vanguard Group Inc, Van Eck Associates Corp, Fmr Llc, Ninety One SA (PTY) Ltd, Arrowstreet Capital, Limited Partnership, State Street Corp, Deutsche Bank Ag\, Norges Bank, and Legal & General Group Plc .
AngloGold Ashanti plc (NYSE:AU) institutionel ejerskabsstruktur viser aktuelle positioner i virksomheden efter institutioner og fonde, samt seneste ændringer i positionsstørrelse. Større aktionærer kan omfatte individuelle investorer, investeringsforeninger, hedgefonde eller institutioner. Skema 13D angiver, at investoren besidder (eller besidder) mere end 5 % af virksomheden og har til hensigt (eller har til hensigt at) aktivt at forfølge en ændring i forretningsstrategi. Skema 13G indikerer en passiv investering på over 5%.
The share price as of April 20, 2026 is 106,49 / share. Previously, on April 21, 2025, the share price was 44,17 / share. This represents an increase of 141,09% over that period.

Fondens stemningsscore
Fund Sentiment Score (fka Ownership Accumulation Score) finder de aktier, der bliver mest købt af fonde. Det er resultatet af en sofistikeret, multi-faktor kvantitativ model, der identificerer virksomheder med de højeste niveauer af institutionel akkumulering. Scoringsmodellen bruger en kombination af den samlede stigning i oplyste ejere, ændringerne i porteføljeallokeringer i disse ejere og andre målinger. Tallet går fra 0 til 100, hvor højere tal indikerer et højere niveau af akkumulering for sine jævnaldrende, og 50 er gennemsnittet.
Opdateringsfrekvens: Dagligt
Se Ownership Explorer, som giver en liste over højest rangerende virksomheder.
AI+ Ask Fintel’s AI assistant about AngloGold Ashanti plc.
Select a question to share a public post with an AI-crafted answer.
Thinking of good questions…
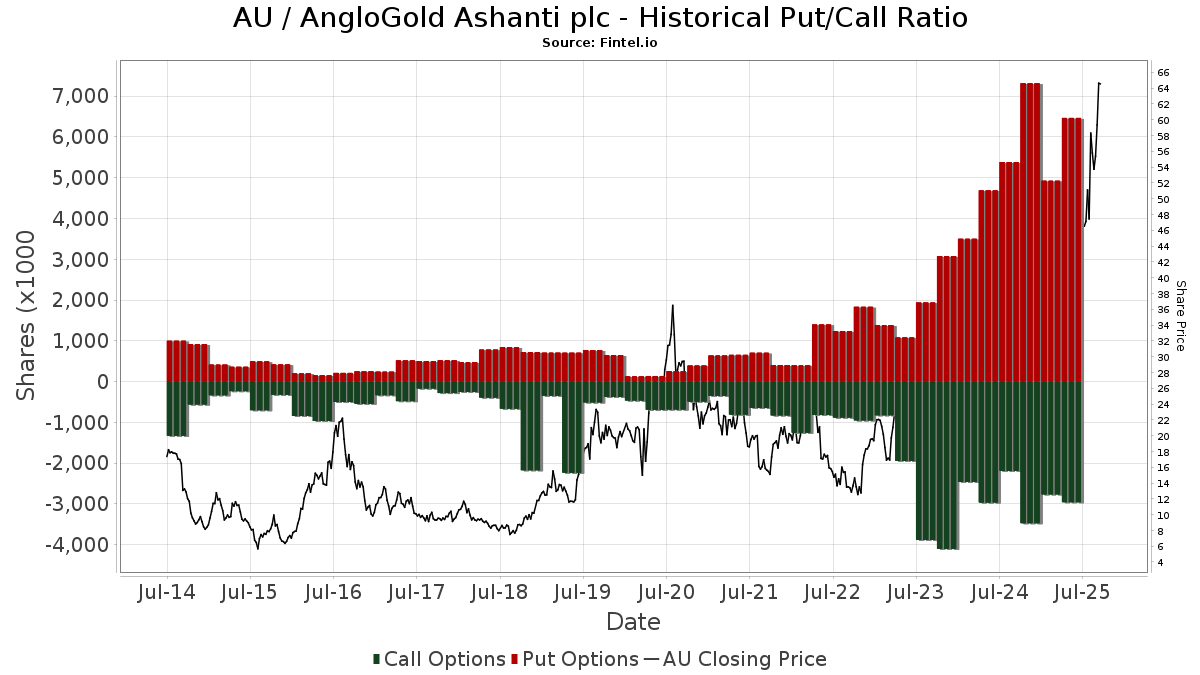
Institutionel Put/Call-forhold
Ud over at indberette standardaktie- og gældsudstedelser skal institutter med mere end 100 mill. aktiver under forvaltning også oplyse deres put- og call-optionsbeholdninger. Da salgsoptioner generelt indikerer negativ stemning, og købsoptioner indikerer positiv stemning, kan vi få en fornemmelse af den overordnede institutionelle stemning ved at plotte forholdet mellem put og kald. Diagrammet til højre viser det historiske put/call-forhold for dette instrument.
Brug af Put/Call Ratio som en indikator for investorernes stemning overvinder en af de vigtigste mangler ved at bruge totalt institutionelt ejerskab, som er, at en betydelig mængde af aktiver under forvaltning investeres passivt for at spore indekser. Passivt forvaltede fonde køber typisk ikke optioner, så indikatoren for put/call-forholdet følger mere nøje følelsen af aktivt forvaltede fonde.
13D/G-arkivering
Vi præsenterer 13D/G ansøgninger separat fra 13F ansøgninger på grund af den forskellige behandling af SEC. 13D/G-ansøgninger kan indgives af grupper af investorer (med én ledende), hvorimod 13F-ansøgninger ikke kan. Dette resulterer i situationer, hvor en investor kan indsende en 13D/G, der rapporterer én værdi for de samlede aktier (der repræsenterer alle de aktier, der ejes af investorgruppen), men derefter indsender en 13F, der rapporterer en anden værdi for de samlede aktier (der udelukkende repræsenterer deres egne) ejendomsret). Det betyder, at aktieejerskab af 13D/G-arkiver og 13F-arkiveringer ofte ikke er direkte sammenlignelige, så vi præsenterer dem separat.
Bemærk: Fra den 16. maj 2021 viser vi ikke længere ejere, der ikke har indsendt en 13D/G inden for det seneste år. Tidligere viste vi den fulde historie af 13D/G-arkiver. Generelt skal enheder, der er forpligtet til at indgive 13D/G-ansøgninger, indgive mindst årligt, før de indsender en afsluttende ansøgning. Dog forlader fonde nogle gange positioner uden at indsende en afsluttende ansøgning (dvs. de afvikler), så visning af den fulde historie resulterede nogle gange i forvirring om det nuværende ejerskab. For at undgå forvirring viser vi nu kun 'aktuelle' ejere - det vil sige - ejere, der har anmeldt inden for det seneste år.
Upgrade to unlock premium data.
| Fil dato | Form | Investor | Forrige Aktier |
Seneste Aktier |
Δ Aktier (Procent) |
Ejendomsret (Procent) |
Δ Ejerskab (Procent) |
|
|---|---|---|---|---|---|---|---|---|
| 2025-07-16 | BlackRock, Inc. | 26,174,301 | 35,765,465 | 36.64 | 7.10 | 36.54 |
13F og NPORT arkivering
Detaljer om 13F-arkivering er gratis. Detaljer om NP-ansøgninger kræver et premium-medlemskab. Grønne rækker angiver nye positioner. Røde rækker angiver lukkede positioner. Klik på linket ikon for at se den fulde transaktionshistorik.
Opgrader
for at låse premium-data op og eksportere til Excel ![]() .
.
| Fil dato | Kilde | Investor | Type | Gennemsnitlig pris (Øst) |
Aktier | Δ Aktier (%) |
Rapporteret Værdi ($1000) |
Δ Værdi (%) |
Port Alloc (%) |
|
|---|---|---|---|---|---|---|---|---|---|---|
| 2026-02-06 | 13F | EverSource Wealth Advisors, LLC | 3.290 | -6,75 | 281 | 12,90 | ||||
| 2026-02-17 | 13F | Tudor Investment Corp Et Al | Put | 17.700 | 1.509 | |||||
| 2026-02-17 | 13F | Tudor Investment Corp Et Al | Call | 14.800 | 1.262 | |||||
| 2026-04-13 | 13F | Artemis Investment Management LLP | 185.184 | -22,90 | 18.030 | -11,98 | ||||
| 2026-02-11 | 13F | LPL Financial LLC | 175.985 | -10,29 | 15.008 | 8,77 | ||||
| 2026-02-17 | 13F | Bank Of America Corp /de/ | 413.755 | -31,85 | 35.285 | -17,37 | ||||
| 2026-02-13 | 13F | Ossiam | 0 | -100,00 | 0 | |||||
| 2026-02-13 | 13F | Public Sector Pension Investment Board | 242.617 | -1,47 | 20.985 | 21,16 | ||||
| 2026-01-16 | 13F | Empirical Financial Services, LLC d.b.a. Empirical Wealth Management | 28.211 | 11,21 | 2.406 | 34,81 | ||||
| 2026-02-13 | 13F | Verition Fund Management LLC | 27.623 | 30,64 | 2.356 | 58,37 | ||||
| 2026-02-06 | 13F | Harvest Portfolios Group Inc. | 20.883 | -1,90 | 1.781 | 18,90 | ||||
| 2026-02-19 | 13F | Mcguire Capital Advisors Inc | 426 | 36 | ||||||
| 2026-02-23 | 13F | Mv Capital Management, Inc. | 25 | 0,00 | 2 | 100,00 | ||||
| 2026-02-11 | 13F | Cerity Partners LLC | 9.682 | 71,97 | 826 | 108,33 | ||||
| 2026-02-11 | 13F | Zions Bancorporation, National Association /ut/ | 365 | 31 | ||||||
| 2026-02-12 | 13F | Ankerstar Wealth, LLC | 1 | 0 | ||||||
| 2026-04-02 | 13F | Ares Financial Consulting, LLC | 29 | 0,00 | 3 | 50,00 | ||||
| 2026-02-17 | 13F | Nomura Holdings Inc | 22.572 | 1.925 | ||||||
| 2026-02-09 | 13F | Atlantic Trust, LLC | 82 | 0,00 | 7 | 20,00 | ||||
| 2026-04-15 | 13F | Activest Wealth Management | 26 | -36,59 | 3 | -33,33 | ||||
| 2026-02-17 | 13F | Altrinsic Global Advisors Llc | 8.433 | -21,82 | 719 | -5,15 | ||||
| 2026-02-09 | 13F | Hartland & Co., LLC | 3 | -92,31 | 0 | -100,00 | ||||
| 2026-02-10 | 13F | Goldman Sachs Group Inc | Call | 0 | -100,00 | 0 | -100,00 | |||
| 2026-02-13 | 13F | Sumitomo Life Insurance Co | 34.700 | 2.961 | ||||||
| 2026-02-11 | 13F | Havemeyer Place LP | 5.276 | 450 | ||||||
| 2026-02-13 | 13F | Nfj Investment Group, Llc | 11.721 | -10,31 | 16.798 | 5,92 | ||||
| 2026-02-12 | 13F | ROSS\JOHNSON & Associates LLC | 1 | 0 | ||||||
| 2026-02-19 | 13F | CI Private Wealth, LLC | 22.070 | 27,98 | 1.857 | 53,14 | ||||
| 2026-02-04 | 13F | Ameritas Advisory Services, LLC | 0 | -100,00 | 0 | -100,00 | ||||
| 2026-02-12 | 13F | Triumph Capital Management | 171 | 15 | ||||||
| 2026-02-17 | 13F | Edmond De Rothschild Holding S.a. | 120.062 | -15,80 | 10.398 | 3,80 | ||||
| 2026-04-06 | 13F | CX Institutional | 38.845 | 4 | ||||||
| 2026-02-17 | 13F | Ninepoint Partners LP | 67 | 6 | ||||||
| 2026-02-17 | 13F | Price T Rowe Associates Inc /md/ | 403.743 | 5,07 | 34 | 25,93 | ||||
| 2026-04-02 | 13F | MJT & Associates Financial Advisory Group, Inc. | 329 | 0,00 | 32 | 14,29 | ||||
| 2026-02-12 | 13F | State Board Of Administration Of Florida Retirement System | 390.775 | 5,39 | 33.325 | 27,79 | ||||
| 2026-02-04 | 13F | Independent Advisor Alliance | 4.163 | 355 | ||||||
| 2026-01-23 | 13F | Forefront Wealth Management Inc. | 54.572 | -2,36 | 4.654 | 18,40 | ||||
| 2026-02-18 | 13F | Beacon Pointe Advisors, LLC | 9.885 | -5,03 | 843 | 15,03 | ||||
| 2026-02-17 | 13F | Ancora Advisors, LLC | 761 | 52,20 | 65 | 82,86 | ||||
| 2026-02-17 | 13F | Summit Trail Advisors, Llc | 6.974 | 15,62 | 595 | 40,09 | ||||
| 2026-02-17 | 13F | Credit Agricole S A | 512.954 | -0,10 | 43.745 | 21,14 | ||||
| 2026-01-23 | 13F | Freestone Capital Holdings, LLC | 7.725 | 0,56 | 659 | 21,85 | ||||
| 2026-04-07 | 13F | Barden Capital Management, Inc. | 11.981 | 1.166 | ||||||
| 2026-02-11 | 13F | Buckingham Strategic Partners | 3.927 | 335 | ||||||
| 2026-02-13 | 13F | Quarry LP | 29 | -86,45 | 2 | -86,67 | ||||
| 2026-02-12 | 13F | Steward Partners Investment Advisory, Llc | 784 | -26,59 | 67 | -12,00 | ||||
| 2026-02-13 | 13F | Osmosis Investment Management UK Ltd | 8.969 | 776 | ||||||
| 2026-02-06 | 13F | Tortoise Investment Management, LLC | 0 | -100,00 | 0 | |||||
| 2025-11-03 | 13F | Tidemark, LLC | 0 | -100,00 | 0 | |||||
| 2026-01-28 | 13F | CAPROCK Group, Inc. | 65.706 | 23,95 | 5.603 | 86,39 | ||||
| 2026-02-13 | 13F | Causeway Capital Management Llc | 434.260 | 118,76 | 37.559 | 168,99 | ||||
| 2026-02-03 | 13F | Ewa, Llc | 2.710 | 231 | ||||||
| 2026-04-15 | 13F | Monument Capital Management | 50.957 | 0,67 | 4.961 | 14,94 | ||||
| 2026-01-07 | 13F | Yeomans Consulting Group, Inc. | 4.263 | 364 | ||||||
| 2026-02-12 | 13F | DJE Kapital AG | 72.700 | 10,99 | 6.281 | 114,88 | ||||
| 2026-01-28 | 13F | West Michigan Advisors, Llc | 7.177 | -82,52 | 612 | -78,80 | ||||
| 2026-01-30 | 13F | North Star Investment Management Corp. | 7 | 1 | ||||||
| 2026-01-26 | 13F | AE Wealth Management LLC | 4.496 | 383 | ||||||
| 2026-02-13 | 13F | Wells Fargo & Company/mn | 166.193 | 21,46 | 14.173 | 47,27 | ||||
| 2026-02-10 | 13F | Kentucky Retirement Systems | 31.623 | 0,00 | 2.697 | 21,22 | ||||
| 2026-02-13 | 13F | L2 Asset Management, LLC | 33.344 | 37,68 | 2.844 | 66,94 | ||||
| 2026-01-20 | 13F | Cromwell Holdings LLC | 74 | 0,00 | 6 | 20,00 | ||||
| 2026-03-02 | 13F | Reflection Asset Management | 488 | 42 | ||||||
| 2026-02-05 | 13F | Amalgamated Bank | 33.412 | 18,52 | 3 | 100,00 | ||||
| 2026-02-13 | 13F | Pathstone Holdings, LLC | 20.365 | -44,69 | 1.737 | -32,95 | ||||
| 2025-11-14 | 13F | Millennium Management Llc | Call | 0 | -100,00 | 0 | -100,00 | |||
| 2026-02-12 | 13F | Lansforsakringar Fondforvaltning AB (publ) | 97.700 | 4,72 | 8.450 | 28,77 | ||||
| 2026-01-23 | 13F | Diversify Advisory Services, LLC | 2.453 | 243 | ||||||
| 2026-02-04 | 13F | LRI Investments, LLC | 6 | 1 | ||||||
| 2025-12-09 | 13F/A | Tudor Investment Corp Et Al | 0 | -100,00 | 0 | |||||
| 2026-02-10 | 13F | Axq Capital, Lp | 2.683 | -11,66 | 229 | 7,04 | ||||
| 2026-04-10 | 13F | Country Trust Bank | 300 | 0,00 | 29 | 16,00 | ||||
| 2026-01-29 | 13F | Sanctuary Advisors, LLC | 7.158 | -1,68 | 610 | 19,14 | ||||
| 2026-02-17 | 13F | Two Sigma Advisers, Lp | 11.168 | -24,89 | 952 | -8,90 | ||||
| 2026-02-13 | 13F | Squarepoint Ops LLC | Call | 18.000 | 37,40 | 1.535 | 66,67 | |||
| 2026-02-13 | 13F | Squarepoint Ops LLC | Put | 87.800 | 55,67 | 7.488 | 88,78 | |||
| 2026-02-13 | 13F | Squarepoint Ops LLC | 12.196 | -43,08 | 1.040 | -30,94 | ||||
| 2026-02-13 | 13F | Marshall Wace, Llp | 204.705 | 17.457 | ||||||
| 2026-04-17 | 13F | CENTRAL TRUST Co | 19 | 2 | ||||||
| 2026-02-11 | 13F | O'shaughnessy Asset Management, Llc | 134.676 | 27,39 | 11.486 | 54,47 | ||||
| 2026-02-06 | 13F | Cullen/frost Bankers, Inc. | 204 | 3,55 | 17 | 30,77 | ||||
| 2026-02-17 | 13F | Advisor Group Holdings, Inc. | 34.298 | -30,68 | 2.925 | 1,77 | ||||
| 2026-04-07 | 13F | CoreCap Advisors, LLC | 653 | -15,96 | 64 | -4,55 | ||||
| 2026-02-04 | 13F | First Eagle Investment Management, LLC | 1.491.498 | -27,47 | 127.195 | -12,05 | ||||
| 2026-02-17 | 13F | Oaktree Fund Advisors, LLC | 162.478 | -16,70 | 13.856 | 1,01 | ||||
| 2026-02-06 | 13F | Handelsbanken Fonder AB | 146.593 | -3,74 | 13 | 20,00 | ||||
| 2026-02-13 | 13F | OMERS ADMINISTRATION Corp | 0 | -100,00 | 0 | |||||
| 2025-11-12 | 13F | Quantbot Technologies LP | 0 | -100,00 | 0 | -100,00 | ||||
| 2026-01-20 | 13F | American National Bank | 47 | 4 | ||||||
| 2025-11-12 | 13F | 111 Capital | 0 | -100,00 | 0 | -100,00 | ||||
| 2026-02-12 | 13F | Quadrant Capital Group Llc | 7.824 | -0,51 | 667 | 20,61 | ||||
| 2026-02-12 | 13F | Qtron Investments LLC | 0 | -100,00 | 0 | |||||
| 2025-10-30 | 13F | Twin Peaks Wealth Advisors, LLC | 0 | -100,00 | 0 | -100,00 | ||||
| 2026-02-17 | 13F | Asset One Wealth Management LLC | 8.357 | 793 | ||||||
| 2026-02-05 | 13F | Baader Bank INC | 3.000 | -70,00 | 256 | -63,73 | ||||
| 2026-02-13 | 13F | State Street Corp | 5.731.937 | 0,46 | 488.820 | 21,82 | ||||
| 2026-01-23 | 13F | TFC Financial Management | 4 | 33,33 | 0 | |||||
| 2026-02-17 | 13F | Janus Henderson Group Plc | 118.330 | 10.091 | ||||||
| 2026-01-23 | 13F | Altfest L J & Co Inc | 7.974 | 680 | ||||||
| 2026-02-17 | 13F | Aster Capital Management (DIFC) Ltd | 845 | 72 | ||||||
| 2026-03-04 | 13F | SHP Wealth Management | 125 | 11 | ||||||
| 2026-02-17 | 13F | Point72 Asset Management, L.P. | Put | 85.800 | 7.317 | |||||
| 2026-02-13 | 13F | Stifel Financial Corp | 6.407 | -25,26 | 546 | -9,30 | ||||
| 2026-02-17 | 13F | Point72 Asset Management, L.P. | Call | 212.500 | 18.122 | |||||
| 2026-02-17 | 13F | Point72 Asset Management, L.P. | 553.561 | 356,54 | 47.208 | 453,62 | ||||
| 2026-02-17 | 13F | GAM Holding AG | 20.100 | 1.738 | ||||||
| 2025-10-27 | 13F | Kiker Wealth Management, LLC | 0 | -100,00 | 0 | -100,00 | ||||
| 2026-02-12 | 13F | Cloud Capital Management, LLC | 0 | -100,00 | 0 | |||||
| 2026-02-12 | 13F | Xponance, Inc. | 31.377 | 1,86 | 2.676 | 23,50 | ||||
| 2026-04-14 | 13F | Seven Mile Advisory | 3.576 | 1,39 | 348 | 16,00 | ||||
| 2026-04-20 | 13F | Ritholtz Wealth Management | 28.572 | 25,77 | 2.782 | 43,57 | ||||
| 2026-01-28 | 13F | Turtle Creek Wealth Advisors, LLC | 5.029 | 429 | ||||||
| 2026-01-07 | 13F | Vigilare Wealth Management | 0 | -100,00 | 0 | |||||
| 2026-01-28 | 13F | HB Wealth Management, LLC | 4.507 | 13,07 | 384 | 37,14 | ||||
| 2026-01-23 | 13F | Beacon Harbor Wealth Advisors, Inc. | 76.487 | 6.523 | ||||||
| 2026-02-11 | 13F | Jpmorgan Chase & Co | 29.178 | 123,52 | 2.488 | 171,02 | ||||
| 2026-02-17 | 13F | Orbis Allan Gray Ltd | 427.891 | 0,00 | 36.491 | 21,26 | ||||
| 2025-10-31 | 13F | Whittier Trust Co | 0 | -100,00 | 0 | -100,00 | ||||
| 2026-04-21 | 13F | Robeco Institutional Asset Management B.V. | 61.807 | 0,00 | 6.018 | 14,17 | ||||
| 2026-02-10 | 13F | Impact Partnership Wealth, LLC | 0 | -100,00 | 0 | |||||
| 2026-02-04 | 13F | Dogwood Wealth Management LLC | 98 | 3.166,67 | 8 | |||||
| 2026-02-06 | 13F | Bare Financial Services, Inc | 9 | -90,62 | 1 | -100,00 | ||||
| 2026-02-13 | 13F | Mariner, LLC | 30.604 | 29,85 | 2.614 | 57,75 | ||||
| 2026-02-17 | 13F | Private Advisor Group, LLC | 5.399 | 460 | ||||||
| 2026-04-21 | 13F | Aaron Wealth Advisors LLC | 0 | -100,00 | 0 | |||||
| 2026-04-16 | 13F | Lee Johnson Capital Management, Llc | 5.916 | -55,88 | 576 | -49,69 | ||||
| 2026-02-05 | 13F | Thrivent Financial For Lutherans | 55.628 | 3,79 | 5 | 33,33 | ||||
| 2026-04-09 | 13F | Park Place Capital Corp | 95 | 9 | ||||||
| 2026-02-13 | 13F | Eschler Asset Management LLP | 0 | -100,00 | 0 | |||||
| 2026-02-17 | 13F | Cetera Investment Advisers | 139.643 | 6,93 | 11.909 | 29,66 | ||||
| 2026-04-10 | 13F | Henry James International Management Inc. | 40.096 | -0,01 | 3.904 | 14,16 | ||||
| 2026-04-14 | 13F | Perpetual Ltd | 64.012 | -22,41 | 6.232 | -11,41 | ||||
| 2026-02-17 | 13F | Prelude Capital Management, Llc | 0 | -100,00 | 0 | |||||
| 2026-02-13 | 13F | Prudential Financial Inc | 11.065 | -51,47 | 944 | -41,17 | ||||
| 2026-02-17 | 13F | Susquehanna International Group, Llp | 27.951 | 75,24 | 2.384 | 112,58 | ||||
| 2026-02-17 | 13F | Susquehanna International Group, Llp | Put | 1.013.200 | 6,64 | 86.406 | 29,31 | |||
| 2026-04-10 | 13F | Abound Wealth Management | 6 | 0,00 | 1 | |||||
| 2026-02-10 | 13F | Envestnet Asset Management Inc | 5.879 | -56,52 | 501 | -47,26 | ||||
| 2026-01-26 | 13F | Border to Coast Pensions Partnership Ltd | 247.914 | 13,41 | 21 | 40,00 | ||||
| 2026-02-17 | 13F | Susquehanna International Group, Llp | Call | 898.200 | 34,02 | 76.598 | 62,51 | |||
| 2026-02-12 | 13F | Skopos Labs, Inc. | 3.193 | -46,79 | 271 | 3,04 | ||||
| 2026-04-09 | 13F | Moody National Bank Trust Division | 2.362 | 0,00 | 230 | 13,93 | ||||
| 2026-02-17 | 13F | Advisory Services Network, LLC | 35.572 | 43,08 | 3.034 | 73,51 | ||||
| 2026-04-13 | 13F | Augustine Asset Management Inc | 3.722 | 5,44 | 362 | 20,27 | ||||
| 2026-04-09 | 13F | Wedmont Private Capital | 10.557 | 30,62 | 1.134 | 51,40 | ||||
| 2026-02-17 | 13F | SummitTX Capital, L.P. | 38.155 | 3.254 | ||||||
| 2026-02-13 | 13F | Boston Partners | 14.592 | -73,84 | 1.244 | -68,28 | ||||
| 2026-01-21 | 13F | Westfuller Advisors, LLC | 3.698 | 0,00 | 315 | 21,15 | ||||
| 2026-02-13 | 13F | Kestra Advisory Services, LLC | 0 | -100,00 | 0 | |||||
| 2026-02-17 | 13F | Parallax Volatility Advisers, L.P. | 45.195 | 3.854 | ||||||
| 2025-11-21 | 13F | Nebula Research & Development LLC | 0 | -100,00 | 0 | |||||
| 2026-02-11 | 13F | Capital World Investors | 4.186.463 | 64,50 | 357.022 | 99,47 | ||||
| 2026-02-17 | 13F | LaSalle St. Investment Advisors, LLC | 4.435 | 0 | ||||||
| 2026-02-11 | 13F | Hughes Financial Services, LLC | 47 | 4 | ||||||
| 2026-02-17 | 13F | Parallax Volatility Advisers, L.P. | Call | 300.000 | 0,00 | 25.584 | 21,26 | |||
| 2026-01-23 | 13F | Assetmark, Inc | 1.012 | 8.333,33 | 86 | |||||
| 2026-02-17 | 13F | Parallax Volatility Advisers, L.P. | Put | 100.000 | 0,00 | 8.528 | 21,26 | |||
| 2026-04-20 | 13F | State of Alaska, Department of Revenue | 3.500 | 0 | ||||||
| 2026-01-14 | 13F | Net Worth Advisory Group | 3.257 | 278 | ||||||
| 2026-02-05 | 13F | High Note Wealth, LLC | 8 | 100,00 | 1 | |||||
| 2026-02-05 | 13F | Td Private Client Wealth Llc | 119 | 10 | ||||||
| 2026-02-02 | 13F | Varma Mutual Pension Insurance Co | 99.500 | 8.485 | ||||||
| 2026-04-08 | 13F | Holos Integrated Wealth LLC | 108 | 1,89 | 11 | 11,11 | ||||
| 2026-04-06 | 13F | Rosenberg Matthew Hamilton | 254 | 0,00 | 25 | 14,29 | ||||
| 2026-04-20 | 13F | Jfs Wealth Advisors, Llc | 348 | 0,00 | 34 | 13,79 | ||||
| 2026-02-09 | 13F | Coldstream Capital Management Inc | 6.377 | 111,37 | 544 | 156,13 | ||||
| 2026-02-13 | 13F | Brown Advisory Inc | 3.195 | 272 | ||||||
| 2026-02-10 | 13F | Connor, Clark & Lunn Investment Management Ltd. | 359.395 | -44,62 | 30.649 | -32,85 | ||||
| 2026-02-17 | 13F | Public Employees Retirement System Of Ohio | 346.664 | -15,79 | 29.617 | 2,30 | ||||
| 2026-02-09 | 13F | Huntington National Bank | 119 | 138,00 | 10 | 233,33 | ||||
| 2026-02-13 | 13F | Wilkerson Advisory Group LLC | 77 | 7 | ||||||
| 2026-02-02 | 13F | Fifth Third Bancorp | 33 | 0,00 | 3 | 0,00 | ||||
| 2026-02-13 | 13F | JustInvest LLC | 41.561 | 2,76 | 3.543 | 24,62 | ||||
| 2026-02-17 | 13F | Liontrust Investment Partners LLP | 2.478 | -18,30 | 214 | 0,47 | ||||
| 2026-02-17 | 13F | Engineers Gate Manager LP | 18.242 | 1.556 | ||||||
| 2026-01-07 | 13F | Sagespring Wealth Partners, Llc | 5.013 | 68,62 | 428 | 104,31 | ||||
| 2026-02-05 | 13F | Stephens Inc /ar/ | 41.706 | 2,00 | 3.557 | 23,69 | ||||
| 2026-02-13 | 13F | Fieldview Capital Management, LLC | 2.504 | 214 | ||||||
| 2026-02-05 | 13F | Elyxium Wealth, LLC | 165 | 14 | ||||||
| 2026-02-17 | 13F | Capital Fund Management S.a. | Call | 214.200 | 1,61 | 18.267 | 23,21 | |||
| 2026-01-30 | 13F/A | M&t Bank Corp | 9.120 | 101,55 | 778 | 144,34 | ||||
| 2025-11-12 | 13F | Fox Run Management, L.l.c. | 0 | -100,00 | 0 | |||||
| 2026-02-17 | 13F | Capital Fund Management S.a. | Put | 121.000 | -56,32 | 10.319 | -47,04 | |||
| 2026-02-10 | 13F | Td Asset Management Inc | 141.218 | -13,99 | 12.043 | 4,30 | ||||
| 2026-02-18 | 13F | GWM Advisors LLC | 0 | -100,00 | 0 | |||||
| 2025-11-12 | 13F | Catalyst Funds Management Pty Ltd | 0 | -100,00 | 0 | |||||
| 2026-02-17 | 13F | Laird Norton Trust Company, Llc | 29.218 | 2.492 | ||||||
| 2026-02-17 | 13F | D. E. Shaw & Co., Inc. | 52.279 | 40,68 | 4.458 | 70,61 | ||||
| 2026-01-21 | 13F | Stone House Investment Management, LLC | 173 | 0,00 | 15 | 16,67 | ||||
| 2026-02-17 | 13F | D. E. Shaw & Co., Inc. | Call | 17.800 | 1.518 | |||||
| 2026-02-13 | 13F | Rhumbline Advisers | 458.347 | -0,11 | 39.088 | 21,12 | ||||
| 2026-02-13 | 13F | Towarzystwo Funduszy Inwestycyjnych Pzu Sa | 0 | -100,00 | 0 | |||||
| 2026-02-06 | 13F | Carrhae Capital LLP | 98.283 | -91,10 | 8.382 | -89,21 | ||||
| 2026-02-17 | 13F | D. E. Shaw & Co., Inc. | Put | 95.100 | 8.110 | |||||
| 2026-01-23 | 13F | Sumitomo Mitsui Trust Holdings, Inc. | 837.055 | -2,47 | 71.384 | 18,26 | ||||
| 2026-02-13 | 13F | Alberta Investment Management Corp | 25.400 | 2.197 | ||||||
| 2026-04-07 | 13F | U.S. Capital Wealth Advisors, LLC | 2.258 | 220 | ||||||
| 2026-04-20 | 13F | Ronald Blue Trust, Inc. | 4.285 | -0,19 | 417 | 13,93 | ||||
| 2026-02-13 | 13F | Neo Ivy Capital Management | 0 | -100,00 | 0 | -100,00 | ||||
| 2026-03-12 | 13F/A | Peak6 Llc | Call | 26.800 | 143,64 | 2.286 | 195,60 | |||
| 2026-02-17 | 13F | Ameriprise Financial Inc | 920.691 | 76,18 | 78.517 | 113,63 | ||||
| 2026-01-21 | 13F | Azzad Asset Management Inc /adv | 93.775 | 1,01 | 7.997 | 22,48 | ||||
| 2026-02-17 | 13F | Silvercrest Asset Management Group Llc | 141.694 | -6,33 | 12.084 | 13,58 | ||||
| 2026-03-12 | 13F/A | Peak6 Llc | 5.302 | -66,68 | 452 | -59,57 | ||||
| 2026-03-12 | 13F/A | Peak6 Llc | Put | 71.100 | 0,00 | 6.063 | 21,26 | |||
| 2026-02-13 | 13F | Panagora Asset Management Inc | 2.921 | -84,05 | 249 | -80,67 | ||||
| 2026-02-02 | 13F | Cornerstone Planning Group LLC | 16 | 6,67 | 2 | 0,00 | ||||
| 2026-02-17 | 13F | Kemnay Advisory Services Inc. | 194 | 17 | ||||||
| 2026-03-31 | 13F/A | Barclays Plc | Call | 0 | -100,00 | 0 | -100,00 | |||
| 2026-01-14 | 13F | Spire Wealth Management | 68 | 0,00 | 6 | 25,00 | ||||
| 2026-04-15 | 13F | Merit Financial Group, LLC | 8.114 | 19,15 | 790 | 36,03 | ||||
| 2026-02-17 | 13F | Mercer Global Advisors Inc /adv | 6.101 | 48,15 | 520 | 79,93 | ||||
| 2026-02-17 | 13F | Utah Retirement Systems | 26.625 | 0,00 | 2.271 | 21,26 | ||||
| 2025-11-14 | 13F | Axa S.a. | 0 | -100,00 | 0 | |||||
| 2026-01-22 | 13F | Massachusetts Financial Services Co /ma/ | 161.556 | 13.777 | ||||||
| 2026-01-21 | 13F | Greenleaf Trust | 7.274 | 0,00 | 620 | 21,33 | ||||
| 2026-02-12 | 13F | Counterpoint Mutual Funds LLC | 33.560 | 2.862 | ||||||
| 2026-02-11 | 13F | Syon Capital Llc | 2.521 | 215 | ||||||
| 2026-02-17 | 13F | CWM Advisors, LLC | 14.664 | 1.251 | ||||||
| 2026-01-27 | 13F | Atlantic Edge Private Wealth Management, LLC | 75 | 6 | ||||||
| 2026-02-09 | 13F | Investors Portfolio Services LLC | 8 | 1 | ||||||
| 2026-02-13 | 13F | Titan Investment Solutions Ltd | 19.555 | 1.668 | ||||||
| 2026-01-30 | 13F | American Capital Advisory, LLC | 6 | 0,00 | 1 | |||||
| 2026-02-10 | 13F/A | Northwestern Mutual Wealth Management Co | 1.101 | 7,62 | 94 | 30,99 | ||||
| 2026-02-19 | 13F | Atomi Financial Group, Inc. | 17.386 | 4,45 | 1.483 | 26,67 | ||||
| 2026-02-09 | 13F | Valued Retirements, Inc. | 3.250 | 277 | ||||||
| 2026-02-17 | 13F | XTX Topco Ltd | 12.812 | 1.093 | ||||||
| 2026-04-13 | 13F | Salem Investment Counselors Inc | 200 | 19 | ||||||
| 2026-02-17 | 13F | Citadel Advisors Llc | Call | 224.500 | -19,91 | 19.145 | -2,88 | |||
| 2026-02-12 | 13F | Hollencrest Capital Management | 69.565 | 0,15 | 5.933 | 21,43 | ||||
| 2026-02-17 | 13F | Citadel Advisors Llc | 188.767 | 497,84 | 16.098 | 625,14 | ||||
| 2026-02-13 | 13F | Evelyn Partners Investment Management (Europe) Ltd | 500 | 0,00 | 43 | 20,00 | ||||
| 2026-02-17 | 13F | Citadel Advisors Llc | Put | 1.742.500 | -26,00 | 148.600 | -10,27 | |||
| 2026-02-17 | 13F | Fmr Llc | 16.183.167 | -12,33 | 1.384.389 | 6,65 | ||||
| 2026-02-11 | 13F | Parallel Advisors, LLC | 2.777 | 3,58 | 237 | 25,53 | ||||
| 2026-02-13 | 13F | Evelyn Partners Investment Management Services Ltd | 114 | 10 | ||||||
| 2026-02-12 | 13F | Mindset Wealth Management, Llc | 3.700 | 316 | ||||||
| 2026-02-13 | 13F | Walleye Capital LLC | Put | 65.200 | -56,96 | 5.560 | -47,81 | |||
| 2026-02-13 | 13F | Walleye Capital LLC | Call | 132.000 | 59,61 | 11.257 | 93,54 | |||
| 2026-02-17 | 13F | Cantor Fitzgerald, L. P. | 53.647 | 4.575 | ||||||
| 2026-02-17 | 13F | FIL Ltd | 1.875.687 | -64,58 | 161.997 | -56,46 | ||||
| 2025-11-04 | 13F/A | Lingohr & Partner Asset Management GmbH | 27.989 | -21,45 | 2 | 0,00 | ||||
| 2026-02-02 | 13F | Principal Financial Group Inc | 57.872 | -4,99 | 4.935 | 15,22 | ||||
| 2026-02-13 | 13F | Colony Group, LLC | 2.933 | 250 | ||||||
| 2026-04-20 | 13F | SILVER OAK SECURITIES, Inc | 3.297 | 0,46 | 321 | 13,07 | ||||
| 2026-02-10 | 13F | Nomura Asset Management Co Ltd | 0 | 0 | ||||||
| 2026-04-17 | 13F | HHM Wealth Advisors, LLC | 350 | 0,00 | 34 | 17,24 | ||||
| 2026-02-12 | 13F | Federation des caisses Desjardins du Quebec | 15.110 | 12,01 | 1.289 | 35,86 | ||||
| 2026-02-17 | 13F | SageView Advisory Group, LLC | 179 | 15 | ||||||
| 2026-01-29 | 13F | Coronation Fund Managers Ltd. | 0 | -100,00 | 0 | |||||
| 2026-02-11 | 13F | Nikko Asset Management Americas, Inc. | 24.017 | -2,18 | 2.047 | 18,60 | ||||
| 2026-02-17 | 13F | Zacks Investment Management | 32.059 | 6,63 | 2.734 | 29,28 | ||||
| 2026-01-28 | 13F | DekaBank Deutsche Girozentrale | 53.477 | 0,00 | 1 | -66,67 | ||||
| 2026-02-17 | 13F | GeoWealth Management, LLC | 12.012 | -26,24 | 1.024 | -10,57 | ||||
| 2026-02-11 | 13F | SOUTH STATE Corp | 66 | 43,48 | 6 | 66,67 | ||||
| 2026-02-13 | 13F | Martingale Asset Management L P | 324.483 | -5,38 | 27.672 | 14,73 | ||||
| 2026-04-13 | 13F | Nvest Wealth Strategies, Inc. | 16 | 2 | ||||||
| 2026-02-13 | 13F | Manufacturers Life Insurance Company, The | 0 | -100,00 | 0 | |||||
| 2026-01-07 | 13F | Aventura Private Wealth, LLC | 50 | 38,89 | 4 | 100,00 | ||||
| 2026-02-17 | 13F | Tower Research Capital LLC (TRC) | 991 | 126,77 | 85 | 180,00 | ||||
| 2025-11-14 | 13F | AXA Investment Managers S.A. | 276.768 | 19.465 | ||||||
| 2026-02-13 | 13F | Wealth Alliance | 2.495 | 213 | ||||||
| 2026-02-11 | 13F | Twin Tree Management, LP | Put | 158.600 | -82,58 | 13.525 | -78,88 | |||
| 2026-02-10 | 13F | Intech Investment Management Llc | 42.732 | -42,23 | 3.662 | -29,60 | ||||
| 2026-02-11 | 13F | Twin Tree Management, LP | 144.762 | 31,93 | 12.345 | 59,97 | ||||
| 2026-02-11 | 13F | Twin Tree Management, LP | Call | 32.100 | 32.000,00 | 2.737 | 39.000,00 | |||
| 2026-02-06 | 13F | Great Diamond Partners, LLC | 40.170 | 118,02 | 3.426 | 164,48 | ||||
| 2026-01-06 | 13F | Arlington Capital Management, Inc. | 47.476 | 1,75 | 4.049 | 23,38 | ||||
| 2025-11-14 | 13F/A | AMF Pensionsforsakring AB | 0 | -100,00 | 0 | -100,00 | ||||
| 2026-02-05 | 13F | Allworth Financial LP | 1.086 | 2,84 | 93 | 24,32 | ||||
| 2026-02-11 | 13F | Fca Corp /tx | 3.000 | 0,00 | 256 | 21,43 | ||||
| 2026-04-14 | 13F | Prospera Financial Services Inc | 4.776 | 59,15 | 465 | 82,35 | ||||
| 2026-02-13 | 13F | Treasurer of the State of North Carolina | 308.485 | -4,81 | 26 | 18,18 | ||||
| 2026-02-11 | 13F | West Family Investments, Inc. | 4.770 | 0,00 | 407 | 21,19 | ||||
| 2026-02-12 | 13F | Sprott Inc. | 644.193 | -16,41 | 54.937 | 1,36 | ||||
| 2026-02-12 | 13F | Barings Llc | 539.228 | -19,38 | 46.513 | -1,07 | ||||
| 2026-02-10 | 13F | Root Financial Partners, LLC | 54 | 671,43 | 5 | |||||
| 2026-02-12 | 13F | Pitcairn Co | 0 | -100,00 | 0 | |||||
| 2026-02-12 | 13F | Keel Point, LLC | 2.384 | 203 | ||||||
| 2026-01-16 | 13F | Crewe Advisors LLC | 26 | 0,00 | 2 | 100,00 | ||||
| 2026-02-03 | 13F | McIlrath & Eck, LLC | 1.612 | -3,88 | 137 | 17,09 | ||||
| 2025-11-12 | 13F | TCG Advisory Services, LLC | 0 | -100,00 | 0 | |||||
| 2026-02-10 | 13F | State of Wyoming | 8.990 | 152,39 | 767 | 206,40 | ||||
| 2026-02-13 | 13F | Carmignac Gestion | 6.122 | 522 | ||||||
| 2026-02-02 | 13F | Strs Ohio | 465.241 | -5,00 | 39.676 | 15,19 | ||||
| 2026-02-12 | 13F | Penserra Capital Management LLC | 26.975 | 82,73 | 2 | 100,00 | ||||
| 2026-02-17 | 13F | Russell Investments Group, Ltd. | 2.590.817 | -0,10 | 221.440 | 21,65 | ||||
| 2026-04-17 | 13F | Andina Capital Management, LLC | 4.038 | 393 | ||||||
| 2026-02-12 | 13F | Hrt Financial Lp | 20.414 | 2 | ||||||
| 2026-02-13 | 13F | Y-Intercept (Hong Kong) Ltd | 83.338 | -64,63 | 7.107 | -57,11 | ||||
| 2026-01-15 | 13F | Frank, Rimerman Advisors LLC | 79.659 | 0,00 | 6.793 | 21,26 | ||||
| 2026-01-28 | 13F | U S Global Investors Inc | 90.000 | -45,08 | 7.675 | -33,40 | ||||
| 2026-04-09 | 13F | Veracity Capital LLC | 5.114 | -4,11 | 498 | 9,47 | ||||
| 2026-02-17 | 13F | Aqr Capital Management Llc | 2.082.326 | 5.109,85 | 179.286 | 6.278,01 | ||||
| 2026-02-19 | 13F | Invesco Ltd. | 2.791.584 | 4,47 | 238.066 | 26,67 | ||||
| 2026-01-27 | 13F | TD Waterhouse Canada Inc. | 41.670 | -45,53 | 3.552 | -27,94 | ||||
| 2026-02-03 | 13F | Sequoia Financial Advisors, LLC | 6.306 | 13,01 | 538 | 36,99 | ||||
| 2026-02-12 | 13F | New York State Common Retirement Fund | 531.403 | 23,05 | 45.318 | 49,21 | ||||
| 2026-02-13 | 13F | Van Eck Associates Corp | 18.794.119 | -5,31 | 1.603 | 14,84 | ||||
| 2026-01-28 | 13F | Salomon & Ludwin, LLC | 273 | 0,00 | 24 | 20,00 | ||||
| 2026-04-07 | 13F | Farther Finance Advisors, LLC | 5.030 | 64,22 | 521 | 99,23 | ||||
| 2026-02-13 | 13F | Police & Firemen's Retirement System of New Jersey | 77.708 | -4,23 | 6.627 | 16,12 | ||||
| 2026-02-11 | 13F | Harvest Fund Management Co., Ltd | 6.912 | 0,00 | 1 | |||||
| 2026-02-03 | 13F | Anfield Capital Management, LLC | 28.052 | -16,35 | 2.392 | 1,44 | ||||
| 2026-02-17 | 13F | Jain Global LLC | Call | 1.000.000 | 0,00 | 85.280 | 21,26 | |||
| 2026-02-17 | 13F | Jain Global LLC | Put | 1.555.000 | 3,67 | 132.610 | 25,70 | |||
| 2026-02-04 | 13F | Aubrey Capital Management Ltd | 16.411 | -16,95 | 1.416 | 3,28 | ||||
| 2026-02-11 | 13F | Convergence Financial, LLC | 2.423 | -17,89 | 207 | -0,48 | ||||
| 2026-02-13 | 13F | Alerus Financial Na | 225 | 0,00 | 19 | 26,67 | ||||
| 2026-02-17 | 13F | Jain Global LLC | 31.014 | -42,37 | 2.645 | -30,13 | ||||
| 2026-02-17 | 13F | Trexquant Investment LP | 0 | -100,00 | 0 | |||||
| 2026-02-13 | 13F | Umb Bank N A/mo | 559 | 14,08 | 48 | 38,24 | ||||
| 2026-02-13 | 13F | BRITISH COLUMBIA INVESTMENT MANAGEMENT Corp | 252.946 | -37,63 | 21.878 | -23,24 | ||||
| 2026-02-13 | 13F | Sterling Capital Management LLC | 57.974 | 26,57 | 4.944 | 53,49 | ||||
| 2026-02-12 | 13F | Raiffeisen Bank International AG | 7.830 | -52,66 | 11.287 | -42,21 | ||||
| 2026-02-11 | 13F | Cedar Mountain Advisors, LLC | 200 | 0,00 | 17 | 21,43 | ||||
| 2025-11-14 | 13F | Royal Bank Of Canada | Put | 0 | -100,00 | 0 | -100,00 | |||
| 2025-11-14 | 13F | Royal Bank Of Canada | Call | 0 | -100,00 | 0 | -100,00 | |||
| 2026-04-06 | 13F | Highline Wealth Partners Llc | 58 | 152,17 | 6 | 400,00 | ||||
| 2026-02-10 | 13F | Kentucky Retirement Systems Insurance Trust Fund | 13.255 | 0,00 | 1.130 | 21,24 | ||||
| 2026-02-12 | 13F | MetLife Investment Management, LLC | 11.190 | -0,89 | 954 | 20,15 | ||||
| 2026-02-10 | 13F | Norges Bank | 4.950.857 | 426.477 | ||||||
| 2026-02-06 | 13F/A | Rathbone Brothers plc | 19.003 | -0,28 | 1.627 | 21,42 | ||||
| 2026-02-10 | 13F | CIBC World Markets Inc. | 19.156 | 5,06 | 1.634 | 27,38 | ||||
| 2026-01-29 | 13F | Pictet Asset Management Holding SA | 768.829 | -5,37 | 66.467 | 16,31 | ||||
| 2026-02-05 | 13F | North Dakota State Investment Board | 17.735 | 1.512 | ||||||
| 2025-11-12 | 13F | Creekmur Asset Management LLC | 1 | 0,00 | 0 | |||||
| 2026-02-13 | 13F | Charles Schwab Investment Management Inc | 529.791 | -4,83 | 45.181 | 15,40 | ||||
| 2026-02-10 | 13F | Private Wealth Asset Management, LLC | 5 | 0,00 | 0 | |||||
| 2026-02-13 | 13F | Ubs Asset Management Americas Inc | 1.303.835 | -4,46 | 111.191 | 15,85 | ||||
| 2026-02-20 | 13F | Sunbelt Securities, Inc. | 30 | 0,00 | 3 | 0,00 | ||||
| 2026-02-09 | 13F/A | Fideuram - Intesa Sanpaolo Private Banking S.p.a. | 35 | 3 | ||||||
| 2026-04-13 | 13F | IFP Advisors, Inc | 260.397 | 5,66 | 25.352 | 20,63 | ||||
| 2026-02-12 | 13F | Ensign Peak Advisors, Inc | 25.900 | 0,00 | 2.240 | 23,01 | ||||
| 2026-04-20 | 13F | Global Financial Private Client, LLC | 10.155 | 126,12 | 989 | 158,64 | ||||
| 2026-04-20 | 13F | LVW Advisors, LLC | 4.233 | 412 | ||||||
| 2026-02-17 | 13F | Guggenheim Capital Llc | 29.856 | 9,29 | 2.546 | 32,54 | ||||
| 2026-02-12 | 13F | Great Lakes Advisors, Llc | 4.117 | 351 | ||||||
| 2026-02-17 | 13F | Bramshill Investments, LLC | 20.147 | 48,41 | 1.718 | 80,08 | ||||
| 2026-01-23 | 13F | Burney Co/ | 36.600 | 3,01 | 3.121 | 24,94 | ||||
| 2026-04-13 | 13F | Fiduciary Financial Group, Llc | 4.422 | -17,70 | 431 | -6,11 | ||||
| 2026-01-22 | 13F | V-Square Quantitative Management LLC | 3.899 | 333 | ||||||
| 2026-02-06 | 13F | Global Retirement Partners, LLC | 471 | 454,12 | 40 | 700,00 | ||||
| 2026-02-03 | 13F | Crossmark Global Holdings, Inc. | 7.071 | 44,57 | 603 | 75,80 | ||||
| 2026-01-20 | 13F | Ascent Group, LLC | 12.371 | 19,60 | 1.055 | 45,12 | ||||
| 2026-02-12 | 13F | Principal Securities, Inc. | 0 | -100,00 | 0 | -100,00 | ||||
| 2026-02-13 | 13F | Pinnacle Wealth Planning Services, Inc. | 1.087 | 93 | ||||||
| 2026-01-21 | 13F/A | Euro Pacific Asset Management, LLC | 122.885 | 13,56 | 11 | 42,86 | ||||
| 2026-04-15 | 13F | Exchange Traded Concepts, Llc | 17.198 | -81,01 | 1.674 | -78,32 | ||||
| 2026-02-12 | 13F | BRYN MAWR TRUST Co | 103 | 930,00 | 9 | |||||
| 2026-02-03 | 13F | Ballentine Partners, LLC | 11.551 | -5,69 | 985 | 14,40 | ||||
| 2026-02-11 | 13F | Illinois Municipal Retirement Fund | 12.312 | 1.050 | ||||||
| 2026-04-14 | 13F | Zrc Wealth Management, Llc | 29 | 0,00 | 3 | 0,00 | ||||
| 2026-02-13 | 13F | Bank Of Nova Scotia | 85.231 | 45,29 | 7.268 | 76,19 | ||||
| 2026-02-17 | 13F | California State Teachers Retirement System | 31.350 | -1,78 | 2.674 | 19,12 | ||||
| 2026-02-10 | 13F | Bank of New York Mellon Corp | 1.324.786 | -0,08 | 112.978 | 21,16 | ||||
| 2026-02-17 | 13F | Weiss Asset Management LP | 9.071 | 774 | ||||||
| 2026-01-29 | 13F | Aprio Wealth Management, LLC | 3.047 | 0,36 | 260 | 21,60 | ||||
| 2026-02-12 | 13F | Alps Advisors Inc | 539.471 | 185,49 | 46.006 | 246,20 | ||||
| 2026-02-17 | 13F | Caption Management, LLC | 48.900 | 4.170 | ||||||
| 2026-02-10 | 13F | CIBC Asset Management Inc | 69.878 | 14,09 | 5.959 | 38,36 | ||||
| 2026-01-26 | 13F | Private Trust Co Na | 40 | 3 | ||||||
| 2026-03-03 | 13F/A | Caitong International Asset Management Co., Ltd | 3.462 | 295 | ||||||
| 2026-01-29 | 13F | Vanguard Group Inc | 23.001.047 | 1,11 | 1.979.174 | 24,52 | ||||
| 2026-02-05 | 13F | Cambridge Investment Research Advisors, Inc. | 6.319 | 20,55 | 1 | |||||
| 2026-02-17 | 13F | Caption Management, LLC | Put | 175.000 | 149,29 | 14.924 | 202,29 | |||
| 2026-02-12 | 13F | Wealthspire Advisors, LLC | 0 | -100,00 | 0 | |||||
| 2026-02-18 | 13F | Garton & Associates Financial Advisors LLC | 401 | 34 | ||||||
| 2026-01-27 | 13F | WealthCollab, LLC | 168 | 0,00 | 14 | 27,27 | ||||
| 2026-02-09 | 13F | Legal & General Group Plc | 4.942.807 | -3,78 | 426.354 | 18,00 | ||||
| 2026-02-11 | 13F | Allianz Asset Management GmbH | 958.538 | -15,49 | 81.744 | 2,48 | ||||
| 2026-02-04 | 13F | Argos Wealth Advisors, LLC | 3.209 | 274 | ||||||
| 2025-11-14 | 13F | Wetherby Asset Management Inc | 22.663 | -0,93 | 1.594 | 52,88 | ||||
| 2026-02-10 | 13F | Bnp Paribas Arbitrage, Sa | 66.603 | -15,69 | 5.680 | 2,23 | ||||
| 2026-02-13 | 13F | Toroso Investments, LLC | 18.827 | 21,41 | 1.606 | 47,25 | ||||
| 2026-02-18 | 13F | Mackenzie Financial Corp | 2.780.391 | -0,07 | 239.698 | 22,49 | ||||
| 2026-02-11 | 13F | Deutsche Bank Ag\ | 5.121.189 | 3,89 | 436.735 | 25,98 | ||||
| 2026-02-06 | 13F | Covestor Ltd | 2.818 | 67,64 | 0 | |||||
| 2026-02-13 | 13F | Citigroup Inc | 483.258 | -67,24 | 41.212 | -60,28 | ||||
| 2026-02-06 | 13F | GPS Wealth Strategies Group, LLC | 0 | -100,00 | 0 | |||||
| 2025-11-12 | 13F | Integrated Advisors Network LLC | 0 | -100,00 | 0 | -100,00 | ||||
| 2026-02-13 | 13F | 1832 Asset Management L.P. | 134.500 | 11.470 | ||||||
| 2026-02-12 | 13F | Bank Of Montreal /can/ | 151.255 | 21,69 | 12.899 | 76,07 | ||||
| 2026-04-21 | 13F | Financial Consulate, Inc | 75 | 167,86 | 7 | 250,00 | ||||
| 2026-01-20 | 13F | Cigna Investments Inc /new | 13.237 | -3,91 | 1 | |||||
| 2026-01-13 | 13F | Kathmere Capital Management, LLC | 4.188 | 41,68 | 357 | 72,46 | ||||
| 2026-04-16 | 13F | Diversified Trust Co | 51.592 | 57,25 | 5.023 | 79,55 | ||||
| 2026-02-17 | 13F | Amundi | 3.076.691 | -3,43 | 262.380 | 10,29 | ||||
| 2025-11-07 | 13F | Sierra Ocean, Llc | 0 | -100,00 | 0 | -100,00 | ||||
| 2026-04-09 | 13F | Towarzystwo Funduszy Inwestycyjnych Allianz Polska S.A. | 32.100 | 19,78 | 3.079 | 32,83 | ||||
| 2026-02-11 | 13F | Franklin Resources Inc | 2.012.801 | 8,85 | 171.971 | 32,45 | ||||
| 2025-10-21 | 13F | Optimum Investment Advisors | 500 | 35 | ||||||
| 2026-01-14 | 13F | ORG Partners LLC | 276 | 26,61 | 24 | 53,33 | ||||
| 2026-02-10 | 13F | Principia Wealth Advisory, LLC | 22 | 10,00 | 2 | 0,00 | ||||
| 2026-02-11 | 13F | Winton Capital Group Ltd | 5.300 | 452 | ||||||
| 2025-11-14 | 13F | Cubist Systematic Strategies, LLC | Call | 124.500 | 8.756 | |||||
| 2026-02-06 | 13F | Addison Advisors LLC | 27 | 2 | ||||||
| 2026-02-12 | 13F | JPL Wealth Management, LLC | 0 | -100,00 | 0 | |||||
| 2025-11-14 | 13F | Cubist Systematic Strategies, LLC | Put | 56.800 | 3.995 | |||||
| 2026-02-06 | 13F | HighTower Advisors, LLC | 5.712 | -74,44 | 487 | -69,00 | ||||
| 2026-02-17 | 13F | Virtus Investment Advisers, Inc. | 1.807 | 154 | ||||||
| 2026-01-15 | 13F | Nisa Investment Advisors, Llc | 116.796 | 66,37 | 9.960 | 101,74 | ||||
| 2026-01-28 | 13F | Arizona State Retirement System | 0 | -100,00 | 0 | |||||
| 2026-02-17 | 13F | Man Group plc | 1.363.527 | 113,94 | 116.282 | 159,42 | ||||
| 2026-01-26 | 13F | Cwm, Llc | 3.743 | 20,20 | 0 | |||||
| 2026-02-09 | 13F | Cary Street Partners Financial Llc | 1.945 | 166 | ||||||
| 2026-02-06 | 13F | Lsv Asset Management | 0 | -100,00 | 0 | -100,00 | ||||
| 2026-01-30 | 13F | Sigma Planning Corp | 4.463 | -31,21 | 381 | -16,67 | ||||
| 2026-02-18 | 13F | Caitlin John, LLC | 950 | -7,32 | 81 | 12,50 | ||||
| 2026-04-10 | 13F | Quaker Wealth Management, LLC | 12 | -98,68 | 1 | -98,70 | ||||
| 2026-04-20 | 13F | Segment Wealth Management, LLC | 14.730 | 13,88 | 1.434 | 30,01 | ||||
| 2026-02-13 | 13F | National Bank Of Canada /fi/ | 28.225 | -94,71 | 2.406 | -93,59 | ||||
| 2026-02-13 | 13F | Royal London Asset Management Ltd | 503.683 | -1,19 | 42.954 | 19,81 | ||||
| 2026-01-21 | 13F | Yousif Capital Management, Llc | 13.570 | 1,28 | 1.450 | 53,82 | ||||
| 2026-02-13 | 13F | Walleye Trading LLC | Call | 194.300 | -52,87 | 16.570 | -42,86 | |||
| 2026-02-12 | 13F | SWAN Capital LLC | 60 | 0,00 | 5 | 25,00 | ||||
| 2026-02-13 | 13F | Walleye Trading LLC | Put | 424.900 | -25,76 | 36.235 | -9,97 | |||
| 2026-02-13 | 13F | BNP Paribas Asset Management Holding S.A. | 292.390 | 419 | ||||||
| 2026-02-12 | 13F | Advisors Asset Management, Inc. | 16.069 | 41,09 | 1.370 | 71,25 | ||||
| 2026-02-13 | 13F | Korea Investment CORP | 201.830 | 2,78 | 17.456 | 26,38 | ||||
| 2025-11-10 | 13F | Citigroup Inc | Put | 0 | -100,00 | 0 | -100,00 | |||
| 2026-02-09 | 13F | Geode Capital Management, Llc | 4.684.560 | 29,78 | 419.256 | 65,14 | ||||
| 2026-04-08 | 13F | Wealth Enhancement Trust Services, Inc. | 418 | 43,15 | 41 | 66,67 | ||||
| 2026-02-13 | 13F | SRS Capital Advisors, Inc. | 413 | -47,98 | 35 | -36,36 | ||||
| 2025-11-13 | 13F | Renaissance Technologies Llc | 0 | -100,00 | 0 | |||||
| 2026-01-28 | 13F | Teacher Retirement System Of Texas | 742.930 | 0,00 | 63.357 | 21,26 | ||||
| 2026-02-06 | 13F | Leonteq Securities AG | 14.045 | 1.198 | ||||||
| 2026-01-12 | 13F | CVA Family Office, LLC | 138 | 48,39 | 12 | 83,33 | ||||
| 2026-04-15 | 13F | Generali Investments CEE, investicni spolecnost, a.s. | 24.030 | -1,42 | 2.338 | 12,09 | ||||
| 2026-02-12 | 13F | Brinker Capital Investments, LLC | 16.848 | 1,36 | 1.437 | 22,95 | ||||
| 2026-02-18 | 13F/A | Empowered Funds, LLC | 109.211 | 104,52 | 9.314 | 148,02 | ||||
| 2026-04-16 | 13F | Everstar Asset Management, LLC | 4.750 | -45,71 | 462 | -38,07 | ||||
| 2026-02-11 | 13F | Meeder Asset Management Inc | 16.593 | 229,10 | 1.415 | 299,72 | ||||
| 2026-02-12 | 13F | Integrated Quantitative Investments LLC | 4.347 | 0,00 | 371 | 21,31 | ||||
| 2026-02-13 | 13F | Victory Capital Management Inc | 16.247 | -48,32 | 1.386 | -37,36 | ||||
| 2026-04-06 | 13F | GAMMA Investing LLC | 4.819 | 20,51 | 469 | 37,54 | ||||
| 2026-01-29 | 13F | Rakuten Securities, Inc. | 3.436 | -48,35 | 293 | -37,26 | ||||
| 2026-02-13 | 13F | Neuberger Berman Group LLC | 62.620 | 24,57 | 5.375 | 52,02 | ||||
| 2026-02-13 | 13F | Dynamic Technology Lab Private Ltd | 8.281 | -34,18 | 706 | -20,23 | ||||
| 2025-11-14 | 13F | Centiva Capital, LP | 0 | -100,00 | 0 | -100,00 | ||||
| 2026-02-03 | 13F | Chesapeake Capital Corp /il/ | 14.472 | 0,00 | 1.234 | 21,34 | ||||
| 2026-02-12 | 13F | Xxi Wealth, Llc | 3.587 | 306 | ||||||
| 2026-02-17 | 13F | Lazard Asset Management Llc | 598.865 | -10,29 | 51.098 | 8,84 | ||||
| 2026-02-17 | 13F | Principal Street Partners, LLC | 0 | -100,00 | 0 | |||||
| 2026-02-10 | 13F | Dynasty Wealth Management, Llc | 2.914 | -7,49 | 249 | 12,22 | ||||
| 2026-02-10 | 13F | Machina Capital S.a.s. | 3.951 | 33,16 | 337 | 61,54 | ||||
| 2026-02-09 | 13F | Cary Street Partner Investment Advisory Llc | 652 | 56 | ||||||
| 2025-11-14 | 13F | Schonfeld Strategic Advisors LLC | 0 | -100,00 | 0 | |||||
| 2026-02-04 | 13F | Oxbow Advisors, LLC | 11.458 | -36,37 | 977 | -22,83 | ||||
| 2026-02-12 | 13F | Barometer Capital Management Inc. | 99.139 | 523,52 | 12.336 | 1.003,31 | ||||
| 2026-02-17 | 13F | Creative Planning | 18.712 | 3,87 | 1.596 | 25,99 | ||||
| 2026-02-05 | 13F | Gamco Investors, Inc. Et Al | 94.793 | -11,86 | 8.084 | 6,88 | ||||
| 2026-02-13 | 13F | Barclays Plc | 2.225.560 | -27,44 | 189.796 | -12,02 | ||||
| 2026-02-17 | 13F | Old Mission Capital Llc | 12.273 | 1.063 | ||||||
| 2026-04-15 | 13F | Eleva Capital SAS | 0 | -100,00 | 0 | |||||
| 2026-01-23 | 13F | Private Wealth Management Group, LLC | 84 | 0,00 | 7 | 40,00 | ||||
| 2026-02-10 | 13F | Rothschild Investment Llc | 86 | 196,55 | 7 | 250,00 | ||||
| 2025-11-12 | 13F | Headlands Technologies LLC | 0 | -100,00 | 0 | -100,00 | ||||
| 2026-04-10 | 13F | Lifestyle Asset Management, Inc. | 3.997 | 389 | ||||||
| 2026-04-20 | 13F | Kestra Private Wealth Services, Llc | 11.320 | -15,24 | 1.102 | -3,25 | ||||
| 2026-02-13 | 13F | Ingalls & Snyder Llc | 5.901 | -1,65 | 1 | |||||
| 2026-02-17 | 13F | Royal Bank Of Canada | 530.698 | -21,13 | 45.258 | -4,37 | ||||
| 2026-04-08 | 13F | Wealth Enhancement Advisory Services, Llc | 337.311 | -25,86 | 22.113 | -48,14 | ||||
| 2026-01-20 | 13F | Global Trust Asset Management, LLC | 700 | -36,36 | 60 | -23,38 | ||||
| 2026-04-08 | 13F | NorthCrest Asset Manangement, LLC | 118.847 | 1.962,96 | 12.030 | 2.263,26 | ||||
| 2026-02-09 | 13F | Employees Retirement System of Texas | 32.759 | 0,00 | 3 | 0,00 | ||||
| 2026-02-12 | 13F | Ci Investments Inc. | 114.354 | -17,44 | 9.752 | 108.255,56 | ||||
| 2026-02-02 | 13F | Benjamin Edwards Inc | 0 | -100,00 | 0 | |||||
| 2026-02-14 | 13F | Rockefeller Capital Management L.P. | 8.869 | -25,25 | 756 | -9,35 | ||||
| 2026-02-13 | 13F | MAI Capital Management | 167 | -36,26 | 14 | -22,22 | ||||
| 2025-11-14 | 13F | LMR Partners LLP | Call | 0 | -100,00 | 0 | -100,00 | |||
| 2026-02-12 | 13F | BlackRock, Inc. | 26.570.482 | -2,81 | 2.265.931 | 17,85 | ||||
| 2026-04-09 | 13F | TrueWealth Advisors, LLC | 4.207 | -66,90 | 410 | -62,23 | ||||
| 2025-11-14 | 13F | LMR Partners LLP | Put | 0 | -100,00 | 0 | -100,00 | |||
| 2026-02-17 | 13F | SIH Partners, LLLP | 14.703 | 0,00 | 1.254 | 21,18 | ||||
| 2026-02-11 | 13F | Prudential Plc | 13.477 | -10,31 | 116.567 | 10.938,45 | ||||
| 2026-02-09 | 13F | Themes Management Co LLC | 16.561 | 1.412 | ||||||
| 2026-02-13 | 13F | First Trust Advisors Lp | 291.024 | -24,40 | 24.912 | -7,96 | ||||
| 2026-02-13 | 13F | Morgan Stanley | 2.038.986 | 27,01 | 173.885 | 54,01 | ||||
| 2026-04-03 | 13F | Investors Research Corp | 25 | 0,00 | 2 | 0,00 | ||||
| 2026-02-12 | 13F | denkapparat Operations GmbH | 4.142 | 0,00 | 353 | 21,31 | ||||
| 2026-02-17 | 13F | Raymond James Financial Inc | 15.327 | -71,59 | 1.307 | -65,55 | ||||
| 2025-11-14 | 13F | Merk Investments LLC | 0 | -100,00 | 0 | |||||
| 2026-02-17 | 13F | DZ BANK AG Deutsche Zentral Genossenschafts Bank, Frankfurt am Main | 0 | -100,00 | 0 | |||||
| 2025-11-14 | 13F | Walleye Capital LLC | 0 | -100,00 | 0 | -100,00 | ||||
| 2026-02-03 | 13F | SBI Securities Co., Ltd. | 9.243 | 80,04 | 788 | 118,28 | ||||
| 2026-02-10 | 13F | Acadian Asset Management Llc | 4.601.227 | 9,57 | 392 | 32,88 | ||||
| 2026-02-24 | 13F | Astoria Portfolio Advisors LLC. | 3.125 | 379 | ||||||
| 2026-02-17 | 13F | Jones Financial Companies Lllp | 1.813 | 83,13 | 155 | 129,85 | ||||
| 2026-02-10 | 13F | Savant Capital, LLC | 25.434 | 9,68 | 2.169 | 33,07 | ||||
| 2026-02-12 | 13F | Jane Street Group, Llc | 190.258 | 133,63 | 16.225 | 183,31 | ||||
| 2026-02-12 | 13F | Jane Street Group, Llc | Call | 72.500 | 62,19 | 6.183 | 96,69 | |||
| 2026-03-20 | 13F/A | Hsbc Holdings Plc | Put | 17.500 | 1.505 | |||||
| 2026-02-12 | 13F | Jane Street Group, Llc | Put | 1.209.800 | 0,63 | 103.172 | 22,02 | |||
| 2026-03-20 | 13F/A | Hsbc Holdings Plc | 29.348 | -53,00 | 2.524 | -41,96 | ||||
| 2026-02-05 | 13F | Atria Investments Llc | 3.428 | -5,41 | 292 | 14,96 | ||||
| 2025-11-14 | 13F | Twinbeech Capital Lp | 0 | -100,00 | 0 | -100,00 | ||||
| 2026-01-23 | 13F | Lester Murray Antman dba SimplyRich | 13.529 | 0,00 | 1 | |||||
| 2026-01-30 | 13F | Mitsubishi UFJ Trust & Banking Corp | 34.220 | 4.292,81 | 2.987 | 5.429,63 | ||||
| 2026-01-30 | 13F | Precision Wealth Strategies, LLC | 10.176 | 17,22 | 868 | 42,13 | ||||
| 2026-02-13 | 13F | Bridgewater Associates, LP | 822.908 | 253,55 | 70.178 | 328,72 | ||||
| 2026-04-16 | 13F | Ellsworth Advisors, LLC | 77.878 | -1,22 | 7.582 | -2,41 | ||||
| 2026-01-26 | 13F | Mirae Asset Global Investments Co., Ltd. | 3.664 | 280,08 | 312 | 365,67 | ||||
| 2026-04-20 | 13F | Assenagon Asset Management S.A. | 12.068 | 22,79 | 1.158 | 36,12 | ||||
| 2026-01-29 | 13F | Ashton Thomas Private Wealth, LLC | 41.606 | -49,84 | 3.548 | -39,17 | ||||
| 2026-02-06 | 13F | Larson Financial Group LLC | 899 | 279,32 | 77 | 375,00 | ||||
| 2026-02-09 | 13F | Allen Capital Group, LLC | 2.564 | 219 | ||||||
| 2026-02-11 | 13F | Metis Global Partners, LLC | 32.490 | -9,66 | 2.771 | 9,53 | ||||
| 2026-02-12 | 13F | Marex Group plc | 119.064 | -10,25 | 10.154 | 9,02 | ||||
| 2025-11-14 | 13F | Scientech Research LLC | 0 | -100,00 | 0 | -100,00 | ||||
| 2026-02-11 | 13F | United Financial Planning Group LLC | 13 | 1 | ||||||
| 2026-04-17 | 13F | AdvisorNet Financial, Inc | 49 | 4,26 | 5 | 0,00 | ||||
| 2026-04-07 | 13F | Signaturefd, Llc | Call | 400 | 5 | |||||
| 2026-04-07 | 13F | Abacus Planning Group, Inc. | 0 | -100,00 | 0 | |||||
| 2026-04-13 | 13F | E Fund Management Co., Ltd. | 17.747 | 1.728 | ||||||
| 2026-02-10 | 13F | Goldman Sachs Group Inc | 2.812.826 | 26,13 | 239.878 | 52,94 | ||||
| 2026-02-17 | 13F | ClearAlpha Technologies LP | 2.713 | 231 | ||||||
| 2026-02-06 | 13F | Gsa Capital Partners Llp | 0 | -100,00 | 0 | -100,00 | ||||
| 2026-02-10 | 13F | Goldman Sachs Group Inc | Put | 12.500 | -87,70 | 1.066 | -85,08 | |||
| 2026-02-17 | 13F | Agf Management Ltd | 39.607 | 3.378 | ||||||
| 2026-04-16 | 13F | Vaughan Nelson Investment Management, L.p. | 0 | -100,00 | 0 | |||||
| 2026-02-02 | 13F | Danske Bank A/s | 10.200 | 0,00 | 870 | 21,20 | ||||
| 2026-02-05 | 13F | AlphaCore Capital LLC | 4.121 | 0,68 | 351 | 22,30 | ||||
| 2026-01-27 | 13F | Ninety One UK Ltd | 1.988.304 | -1,54 | 169.563 | 19,39 | ||||
| 2026-02-13 | 13F | Barclays Plc | Put | 0 | -100,00 | 0 | -100,00 | |||
| 2026-02-13 | 13F | Atlas Capital Advisors Llc | 3.219 | 11,62 | 275 | 109,16 | ||||
| 2025-11-06 | 13F | Abich Financial Wealth Management LLC | 6.634 | 467 | ||||||
| 2026-02-17 | 13F | Two Sigma Investments, Lp | 91.316 | 0,00 | 7.787 | 21,26 | ||||
| 2026-02-13 | 13F | Sei Investments Co | 645.571 | 1,03 | 55.055 | 22,50 | ||||
| 2025-11-13 | 13F | Pinpoint Asset Management (Singapore) Pte. Ltd. | 0 | -100,00 | 0 | -100,00 | ||||
| 2026-04-14 | 13F | Nbc Securities, Inc. | 300 | -7,69 | 29 | 7,41 | ||||
| 2026-02-06 | 13F | Pnc Financial Services Group, Inc. | 10.856 | 13,10 | 926 | 37,04 | ||||
| 2026-01-30 | 13F | Us Bancorp \de\ | 46.710 | -0,34 | 3.983 | 20,84 | ||||
| 2026-02-17 | 13F | Seldon Capital Lp | 3.993 | 0,00 | 341 | 21,43 | ||||
| 2026-02-13 | 13F | Parkside Financial Bank & Trust | 157 | 149,21 | 13 | 225,00 | ||||
| 2026-02-17 | 13F | Snowden Capital Advisors LLC | 5.500 | 24,41 | 469 | 51,29 | ||||
| 2026-01-29 | 13F | Concurrent Investment Advisors, LLC | 19.289 | 1.645 | ||||||
| 2026-02-13 | 13F | Transamerica Financial Advisors, Inc. | 15 | 1 | ||||||
| 2026-02-17 | 13F | Millennium Management Llc | Put | 251.000 | 0,32 | 21.405 | 21,65 | |||
| 2026-02-11 | 13F | Los Angeles Capital Management Llc | 0 | -100,00 | 0 | |||||
| 2026-03-31 | 13F | Sankala Group LLC | 84 | 0,00 | 7 | -30,00 | ||||
| 2026-02-17 | 13F | Millennium Management Llc | 379.697 | 126,56 | 32.381 | 174,73 | ||||
| 2025-11-14 | 13F | Wolverine Trading, Llc | 22.885 | 36,84 | 1.586 | 116,23 | ||||
| 2025-11-14 | 13F | Wolverine Trading, Llc | Call | 95.500 | -7,46 | 6.617 | 46,14 | |||
| 2025-11-14 | 13F | Wolverine Trading, Llc | Put | 88.700 | 47,34 | 6.146 | 132,71 | |||
| 2026-02-17 | 13F | Northern Trust Corp | 1.205.223 | -2,37 | 102.781 | 18,39 | ||||
| 2026-02-13 | 13F | FORA Capital, LLC | 2.629 | 224 | ||||||
| 2026-02-05 | 13F | Bessemer Group Inc | 259 | 46,33 | 0 | |||||
| 2026-02-18 | 13F | Vident Advisory, LLC | 90.582 | 166,47 | 7.725 | 223,18 | ||||
| 2026-02-05 | 13F | Gabelli Funds Llc | 473.773 | -23,84 | 40.403 | -7,65 | ||||
| 2026-02-17 | 13F | Wellington Management Group Llp | 963.495 | 43,22 | 82.466 | 74,30 | ||||
| 2026-02-17 | 13F | Orion Resource Partners LP | 25.648 | 2.187 | ||||||
| 2026-01-28 | 13F | Ruffer LLP | 320.997 | -45,68 | 27.417 | -34,03 | ||||
| 2026-02-17 | 13F | DV Trading LLC | 800 | 68 | ||||||
| 2026-02-17 | 13F | Quantinno Capital Management LP | 102.992 | 36,72 | 8.783 | 65,78 | ||||
| 2026-02-13 | 13F | Smartleaf Asset Management LLC | 2.738 | 257,91 | 237 | 345,28 | ||||
| 2026-01-15 | 13F | Allspring Global Investments Holdings, LLC | 618.790 | -0,04 | 52.968 | 19,39 | ||||
| 2026-02-12 | 13F | Swiss National Bank | 1.101.344 | -2,99 | 95.159 | 19,40 | ||||
| 2026-01-22 | 13F | Lesa Sroufe & Co | 86.910 | 1,18 | 7 | 16,67 | ||||
| 2026-02-12 | 13F | Voya Investment Management Llc | 75.655 | -6,69 | 6.497 | 13,92 | ||||
| 2026-02-17 | 13F | Clear Street Markets Llc | 1.700 | 142,86 | 145 | 193,88 | ||||
| 2026-02-17 | 13F | Hartree Partners, LP | 7.500 | 640 | ||||||
| 2025-11-13 | 13F | Glenmede Investment Management, LP | 3.884 | 273 | ||||||
| 2026-04-17 | 13F | RFG Advisory, LLC | 12.817 | -12,15 | 1.248 | 0,24 | ||||
| 2026-02-12 | 13F | CIBC Private Wealth Group, LLC | 576 | -3,84 | 49 | 16,67 | ||||
| 2026-04-10 | 13F | Linden Thomas Advisory Services, LLC | 3.733 | 4,51 | 363 | 19,41 | ||||
| 2026-04-21 | 13F | SmartHarvest Portfolios, LLC | 7.707 | -0,84 | 750 | 13,29 | ||||
| 2026-02-09 | 13F | Strategic Financial Concepts, LLC | 3.560 | -87,35 | 304 | 944,83 | ||||
| 2026-02-17 | 13F | Qube Research & Technologies Ltd | 12.782 | 1.090 | ||||||
| 2026-04-09 | 13F | Whitaker-Myers Wealth Managers, LTD. | 0 | -100,00 | 0 | |||||
| 2026-02-17 | 13F | Oaktree Capital Management Lp | 3.847.991 | -8,06 | 328.157 | 11,49 | ||||
| 2026-01-29 | 13F | UBS Group AG | Put | 600 | 0,00 | 51 | 21,43 | |||
| 2026-01-29 | 13F | UBS Group AG | Call | 300 | 0,00 | 26 | 19,05 | |||
| 2026-04-13 | 13F | True Wealth Design, LLC | 58 | 7,41 | 6 | 25,00 | ||||
| 2026-01-29 | 13F | UBS Group AG | 851.344 | 86,58 | 72.603 | 126,24 | ||||
| 2026-02-11 | 13F | Janney Montgomery Scott LLC | 7.041 | 68,65 | 1 | |||||
| 2026-02-17 | 13F | Bank Of America Corp /de/ | Put | 0 | -100,00 | 0 | ||||
| 2026-04-17 | 13F | Bell Investment Advisors, Inc | 315 | 12,50 | 31 | 30,43 | ||||
| 2026-01-29 | 13F | IMC-Chicago, LLC | 36.280 | 3.094 | ||||||
| 2026-02-18 | 13F | EP Wealth Advisors, Inc. | 4.300 | 367 | ||||||
| 2026-02-12 | 13F | Brown Brothers Harriman & Co | 85 | 0,00 | 7 | 40,00 | ||||
| 2026-01-21 | 13F | SJS Investment Consulting Inc. | 47 | -17,54 | 4 | 0,00 | ||||
| 2026-01-21 | 13F | Flagship Harbor Advisors, Llc | 0 | -100,00 | 0 | |||||
| 2026-02-09 | 13F | Keating Financial Advisory Services, Inc. | 172 | 15 | ||||||
| 2026-04-13 | 13F | Massmutual Trust Co Fsb/adv | 1.058 | -17,15 | 103 | -4,63 | ||||
| 2026-04-20 | 13F | Up Capital Management, Inc. | 0 | -100,00 | 0 | |||||
| 2026-04-20 | 13F | Banque Cantonale Vaudoise | 27.795 | 0,93 | 2.667 | 11,96 | ||||
| 2026-04-06 | 13F | Versant Capital Management, Inc | 527 | 129,13 | 51 | 168,42 | ||||
| 2026-02-17 | 13F | MIRAE ASSET GLOBAL ETFS HOLDINGS Ltd. | 557.872 | -6,14 | 47.575 | 13,81 | ||||
| 2026-04-13 | 13F | Hm Payson & Co | 350 | -65,00 | 34 | -60,00 | ||||
| 2026-01-27 | 13F | Ninety One SA (PTY) Ltd | 15.960.934 | -10,91 | 1.380.472 | 9,54 | ||||
| 2026-02-03 | 13F | Drucker Wealth 3.0, LLC | 2.973 | -1,10 | 254 | 19,91 | ||||
| 2026-02-17 | 13F | Captrust Financial Advisors | 2.860 | 244 | ||||||
| 2026-02-13 | 13F | USS Investment Management Ltd | 954.291 | -4,93 | 81.372 | 15,28 | ||||
| 2026-01-29 | 13F | D.a. Davidson & Co. | 7.162 | 611 | ||||||
| 2026-02-17 | 13F | Sig Brokerage, Lp | Call | 0 | -100,00 | 0 | ||||
| 2026-02-12 | 13F | Groupe la Francaise | 190.000 | -3,55 | 16.194 | 16,79 | ||||
| 2026-04-14 | 13F | Drive Wealth Management, Llc | 8.598 | -1,84 | 837 | 12,20 | ||||
| 2026-02-12 | 13F | Aviva Plc | 600.340 | -1,31 | 51.963 | 21,61 | ||||
| 2026-02-17 | 13F | Balyasny Asset Management Llc | 3.407 | 291 | ||||||
| 2026-01-27 | 13F/A | Capital Performance Advisors Llp | 3.627 | -6,71 | 309 | 13,19 | ||||
| 2026-04-16 | 13F | SG Americas Securities, LLC | 148.140 | 140,26 | 14 | 180,00 | ||||
| 2026-02-10 | 13F | Globeflex Capital L P | 2.335 | 0,00 | 199 | 21,34 | ||||
| 2026-02-13 | 13F | Arrowstreet Capital, Limited Partnership | 6.288.253 | 406,89 | 539.119 | 518,00 | ||||
| 2026-02-17 | 13F | Coastal Bridge Advisors, LLC | 5.067 | 0,00 | 432 | 21,35 | ||||
| 2026-02-12 | 13F | Dimensional Fund Advisors Lp | 1.638.541 | 2,64 | 139.797 | 24,57 | ||||
| 2026-01-27 | 13F | Zurcher Kantonalbank (Zurich Cantonalbank) | 279.698 | 2,98 | 23.853 | 24,87 | ||||
| 2026-02-17 | 13F | Glenmede Trust Co Na | 4.424 | 377 | ||||||
| 2026-02-13 | 13F | Evelyn Partners Investment Management LLP | 500 | -20,38 | 43 | -4,55 | ||||
| 2025-11-14 | 13F | Gen-Wealth Partners Inc | 0 | -100,00 | 0 | -100,00 | ||||
| 2026-04-07 | 13F | Signaturefd, Llc | 5.629 | -3,27 | 548 | 10,48 | ||||
| 2026-02-17 | 13F | Artisan Partners Limited Partnership | 840.190 | -5,00 | 71.651 | 15,19 | ||||
| 2026-01-29 | 13F | Quent Capital, LLC | 296 | 260,98 | 25 | 400,00 | ||||
| 2026-02-17 | 13F | Maryland State Retirement & Pension System | 25.386 | 0,00 | 2.165 | 21,23 | ||||
| 2026-02-17 | 13F | Worldquant Millennium Advisors Llc | 0 | -100,00 | 0 | |||||
| 2026-02-17 | 13F | Keebeck Wealth Management, LLC | 0 | -100,00 | 0 | |||||
| 2026-01-30 | 13F | Bogart Wealth, LLC | 24 | 140,00 | 2 | |||||
| 2025-11-13 | 13F | Macquarie Group Ltd | 0 | -100,00 | 0 | -100,00 | ||||
| 2026-02-12 | 13F | Commonwealth Equity Services, Llc | 29.850 | -88,49 | 2.546 | 14.038,89 | ||||
| 2026-02-06 | 13F | Sierra Summit Advisors Llc | 0 | -100,00 | 0 | |||||
| 2026-02-05 | 13F | Abacus Wealth Partners, LLC | 8.201 | 699 | ||||||
| 2026-04-08 | 13F | E Fund Management (Hong Kong) Co., Ltd. | 17.747 | 1.728 | ||||||
| 2026-02-12 | 13F | Callan Family Office, LLC | 6.099 | 520 | ||||||
| 2026-02-17 | 13F | Alliancebernstein L.p. | 274.474 | 19,73 | 23.407 | 45,19 | ||||
| 2026-02-13 | 13F | Mml Investors Services, Llc | 39.767 | 18,42 | 3.391 | 43,63 | ||||
| 2026-04-14 | 13F | USA Financial Portformulas Corp | 1.736 | -18,50 | 169 | -6,63 | ||||
| 2026-02-02 | 13F | Hussman Strategic Advisors, Inc. | 18.300 | 19,61 | 1.561 | 44,98 | ||||
| 2026-02-02 | 13F | Oppenheimer & Co Inc | 20.355 | 13,30 | 1.736 | 37,37 | ||||
| 2026-02-17 | 13F | Capstone Investment Advisors, Llc | 0 | -100,00 | 0 | -100,00 | ||||
| 2026-01-26 | 13F | PDS Planning, Inc | 4.246 | 3,01 | 362 | 25,26 | ||||
| 2026-04-16 | 13F | Polianta Ltd | 15.500 | -12,43 | 2 | 0,00 | ||||
| 2025-11-14 | 13F | Mount Yale Investment Advisors, LLC | 0 | -100,00 | 0 | |||||
| 2026-02-11 | 13F | Ramirez Asset Management, Inc. | 70.575 | 6.019 | ||||||
| 2026-02-12 | 13F | Nuveen, LLC | 1.829.267 | -3,60 | 157.126 | 17,72 | ||||
| 2026-02-06 | 13F | Profund Advisors Llc | 43.553 | -16,73 | 3.714 | 0,98 | ||||
| 2026-02-17 | 13F | EFG International AG | 227 | 19 |