Grundlæggende statistik
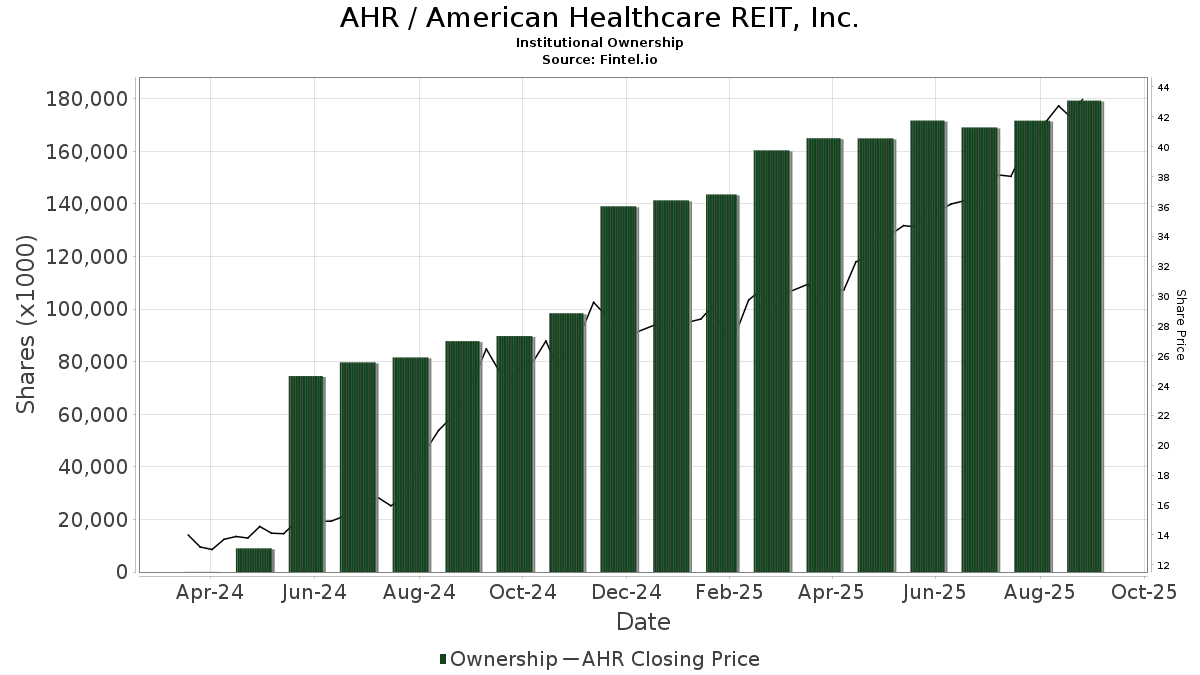
| Institutionelle aktier (lange) | 174.532.523 - 92,82% (ex 13D/G) - change of -6,54MM shares -3,61% MRQ |
| Institutionel værdi (lang) | $ 8.074.628 USD ($1000) |
Institutionelt ejerskab og aktionærer
American Healthcare REIT, Inc. (US:AHR) har 531 institutionelle ejere og aktionærer, der har indsendt 13D/G- eller 13F-formularer til Securities Exchange Commission (SEC). Disse institutioner har i alt 174,532,523 aktier. Største aktionærer omfatter Vanguard Group Inc, BlackRock, Inc., Wellington Management Group Llp, Principal Financial Group Inc, State Street Corp, Royal Bank Of Canada, Invesco Ltd., Geode Capital Management, Llc, Fmr Llc, and Alliancebernstein L.p. .
American Healthcare REIT, Inc. (NYSE:AHR) institutionel ejerskabsstruktur viser aktuelle positioner i virksomheden efter institutioner og fonde, samt seneste ændringer i positionsstørrelse. Større aktionærer kan omfatte individuelle investorer, investeringsforeninger, hedgefonde eller institutioner. Skema 13D angiver, at investoren besidder (eller besidder) mere end 5 % af virksomheden og har til hensigt (eller har til hensigt at) aktivt at forfølge en ændring i forretningsstrategi. Skema 13G indikerer en passiv investering på over 5%.
The share price as of April 10, 2026 is 49,23 / share. Previously, on April 14, 2025, the share price was 29,92 / share. This represents an increase of 64,54% over that period.
Fondens stemningsscore
Fund Sentiment Score (fka Ownership Accumulation Score) finder de aktier, der bliver mest købt af fonde. Det er resultatet af en sofistikeret, multi-faktor kvantitativ model, der identificerer virksomheder med de højeste niveauer af institutionel akkumulering. Scoringsmodellen bruger en kombination af den samlede stigning i oplyste ejere, ændringerne i porteføljeallokeringer i disse ejere og andre målinger. Tallet går fra 0 til 100, hvor højere tal indikerer et højere niveau af akkumulering for sine jævnaldrende, og 50 er gennemsnittet.
Opdateringsfrekvens: Dagligt
Se Ownership Explorer, som giver en liste over højest rangerende virksomheder.
AI+ Ask Fintel’s AI assistant about American Healthcare REIT, Inc..
Select a question to share a public post with an AI-crafted answer.
Thinking of good questions…
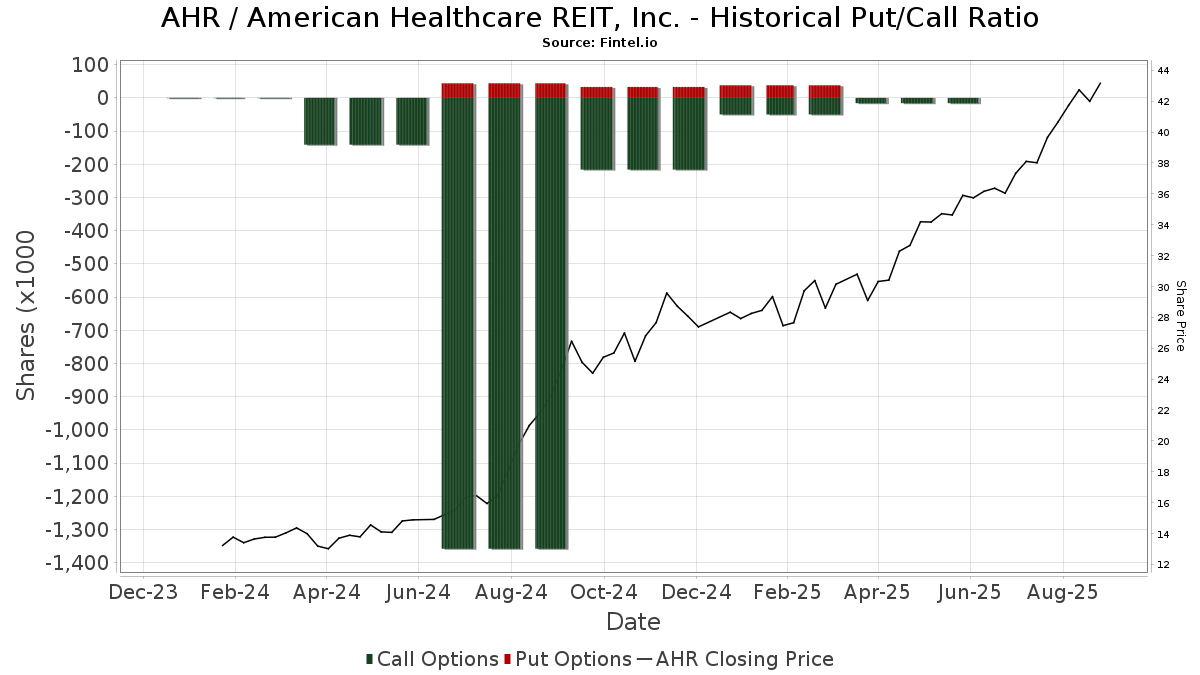
Institutionel Put/Call-forhold
Ud over at indberette standardaktie- og gældsudstedelser skal institutter med mere end 100 mill. aktiver under forvaltning også oplyse deres put- og call-optionsbeholdninger. Da salgsoptioner generelt indikerer negativ stemning, og købsoptioner indikerer positiv stemning, kan vi få en fornemmelse af den overordnede institutionelle stemning ved at plotte forholdet mellem put og kald. Diagrammet til højre viser det historiske put/call-forhold for dette instrument.
Brug af Put/Call Ratio som en indikator for investorernes stemning overvinder en af de vigtigste mangler ved at bruge totalt institutionelt ejerskab, som er, at en betydelig mængde af aktiver under forvaltning investeres passivt for at spore indekser. Passivt forvaltede fonde køber typisk ikke optioner, så indikatoren for put/call-forholdet følger mere nøje følelsen af aktivt forvaltede fonde.
13D/G-arkivering
Vi præsenterer 13D/G ansøgninger separat fra 13F ansøgninger på grund af den forskellige behandling af SEC. 13D/G-ansøgninger kan indgives af grupper af investorer (med én ledende), hvorimod 13F-ansøgninger ikke kan. Dette resulterer i situationer, hvor en investor kan indsende en 13D/G, der rapporterer én værdi for de samlede aktier (der repræsenterer alle de aktier, der ejes af investorgruppen), men derefter indsender en 13F, der rapporterer en anden værdi for de samlede aktier (der udelukkende repræsenterer deres egne) ejendomsret). Det betyder, at aktieejerskab af 13D/G-arkiver og 13F-arkiveringer ofte ikke er direkte sammenlignelige, så vi præsenterer dem separat.
Bemærk: Fra den 16. maj 2021 viser vi ikke længere ejere, der ikke har indsendt en 13D/G inden for det seneste år. Tidligere viste vi den fulde historie af 13D/G-arkiver. Generelt skal enheder, der er forpligtet til at indgive 13D/G-ansøgninger, indgive mindst årligt, før de indsender en afsluttende ansøgning. Dog forlader fonde nogle gange positioner uden at indsende en afsluttende ansøgning (dvs. de afvikler), så visning af den fulde historie resulterede nogle gange i forvirring om det nuværende ejerskab. For at undgå forvirring viser vi nu kun 'aktuelle' ejere - det vil sige - ejere, der har anmeldt inden for det seneste år.
Upgrade to unlock premium data.
| Fil dato | Form | Investor | Forrige Aktier |
Seneste Aktier |
Δ Aktier (Procent) |
Ejendomsret (Procent) |
Δ Ejerskab (Procent) |
|
|---|---|---|---|---|---|---|---|---|
| 2026-02-13 | ROYAL BANK OF CANADA | 9,315,002 | 5.00 | |||||
| 2026-02-10 | WELLINGTON MANAGEMENT GROUP LLP | 8,658,610 | 7,922,818 | -8.50 | 4.30 | -15.69 | ||
| 2026-02-06 | PRINCIPAL REAL ESTATE INVESTORS LLC | 8,505,227 | 6,292,783 | -26.01 | 3.40 | -35.85 | ||
| 2026-02-06 | BlackRock, Inc. | 15,115,566 | 24,609,199 | 62.81 | 13.20 | 33.33 | ||
| 2025-07-29 | VANGUARD GROUP INC | 18,795,192 | 22,917,930 | 21.94 | 14.36 | 20.47 |
13F og NPORT arkivering
Detaljer om 13F-arkivering er gratis. Detaljer om NP-ansøgninger kræver et premium-medlemskab. Grønne rækker angiver nye positioner. Røde rækker angiver lukkede positioner. Klik på linket ikon for at se den fulde transaktionshistorik.
Opgrader
for at låse premium-data op og eksportere til Excel ![]() .
.
| Fil dato | Kilde | Investor | Type | Gennemsnitlig pris (Øst) |
Aktier | Δ Aktier (%) |
Rapporteret Værdi ($1000) |
Δ Værdi (%) |
Port Alloc (%) |
|
|---|---|---|---|---|---|---|---|---|---|---|
| 2026-02-13 | 13F | Edgestream Partners, L.P. | 151.924 | 7.150 | ||||||
| 2026-02-09 | 13F | Hartland & Co., LLC | 254 | 0,00 | 12 | 10,00 | ||||
| 2026-02-11 | 13F | Winton Capital Group Ltd | 35.176 | 1.655 | ||||||
| 2026-02-11 | 13F | Buckingham Strategic Partners | 0 | -100,00 | 0 | |||||
| 2025-11-07 | 13F | Cosner Financial Group, LLC | 0 | -100,00 | 0 | |||||
| 2026-02-17 | 13F | Aqr Capital Management Llc | 62.407 | 17,60 | 2.937 | 31,72 | ||||
| 2026-02-13 | 13F | Korea Investment CORP | 0 | -100,00 | 0 | |||||
| 2025-12-16 | 13F | Garde Capital, Inc. | 0 | -100,00 | 0 | |||||
| 2026-04-07 | 13F | Farther Finance Advisors, LLC | 28.063 | 10,72 | 1.334 | 11,83 | ||||
| 2026-02-13 | 13F | Sterling Capital Management LLC | 6.709 | -7,63 | 316 | 3,28 | ||||
| 2026-01-09 | 13F | SG Americas Securities, LLC | 67.444 | 15,56 | 3 | 50,00 | ||||
| 2026-01-14 | 13F | Exchange Traded Concepts, Llc | 3.439 | 22,08 | 162 | 36,44 | ||||
| 2026-02-05 | 13F | Panoramic Investment Advisors, Llc | 8.006 | -7,89 | 377 | 3,01 | ||||
| 2025-11-07 | 13F | Wealthcare Advisory Partners LLC | 0 | -100,00 | 0 | |||||
| 2026-02-11 | 13F | Empowered Funds, LLC | 5.227 | 1,00 | 246 | 12,90 | ||||
| 2026-02-13 | 13F | Verition Fund Management LLC | 336.667 | 94,69 | 15.844 | 118,10 | ||||
| 2026-02-23 | 13F | Mv Capital Management, Inc. | 1 | 0 | ||||||
| 2026-01-26 | 13F | Decker Retirement Planning Inc. | 1.288 | 0,00 | 61 | 11,11 | ||||
| 2026-02-18 | 13F | Beacon Pointe Advisors, LLC | 10.870 | -18,28 | 512 | -8,42 | ||||
| 2026-01-28 | 13F | N.E.W. Advisory Services LLC | 16.230 | -17,48 | 764 | -7,63 | ||||
| 2026-02-17 | 13F | Tudor Investment Corp Et Al | 22.966 | 1.081 | ||||||
| 2026-02-19 | 13F | Invesco Ltd. | 5.531.582 | 3,31 | 260.316 | 15,72 | ||||
| 2026-02-12 | 13F | Federated Hermes, Inc. | 2.557.850 | 130,05 | 120.372 | 157,71 | ||||
| 2026-02-13 | 13F | Nicolet Advisory Services, Llc | 5.608 | -5,72 | 267 | 9,02 | ||||
| 2025-10-15 | 13F | DAVENPORT & Co LLC | 0 | -100,00 | 0 | -100,00 | ||||
| 2026-01-28 | 13F | West Michigan Advisors, Llc | 5.129 | 0,00 | 243 | 12,04 | ||||
| 2026-02-03 | 13F | We Are One Seven, LLC | 5.479 | -1,79 | 258 | 9,83 | ||||
| 2026-02-17 | 13F | Tower Research Capital LLC (TRC) | 9.679 | 95,26 | 455 | 118,75 | ||||
| 2026-02-11 | 13F | Parallel Advisors, LLC | 20 | 0,00 | 1 | |||||
| 2026-02-09 | 13F | Kestra Investment Management, LLC | 4.990 | 235 | ||||||
| 2026-02-11 | 13F | Ameritas Investment Partners, Inc. | 13.972 | 658 | ||||||
| 2026-01-29 | 13F | Renaissance Capital LLC | 100.247 | 4.718 | ||||||
| 2026-02-13 | 13F | Denver Wealth Management, Inc. | 5.045 | -6,87 | 237 | 4,41 | ||||
| 2026-02-13 | 13F | Stifel Financial Corp | 11.179 | 111,80 | 526 | 138,01 | ||||
| 2025-11-14 | 13F | Susquehanna Fundamental Investments, Llc | 0 | -100,00 | 0 | -100,00 | ||||
| 2026-02-13 | 13F | Quarry LP | 24 | -81,68 | 1 | -80,00 | ||||
| 2026-02-13 | 13F | Storgate, LLC | 19.642 | 924 | ||||||
| 2026-02-19 | 13F | CI Private Wealth, LLC | 7.778 | 28,14 | 366 | 43,53 | ||||
| 2026-02-06 | 13F | Vestmark Advisory Solutions, Inc. | 33.427 | 1.573 | ||||||
| 2026-01-28 | 13F | Klp Kapitalforvaltning As | 37.900 | 13,81 | 1.792 | 27,38 | ||||
| 2026-02-05 | 13F | Proactive Wealth Strategies LLC | 5.585 | 263 | ||||||
| 2026-01-16 | 13F | Marquette Asset Management, LLC | 38 | 0,00 | 2 | 0,00 | ||||
| 2026-02-10 | 13F | Cbre Clarion Securities Llc | 1.504.685 | 14,50 | 70.810 | 28,27 | ||||
| 2026-01-26 | 13F | AE Wealth Management LLC | 16.623 | 0,50 | 782 | 12,68 | ||||
| 2026-02-17 | 13F | Bank Of America Corp /de/ | 2.525.991 | 18,77 | 118.873 | 33,04 | ||||
| 2026-02-18 | 13F | Garton & Associates Financial Advisors LLC | 555 | 26 | ||||||
| 2026-01-22 | 13F | Financial Consulate, Inc | 24 | 0,00 | 1 | 0,00 | ||||
| 2026-01-26 | 13F | KBC Group NV | 4.890 | 0,00 | 0 | |||||
| 2026-01-30 | 13F | Safe Harbor Family Capital, LLC | 5.115 | 241 | ||||||
| 2026-02-17 | 13F | Credit Agricole S A | 69.109 | 0,00 | 3.252 | 12,02 | ||||
| 2026-02-17 | 13F | Fred Alger Management, Llc | 19.124 | -64,93 | 905 | -60,76 | ||||
| 2026-04-09 | 13F | C2P Capital Advisory Group, LLC d.b.a. Prosperity Capital Advisors | 5.181 | -8,25 | 244 | -7,92 | ||||
| 2026-01-23 | 13F | Diversify Advisory Services, LLC | 33.169 | -2,49 | 1.592 | 2,31 | ||||
| 2026-02-11 | 13F | Fox Run Management, L.l.c. | 17.446 | 821 | ||||||
| 2026-02-13 | 13F | Baird Financial Group, Inc. | 11.527 | 542 | ||||||
| 2026-04-08 | 13F | Grove Bank & Trust | 0 | -100,00 | 0 | |||||
| 2026-02-13 | 13F | SRS Capital Advisors, Inc. | 1.702 | -41,55 | 80 | -34,43 | ||||
| 2026-02-10 | 13F | Godfrey Financial Associates, Inc. | 18 | 0 | ||||||
| 2026-02-12 | 13F | Triumph Capital Management | 2.609 | 0,19 | 123 | 11,93 | ||||
| 2026-02-11 | 13F | Vise Technologies, Inc. | 11.130 | 524 | ||||||
| 2026-01-26 | 13F | Whittier Trust Co | 206 | 0,00 | 10 | 12,50 | ||||
| 2026-02-10 | 13F | Thames Capital Management Llc | 85.883 | 4.042 | ||||||
| 2026-02-11 | 13F | Janney Montgomery Scott LLC | 29.389 | 59,31 | 1 | |||||
| 2026-01-29 | 13F | Sanctuary Advisors, LLC | 5.698 | 6,80 | 268 | 19,64 | ||||
| 2026-02-11 | 13F | Cerity Partners LLC | 21.786 | -44,64 | 1.025 | -37,99 | ||||
| 2026-02-17 | 13F | Greenland Capital Management LP | 162.817 | 78,92 | 7.662 | 100,47 | ||||
| 2026-02-13 | 13F | Healthcare Of Ontario Pension Plan Trust Fund | 472.776 | 22.249 | ||||||
| 2026-01-26 | 13F | Private Trust Co Na | 14 | 0,00 | 1 | |||||
| 2026-02-10 | 13F | State of Wyoming | 13.124 | 80,32 | 618 | 102,30 | ||||
| 2026-02-17 | 13F | Cresset Asset Management, LLC | 12.669 | -30,78 | 599 | -22,51 | ||||
| 2025-11-14 | 13F | Zacks Investment Management | 0 | -100,00 | 0 | |||||
| 2026-04-08 | 13F | Miracle Mile Advisors, LLC | 4.462 | -0,20 | 210 | 0,00 | ||||
| 2026-04-10 | 13F | Aquire Wealth Advisors, LLC | 5.147 | 0,00 | 243 | 0,00 | ||||
| 2026-02-10 | 13F | Daiwa Securities Group Inc. | 443.678 | 5,87 | 21 | 17,65 | ||||
| 2026-02-13 | 13F | Bridgefront Capital, LLC | 53.740 | 111,33 | 2.529 | 136,80 | ||||
| 2026-02-13 | 13F | Taproot Management LP | 152.164 | 7.161 | ||||||
| 2026-02-09 | 13F | Atticus Wealth Management, Llc | 7.811 | 0,00 | 368 | 11,89 | ||||
| 2026-01-30 | 13F/A | M&t Bank Corp | 17.854 | 840 | ||||||
| 2026-02-11 | 13F | LPL Financial LLC | 723.758 | -4,62 | 34.060 | 6,85 | ||||
| 2026-02-13 | 13F | OMERS ADMINISTRATION Corp | 0 | -100,00 | 0 | |||||
| 2026-02-10 | 13F | Mutual Of America Capital Management Llc | 265.287 | -11,94 | 12.484 | -1,35 | ||||
| 2026-02-09 | 13F | Knights of Columbus Asset Advisors LLC | 94.318 | -29,10 | 4.439 | -20,58 | ||||
| 2026-02-10 | 13F | Commonwealth Of Pennsylvania Public School Empls Retrmt Sys | 54.747 | 5,90 | 2.576 | 18,65 | ||||
| 2026-02-13 | 13F | Landscape Capital Management, L.l.c. | 0 | -100,00 | 0 | |||||
| 2026-02-12 | 13F | Xponance, Inc. | 13.359 | 6,75 | 629 | 19,62 | ||||
| 2026-02-13 | 13F | Vontobel Holding Ltd. | 6.432 | 303 | ||||||
| 2026-02-17 | 13F | United Capital Financial Advisers, Llc | 14.279 | 0,05 | 672 | 12,02 | ||||
| 2026-02-17 | 13F | Freestone Grove Partners LP | 694.952 | 32.704 | ||||||
| 2026-01-12 | 13F | Seacrest Wealth Management, Llc | 15.742 | 745 | ||||||
| 2026-02-17 | 13F | Ameriflex Group, Inc. | 146 | -50,00 | 7 | -50,00 | ||||
| 2026-02-13 | 13F | American Century Companies Inc | 2.681.001 | -5,56 | 126.168 | 5,80 | ||||
| 2025-11-21 | 13F/A | CIBC Bancorp USA Inc. | 16.981 | 713 | ||||||
| 2026-01-12 | 13F | Castleview Partners, Llc | 14.071 | 46,28 | 662 | 63,86 | ||||
| 2026-02-13 | 13F | Wells Fargo & Company/mn | 295.555 | 54,16 | 13.909 | 72,68 | ||||
| 2026-02-17 | 13F | Cambria Investment Management, L.P. | 13.889 | 654 | ||||||
| 2026-01-27 | 13F | Gf Fund Management Co. Ltd. | 2.793 | 5,84 | 131 | 19,09 | ||||
| 2026-02-17 | 13F | Integrated Advisors Network LLC | 7.488 | 31,99 | 352 | 47,90 | ||||
| 2026-02-12 | 13F | Concorde Asset Management, LLC | 8.798 | -31,79 | 414 | -21,89 | ||||
| 2026-02-13 | 13F | Pathstone Holdings, LLC | 55.283 | 9,01 | 2.603 | 22,21 | ||||
| 2026-02-26 | 13F | TD Capital Management LLC | 1.235 | 0,57 | 58 | 13,73 | ||||
| 2025-11-13 | 13F | GeoWealth Management, LLC | 0 | -100,00 | 0 | |||||
| 2026-02-10 | 13F | Easterly Investment Partners Llc | 390.128 | 18.359 | ||||||
| 2026-01-28 | 13F | B. Metzler seel. Sohn & Co. AG | 74.240 | 3.494 | ||||||
| 2026-02-11 | 13F | VVR Holdings LLC | 12.139 | 571 | ||||||
| 2026-02-17 | 13F | Two Sigma Advisers, Lp | 167.000 | 7.859 | ||||||
| 2026-02-17 | 13F | Schonfeld Strategic Advisors LLC | 456.533 | 21.484 | ||||||
| 2026-01-30 | 13F | North Star Investment Management Corp. | 916 | -42,57 | 43 | -35,82 | ||||
| 2026-02-13 | 13F | Marshall Wace, Llp | 33.617 | 1.582 | ||||||
| 2026-02-09 | 13F | MQS Management LLC | 0 | -100,00 | 0 | |||||
| 2026-02-13 | 13F | State Street Corp | 7.085.670 | 3,03 | 335.174 | 15,34 | ||||
| 2026-02-05 | 13F | Soltis Investment Advisors LLC | 6.819 | -23,09 | 321 | -13,98 | ||||
| 2026-02-17 | 13F | Coppell Advisory Solutions LLC | 4.416 | -8,84 | 211 | 3,96 | ||||
| 2026-02-18 | 13F | EP Wealth Advisors, Inc. | 5.455 | 257 | ||||||
| 2026-02-17 | 13F | Governors Lane LP | 64.100 | 3.017 | ||||||
| 2026-02-17 | 13F | Aster Capital Management (DIFC) Ltd | 189 | 9 | ||||||
| 2026-01-28 | 13F | Franchise GP Ltd | 2.575 | 121 | ||||||
| 2026-02-13 | 13F | Sei Investments Co | 177.682 | -58,63 | 8.362 | -53,66 | ||||
| 2026-01-26 | 13F | Duff & Phelps Investment Management Co | 328.275 | 30,06 | 15.449 | 45,69 | ||||
| 2026-02-17 | 13F | Mercer Global Advisors Inc /adv | 21.529 | 177,19 | 1.013 | 210,74 | ||||
| 2026-02-10 | 13F | WCG Wealth Advisors LLC | 24.583 | 7,63 | 1.157 | 20,54 | ||||
| 2026-02-13 | 13F | First Trust Advisors Lp | 351.387 | -12,58 | 16.536 | -2,07 | ||||
| 2026-02-11 | 13F | Jpmorgan Chase & Co | 579.481 | 23,63 | 27.270 | 38,50 | ||||
| 2026-02-17 | 13F | Financial Avengers, Inc. | 926 | 0,00 | 39 | 0,00 | ||||
| 2026-02-17 | 13F | Janus Henderson Group Plc | 76.296 | 7,62 | 3.589 | 20,48 | ||||
| 2026-02-17 | 13F | Adage Capital Partners Gp, L.l.c. | 960.000 | -6,34 | 45.178 | 4,92 | ||||
| 2026-01-14 | 13F | Spire Wealth Management | 16.127 | 1,76 | 759 | 13,98 | ||||
| 2026-02-18 | 13F | GWM Advisors LLC | 39.029 | -9,31 | 1.837 | 1,60 | ||||
| 2026-01-27 | 13F | Asset Management One Co., Ltd. | 291.426 | 16,02 | 14.076 | 33,39 | ||||
| 2026-02-17 | 13F | Private Advisor Group, LLC | 31.008 | -5,01 | 1.459 | 6,42 | ||||
| 2025-11-05 | 13F | Moloney Securities Asset Management, LLC | 0 | -100,00 | 0 | -100,00 | ||||
| 2026-02-10 | 13F | Westpac Banking Corp | 38.146 | -13,02 | 1.795 | -2,55 | ||||
| 2026-02-11 | 13F | Group One Trading, L.p. | 35 | 2 | ||||||
| 2026-02-13 | 13F | Squarepoint Ops LLC | 112.549 | 5.297 | ||||||
| 2026-02-13 | 13F | Neo Ivy Capital Management | 136.925 | 6.444 | ||||||
| 2026-02-10 | 13F | Envestnet Asset Management Inc | 281.706 | 0,33 | 13.257 | 12,40 | ||||
| 2026-02-12 | 13F | Principal Securities, Inc. | 0 | -100,00 | 0 | -100,00 | ||||
| 2026-01-30 | 13F | State of New Jersey Common Pension Fund D | 204.680 | 5,53 | 9.632 | 18,23 | ||||
| 2026-04-10 | 13F | Octavia Wealth Advisors, LLC | 0 | -100,00 | 0 | |||||
| 2026-02-12 | 13F | EAM Investors, LLC | 112.391 | -1,86 | 5.289 | 11,75 | ||||
| 2026-02-17 | 13F | Cetera Investment Advisers | 248.674 | 15,10 | 11.703 | 28,93 | ||||
| 2026-02-05 | 13F | Amalgamated Bank | 5.316 | 0,95 | 0 | |||||
| 2026-02-13 | 13F | Truvestments Capital Llc | 1 | 0,00 | 0 | |||||
| 2026-02-06 | 13F | EverSource Wealth Advisors, LLC | 352 | 2,92 | 17 | 14,29 | ||||
| 2026-01-20 | 13F | Tran Capital Management, L.p. | 7.350 | 0,00 | 346 | 12,01 | ||||
| 2026-02-14 | 13F | Rockefeller Capital Management L.P. | 1.461 | 402,06 | 69 | 466,67 | ||||
| 2026-02-17 | 13F | Land & Buildings Investment Management, LLC | 1.053.206 | -8,57 | 49.564 | 2,42 | ||||
| 2026-02-12 | 13F | APG Asset Management US Inc. | 292.952 | 0,00 | 13.786 | 12,21 | ||||
| 2026-01-26 | 13F | West Wealth Group, LLC | 8.332 | 0,57 | 392 | 10,73 | ||||
| 2026-02-03 | 13F | Everence Capital Management Inc | 5.311 | 0 | ||||||
| 2026-02-10 | 13F | Private Wealth Asset Management, LLC | 157 | 0,00 | 7 | 16,67 | ||||
| 2026-02-13 | 13F | Virtus ETF Advisers LLC | 0 | -100,00 | 0 | |||||
| 2026-02-12 | 13F | Empower Advisory Group, LLC | 0 | -100,00 | 0 | |||||
| 2026-02-17 | 13F | Point72 Asset Management, L.P. | 323.166 | 12,23 | 15.208 | 25,73 | ||||
| 2026-02-13 | 13F | Beacon Capital Management, LLC | 13.115 | -4,07 | 617 | 7,49 | ||||
| 2026-02-05 | 13F | Allworth Financial LP | 43.137 | 4,10 | 2.030 | 16,67 | ||||
| 2026-02-13 | 13F | Resources Investment Advisors, LLC. | 46.250 | 2,06 | 2.177 | 14,35 | ||||
| 2026-02-17 | 13F | Raymond James Financial Inc | 195.365 | 55,85 | 9.194 | 74,61 | ||||
| 2025-11-13 | 13F | Clear Street Markets Llc | 0 | -100,00 | 0 | |||||
| 2026-04-10 | 13F | Perigon Wealth Management, LLC | 20.026 | -5,21 | 944 | -5,03 | ||||
| 2026-02-06 | 13F | Creative Financial Designs Inc /adv | 3.756 | 12,73 | 177 | 26,62 | ||||
| 2026-02-05 | 13F | Cambridge Investment Research Advisors, Inc. | 151.812 | -8,19 | 7 | 16,67 | ||||
| 2026-03-06 | 13F | Hsbc Holdings Plc | 345.590 | 61,93 | 16.259 | 81,36 | ||||
| 2026-02-12 | 13F | Rik Saylor Financial, Inc. | 47.066 | -0,51 | 2.215 | 11,42 | ||||
| 2026-01-21 | 13F | Hrc Wealth Management, Llc | 10.435 | -4,83 | 491 | 6,74 | ||||
| 2026-01-30 | 13F | Strategic Blueprint, LLC | 17.743 | -11,68 | 835 | -0,95 | ||||
| 2026-02-13 | 13F | Barclays Plc | 317.658 | 2,34 | 14.949 | 14,64 | ||||
| 2026-01-16 | 13F | Standard Life Aberdeen plc | 1.338.967 | 24,53 | 63.012 | 40,24 | ||||
| 2026-02-12 | 13F | Wealthspire Advisors, LLC | 0 | -100,00 | 0 | |||||
| 2026-02-12 | 13F | IFC & Insurance Marketing, Inc. | 810 | 0 | ||||||
| 2025-11-14 | 13F | National Bank Of Canada /fi/ | 0 | -100,00 | 0 | |||||
| 2026-02-05 | 13F | Gamco Investors, Inc. Et Al | 20.000 | 0,00 | 941 | 12,02 | ||||
| 2026-02-12 | 13F | BlackRock, Inc. | 20.136.259 | 9,00 | 947.612 | 22,10 | ||||
| 2026-01-27 | 13F | Cannon Global Investment Management, LLC | 12.700 | 598 | ||||||
| 2026-02-10 | 13F | Natixis Advisors, L.p. | 0 | -100,00 | 0 | |||||
| 2026-02-13 | 13F | Fieldview Capital Management, LLC | 8.481 | 42,75 | 399 | 60,24 | ||||
| 2026-02-05 | 13F | Center for Financial Planning, Inc. | 432 | 0,00 | 20 | 11,11 | ||||
| 2026-01-14 | 13F | Wolff Wiese Magana Llc | 832 | 0,00 | 39 | 14,71 | ||||
| 2026-01-21 | 13F | Newbridge Financial Services Group, Inc. | 2.751 | -14,80 | 129 | -4,44 | ||||
| 2026-01-23 | 13F | State of Alaska, Department of Revenue | 98.953 | 28,21 | 5 | 33,33 | ||||
| 2026-02-17 | 13F/A | Kovack Advisors, Inc. | 7.747 | 6,40 | 365 | 19,34 | ||||
| 2026-02-04 | 13F/A | Nwam Llc | 0 | -100,00 | 0 | |||||
| 2026-01-26 | 13F | Cwm, Llc | 72.604 | -5,34 | 3 | 0,00 | ||||
| 2026-01-28 | 13F | Universal- Beteiligungs- und Servicegesellschaft mbH | 360.624 | -13,62 | 17.082 | -2,60 | ||||
| 2026-02-06 | 13F | Resona Asset Management Co.,Ltd. | 74.247 | -0,18 | 3.578 | 15,09 | ||||
| 2026-01-21 | 13F | Sound Income Strategies, LLC | 1.610 | 0,00 | 77 | 18,46 | ||||
| 2026-02-13 | 13F | MAI Capital Management | 22 | 1 | ||||||
| 2026-02-05 | 13F | Clarion Wealth Managment Partners, LLC | 149.822 | -7,22 | 7.051 | 3,94 | ||||
| 2026-02-13 | 13F | A4 Wealth Advisors LLC | 22.075 | -58,43 | 1.039 | -53,45 | ||||
| 2026-02-10 | 13F | Measured Wealth Private Client Group, LLC | 392 | 0,00 | 18 | 12,50 | ||||
| 2026-02-13 | 13F | Hudson Bay Capital Management LP | 1.541.333 | 87,92 | 72.535 | 110,51 | ||||
| 2026-01-16 | 13F | Longboard Asset Management, LP | 0 | -100,00 | 0 | |||||
| 2026-01-30 | 13F | American Capital Advisory, LLC | 5 | 0 | ||||||
| 2026-01-21 | 13F | Stone House Investment Management, LLC | 18 | 1 | ||||||
| 2026-01-29 | 13F | Quent Capital, LLC | 100 | 0,00 | 5 | 0,00 | ||||
| 2026-02-09 | 13F | Wcm Investment Management, Llc | 3.408.275 | 162.711 | ||||||
| 2026-02-17 | 13F | Kemnay Advisory Services Inc. | 620 | 29 | ||||||
| 2026-02-13 | 13F | Anb Bank | 5.289 | 249 | ||||||
| 2026-02-17 | 13F | Gotham Asset Management, LLC | 12.012 | -5,15 | 565 | 6,20 | ||||
| 2026-01-16 | 13F | Ronald Blue Trust, Inc. | 154 | 0,00 | 7 | 16,67 | ||||
| 2026-02-10 | 13F/A | Northwestern Mutual Wealth Management Co | 2.602 | -40,61 | 122 | -33,70 | ||||
| 2026-02-13 | 13F | JustInvest LLC | 8.861 | 5,18 | 417 | 17,85 | ||||
| 2026-01-29 | 13F | Schnieders Capital Management, Llc. | 7.003 | 330 | ||||||
| 2026-02-10 | 13F | Hillsdale Investment Management Inc. | 200 | -9,09 | 9 | 0,00 | ||||
| 2026-01-23 | 13F | Bayhunt Capital LLC | 221.399 | 10.419 | ||||||
| 2026-02-10 | 13F | Foundations Investment Advisors, LLC | 8.577 | -11,89 | 404 | -1,23 | ||||
| 2026-04-08 | 13F | Cambridge Financial Group, LLC | 11.993 | 0,00 | 566 | 19,45 | ||||
| 2026-02-17 | 13F | Northern Trust Corp | 1.650.679 | -0,44 | 77.681 | 11,52 | ||||
| 2026-02-17 | 13F | Kingdon Capital Management, L.l.c. | 200.000 | 9.412 | ||||||
| 2026-01-07 | 13F | Baldwin Brothers Inc/ma | 12.108 | -19,43 | 570 | -9,83 | ||||
| 2026-02-09 | 13F | Avalon Trust Co | 989 | -42,33 | 47 | -36,11 | ||||
| 2026-02-17 | 13F | Warren Averett Asset Management, LLC | 12.204 | 574 | ||||||
| 2026-02-17 | 13F | Voloridge Investment Management, Llc | 1.084.416 | 32,81 | 51.033 | 48,77 | ||||
| 2026-02-05 | 13F | Td Private Client Wealth Llc | 29 | -12,12 | 1 | 0,00 | ||||
| 2026-02-13 | 13F | Manufacturers Life Insurance Company, The | 0 | -100,00 | 0 | |||||
| 2026-02-13 | 13F | Neuberger Berman Group LLC | 535.153 | -1,09 | 25.184 | 10,81 | ||||
| 2026-01-27 | 13F | Smith, Salley & Associates | 5.234 | 0,00 | 246 | 12,33 | ||||
| 2026-01-06 | 13F | Tucker Asset Management Llc | 0 | -100,00 | 0 | |||||
| 2026-02-03 | 13F | Sumitomo Mitsui DS Asset Management Company, Ltd | 40.270 | 8,93 | 1.895 | 22,02 | ||||
| 2026-02-10 | 13F | Connor, Clark & Lunn Investment Management Ltd. | 7.260 | 0,00 | 342 | 12,17 | ||||
| 2026-01-14 | 13F | Nova Wealth Management, Inc. | 3.122 | -49,00 | 147 | -43,19 | ||||
| 2026-02-12 | 13F | Renaissance Technologies Llc | 259.131 | -64,35 | 12.195 | -60,07 | ||||
| 2025-11-12 | 13F | Rsm Us Wealth Management Llc | 0 | -100,00 | 0 | -100,00 | ||||
| 2026-01-29 | 13F | Inscription Capital, LLC | 8.883 | -3,01 | 418 | 8,85 | ||||
| 2026-01-23 | 13F | Assetmark, Inc | 4.801 | -26,34 | 226 | -17,58 | ||||
| 2026-01-22 | 13F | Harwood Advisory Group, LLC | 833 | 0,00 | 39 | 14,71 | ||||
| 2025-11-12 | 13F | Creekmur Asset Management LLC | 3.882 | 0,00 | 163 | 14,79 | ||||
| 2026-01-28 | 13F | Caliber Wealth Management, LLC / KS | 5.056 | 0,00 | 238 | 11,79 | ||||
| 2026-01-28 | 13F | WPG Advisers, LLC | 2.934 | -88,06 | 138 | -86,63 | ||||
| 2026-02-17 | 13F | Mangrove Partners | 4.923 | 232 | ||||||
| 2026-01-20 | 13F | AdvisorNet Financial, Inc | 5.653 | 0,00 | 266 | 12,24 | ||||
| 2026-04-08 | 13F | Heritage Family Offices, LLP | 6.598 | -20,30 | 311 | -20,05 | ||||
| 2026-02-12 | 13F | Hilton Capital Management, LLC | 89.531 | 0,54 | 4.213 | 12,62 | ||||
| 2026-02-12 | 13F | Scotia Capital Inc. | 32.231 | 19,47 | 1.517 | 33,80 | ||||
| 2026-01-12 | 13F | Peak Financial Advisors Llc | 12.670 | -2,44 | 596 | 9,36 | ||||
| 2026-02-02 | 13F | Highland Capital Management, Llc | 5.803 | -2,76 | 273 | 9,20 | ||||
| 2026-02-17 | 13F | Capstone Investment Advisors, Llc | 25.944 | 1.221 | ||||||
| 2026-02-06 | 13F | Motco | 27 | 0,00 | 1 | 0,00 | ||||
| 2025-10-30 | 13F | Twin Peaks Wealth Advisors, LLC | 0 | -100,00 | 0 | |||||
| 2026-01-29 | 13F | Focused Wealth Management, Inc | 23.621 | -3,11 | 1.112 | 8,50 | ||||
| 2026-02-12 | 13F | Great Valley Advisor Group, Inc. | 8.886 | 0,16 | 418 | 12,37 | ||||
| 2026-02-13 | 13F | Macquarie Group Ltd | 113.595 | -88,36 | 5.346 | -86,97 | ||||
| 2026-02-17 | 13F | SageView Advisory Group, LLC | 9.159 | -1,98 | 431 | 9,95 | ||||
| 2026-02-03 | 13F | Ethic Inc. | 8.843 | -3,90 | 416 | 7,77 | ||||
| 2026-01-26 | 13F | B&I Capital AG | 226.570 | 10.662 | ||||||
| 2026-02-17 | 13F | Jones Financial Companies Lllp | 9.847 | 8,23 | 463 | 20,89 | ||||
| 2026-02-13 | 13F | Rhumbline Advisers | 228.857 | -10,15 | 10.770 | 0,64 | ||||
| 2026-02-14 | 13F | Militia Capital Partners, LP | 17.100 | -10,47 | 805 | 0,25 | ||||
| 2026-02-02 | 13F | Principal Financial Group Inc | 7.194.467 | -19,45 | 338.572 | -9,76 | ||||
| 2026-02-02 | 13F | New England Capital Financial Advisors LLC | 914 | 0,55 | 43 | 13,16 | ||||
| 2025-11-14 | 13F | Mount Yale Investment Advisors, LLC | 0 | -100,00 | 0 | -100,00 | ||||
| 2026-02-03 | 13F | Diversify Wealth Management, Llc | 22.052 | -8,91 | 1.053 | -4,97 | ||||
| 2026-02-03 | 13F | RFG Advisory, LLC | 9.238 | -6,91 | 435 | 4,33 | ||||
| 2026-02-03 | 13F | Mitsubishi UFJ Kokusai Asset Management Co., Ltd. | 139.591 | 9,12 | 6.594 | 22,72 | ||||
| 2026-02-17 | 13F | D. E. Shaw & Co., Inc. | 436.910 | 20.561 | ||||||
| 2026-02-10 | 13F | COFG Advisors, LLC | 15.951 | 751 | ||||||
| 2026-02-17 | 13F | Algert Global Llc | 616.644 | 51,55 | 29 | 70,59 | ||||
| 2026-02-06 | 13F | IFP Advisors, Inc | 6.853 | 191,49 | 323 | 228,57 | ||||
| 2026-02-02 | 13F | Cornerstone Planning Group LLC | 14 | 1 | ||||||
| 2026-02-24 | 13F | Bell Investment Advisors, Inc | 74 | 3 | ||||||
| 2026-02-13 | 13F | Citigroup Inc | 209.503 | 92,98 | 9.859 | 116,21 | ||||
| 2026-02-18 | 13F | Mackenzie Financial Corp | 12.693 | 0,81 | 605 | 14,39 | ||||
| 2026-01-16 | 13F | Selective Wealth Management, Inc. | 13.128 | 0,00 | 630 | 16,91 | ||||
| 2026-02-17 | 13F | FIL Ltd | 1.650 | -38,29 | 78 | -31,25 | ||||
| 2026-02-12 | 13F | M&G Plc | 4.963 | -2,90 | 233 | 8,88 | ||||
| 2026-02-13 | 13F | Brookfield Asset Management Inc. | 243.075 | -36,78 | 11.439 | -29,18 | ||||
| 2026-02-13 | 13F | Colony Group, LLC | 23.330 | -11,62 | 1.098 | -1,44 | ||||
| 2025-11-14 | 13F | Gallagher Fiduciary Advisors, LLC | 0 | -100,00 | 0 | -100,00 | ||||
| 2026-01-14 | 13F | Accurate Wealth Management, LLC | 10.336 | -16,65 | 489 | -5,06 | ||||
| 2026-02-13 | 13F | Caxton Associates Llp | 6.611 | 311 | ||||||
| 2026-01-29 | 13F | ProVise Management Group, LLC | 6.187 | -1,76 | 291 | 10,23 | ||||
| 2026-02-13 | 13F | Mariner, LLC | 19.703 | -43,30 | 924 | -36,67 | ||||
| 2026-02-10 | 13F | Rothschild Investment Llc | 217 | -8,05 | 10 | 11,11 | ||||
| 2026-02-18 | 13F | Onyx Bridge Wealth Group LLC | 0 | -100,00 | 0 | |||||
| 2026-01-27 | 13F | TD Waterhouse Canada Inc. | 300 | 14 | ||||||
| 2026-02-13 | 13F | Financial Network Wealth Advisors LLC | 30 | 0,00 | 1 | 0,00 | ||||
| 2025-10-20 | 13F | Mid-American Wealth Advisory Group, Inc. | 0 | -100,00 | 0 | |||||
| 2026-02-12 | 13F | New York State Common Retirement Fund | 54.700 | 8,53 | 2.574 | 21,59 | ||||
| 2026-02-13 | 13F | Kempen Capital Management N.v. | 254.837 | 629,96 | 11.993 | 718,01 | ||||
| 2026-02-06 | 13F | Handelsbanken Fonder AB | 46.500 | 2,65 | 2 | 100,00 | ||||
| 2026-02-04 | 13F | Virginia Retirement Systems Et Al | 267.550 | -19,32 | 12.591 | -9,62 | ||||
| 2026-02-11 | 13F | Harvest Fund Management Co., Ltd | 4.528 | 13,34 | 0 | |||||
| 2026-02-04 | 13F | Pensionmark Financial Group, Llc | 8.283 | 69,94 | 233 | 14,22 | ||||
| 2026-01-21 | 13F | Prime Capital Investment Advisors, LLC | 17.046 | 0,03 | 802 | 12,17 | ||||
| 2026-01-15 | 13F | Warwick Investment Management, Inc. | 8.429 | 0,00 | 397 | 11,86 | ||||
| 2026-02-06 | 13F | Fortis Group Advisors, LLC | 27.202 | -1,32 | 1.277 | 3,40 | ||||
| 2026-02-17 | 13F | Fmr Llc | 5.269.584 | 48,25 | 247.987 | 66,07 | ||||
| 2025-10-28 | 13F | BRYN MAWR TRUST Co | 609 | -3,03 | 26 | 8,70 | ||||
| 2026-02-10 | 13F | Nomura Asset Management Co Ltd | 267.681 | 8,90 | 12.597 | 21,99 | ||||
| 2026-02-12 | 13F | Cibc World Markets Corp | 11.195 | -42,96 | 527 | -27,05 | ||||
| 2026-02-17 | 13F | Jain Global LLC | 291.439 | 353,52 | 13.715 | 408,15 | ||||
| 2026-02-17 | 13F | Nissay Asset Management Corp /japan/ /adv | 26.920 | 9,52 | 1.267 | 22,67 | ||||
| 2026-02-06 | 13F | Global Retirement Partners, LLC | 3.551 | 206,65 | 167 | 247,92 | ||||
| 2026-02-17 | 13F | Royal Bank Of Canada | 6.161.549 | 2.984,14 | 289.962 | 3.354,40 | ||||
| 2026-02-13 | 13F | Umb Bank N A/mo | 21 | 0,00 | 1 | |||||
| 2025-11-12 | 13F | Transce3nd, LLC | 0 | -100,00 | 0 | |||||
| 2026-02-05 | 13F | Western Wealth Management, LLC | 6.071 | 17,40 | 286 | 31,34 | ||||
| 2026-01-23 | 13F | Kelly Financial Group Llc | 0 | -100,00 | 0 | |||||
| 2026-04-08 | 13F | Legacy Wealth Asset Management, LLC | 28.362 | 45,42 | 1.338 | 45,80 | ||||
| 2026-02-17 | 13F | Polymer Capital Management (US) LLC | 17.654 | 831 | ||||||
| 2026-01-23 | 13F | Sumitomo Mitsui Trust Holdings, Inc. | 247.389 | 0,67 | 11.642 | 12,78 | ||||
| 2026-02-17 | 13F | Russell Investments Group, Ltd. | 1.243.267 | -5,08 | 58.508 | 6,33 | ||||
| 2026-02-10 | 13F | Intech Investment Management Llc | 61.575 | 0,00 | 2.898 | 12,03 | ||||
| 2026-02-13 | 13F | Alyeska Investment Group, L.P. | 919.983 | 43.294 | ||||||
| 2026-02-13 | 13F | Dynamic Technology Lab Private Ltd | 7.908 | 372 | ||||||
| 2026-01-28 | 13F | Arizona State Retirement System | 47.224 | 0,06 | 2.222 | 12,11 | ||||
| 2026-02-17 | 13F | Ghisallo Capital Management LLC | 150.000 | 0,00 | 7.059 | 12,03 | ||||
| 2026-02-03 | 13F | Sequoia Financial Advisors, LLC | 17.351 | 6,62 | 817 | 19,47 | ||||
| 2026-02-13 | 13F | Gen-Wealth Partners Inc | 585 | 0,00 | 28 | 12,50 | ||||
| 2026-02-02 | 13F | Mutual Advisors, LLC | 7.791 | 0,41 | 367 | 8,61 | ||||
| 2026-02-26 | 13F | BDFS Capital LLC | 6.231 | 295 | ||||||
| 2026-02-11 | 13F | Gaddis Premier Wealth Advisors LLC | 5.045 | 237 | ||||||
| 2026-02-17 | 13F | Citadel Advisors Llc | Call | 6.100 | 287 | |||||
| 2026-02-17 | 13F | Citadel Advisors Llc | 199.169 | 1.072,00 | 9.373 | 1.214,45 | ||||
| 2026-01-20 | 13F | Sheets Smith Wealth Management | 8.521 | 30,95 | 401 | 46,52 | ||||
| 2026-02-12 | 13F | Commonwealth Equity Services, Llc | 833.647 | -10,77 | 39.231 | 100.492,31 | ||||
| 2026-02-06 | 13F | Pnc Financial Services Group, Inc. | 3.786 | -3,86 | 178 | 7,88 | ||||
| 2026-02-02 | 13F | Truist Financial Corp | 21.176 | -2,03 | 997 | 9,69 | ||||
| 2026-01-23 | 13F | S. R. Schill & Associates | 8.339 | 0,00 | 392 | 12,00 | ||||
| 2026-02-17 | 13F | National Asset Management, Inc. | 4.945 | 233 | ||||||
| 2026-02-17 | 13F | Bamco Inc /ny/ | 226.459 | 13,15 | 10.657 | 26,75 | ||||
| 2026-04-06 | 13F | CX Institutional | 4.005 | 17,35 | 0 | |||||
| 2026-02-03 | 13F | Ballentine Partners, LLC | 10.522 | -2,53 | 495 | 9,27 | ||||
| 2026-02-17 | 13F | Modern Wealth Management, LLC | 76.668 | -4,63 | 3.608 | 6,84 | ||||
| 2026-01-29 | 13F | UBS Group AG | 268.239 | -34,45 | 12.623 | -26,57 | ||||
| 2026-02-13 | 13F | Mml Investors Services, Llc | 25.776 | 9,33 | 1.213 | 22,53 | ||||
| 2026-01-13 | 13F | Norden Group Llc | 5.155 | 3,49 | 243 | 15,79 | ||||
| 2026-01-29 | 13F | UMA Financial Services, Inc. | 943 | 0,75 | 44 | 12,82 | ||||
| 2026-02-10 | 13F | Norges Bank | 2.558.500 | 120.403 | ||||||
| 2026-02-09 | 13F | Jefferies Financial Group Inc. | 6.628 | 312 | ||||||
| 2026-02-17 | 13F | Atom Investors LP | 71.093 | 3.346 | ||||||
| 2026-02-12 | 13F | Nuveen, LLC | 1.899.549 | 18,77 | 89.393 | 33,05 | ||||
| 2026-02-12 | 13F | Quadrant Capital Group Llc | 108 | 0,00 | 5 | 25,00 | ||||
| 2026-01-27 | 13F | Zurcher Kantonalbank (Zurich Cantonalbank) | 120.477 | -3,52 | 5.670 | 8,06 | ||||
| 2026-02-17 | 13F | Lighthouse Investment Partners, LLC | 384.200 | 115,72 | 18.080 | 141,68 | ||||
| 2026-02-12 | 13F | MetLife Investment Management, LLC | 98.193 | -0,00 | 4.621 | 12,00 | ||||
| 2026-02-13 | 13F | Charles Schwab Investment Management Inc | 2.930.019 | 10,42 | 137.887 | 23,69 | ||||
| 2026-02-09 | 13F | Integrity Alliance, Llc. | 7.393 | 348 | ||||||
| 2026-04-08 | 13F | Dynamic Advisor Solutions LLC | 81.280 | 63,80 | 3.833 | 64,15 | ||||
| 2025-11-06 | 13F | CIBC World Markets Inc. | 0 | -100,00 | 0 | -100,00 | ||||
| 2025-10-28 | 13F | Franchise Capital Ltd | 4.375 | 0,00 | 184 | 14,38 | ||||
| 2025-11-14 | 13F | Waterfront Capital Partners, LLC | 179.650 | -60,04 | 7.547 | -54,31 | ||||
| 2026-01-16 | 13F | Trust Co Of Vermont | 0 | -100,00 | 0 | |||||
| 2026-02-13 | 13F | Ubs Asset Management Americas Inc | 421 | -99,95 | 20 | -99,95 | ||||
| 2026-01-07 | 13F | Harbour Capital Advisors, LLC | 70.910 | -4,20 | 3.350 | 10,24 | ||||
| 2026-02-10 | 13F | Quantbot Technologies LP | 1.788 | -84,54 | 84 | -82,68 | ||||
| 2025-10-15 | 13F | Stephens Consulting, LLC | 0 | -100,00 | 0 | -100,00 | ||||
| 2026-01-29 | 13F | Teachers Retirement System Of The State Of Kentucky | 59.143 | -8,61 | 3 | 0,00 | ||||
| 2025-11-13 | 13F | Riggs Asset Managment Co. Inc. | 0 | -100,00 | 0 | |||||
| 2026-01-14 | 13F | Tradewinds Capital Management, LLC | 563 | 0,00 | 26 | 13,04 | ||||
| 2026-02-17 | 13F | Dark Forest Capital Management Lp | 49.287 | 229,97 | 2.319 | 269,86 | ||||
| 2026-02-17 | 13F | Engineers Gate Manager LP | 0 | -100,00 | 0 | |||||
| 2026-02-13 | 13F | Change Path, LLC | 7.653 | -1,59 | 360 | 10,43 | ||||
| 2026-02-17 | 13F/A | Uniplan Investment Counsel, Inc. | 111.461 | 141,49 | 5.245 | 170,64 | ||||
| 2026-02-12 | 13F | Steward Partners Investment Advisory, Llc | 18.702 | -5,08 | 880 | 6,41 | ||||
| 2026-02-12 | 13F | Ensign Peak Advisors, Inc | 73.058 | 48,90 | 3.438 | 66,81 | ||||
| 2026-02-11 | 13F | Los Angeles Capital Management Llc | 742 | 34 | ||||||
| 2026-02-02 | 13F | Strs Ohio | 234.900 | 7,90 | 11.054 | 20,87 | ||||
| 2026-02-10 | 13F | Principia Wealth Advisory, LLC | 15 | 114,29 | 1 | |||||
| 2026-02-11 | 13F | Franklin Resources Inc | 208.680 | -2,85 | 9.820 | 8,82 | ||||
| 2026-02-17 | 13F | Equitable Holdings, Inc. | 7.212 | 339 | ||||||
| 2026-02-17 | 13F | Harvest Investment Services, LLC | 27.845 | 330,77 | 1.310 | 383,39 | ||||
| 2026-02-12 | 13F | IFM Investors Pty Ltd | 27.280 | 6,30 | 1 | -99,91 | ||||
| 2026-02-13 | 13F | Pinnacle Wealth Planning Services, Inc. | 258 | 12 | ||||||
| 2026-01-15 | 13F | Saxony Capital Management, LLC | 5.124 | 0,00 | 241 | 12,09 | ||||
| 2026-01-30 | 13F | Lincluden Management Ltd | 37.595 | 2 | ||||||
| 2026-02-06 | 13F | HighTower Advisors, LLC | 118.749 | 3,21 | 5.588 | 15,62 | ||||
| 2026-02-06 | 13F | Bare Financial Services, Inc | 42 | -20,75 | 2 | -50,00 | ||||
| 2025-11-07 | 13F | Shell Asset Management Co | 422 | 0 | ||||||
| 2026-02-10 | 13F | Bank of New York Mellon Corp | 1.068.257 | -5,74 | 50.272 | 5,59 | ||||
| 2026-02-17 | 13F | Optiver Holding B.V. | 0 | -100,00 | 0 | |||||
| 2026-01-29 | 13F | Pictet Asset Management Holding SA | 24.321 | 12,82 | 1.145 | 26,41 | ||||
| 2026-02-11 | 13F | Strategic Advocates LLC | 3.464 | 0,00 | 165 | 13,79 | ||||
| 2026-02-13 | 13F | BNP Paribas Asset Management Holding S.A. | 58.899 | 891,57 | 3 | |||||
| 2026-04-02 | 13F | Fulcrum Equity Management | 9.905 | 0,00 | 467 | 0,21 | ||||
| 2026-02-17 | 13F | Cander Asset Management LP | 386.368 | 18.182 | ||||||
| 2026-02-17 | 13F | Quadrature Capital Ltd | 46.389 | 2.183 | ||||||
| 2025-11-12 | 13F | Seven Springs Wealth Group, LLC | 0 | -100,00 | 0 | |||||
| 2026-02-17 | 13F | GEM Realty Capital | 0 | -100,00 | 0 | |||||
| 2025-11-04 | 13F | United Community Bank | 0 | -100,00 | 0 | |||||
| 2026-04-07 | 13F | Eastern Bank | 1.141 | 202,65 | 54 | 211,76 | ||||
| 2026-01-28 | 13F | Teacher Retirement System Of Texas | 31.150 | -52,34 | 1.466 | -46,63 | ||||
| 2026-02-10 | 13F | Bnp Paribas Arbitrage, Sa | 45.752 | -2,48 | 2.153 | 9,29 | ||||
| 2026-03-03 | 13F/A | Caitong International Asset Management Co., Ltd | 11 | 1 | ||||||
| 2026-01-30 | 13F | Sigma Planning Corp | 14.969 | 4,46 | 704 | 16,94 | ||||
| 2026-02-17 | 13F | Amundi | 87.939 | 6,85 | 4.138 | 22,64 | ||||
| 2026-02-17 | 13F | Rakuten Investment Management, Inc. | 0 | -100,00 | 0 | |||||
| 2026-02-17 | 13F | Advisor Group Holdings, Inc. | 188.928 | -15,98 | 8.892 | -6,92 | ||||
| 2026-02-13 | 13F | Kilter Group LLC | 42 | 2 | ||||||
| 2026-02-14 | 13F | American Trust | 27.519 | -3,40 | 1.295 | 8,28 | ||||
| 2026-02-11 | 13F | Allianz Asset Management GmbH | 363.015 | 38,99 | 17.083 | 55,70 | ||||
| 2026-02-13 | 13F | OpenArc Corporate Advisory, LLC | 13.087 | 616 | ||||||
| 2026-02-04 | 13F | Summit Wealth Group Llc / Co | 24.016 | 874,28 | 1.130 | 125,55 | ||||
| 2026-02-13 | 13F | Arete Wealth Advisors, LLC | 14.254 | 10,59 | 1 | |||||
| 2026-02-17 | 13F | Capital Fund Management S.a. | 0 | -100,00 | 0 | |||||
| 2025-11-13 | 13F/A | Peak6 Llc | 0 | -100,00 | 0 | |||||
| 2026-02-12 | 13F | Centersquare Investment Management Llc | 0 | -100,00 | 0 | |||||
| 2026-02-09 | 13F | Geode Capital Management, Llc | 5.364.642 | 10,12 | 262.837 | 22,50 | ||||
| 2026-02-13 | 13F | Public Employees Retirement Association Of Colorado | 20.833 | 0,00 | 1 | |||||
| 2026-02-02 | 13F | Benjamin Edwards Inc | 7.367 | 1,59 | 347 | 13,82 | ||||
| 2026-02-13 | 13F | Police & Firemen's Retirement System of New Jersey | 45.141 | 1,40 | 2.124 | 13,58 | ||||
| 2026-04-10 | 13F | Quaker Wealth Management, LLC | 3 | -40,00 | 0 | |||||
| 2025-11-14 | 13F | Vident Advisory, LLC | 0 | -100,00 | 0 | |||||
| 2026-02-13 | 13F | Integrated Wealth Concepts LLC | 0 | -100,00 | 0 | |||||
| 2026-01-22 | 13F | Fiduciary Alliance LLC | 5.757 | -21,85 | 271 | -12,62 | ||||
| 2026-04-10 | 13F | Pure Financial Advisors, Inc. | 10.360 | 8,70 | 489 | 8,93 | ||||
| 2026-02-06 | 13F | Csenge Advisory Group | 9.655 | -0,30 | 454 | 11,82 | ||||
| 2026-01-26 | 13F | Merit Financial Group, LLC | 168.011 | -4,05 | 7.907 | 7,48 | ||||
| 2026-01-28 | 13F | Leelyn Smith, LLC | 4.450 | 209 | ||||||
| 2026-01-26 | 13F | Main Street Group, LTD | 0 | -100,00 | 0 | |||||
| 2026-02-13 | 13F | Centaurus Financial, Inc. | 5.647 | 2,62 | 0 | |||||
| 2026-02-09 | 13F | Allstate Corp | 10.103 | 475 | ||||||
| 2026-02-06 | 13F | Covestor Ltd | 336 | 0,00 | 0 | |||||
| 2026-02-09 | 13F | Legal & General Group Plc | 1.023.393 | 24,31 | 48.161 | 39,25 | ||||
| 2026-02-11 | 13F | Meeder Asset Management Inc | 7.789 | 18,34 | 367 | 32,61 | ||||
| 2026-01-21 | 13F | Indiana Trust & Investment Management CO | 2.012 | 0,00 | 95 | 11,90 | ||||
| 2026-02-13 | 13F | Beacon Financial Advisory LLC | 8.674 | -19,60 | 408 | -9,93 | ||||
| 2026-01-29 | 13F | Vanguard Group Inc | 24.974.195 | 6,14 | 1.175.286 | 18,90 | ||||
| 2026-02-17 | 13F | Man Group plc | 12.979 | 611 | ||||||
| 2026-02-11 | 13F | Deutsche Bank Ag\ | 2.360.769 | -0,66 | 111.098 | 11,28 | ||||
| 2026-01-16 | 13F | HMS Capital Management, LLC | 11.167 | -1,26 | 526 | 10,53 | ||||
| 2026-01-15 | 13F | Nisa Investment Advisors, Llc | 17.323 | -26,64 | 821 | -17,92 | ||||
| 2026-01-20 | 13F | Harbor Capital Advisors, Inc. | 3.691 | 235,24 | 0 | |||||
| 2026-01-21 | 13F | Capital Advisory Group Advisory Services, LLC | 4.649 | 219 | ||||||
| 2026-02-06 | 13F | Larson Financial Group LLC | 791 | -8,55 | 37 | 2,78 | ||||
| 2026-02-17 | 13F | California State Teachers Retirement System | 160.194 | 6,19 | 7.539 | 18,95 | ||||
| 2026-02-17 | 13F | Advisory Services Network, LLC | 0 | -100,00 | 0 | |||||
| 2026-02-03 | 13F | McIlrath & Eck, LLC | 1.626 | 0,00 | 77 | 11,76 | ||||
| 2026-02-06 | 13F | Envestnet Portfolio Solutions, Inc. | 11.398 | 0,51 | 536 | 12,61 | ||||
| 2026-01-16 | 13F | Balboa Wealth Partners | 4.250 | -33,70 | 200 | -25,65 | ||||
| 2026-02-12 | 13F | Brinker Capital Investments, LLC | 48.685 | 23,93 | 2.291 | 38,85 | ||||
| 2026-02-12 | 13F | Ci Investments Inc. | 0 | -100,00 | 0 | |||||
| 2026-02-12 | 13F | UniSuper Management Pty Ltd | 34.700 | -23,23 | 1.633 | -14,01 | ||||
| 2026-01-15 | 13F | Spirit Of America Management Corp/ny | 1.500 | 50,00 | 71 | 66,67 | ||||
| 2026-02-12 | 13F | Bahl & Gaynor Inc | 139.120 | 6.547 | ||||||
| 2026-04-10 | 13F | Lifestyle Asset Management, Inc. | 9.482 | 0,00 | 447 | 0,22 | ||||
| 2026-02-13 | 13F | Kestra Advisory Services, LLC | 0 | -100,00 | 0 | |||||
| 2026-02-12 | 13F | Rossby Financial, LCC | 22 | 1 | ||||||
| 2026-01-28 | 13F | Investmark Advisory Group LLC | 8.012 | 0,11 | 377 | 12,20 | ||||
| 2026-02-12 | 13F | California Public Employees Retirement System | 283.707 | 16,02 | 13.351 | 29,96 | ||||
| 2026-02-02 | 13F | Fifth Third Bancorp | 1.837 | 46,73 | 86 | 65,38 | ||||
| 2026-01-20 | 13F | First American Bank | 81.358 | 103,28 | 3.829 | 127,72 | ||||
| 2026-02-13 | 13F | Great West Life Assurance Co /can/ | 301.134 | 9,20 | 14 | 27,27 | ||||
| 2026-02-17 | 13F | Odyssean, LLC | 15.851 | 746 | ||||||
| 2026-02-12 | 13F | Chilton Capital Management Llc | 228.216 | -35,11 | 10.788 | -27,36 | ||||
| 2026-02-17 | 13F | Delaware Management Holdings, Inc. | 788.304 | 37.098 | ||||||
| 2026-02-17 | 13F | Apollo Management Holdings, L.P. | 281.320 | 13.239 | ||||||
| 2026-04-08 | 13F | Wealth Enhancement Advisory Services, Llc | 33.153 | -30,25 | 1.594 | -28,84 | ||||
| 2026-02-12 | 13F | Advisory Resource Group | 15.916 | -14,26 | 749 | -3,85 | ||||
| 2026-02-17 | 13F | Creative Planning | 40.485 | 6,52 | 1.905 | 19,36 | ||||
| 2026-01-30 | 13F | Us Bancorp \de\ | 1.115 | 2,76 | 52 | 15,56 | ||||
| 2026-01-26 | 13F | Paradigm Financial Partners, Llc | 19.057 | 0,14 | 897 | 12,14 | ||||
| 2026-02-05 | 13F | Cornerstone Wealth Management, LLC | 7.440 | 0,00 | 350 | 12,18 | ||||
| 2026-01-12 | 13F | Kozak & Associates, Inc. | 1.088 | 0,00 | 51 | -1,92 | ||||
| 2026-01-23 | 13F | Robeco Institutional Asset Management B.V. | 15.351 | 722 | ||||||
| 2026-02-17 | 13F | Lazard Asset Management Llc | 4.854 | -87,97 | 228 | -86,55 | ||||
| 2026-02-11 | 13F | Zions Bancorporation, National Association /ut/ | 21 | 1 | ||||||
| 2026-02-12 | 13F | Mark Sheptoff Financial Planning, Llc | 0 | -100,00 | 0 | |||||
| 2026-04-01 | 13F | Bangor Savings Bank | 0 | -100,00 | 0 | |||||
| 2026-02-04 | 13F | Swiss Life Asset Management Ltd | 12.884 | 80,42 | 606 | 102,68 | ||||
| 2026-02-17 | 13F | Brevan Howard Capital Management LP | 46.983 | 174,31 | 2.211 | 207,51 | ||||
| 2026-02-17 | 13F | Prosperity Bancshares Inc | 1.140 | 54 | ||||||
| 2026-02-13 | 13F | Aptus Capital Advisors, LLC | 327.843 | 0,16 | 15.428 | 12,20 | ||||
| 2026-01-16 | 13F | FNY Investment Advisers, LLC | 3.000 | 0 | ||||||
| 2026-02-17 | 13F | Magnetar Financial LLC | 16.183 | -75,67 | 762 | -72,76 | ||||
| 2026-04-10 | 13F | Armstrong Advisory Group, Inc | 11 | 0,00 | 1 | |||||
| 2026-01-26 | 13F | Mirae Asset Global Investments Co., Ltd. | 4.928 | 41,00 | 232 | 58,22 | ||||
| 2026-02-04 | 13F | Biltmore Family Office, LLC | 6.488 | 307 | ||||||
| 2026-01-21 | 13F | Petra Financial Advisors Inc | 25.606 | -2,36 | 1.205 | 9,45 | ||||
| 2026-02-13 | 13F | Level Four Advisory Services, Llc | 5.078 | 239 | ||||||
| 2026-02-11 | 13F | Prestige Wealth Management Group LLC | 2.508 | -23,23 | 119 | -14,49 | ||||
| 2025-11-14 | 13F | Strategic Wealth Partners, Ltd. | 3.367 | 57,85 | 141 | 80,77 | ||||
| 2026-04-06 | 13F | Versant Capital Management, Inc | 921 | 2,56 | 43 | 2,38 | ||||
| 2025-11-14 | 13F | EAM Global Investors LLC | 0 | -100,00 | 0 | |||||
| 2026-02-03 | 13F | International Assets Investment Management, Llc | 6.237 | -14,76 | 294 | 10,57 | ||||
| 2026-02-04 | 13F | HighPoint Advisor Group LLC | 65.958 | -7,15 | 3.104 | 3,99 | ||||
| 2026-01-28 | 13F | Oversea-Chinese Banking CORP Ltd | 185.473 | -10,59 | 8.728 | 0,16 | ||||
| 2026-02-17 | 13F | Wiley Bros.-aintree Capital, Llc | 5.199 | 245 | ||||||
| 2026-02-05 | 13F | Elyxium Wealth, LLC | 43 | 2 | ||||||
| 2026-02-13 | 13F | Kennedy Capital Management, Inc. | 358.610 | 4,92 | 16.876 | 17,54 | ||||
| 2026-02-10 | 13F | Anchor Capital Advisors Llc | 172.086 | 3,07 | 8.098 | 15,47 | ||||
| 2026-04-07 | 13F | CoreCap Advisors, LLC | 0 | -100,00 | 0 | |||||
| 2026-02-04 | 13F | BCJ Capital Management, LLC | 13.296 | -2,64 | 626 | 9,08 | ||||
| 2026-02-11 | 13F | Metis Global Partners, LLC | 41.844 | 16,38 | 1.969 | 30,40 | ||||
| 2026-01-23 | 13F | Smith, Moore & Co. | 6.719 | 0,00 | 316 | 12,06 | ||||
| 2026-02-09 | 13F | Kingsview Wealth Management, LLC | 0 | -100,00 | 0 | |||||
| 2026-02-12 | 13F | Dimensional Fund Advisors Lp | 2.016.074 | 38,14 | 94.880 | 54,75 | ||||
| 2026-02-10 | 13F | Eurizon Capital SGR S.p.A. | 85.186 | 4.013 | ||||||
| 2026-02-17 | 13F | Alliancebernstein L.p. | 3.518.146 | -27,60 | 165.564 | -18,90 | ||||
| 2026-02-05 | 13F | Thrivent Financial For Lutherans | 38.697 | 72,18 | 2 | |||||
| 2026-02-13 | 13F | Golden State Wealth Management, LLC | 9.815 | 0,12 | 462 | 12,17 | ||||
| 2026-02-06 | 13F | GPS Wealth Strategies Group, LLC | 4.666 | -93,95 | 220 | -93,24 | ||||
| 2026-01-20 | 13F | Stratos Wealth Partners, LTD. | 12.825 | -0,39 | 604 | 11,67 | ||||
| 2026-02-17 | 13F | Two Sigma Investments, Lp | 443.693 | 1.675,13 | 20.880 | 1.888,57 | ||||
| 2026-02-17 | 13F | Boothbay Fund Management, Llc | 232.381 | -13,28 | 10.936 | -2,86 | ||||
| 2026-02-12 | 13F | Swiss National Bank | 332.300 | 7,51 | 15.638 | 20,43 | ||||
| 2026-02-11 | 13F | Rise Advisors, LLC | 0 | -100,00 | 0 | |||||
| 2026-01-20 | 13F | Savvy Advisors, Inc. | 5.288 | 0,23 | 249 | 12,22 | ||||
| 2026-02-13 | 13F | FJ Capital Management LLC | 50.798 | -34,77 | 2.391 | -26,93 | ||||
| 2026-02-04 | 13F | Ameritas Advisory Services, LLC | 7.804 | -33,52 | 367 | -25,56 | ||||
| 2026-02-17 | 13F | Westwood Holdings Group Inc | 0 | -100,00 | 0 | |||||
| 2026-02-13 | 13F | Smartleaf Asset Management LLC | 3.437 | 960,80 | 164 | 1.161,54 | ||||
| 2025-11-13 | 13F | Total Investment Management Inc | 0 | -100,00 | 0 | |||||
| 2026-02-05 | 13F | Convergence Investment Partners, LLC | 18.700 | 14,78 | 880 | 28,65 | ||||
| 2026-01-29 | 13F | Nbc Securities, Inc. | 40 | 11,11 | 2 | 0,00 | ||||
| 2026-01-12 | 13F | Rialto Wealth Management, LLC | 17 | 0,00 | 1 | |||||
| 2026-02-10 | 13F | Seven Grand Managers, Llc | 100.000 | 4.706 | ||||||
| 2025-11-13 | 13F/A | Cynosure Management, Llc | 23.202 | 0,00 | 975 | 14,32 | ||||
| 2026-01-28 | 13F | Ai Financial Services Llc | 7.422 | 8,40 | 349 | 21,60 | ||||
| 2026-02-17 | 13F | Price T Rowe Associates Inc /md/ | 1.001.938 | 0,28 | 47 | 14,63 | ||||
| 2026-01-26 | 13F | Asset Dedication, LLC | 5.141 | 0,00 | 242 | 12,09 | ||||
| 2026-02-23 | 13F | Virtu Financial LLC | 0 | -100,00 | 0 | |||||
| 2026-01-26 | 13F | PFG Investments, LLC | 5.347 | -13,90 | 252 | -3,46 | ||||
| 2026-02-17 | 13F | Susquehanna International Group, Llp | 833.624 | 10.236,32 | 39.230 | 11.506,51 | ||||
| 2026-02-17 | 13F | Susquehanna International Group, Llp | Call | 6.900 | -51,41 | 325 | -45,64 | |||
| 2026-02-10 | 13F | Acadian Asset Management Llc | 1.218 | 0 | ||||||
| 2026-02-17 | 13F | Ameriprise Financial Inc | 226.643 | 86,31 | 10.668 | 108,67 | ||||
| 2026-02-10 | 13F | Goldman Sachs Group Inc | Call | 8.000 | 376 | |||||
| 2026-02-10 | 13F | Goldman Sachs Group Inc | 897.377 | 65,22 | 42.231 | 85,07 | ||||
| 2026-02-17 | 13F | XTX Topco Ltd | 23.967 | -55,70 | 1.128 | -50,40 | ||||
| 2026-02-13 | 13F | Transamerica Financial Advisors, Inc. | 2 | 0 | ||||||
| 2026-01-07 | 13F | Harbor Investment Advisory, Llc | 448 | 21 | ||||||
| 2026-02-13 | 13F | Parkside Financial Bank & Trust | 75 | 0,00 | 4 | 0,00 | ||||
| 2026-02-10 | 13F | Nvest Financial, LLC | 17.006 | 46,28 | 800 | 63,93 | ||||
| 2025-11-10 | 13F | Lion Street Advisors, LLC | 0 | -100,00 | 0 | |||||
| 2026-02-13 | 13F | Venture Visionary Partners LLC | 4.720 | 222 | ||||||
| 2026-02-17 | 13F | Millennium Management Llc | 658.411 | 264,39 | 30.985 | 308,22 | ||||
| 2026-02-17 | 13F | Quantinno Capital Management LP | 15.827 | 109,13 | 745 | 134,70 | ||||
| 2026-02-13 | 13F | Acumen Wealth Advisors, LLC | 299 | 14 | ||||||
| 2026-02-17 | 13F | Jump Financial, LLC | 75.830 | 3.569 | ||||||
| 2026-02-17 | 13F | Wellington Management Group Llp | 7.922.818 | -8,50 | 372.848 | 2,50 | ||||
| 2026-02-17 | 13F | Covalis Capital Llp | 300.000 | 14.118 | ||||||
| 2026-02-10 | 13F | Florida Financial Advisors, Llc | 19.542 | 31,80 | 919 | 47,59 | ||||
| 2026-02-12 | 13F | Jane Street Group, Llc | 536.874 | -14,01 | 25.265 | -3,68 | ||||
| 2026-02-12 | 13F | Jane Street Group, Llc | Call | 5.500 | 259 | |||||
| 2026-02-17 | 13F | DV Trading LLC | 170 | 8 | ||||||
| 2026-01-23 | 13F | Avion Wealth | 11 | 0 | ||||||
| 2026-02-13 | 13F | Silicon Valley Capital Partners | 513 | 0,59 | 24 | 14,29 | ||||
| 2026-02-12 | 13F | Voya Investment Management Llc | 29.225 | 0,00 | 1.375 | 12,06 | ||||
| 2026-02-12 | 13F | CIBC Private Wealth Group, LLC | 1.799 | -3,90 | 85 | 7,69 | ||||
| 2026-01-29 | 13F | Concurrent Investment Advisors, LLC | 20.894 | 5,71 | 983 | 18,43 | ||||
| 2026-02-18 | 13F/A | Pinnacle Financial Partners, Inc. | 7.208 | 339 | ||||||
| 2026-02-12 | 13F | Loomis Sayles & Co L P | 761 | 0,00 | 36 | 12,90 | ||||
| 2026-02-03 | 13F | Gallacher Capital Management LLC | 18.732 | -1,01 | 882 | 10,96 | ||||
| 2026-04-07 | 13F | Park Avenue Securities Llc | 6.930 | 5,24 | 0 | |||||
| 2026-02-09 | 13F | Huntington National Bank | 2.157 | -3,40 | 102 | 8,60 | ||||
| 2026-02-17 | 13F | State Of Wisconsin Investment Board | 198.706 | 8,88 | 9.351 | 21,96 | ||||
| 2026-02-09 | 13F | Prospera Financial Services Inc | 36.561 | -1,31 | 1.721 | 10,54 | ||||
| 2026-01-21 | 13F | Yousif Capital Management, Llc | 7.138 | 338 | ||||||
| 2026-02-17 | 13F | Twinbeech Capital Lp | 0 | -100,00 | 0 | |||||
| 2026-02-17 | 13F | Qube Research & Technologies Ltd | 2.376.873 | 72,53 | 111.856 | 93,26 | ||||
| 2026-02-17 | 13F | Captrust Financial Advisors | 17.631 | 0,68 | 830 | 12,79 | ||||
| 2026-01-28 | 13F | Geneos Wealth Management Inc. | 24.986 | -3,74 | 1.176 | 7,80 | ||||
| 2026-02-10 | 13F | Tidemark, LLC | 3.199 | 0,13 | 151 | 11,94 | ||||
| 2026-02-11 | 13F | Vestcor Inc | 66.592 | -37,59 | 3 | -25,00 | ||||
| 2026-01-23 | 13F | Optima Capital Llc | 318 | 15 | ||||||
| 2026-04-06 | 13F | GAMMA Investing LLC | 3.042 | 22,27 | 143 | 22,22 | ||||
| 2026-02-11 | 13F | Erste Asset Management GmbH | 29.000 | 1.401 | ||||||
| 2026-03-02 | 13F | Amicus Financial Advisors, LLC | 4.375 | 206 | ||||||
| 2026-02-05 | 13F | Bessemer Group Inc | 195 | 0,00 | 0 | |||||
| 2026-01-12 | 13F | World Equity Group, Inc. | 10.058 | -1,19 | 473 | 10,77 | ||||
| 2026-01-15 | 13F | SILVER OAK SECURITIES, Inc | 39.739 | 82,26 | 1.897 | 107,10 | ||||
| 2026-02-17 | 13F | TCG Advisory Services, LLC | 5.014 | 0,00 | 236 | 11,90 | ||||
| 2025-11-14 | 13F | Centiva Capital, LP | 0 | -100,00 | 0 | |||||
| 2026-02-09 | 13F | Quest Partners LLC | 5.190 | -61,29 | 244 | -56,66 | ||||
| 2026-01-07 | 13F | Massmutual Trust Co Fsb/adv | 174 | 1,16 | 8 | 14,29 | ||||
| 2026-02-11 | 13F | Simplex Trading, Llc | 0 | -100,00 | 0 | |||||
| 2026-02-11 | 13F | Capital Analysts, Inc. | 165 | 0 | ||||||
| 2026-02-06 | 13F | ProShare Advisors LLC | 30.927 | 13,54 | 1.455 | 27,19 | ||||
| 2026-02-11 | 13F | 111 Capital | 4.362 | 205 | ||||||
| 2026-02-14 | 13F | POM Investment Strategies, LLC | 3.084 | 49,13 | 145 | 68,60 | ||||
| 2026-02-17 | 13F | Coastal Bridge Advisors, LLC | 4.728 | -4,77 | 222 | 6,73 | ||||
| 2026-02-05 | 13F | High Note Wealth, LLC | 78 | -11,36 | 4 | 0,00 | ||||
| 2026-01-15 | 13F | Brookstone Capital Management | 6.945 | 7,03 | 327 | 19,85 | ||||
| 2026-02-04 | 13F | Anson Capital, Inc. | 7.268 | -0,74 | 342 | 11,40 | ||||
| 2025-10-29 | 13F | J.Safra Asset Management Corp | 0 | -100,00 | 0 | -100,00 | ||||
| 2026-01-28 | 13F | Turtle Creek Wealth Advisors, LLC | 0 | -100,00 | 0 | |||||
| 2026-02-11 | 13F | J.w. Cole Advisors, Inc. | 45.722 | -20,89 | 2.130 | -12,24 | ||||
| 2026-02-17 | 13F | Public Employees Retirement System Of Ohio | 244.665 | 0,84 | 11.514 | 12,96 | ||||
| 2026-02-17 | 13F | Norinchukin Bank, The | 8.096 | 1,58 | 381 | 13,77 | ||||
| 2025-11-13 | 13F | Promus Capital, LLC | 3.009 | 0,00 | 126 | 14,55 | ||||
| 2026-02-13 | 13F | Arkadios Wealth Advisors | 42.246 | 22,37 | 1.988 | 37,10 | ||||
| 2026-04-08 | 13F | Accel Wealth Management | 15.451 | 0,32 | 729 | 0,55 | ||||
| 2026-02-13 | 13F | Morgan Stanley | 1.810.013 | 39,59 | 85.179 | 56,37 | ||||
| 2026-02-17 | 13F | Balyasny Asset Management Llc | 2.153.129 | 353,98 | 101.326 | 408,56 | ||||
| 2026-04-08 | 13F | First Heartland Consultants, Inc. | 5.317 | 1,61 | 251 | 1,63 | ||||
| 2026-01-22 | 13F | Glass Jacobson Investment Advisors llc | 40.100 | 0,02 | 1.887 | 12,05 | ||||
| 2026-02-09 | 13F | Harbour Investments, Inc. | 13.247 | 11,39 | 623 | 24,85 | ||||
| 2026-02-13 | 13F | Apriem Advisors | 5.981 | -0,94 | 281 | 11,07 | ||||
| 2026-01-30 | 13F | Archer Investment Corp | 310 | -33,33 | 15 | -26,32 | ||||
| 2026-02-13 | 13F | Arrowstreet Capital, Limited Partnership | 550.738 | 78,63 | 25.918 | 100,10 | ||||
| 2026-02-13 | 13F | Prudential Financial Inc | 3.448.572 | -15,24 | 162.290 | -5,06 | ||||
| 2026-02-13 | 13F | Victory Capital Management Inc | 322.493 | -3,35 | 15.177 | 8,27 | ||||
| 2026-02-13 | 13F | Van Eck Associates Corp | 45.217 | 16,69 | 2 | 100,00 | ||||
| 2026-01-07 | 13F | Aventura Private Wealth, LLC | 0 | -100,00 | 0 | -100,00 | ||||
| 2026-02-13 | 13F | Journey Strategic Wealth Llc | 21.717 | -41,02 | 1.022 | -33,89 | ||||
| 2025-11-13 | 13F | Employees Retirement System of Texas | 0 | -100,00 | 0 | |||||
| 2026-04-07 | 13F | Signaturefd, Llc | 1.752 | 13,55 | 83 | 13,89 | ||||
| 2026-01-29 | 13F | Dunhill Financial, LLC | 8 | 0 | ||||||
| 2026-02-13 | 13F | Sofos Investments, Inc. | 481 | 0,00 | 23 | 10,00 | ||||
| 2026-02-09 | 13F | Keating Financial Advisory Services, Inc. | 50 | 2 | ||||||
| 2026-02-17 | 13F | MIRAE ASSET GLOBAL ETFS HOLDINGS Ltd. | 78.609 | 6,22 | 3.699 | 19,02 | ||||
| 2026-01-22 | 13F | Apollon Wealth Management, LLC | 9.380 | -3,04 | 441 | 8,62 | ||||
| 2026-02-13 | 13F | Navis Wealth Advisors, LLC | 4.428 | 208 | ||||||
| 2026-02-12 | 13F | Federation des caisses Desjardins du Quebec | 44.628 | -22,76 | 2.100 | -13,47 |