Grundlæggende statistik
| Institutionelle aktier (lange) | 398.857.203 - 83,23% (ex 13D/G) - change of -1,17MM shares -0,99% MRQ |
| Institutionel værdi (lang) | $ 52.413.412 USD ($1000) |
Institutionelt ejerskab og aktionærer
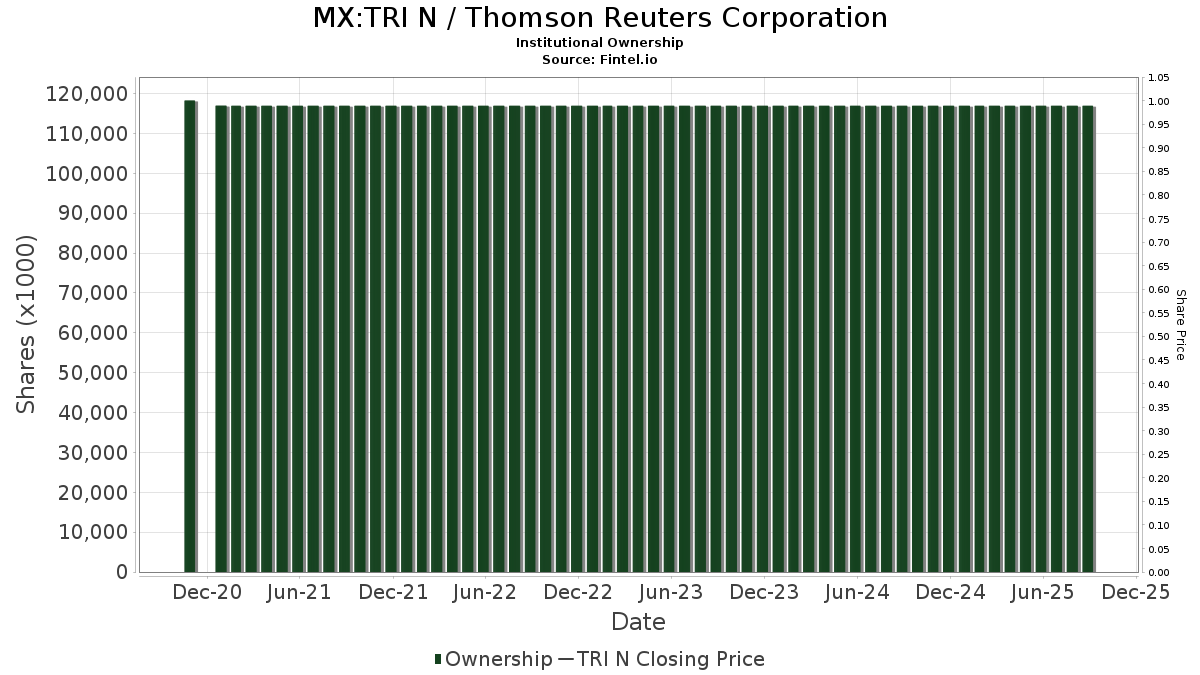
Thomson Reuters Corporation (MX:TRI N) har 486 institutionelle ejere og aktionærer, der har indsendt 13D/G- eller 13F-formularer til Securities Exchange Commission (SEC). Disse institutioner har i alt 398,857,203 aktier. Største aktionærer omfatter Woodbridge CO LTD, Royal Bank Of Canada, Bank Of Montreal /can/, Vanguard Group Inc, 1832 Asset Management L.P., Fmr Llc, Td Asset Management Inc, TLT Family Holdco ULC, LCC Family Corp., and SEG Family Corp. .
Thomson Reuters Corporation (BMV:TRI N) institutionel ejerskabsstruktur viser aktuelle positioner i virksomheden efter institutioner og fonde, samt seneste ændringer i positionsstørrelse. Større aktionærer kan omfatte individuelle investorer, investeringsforeninger, hedgefonde eller institutioner. Skema 13D angiver, at investoren besidder (eller besidder) mere end 5 % af virksomheden og har til hensigt (eller har til hensigt at) aktivt at forfølge en ændring i forretningsstrategi. Skema 13G indikerer en passiv investering på over 5%.
Fondens stemningsscore
Fund Sentiment Score (fka Ownership Accumulation Score) finder de aktier, der bliver mest købt af fonde. Det er resultatet af en sofistikeret, multi-faktor kvantitativ model, der identificerer virksomheder med de højeste niveauer af institutionel akkumulering. Scoringsmodellen bruger en kombination af den samlede stigning i oplyste ejere, ændringerne i porteføljeallokeringer i disse ejere og andre målinger. Tallet går fra 0 til 100, hvor højere tal indikerer et højere niveau af akkumulering for sine jævnaldrende, og 50 er gennemsnittet.
Opdateringsfrekvens: Dagligt
Se Ownership Explorer, som giver en liste over højest rangerende virksomheder.
AI+ Ask Fintel’s AI assistant about Thomson Reuters Corporation.
Select a question to share a public post with an AI-crafted answer.
Thinking of good questions…
13F og NPORT arkivering
Detaljer om 13F-arkivering er gratis. Detaljer om NP-ansøgninger kræver et premium-medlemskab. Grønne rækker angiver nye positioner. Røde rækker angiver lukkede positioner. Klik på linket ikon for at se den fulde transaktionshistorik.
Opgrader
for at låse premium-data op og eksportere til Excel ![]() .
.
| Fil dato | Kilde | Investor | Type | Gennemsnitlig pris (Øst) |
Aktier | Δ Aktier (%) |
Rapporteret Værdi ($1000) |
Δ Værdi (%) |
Port Alloc (%) |
|
|---|---|---|---|---|---|---|---|---|---|---|
| 2026-02-05 | 13F | Cambridge Investment Research Advisors, Inc. | 13.828 | 33,71 | 2 | 0,00 | ||||
| 2026-02-17 | 13F | Jain Global LLC | 23.742 | -16,52 | 3.131 | -29,10 | ||||
| 2026-04-28 | 13F | Alberta Investment Management Corp | 35.805 | 123,78 | 3.232 | 53,10 | ||||
| 2026-02-13 | 13F | 1832 Asset Management L.P. | 5.254.469 | 191,85 | 693.012 | 147,81 | ||||
| 2026-02-13 | 13F | Storgate, LLC | 2.543 | 335 | ||||||
| 2026-02-18 | 13F | Vident Advisory, LLC | 2.572 | -0,43 | 339 | -15,46 | ||||
| 2026-02-13 | 13F | Mml Investors Services, Llc | 6.931 | -8,09 | 914 | -21,95 | ||||
| 2026-01-27 | 13F | Jackson, Grant Investment Advisers, Inc. | 3.664 | 0,00 | 484 | -14,94 | ||||
| 2026-02-17 | 13F | Ancora Advisors, LLC | 13 | 0,00 | 2 | -50,00 | ||||
| 2026-02-11 | 13F | O'shaughnessy Asset Management, Llc | 13.694 | -26,42 | 1.806 | -37,49 | ||||
| 2026-02-06 | 13F/A | Rathbone Brothers plc | 71.186 | -20,75 | 9.407 | -32,57 | ||||
| 2026-01-20 | 13F | Tritonpoint Wealth, Llc | 0 | -100,00 | 0 | |||||
| 2026-04-20 | 13F | Jfs Wealth Advisors, Llc | 0 | -100,00 | 0 | |||||
| 2026-01-16 | 13F | Hopwood Financial Services, Inc. | 0 | -100,00 | 0 | |||||
| 2026-02-09 | 13F | Geode Capital Management, Llc | 2.224.706 | 3,58 | 297.536 | -11,68 | ||||
| 2026-02-13 | 13F | First Trust Advisors Lp | 1.191.606 | 10,85 | 157.161 | -5,88 | ||||
| 2026-02-11 | 13F | Franklin Resources Inc | 54.823 | -8,70 | 7.235 | -22,40 | ||||
| 2026-02-13 | 13F | Blueshift Asset Management, LLC | 11.934 | 7,24 | 1.574 | -8,97 | ||||
| 2025-11-14 | 13F | Truvestments Capital Llc | 0 | 0 | ||||||
| 2026-02-10 | 13F | Sivia Capital Partners, LLC | 1.660 | -2,81 | 219 | -17,74 | ||||
| 2025-11-14 | 13F | Hrt Financial Lp | 0 | -100,00 | 0 | -100,00 | ||||
| 2026-02-13 | 13F | Arrowstreet Capital, Limited Partnership | 9.014 | 130,83 | 1.189 | 96,04 | ||||
| 2026-02-13 | 13F | First National Bank Of Omaha | 3.158 | 419 | ||||||
| 2026-01-15 | 13F | Nisa Investment Advisors, Llc | 306 | -49,75 | 40 | -57,45 | ||||
| 2025-11-10 | 13F | Marshall & Sterling Wealth Advisors Inc. | 0 | -100,00 | 0 | -100,00 | ||||
| 2026-01-05 | 13F | Argent Capital Management Llc | 0 | -100,00 | 0 | |||||
| 2026-02-11 | 13F | Capital Analysts, Inc. | 66 | -14,29 | 0 | |||||
| 2026-01-08 | 13F | Sound View Wealth Advisors Group, LLC | 0 | -100,00 | 0 | |||||
| 2026-02-03 | 13F/A | Mount Yale Investment Advisors, LLC | 0 | -100,00 | 0 | -100,00 | ||||
| 2026-02-17 | 13F | United Capital Financial Advisers, Llc | 62.915 | -3,51 | 8.298 | -18,08 | ||||
| 2026-02-17 | 13F | Bank Of America Corp /de/ | 1.094.266 | -10,26 | 144.323 | -23,80 | ||||
| 2025-11-17 | 13F | IMS Capital Management | 2.868 | -8,75 | 445 | -29,59 | ||||
| 2026-02-06 | 13F | Callahan Advisors, LLC | 26.314 | 0,00 | 3.471 | -15,10 | ||||
| 2026-02-17 | 13F | Coastal Bridge Advisors, LLC | 6.184 | 7,75 | 816 | -8,53 | ||||
| 2026-02-17 | 13F | Aqr Capital Management Llc | 72.605 | 194,07 | 9.579 | 149,78 | ||||
| 2026-02-17 | 13F | Tower Research Capital LLC (TRC) | 20.684 | 35,55 | 2.728 | 15,11 | ||||
| 2025-11-14 | 13F | Peak6 Llc | Call | 0 | -100,00 | 0 | ||||
| 2026-04-27 | 13F | Certior Financial Group, Llc | 4.985 | 449 | ||||||
| 2025-10-30 | 13F | Twin Peaks Wealth Advisors, LLC | 0 | -100,00 | 0 | -100,00 | ||||
| 2026-04-20 | 13F | Ritholtz Wealth Management | 0 | -100,00 | 0 | |||||
| 2026-02-13 | 13F | Headlands Technologies LLC | 15.963 | 2,91 | 2.105 | -12,62 | ||||
| 2026-04-29 | 13F | Skopos Labs, Inc. | 3.654 | 329 | ||||||
| 2025-11-14 | 13F | Icon Wealth Advisors, LLC | 0 | -100,00 | 0 | -100,00 | ||||
| 2026-04-24 | 13F | Private Advisor Group, LLC | 0 | -100,00 | 0 | |||||
| 2026-02-10 | 13F | Savant Capital, LLC | 3.708 | -7,25 | 489 | -21,26 | ||||
| 2025-11-05 | 13F | Wellington Shields Capital Management, LLC | 0 | -100,00 | 0 | -100,00 | ||||
| 2026-04-28 | 13F | Quent Capital, LLC | 150 | 0,00 | 13 | -31,58 | ||||
| 2026-01-29 | 13F | Vanguard Group Inc | 5.776.640 | 1,51 | 762.320 | -13,73 | ||||
| 2026-01-30 | 13F | Mitsubishi UFJ Trust & Banking Corp | 33.400 | 4.355 | ||||||
| 2025-10-31 | 13F | Whittier Trust Co | 0 | -100,00 | 0 | -100,00 | ||||
| 2026-02-13 | 13F | Cornerstone Financial Management LLC | 17 | 2 | ||||||
| 2026-02-17 | 13F | Credit Agricole S A | 33.572 | 22,85 | 4.428 | 4,31 | ||||
| 2025-11-14 | 13F | Point72 (DIFC) Ltd | 14.069 | 2.185 | ||||||
| 2026-02-11 | 13F | Simplex Trading, Llc | 295 | 39 | ||||||
| 2026-01-29 | 13F | UBS Group AG | 440.146 | 40,06 | 58.051 | 18,93 | ||||
| 2025-11-14 | 13F | ICONIQ Capital, LLC | 0 | -100,00 | 0 | -100,00 | ||||
| 2026-04-23 | 13F | Oppenheimer Asset Management Inc. | 2.595 | 39,59 | 233 | -4,90 | ||||
| 2026-02-17 | 13F | Wellington Management Group Llp | 0 | -100,00 | 0 | |||||
| 2026-02-17 | 13F | Utah Retirement Systems | 15.381 | 0,00 | 2.032 | -14,91 | ||||
| 2026-04-17 | 13F | Anchyra Partners Llc | 2.325 | 3,38 | 209 | -29,39 | ||||
| 2026-02-11 | 13F | Syon Capital Llc | 4.963 | 655 | ||||||
| 2026-02-23 | 13F | Mv Capital Management, Inc. | 1 | 0 | ||||||
| 2026-04-22 | 13F | Apollon Wealth Management, LLC | 3.885 | -53,05 | 350 | -68,01 | ||||
| 2026-02-13 | 13F | Ossiam | 0 | -100,00 | 0 | |||||
| 2026-04-08 | 13F | Wealth Enhancement Trust Services, Inc. | 2.039 | 183 | ||||||
| 2026-02-17 | 13F | First Manhattan Co | 0 | -100,00 | 0 | |||||
| 2026-04-28 | 13F | Westbourne Investment Advisors, Inc. | 0 | -100,00 | 0 | |||||
| 2026-02-13 | 13F | Korea Investment CORP | 82.744 | -0,24 | 10.934 | -15,13 | ||||
| 2026-02-17 | 13F | FIL Ltd | 89.676 | -84,37 | 11.834 | -86,72 | ||||
| 2026-02-17 | 13F | Quadrature Capital Ltd | 372.700 | 2.105,33 | 49.248 | 1.777,54 | ||||
| 2026-01-23 | 13F | Assetmark, Inc | 2.315 | -97,01 | 305 | -97,46 | ||||
| 2026-04-28 | 13F | K.J. Harrison & Partners Inc | 0 | -100,00 | 0 | |||||
| 2026-01-12 | 13F | Daymark Wealth Partners, Llc | 0 | -100,00 | 0 | |||||
| 2026-02-13 | 13F | Marshall Wace, Llp | 0 | -100,00 | 0 | |||||
| 2025-11-14 | 13F | AXA Investment Managers S.A. | 153.538 | 23.849 | ||||||
| 2026-04-28 | 13F | Stratos Wealth Partners, LTD. | 73.335 | 421,59 | 6.599 | 255,88 | ||||
| 2026-02-10 | 13F | Intech Investment Management Llc | 8.002 | -88,56 | 1.057 | -90,27 | ||||
| 2026-02-13 | 13F | Royal London Asset Management Ltd | 8.037 | 1,70 | 1.060 | -13,61 | ||||
| 2026-01-14 | 13F | Bond & Devick Financial Network, Inc. | 0 | -100,00 | 0 | -100,00 | ||||
| 2026-02-03 | 13F | Maxi Investments CY Ltd | 0 | -100,00 | 0 | |||||
| 2026-02-12 | 13F | Sit Investment Associates Inc | 0 | -100,00 | 0 | |||||
| 2026-01-16 | 13F | Crewe Advisors LLC | 524 | -17,09 | 69 | -29,59 | ||||
| 2026-04-13 | 13F | IFP Advisors, Inc | 15 | -82,56 | 1 | -90,91 | ||||
| 2026-04-17 | 13F | IFC & Insurance Marketing, Inc. | 0 | -100,00 | 0 | |||||
| 2026-02-12 | 13F | Cibc World Markets Corp | 21.609 | 2.850 | ||||||
| 2026-02-12 | 13F | Commonwealth Equity Services, Llc | 7.431 | -14,32 | 980 | 97.900,00 | ||||
| 2026-02-13 | 13F | Kestra Advisory Services, LLC | 0 | -100,00 | 0 | |||||
| 2025-11-14 | 13F | Walleye Capital LLC | Put | 0 | -100,00 | 0 | -100,00 | |||
| 2026-02-10 | 13F | Jupiter Asset Management Ltd | 0 | -100,00 | 0 | |||||
| 2025-11-10 | 13F | Resources Investment Advisors, LLC. | 0 | -100,00 | 0 | -100,00 | ||||
| 2026-02-10 | 13F | Catalyst Capital Advisors LLC | 113 | -49,33 | 15 | -58,82 | ||||
| 2026-02-11 | 13F | Clearbridge Investments, LLC | 234.156 | 30.883 | ||||||
| 2025-11-07 | 13F | Wealthcare Advisory Partners LLC | 0 | -100,00 | 0 | -100,00 | ||||
| 2026-02-06 | 13F | Harvest Portfolios Group Inc. | 3.365 | 18,44 | 444 | 0,68 | ||||
| 2026-01-29 | 13F | Sanctuary Advisors, LLC | 3.875 | -2,98 | 512 | -17,42 | ||||
| 2026-02-17 | 13F | Mercer Global Advisors Inc /adv | 3.349 | 2,95 | 442 | -12,67 | ||||
| 2026-02-10 | 13F | BKD Wealth Advisors, LLC | 2.233 | 6,89 | 295 | -9,26 | ||||
| 2026-04-17 | 13F | Cidel Asset Management Inc | 107.248 | 122,11 | 9.649 | 51,24 | ||||
| 2026-02-17 | 13F | Snowden Capital Advisors LLC | 0 | -100,00 | 0 | |||||
| 2025-11-17 | 13F | Kestra Investment Management, LLC | 0 | -100,00 | 0 | |||||
| 2026-04-29 | 13F | CVA Family Office, LLC | 10 | 1 | ||||||
| 2026-04-24 | 13F | Root Financial Partners, LLC | 1 | 0 | ||||||
| 2026-02-10 | 13F | Goldman Sachs Group Inc | 2.319.776 | -3,76 | 305.955 | -18,28 | ||||
| 2026-02-17 | 13F | State Of Wisconsin Investment Board | 55.036 | 7.272 | ||||||
| 2026-02-13 | 13F | Manufacturers Life Insurance Company, The | 0 | -100,00 | 0 | |||||
| 2026-02-05 | 13F | Stephens Inc /ar/ | 0 | -100,00 | 0 | -100,00 | ||||
| 2026-02-06 | 13F | EverSource Wealth Advisors, LLC | 1.042 | -13,74 | 137 | -26,74 | ||||
| 2026-02-10 | 13F | Bank of New York Mellon Corp | 493.071 | 10,46 | 65.031 | -6,21 | ||||
| 2026-01-28 | 13F | CAPROCK Group, Inc. | 4.742 | 53,96 | 625 | 13,84 | ||||
| 2026-04-06 | 13F | Versant Capital Management, Inc | 2.114 | 41,88 | 190 | -3,06 | ||||
| 2026-04-15 | 13F | DAVENPORT & Co LLC | 2.301 | 0,00 | 207 | -31,91 | ||||
| 2026-02-02 | 13F | Principal Financial Group Inc | 21.196 | 1,19 | 2.801 | -13,93 | ||||
| 2026-02-12 | 13F | Voya Investment Management Llc | 18.693 | -2,50 | 2.470 | -17,03 | ||||
| 2026-01-29 | 13F | D.a. Davidson & Co. | 2.739 | 0,00 | 361 | -15,06 | ||||
| 2025-11-13 | 13F | Seacrest Wealth Management, Llc | 0 | -100,00 | 0 | -100,00 | ||||
| 2026-02-13 | 13F | Umb Bank N A/mo | 119 | -73,02 | 16 | -77,94 | ||||
| 2026-02-13 | 13F | Evelyn Partners Investment Management LLP | 6.177 | -4,35 | 815 | -18,66 | ||||
| 2026-01-20 | 13F | Cromwell Holdings LLC | 508 | 0,00 | 67 | -14,10 | ||||
| 2026-02-17 | 13F | Trexquant Investment LP | 23.018 | -76,67 | 3.036 | -80,20 | ||||
| 2025-11-12 | 13F | Buckingham Strategic Partners | 0 | -100,00 | 0 | |||||
| 2026-04-21 | 13F | Value Partners Investments Inc. | 6.286 | 5,31 | 566 | -28,17 | ||||
| 2026-02-11 | 13F | Zions Bancorporation, National Association /ut/ | 84 | 0,00 | 11 | -15,38 | ||||
| 2026-02-17 | 13F | Amundi | 429.944 | 43,22 | 56.705 | 24,25 | ||||
| 2025-11-14 | 13F | Wexford Capital Lp | 0 | -100,00 | 0 | -100,00 | ||||
| 2026-04-29 | 13F | Montag A & Associates Inc | 275 | -15,38 | 25 | -42,86 | ||||
| 2026-02-13 | 13F | Aviso Financial Inc. | 0 | -100,00 | 0 | |||||
| 2026-02-17 | 13F | Prana Capital Management, LP | 7.787 | 1.027 | ||||||
| 2025-11-14 | 13F | DRW Securities, LLC | 0 | -100,00 | 0 | |||||
| 2026-04-21 | 13F | Maseco Llp | 46 | 0,00 | 4 | -33,33 | ||||
| 2026-02-11 | 13F | Palladiem, Llc | 155 | 21 | ||||||
| 2026-02-17 | 13F | Captrust Financial Advisors | 2.513 | -2,37 | 332 | -17,04 | ||||
| 2026-02-17 | 13F | Occudo Quantitative Strategies Lp | 49.936 | 6.586 | ||||||
| 2026-02-11 | 13F | Manchester Capital Management LLC | 921 | 121 | ||||||
| 2026-02-17 | 13F | Prosperity Consulting Group, LLC | 4.806 | -0,15 | 634 | -15,26 | ||||
| 2026-02-17 | 13F | GeoWealth Management, LLC | 0 | -100,00 | 0 | |||||
| 2026-03-02 | 13F | Tobam | 748 | -6,73 | 0 | |||||
| 2026-02-13 | 13F | JustInvest LLC | 9.932 | -21,53 | 1.310 | -33,86 | ||||
| 2026-02-17 | 13F | Guggenheim Capital Llc | 103.099 | 0,91 | 13.598 | -14,32 | ||||
| 2026-01-09 | 13F | 180 Wealth Advisors, Llc | 0 | -100,00 | 0 | |||||
| 2026-02-11 | 13F | Jpmorgan Chase & Co | 761.992 | -39,73 | 100.499 | -48,82 | ||||
| 2026-02-11 | 13F | 111 Capital | 8.322 | 1.098 | ||||||
| 2025-11-14 | 13F | Capstone Investment Advisors, Llc | 6.234 | 968 | ||||||
| 2026-04-24 | 13F | Profund Advisors Llc | 28.551 | -18,50 | 2.569 | -44,39 | ||||
| 2026-02-13 | 13F | SRS Capital Advisors, Inc. | 890 | -19,60 | 118 | -31,98 | ||||
| 2026-02-13 | 13F | Macquarie Group Ltd | 4.456 | 588 | ||||||
| 2026-02-10 | 13F | Bnp Paribas Arbitrage, Sa | 483.198 | 26,46 | 63.729 | 7,38 | ||||
| 2026-02-11 | 13F | Parallel Advisors, LLC | 2.873 | 3,16 | 379 | -12,27 | ||||
| 2026-02-12 | 13F | BlackRock, Inc. | 1.350.839 | -28,32 | 178.162 | -39,14 | ||||
| 2026-02-06 | 13F | First Business Financial Services, Inc. | 3.942 | 0,00 | 520 | -15,20 | ||||
| 2025-11-07 | 13F | Advisors Capital Management, LLC | 0 | -100,00 | 0 | -100,00 | ||||
| 2026-02-06 | 13F | KDT Advisors, LLC | 2.503 | 8,92 | 330 | -7,30 | ||||
| 2026-02-12 | 13F | Ensign Peak Advisors, Inc | 8.176 | 5,14 | 1.080 | -10,52 | ||||
| 2026-04-13 | 13F | True Wealth Design, LLC | 186 | 353,66 | 17 | 220,00 | ||||
| 2026-04-23 | 13F | North Star Investment Management Corp. | 45 | 4 | ||||||
| 2026-02-13 | 13F | Timelo Investment Management Inc. | 12.000 | 1.583 | ||||||
| 2026-01-12 | 13F | Legacy Wealth Asset Management, LLC | 0 | -100,00 | 0 | -100,00 | ||||
| 2026-02-17 | 13F | Janus Henderson Group Plc | 13.676 | -9,29 | 1.822 | -22,40 | ||||
| 2026-02-17 | 13F | Two Sigma Advisers, Lp | 178.846 | 110,32 | 23.588 | 78,58 | ||||
| 2026-02-12 | 13F | Scotia Capital Inc. | 367.317 | 27,25 | 48.379 | 8,35 | ||||
| 2026-01-23 | 13F | Bridgewater Advisors Inc. | 2.511 | 0,36 | 302 | -13,26 | ||||
| 2026-04-17 | 13F | Murphy & Mullick Capital Management Corp | 48 | 0,00 | 4 | -33,33 | ||||
| 2026-01-20 | 13F | Cigna Investments Inc /new | 2.864 | 0,00 | 0 | |||||
| 2026-01-23 | 13F | Halbert Hargrove Global Advisors, Llc | 0 | -100,00 | 0 | |||||
| 2026-02-13 | 13F | MAI Capital Management | 627 | 2.311,54 | 83 | 1.950,00 | ||||
| 2026-02-10 | 13F | Moors & Cabot, Inc. | 2.474 | 0,00 | 326 | -15,10 | ||||
| 2026-01-23 | 13F | Sumitomo Mitsui Trust Holdings, Inc. | 77.601 | 19,15 | 10.235 | 1,17 | ||||
| 2026-02-17 | 13F | Boreal Capital Management LLC | 102 | 0,00 | 13 | -13,33 | ||||
| 2026-02-17 | 13F | Quantessence Capital LLC | 0 | -100,00 | 0 | |||||
| 2026-02-12 | 13F | Penserra Capital Management LLC | 27 | 0,00 | 0 | |||||
| 2026-02-12 | 13F | ICICI Prudential Asset Management Co Ltd | 7.139 | 3,15 | 942 | -12,47 | ||||
| 2026-02-13 | 13F | Citigroup Inc | 224.436 | -34,71 | 29.657 | -44,45 | ||||
| 2026-02-18 | 13F | State of Tennessee, Treasury Department | 73.032 | -2,74 | 8.114 | -30,42 | ||||
| 2026-02-13 | 13F | Aigen Investment Management, Lp | 0 | -100,00 | 0 | |||||
| 2026-02-17 | 13F | Citadel Advisors Llc | Call | 39.900 | 353,41 | 5.262 | 285,21 | |||
| 2026-01-21 | 13F | Clayton Financial Group LLC | 0 | -100,00 | 0 | |||||
| 2026-02-17 | 13F | Citadel Advisors Llc | 94.592 | -78,12 | 12.476 | -81,42 | ||||
| 2026-04-24 | 13F | Key FInancial Inc | 2.753 | 0,00 | 248 | -31,96 | ||||
| 2026-02-17 | 13F | Citadel Advisors Llc | Put | 19.800 | 12,50 | 2.611 | -4,46 | |||
| 2026-04-08 | 13F | Dynamic Advisor Solutions LLC | 6.553 | -82,36 | 590 | -87,98 | ||||
| 2026-02-05 | 13F | Qsemble Capital Management, LP | 8.462 | -76,40 | 1.116 | -79,96 | ||||
| 2026-02-17 | 13F | Point72 Asset Management, L.P. | Call | 3.700 | -96,30 | 488 | -96,86 | |||
| 2026-02-17 | 13F | Rakuten Investment Management, Inc. | 24.011 | 289,60 | 3.199 | 544,76 | ||||
| 2026-02-12 | 13F | Northwest & Ethical Investments L.P. | 37.728 | 4,96 | 4.983 | -10,95 | ||||
| 2026-02-17 | 13F | Point72 Asset Management, L.P. | Put | 5.100 | 673 | |||||
| 2026-02-17 | 13F | SageView Advisory Group, LLC | 21 | 3 | ||||||
| 2025-11-06 | 13F | Blume Capital Management, Inc. | 0 | -100,00 | 0 | |||||
| 2025-11-13 | 13F | Riggs Asset Managment Co. Inc. | 0 | -100,00 | 0 | -100,00 | ||||
| 2026-04-16 | 13F | SG Americas Securities, LLC | 113.864 | -17,44 | 10 | -44,44 | ||||
| 2026-02-11 | 13F | Twin Tree Management, LP | 5.787 | 763 | ||||||
| 2026-02-12 | 13F | Hilton Capital Management, LLC | 5.204 | -88,67 | 686 | -90,38 | ||||
| 2025-11-07 | 13F | Sierra Ocean, Llc | 0 | -100,00 | 0 | -100,00 | ||||
| 2026-02-13 | 13F | Transamerica Financial Advisors, Inc. | 155 | 20 | ||||||
| 2025-11-12 | 13F | Davis R M Inc | 0 | -100,00 | 0 | |||||
| 2025-11-13 | 13F | UBS Group AG | Call | 0 | -100,00 | 0 | -100,00 | |||
| 2026-02-13 | 13F | TLT Family Holdco ULC | 4.302.901 | 0,00 | 567.510 | -15,09 | ||||
| 2026-01-27 | 13F | WealthCollab, LLC | 10 | 0,00 | 1 | 0,00 | ||||
| 2026-01-16 | 13F | Trust Co Of Vermont | 184 | 0,00 | 24 | -14,29 | ||||
| 2026-02-13 | 13F | Colony Group, LLC | 5.121 | 46,31 | 676 | 24,31 | ||||
| 2026-02-17 | 13F | Boothbay Fund Management, Llc | 1.834 | 242 | ||||||
| 2026-01-28 | 13F | DekaBank Deutsche Girozentrale | 29.582 | 0,00 | 5 | 0,00 | ||||
| 2026-02-11 | 13F | Outlook Wealth Advisors, LLC | 0 | -100,00 | 0 | -100,00 | ||||
| 2026-02-11 | 13F | Havemeyer Place LP | 5.796 | 764 | ||||||
| 2026-02-10 | 13F | Eurizon Capital SGR S.p.A. | 1.481 | 195 | ||||||
| 2026-02-06 | 13F | Global Retirement Partners, LLC | 50 | 11,11 | 7 | -14,29 | ||||
| 2026-02-10 | 13F | Td Asset Management Inc | 4.664.372 | 0,72 | 616.342 | -14,31 | ||||
| 2026-02-13 | 13F | Candriam Luxembourg S.C.A. | 42.959 | 1.292,06 | 5.677 | 1.084,97 | ||||
| 2026-04-17 | 13F | Paragon Capital Management Inc | 11.082 | 997 | ||||||
| 2026-04-20 | 13F | Banque Cantonale Vaudoise | 0 | -100,00 | 0 | |||||
| 2026-02-13 | 13F | Quarry LP | 0 | -100,00 | 0 | |||||
| 2026-02-17 | 13F | Jones Financial Companies Lllp | 21.077 | -29,48 | 2.780 | -40,76 | ||||
| 2026-04-08 | 13F | Wealth Enhancement Advisory Services, Llc | 32.792 | 67,96 | 2.958 | 16,14 | ||||
| 2025-11-07 | 13F | Axxcess Wealth Management, Llc | 0 | -100,00 | 0 | -100,00 | ||||
| 2026-02-18 | 13F | Guardian Capital Lp | 2.277 | -72,45 | 301 | -76,62 | ||||
| 2026-04-14 | 13F | Prospera Financial Services Inc | 9.320 | 272,80 | 839 | 154,71 | ||||
| 2026-02-13 | 13F | Smartleaf Asset Management LLC | 762 | 24,10 | 101 | 6,32 | ||||
| 2026-04-20 | 13F | First American Bank | 18.173 | -17,65 | 1.635 | -43,81 | ||||
| 2026-04-22 | 13F | JNBA Financial Advisors | 602 | 0,00 | 54 | -31,65 | ||||
| 2026-04-23 | 13F | Capital Investment Counsel, LLC | 0 | -100,00 | 0 | |||||
| 2026-02-17 | 13F | Cresset Asset Management, LLC | 0 | -100,00 | 0 | -100,00 | ||||
| 2026-02-17 | 13F | Principal Street Partners, LLC | 1.524 | -28,65 | 201 | -39,27 | ||||
| 2026-02-17 | 13F | EFG International AG | 21.111 | 2.784 | ||||||
| 2026-02-17 | 13F | Lombard Odier Asset Management (USA) Corp | 10.897 | -1,85 | 1.439 | -16,54 | ||||
| 2026-04-07 | 13F | CoreCap Advisors, LLC | 108 | 0,00 | 10 | -35,71 | ||||
| 2026-04-17 | 13F | Hanson & Doremus Investment Management | 1.533 | 86,27 | 0 | |||||
| 2026-02-02 | 13F | Danske Bank A/s | 685 | -10,22 | 91 | -23,08 | ||||
| 2026-02-11 | 13F | Allianz Asset Management GmbH | 159.246 | 22,90 | 21.042 | 4,56 | ||||
| 2026-04-09 | 13F | Pacifica Partners Inc. | 8 | 0,00 | 1 | -100,00 | ||||
| 2026-04-23 | 13F | Oppenheimer & Co Inc | 8.936 | -0,69 | 804 | -32,21 | ||||
| 2026-02-17 | 13F | Quantinno Capital Management LP | 48.052 | 54,11 | 6.341 | 30,93 | ||||
| 2026-02-17 | 13F | D. E. Shaw & Co., Inc. | 238.591 | 175,06 | 31.489 | 133,88 | ||||
| 2026-02-03 | 13F | Denali Advisors Llc | 0 | -100,00 | 0 | |||||
| 2026-03-04 | 13F | Leonteq Securities AG | 0 | -100,00 | 0 | |||||
| 2026-02-18 | 13F | Beacon Pointe Advisors, LLC | 11.404 | -0,32 | 1.504 | -15,36 | ||||
| 2026-02-04 | 13F | Pacer Advisors, Inc. | 0 | -100,00 | 0 | |||||
| 2025-11-07 | 13F | Wulff, Hansen & Co. | 0 | -100,00 | 0 | |||||
| 2026-01-30 | 13F | Us Bancorp \de\ | 11.003 | -7,19 | 1.451 | -21,18 | ||||
| 2026-02-11 | 13F | Ing Groep Nv | 4.608 | -80,48 | 608 | -83,44 | ||||
| 2026-02-13 | 13F | American Century Companies Inc | 12.134 | 4,15 | 1.601 | -11,45 | ||||
| 2026-02-06 | 13F | Addison Advisors LLC | 1.031 | -10,81 | 136 | -24,58 | ||||
| 2026-02-13 | 13F | DKRT Investments Corp. | 808.847 | 20,50 | 106.679 | 2,32 | ||||
| 2026-02-13 | 13F | Parkside Financial Bank & Trust | 14 | 0,00 | 2 | -50,00 | ||||
| 2026-02-17 | 13F | Agf Management Ltd | 1.113.665 | 27,96 | 147.323 | 8,65 | ||||
| 2026-02-17 | 13F | Northern Trust Corp | 179.221 | -0,13 | 23.637 | -15,20 | ||||
| 2026-02-13 | 13F | Towarzystwo Funduszy Inwestycyjnych Pzu Sa | 0 | -100,00 | 0 | |||||
| 2026-02-17 | 13F | NEOS Investment Management LLC | 187.659 | 37,65 | 24.750 | 16,88 | ||||
| 2026-04-29 | 13F | SilverOak Wealth Management LLC | 3.476 | 0,00 | 313 | -31,88 | ||||
| 2026-02-12 | 13F | Dimensional Fund Advisors Lp | 220.478 | -0,85 | 29.081 | -15,80 | ||||
| 2026-02-13 | 13F | Public Sector Pension Investment Board | 0 | -100,00 | 0 | |||||
| 2026-02-13 | 13F | Squarepoint Ops LLC | 0 | -100,00 | 0 | |||||
| 2026-02-12 | 13F | Skandinaviska Enskilda Banken AB (publ) | 22.419 | -4,29 | 2.957 | -18,75 | ||||
| 2026-02-13 | 13F | BNP Paribas Asset Management Holding S.A. | 443.929 | 51,74 | 78 | 23,81 | ||||
| 2025-11-14 | 13F | Wetherby Asset Management Inc | 18.520 | 0,00 | 2.877 | -22,77 | ||||
| 2026-01-27 | 13F | Asset Management One Co., Ltd. | 89 | 3,49 | 12 | -15,38 | ||||
| 2026-02-12 | 13F | Colonial Trust Co / SC | 686 | 10,11 | 91 | -6,19 | ||||
| 2026-02-13 | 13F | Healthcare Of Ontario Pension Plan Trust Fund | 328.343 | 153,45 | 43.305 | 115,21 | ||||
| 2025-11-12 | 13F | Brucke Financial, Inc. | 0 | -100,00 | 0 | -100,00 | ||||
| 2026-04-20 | 13F | Hilton Head Capital Partners, LLC | 10 | 0,00 | 1 | -100,00 | ||||
| 2025-11-14 | 13F | Cubist Systematic Strategies, LLC | 163.659 | 25.420 | ||||||
| 2026-02-12 | 13F | Bradley Foster & Sargent Inc/ct | 4.178 | 0,00 | 551 | -14,97 | ||||
| 2026-02-17 | 13F | Man Group plc | 94.290 | 47,89 | 12.451 | 25,74 | ||||
| 2026-04-13 | 13F | Creative Financial Designs Inc /adv | 46 | 15,00 | 4 | -20,00 | ||||
| 2026-01-15 | 13F | J. Safra Sarasin Holding AG | 0 | -100,00 | 0 | |||||
| 2026-04-17 | 13F | AdvisorNet Financial, Inc | 33 | 0,00 | 3 | -50,00 | ||||
| 2026-02-12 | 13F | Nuveen, LLC | 133.658 | 0,00 | 17.661 | -14,92 | ||||
| 2026-02-05 | 13F | Thrivent Financial For Lutherans | 0 | -100,00 | 0 | |||||
| 2026-02-17 | 13F | North Capital, Inc. | 0 | -100,00 | 0 | |||||
| 2026-02-13 | 13F | Rodgers Brothers Inc. | 16.636 | 0,00 | 2.194 | -15,09 | ||||
| 2026-02-05 | 13F | STF Management LP | 1.899 | -68,89 | 250 | -73,63 | ||||
| 2026-02-06 | 13F | Wisconsin Capital Management Llc | 0 | -100,00 | 0 | |||||
| 2026-02-10 | 13F | Measured Wealth Private Client Group, LLC | 146 | 0,00 | 19 | -13,64 | ||||
| 2026-02-17 | 13F | Jump Financial, LLC | 62.459 | 100,65 | 8.238 | 70,36 | ||||
| 2026-04-21 | 13F | GHP Investment Advisors, Inc. | 933 | 7,49 | 84 | -27,19 | ||||
| 2026-02-17 | 13F | Ewing Morris & Co. Investment Partners Ltd. | 4.055 | 41,19 | 542 | 21,52 | ||||
| 2026-02-09 | 13F | Hartland & Co., LLC | 1 | 0 | ||||||
| 2026-04-06 | 13F | CX Institutional | 36 | 0,00 | 0 | |||||
| 2026-02-17 | 13F | Alliancebernstein L.p. | 18.484 | -72,38 | 2.438 | -76,55 | ||||
| 2026-01-22 | 13F | Massachusetts Financial Services Co /ma/ | 398.620 | -2,31 | 52.574 | -17,06 | ||||
| 2026-02-12 | 13F | Principal Securities, Inc. | 0 | -100,00 | 0 | -100,00 | ||||
| 2026-02-17 | 13F | BlueSpruce Investments, LP | 0 | -100,00 | 0 | -100,00 | ||||
| 2026-04-28 | 13F | SBI Securities Co., Ltd. | 471 | 61,86 | 42 | 10,53 | ||||
| 2026-02-12 | 13F | Burkett Asset Management Ltd | 12.787 | 1.690 | ||||||
| 2026-02-17 | 13F | Voloridge Investment Management, Llc | 152.084 | 210,58 | 20.058 | 163,71 | ||||
| 2026-02-17 | 13F | Engineers Gate Manager LP | 0 | -100,00 | 0 | -100,00 | ||||
| 2026-02-05 | 13F | Allworth Financial LP | 700 | 72,84 | 92 | 48,39 | ||||
| 2026-02-17 | 13F | Banco Bilbao Vizcaya Argentaria, S.a. | 0 | -100,00 | 0 | |||||
| 2026-02-13 | 13F | FORA Capital, LLC | 0 | -100,00 | 0 | |||||
| 2026-02-13 | 13F | Neuberger Berman Group LLC | 48.744 | -14,03 | 6.440 | -26,87 | ||||
| 2026-02-19 | 13F | Atomi Financial Group, Inc. | 1.663 | -8,98 | 219 | -22,61 | ||||
| 2025-11-10 | 13F | Cary Street Partners Financial Llc | 0 | -100,00 | 0 | -100,00 | ||||
| 2025-11-03 | 13F | Townsquare Capital Llc | 0 | -100,00 | 0 | -100,00 | ||||
| 2025-11-14 | 13F | Adage Capital Partners Gp, L.l.c. | 0 | -100,00 | 0 | -100,00 | ||||
| 2026-04-22 | 13F | Gold Investment Management Ltd. | 306 | 0,33 | 28 | -32,50 | ||||
| 2026-04-15 | 13F | Trust Co Of Toledo Na /oh/ | 381 | 0,00 | 34 | -32,00 | ||||
| 2026-01-26 | 13F | Private Trust Co Na | 744 | 0,00 | 98 | -14,78 | ||||
| 2026-04-23 | 13F | Vista Investment Partners Ii, Llc | 0 | -100,00 | 0 | |||||
| 2026-02-13 | 13F | Rafferty Asset Management, LLC | 93.186 | 23,69 | 12.290 | 5,03 | ||||
| 2026-03-06 | 13F | Hsbc Holdings Plc | 42.772 | -74,18 | 5.652 | -78,08 | ||||
| 2026-04-22 | 13F | Promethium Advisors,llc | 0 | -100,00 | 0 | |||||
| 2025-10-30 | 13F | Oak Hill Wealth Advisors, Llc | 2.463 | 0,00 | 383 | -22,52 | ||||
| 2025-11-14 | 13F | Wolverine Trading, Llc | 5.062 | 791 | ||||||
| 2026-01-27 | 13F | Novem Group | 0 | -100,00 | 0 | |||||
| 2026-02-06 | 13F | Larson Financial Group LLC | 21.815 | -4,82 | 2.877 | -19,19 | ||||
| 2025-11-14 | 13F | Wolverine Trading, Llc | Call | 11.100 | 1.734 | |||||
| 2026-04-28 | 13F | Bogart Wealth, LLC | 19 | 0,00 | 2 | -50,00 | ||||
| 2025-11-14 | 13F | Wolverine Trading, Llc | Put | 8.800 | 1.374 | |||||
| 2026-04-17 | 13F | Bell Investment Advisors, Inc | 33 | 10,00 | 3 | -33,33 | ||||
| 2026-02-13 | 13F | Ubs Asset Management Americas Inc | 152 | 20 | ||||||
| 2026-01-27 | 13F | Grunden Financial Advisory, Inc. | 1.582 | 0,00 | 209 | -15,10 | ||||
| 2026-02-09 | 13F | Hantz Financial Services, Inc. | 667 | 1.011,67 | 0 | |||||
| 2026-02-09 | 13F | Legal & General Group Plc | 984.559 | -3,76 | 130.098 | -18,12 | ||||
| 2026-02-17 | 13F | Advisory Services Network, LLC | 0 | -100,00 | 0 | |||||
| 2026-02-17 | 13F | Canada Pension Plan Investment Board | 945.193 | 582,11 | 124.736 | 479,87 | ||||
| 2025-11-07 | 13F | Ontario Teachers Pension Plan Board | 0 | -100,00 | 0 | -100,00 | ||||
| 2025-11-10 | 13F | Greenland Capital Management LP | Put | 0 | -100,00 | 0 | -100,00 | |||
| 2026-02-17 | 13F | MIRAE ASSET GLOBAL ETFS HOLDINGS Ltd. | 568.832 | 11,44 | 75.031 | -5,38 | ||||
| 2026-02-17 | 13F | Shelton Capital Management | 50.725 | 2,02 | 6.690 | -13,38 | ||||
| 2026-04-27 | 13F | Ethic Inc. | 4.538 | 48,01 | 408 | 0,99 | ||||
| 2026-04-22 | 13F | Spire Wealth Management | 387 | 0,00 | 35 | -33,33 | ||||
| 2026-02-12 | 13F | Brown Brothers Harriman & Co | 623 | 20,74 | 82 | 2,50 | ||||
| 2026-02-17 | 13F | Public Employees Retirement System Of Ohio | 10.000 | -13,01 | 1.321 | -25,99 | ||||
| 2026-04-13 | 13F | E Fund Management Co., Ltd. | 14.195 | 1.277 | ||||||
| 2026-02-17 | 13F | Farringdon Capital, Ltd. | 0 | -100,00 | 0 | |||||
| 2026-04-17 | 13F | Roxbury Financial LLC | 62 | 0,00 | 6 | -37,50 | ||||
| 2026-03-16 | 13F/A | Rockefeller Capital Management L.P. | 4.478 | -16,19 | 591 | -28,92 | ||||
| 2026-04-14 | 13F | Clean Yield Group | 54 | -75,00 | 5 | -85,71 | ||||
| 2026-02-10 | 13F | Bridges Investment Management Inc | 2.207 | 0,00 | 291 | -14,91 | ||||
| 2025-10-31 | 13F | National Asset Management, Inc. | 0 | -100,00 | 0 | -100,00 | ||||
| 2026-01-20 | 13F | Ascent Group, LLC | 0 | -100,00 | 0 | |||||
| 2026-02-17 | 13F | Strategic Investment Advisors / MI | 0 | -100,00 | 0 | |||||
| 2026-04-28 | 13F | O'Domhnaill Enterprises, Inc. | 0 | -100,00 | 0 | |||||
| 2026-03-04 | 13F | SHP Wealth Management | 13 | 2 | ||||||
| 2026-02-18 | 13F | Garton & Associates Financial Advisors LLC | 33 | 4 | ||||||
| 2026-02-13 | 13F | Toroso Investments, LLC | 3.610 | 35,21 | 476 | 14,98 | ||||
| 2026-04-24 | 13F | Triasima Portfolio Management inc. | 0 | -100,00 | 0 | |||||
| 2025-11-10 | 13F | Greenland Capital Management LP | 0 | -100,00 | 0 | -100,00 | ||||
| 2026-02-04 | 13F | Atlantic Union Bankshares Corp | 48 | 0,00 | 6 | -14,29 | ||||
| 2026-02-17 | 13F | Imprint Wealth LLC | 8 | -69,23 | 1 | -75,00 | ||||
| 2026-04-15 | 13F | Addenda Capital Inc. | 48.500 | 0,00 | 6.090 | -30,68 | ||||
| 2025-11-13 | 13F | Bridgewater Associates, LP | 0 | -100,00 | 0 | |||||
| 2026-02-17 | 13F | Guardian Partners Inc. | 0 | -100,00 | 0 | |||||
| 2026-02-17 | 13F | SIG North Trading, ULC | 0 | -100,00 | 0 | |||||
| 2026-02-09 | 13F | Arista Wealth Management, LLC | 4.780 | 0,00 | 630 | -15,09 | ||||
| 2026-02-13 | 13F | Neo Ivy Capital Management | 16.327 | 2.153 | ||||||
| 2026-02-10 | 13F | Daiwa Securities Group Inc. | 39.878 | 9,06 | 5 | 0,00 | ||||
| 2026-01-26 | 13F | Mirae Asset Global Investments Co., Ltd. | 142.570 | 22,43 | 18.804 | 3,96 | ||||
| 2026-02-12 | 13F | Rossby Financial, LCC | 18 | -98,29 | 2 | -98,75 | ||||
| 2026-01-27 | 13F | Brighton Jones Llc | 0 | -100,00 | 0 | |||||
| 2026-02-17 | 13F | Creative Planning | 21.097 | 1,52 | 2.783 | -13,79 | ||||
| 2026-02-12 | 13F | Campbell & CO Investment Adviser LLC | 30.507 | 35,05 | 4.024 | 14,68 | ||||
| 2026-04-15 | 13F | Bayforest Capital Ltd | 1.432 | 73,16 | 129 | 17,43 | ||||
| 2026-02-13 | 13F | Natixis | 11.378 | 56,85 | 1.501 | 33,21 | ||||
| 2025-11-07 | 13F | Crestwood Advisors Group LLC | 0 | -100,00 | 0 | -100,00 | ||||
| 2026-04-22 | 13F | Motco | 998 | 0,00 | 90 | -32,06 | ||||
| 2026-03-20 | 13F | Purpose Unlimited Inc. | 830 | 110 | ||||||
| 2026-01-29 | 13F | Concurrent Investment Advisors, LLC | 3.247 | 27,88 | 428 | 8,63 | ||||
| 2026-02-04 | 13F | Meridian Wealth Management, LLC | 25.762 | 0,89 | 3.398 | -14,35 | ||||
| 2026-02-17 | 13F | Balyasny Asset Management Llc | 29.556 | 3.901 | ||||||
| 2025-11-14 | 13F | Beck Bode, LLC | 0 | -100,00 | 0 | |||||
| 2026-02-17 | 13F | SIG North Trading, ULC | Call | 20.600 | 19,08 | 2.717 | 1,08 | |||
| 2026-02-17 | 13F | SIG North Trading, ULC | Put | 15.900 | -13,11 | 2.097 | -26,21 | |||
| 2026-02-12 | 13F | Brinker Capital Investments, LLC | 9.000 | -31,17 | 1.187 | -41,61 | ||||
| 2026-02-11 | 13F | Dorsey & Whitney Trust CO LLC | 0 | -100,00 | 0 | |||||
| 2026-04-17 | 13F | Brown, Lisle/cummings, Inc. | 3 | 0,00 | 0 | |||||
| 2026-04-23 | 13F | iA Global Asset Management Inc. | 53.399 | -3,45 | 5 | -42,86 | ||||
| 2026-01-23 | 13F | Dara Capital Us, Inc. | 3.285 | 433 | ||||||
| 2026-04-13 | 13F | JCIC Asset Management Inc. | 0 | -100,00 | 0 | |||||
| 2025-11-14 | 13F | ExodusPoint Capital Management, LP | 0 | -100,00 | 0 | -100,00 | ||||
| 2026-04-21 | 13F | PDS Planning, Inc | 0 | -100,00 | 0 | |||||
| 2026-02-17 | 13F | Laird Norton Trust Company, Llc | 24.197 | 3.191 | ||||||
| 2026-02-17 | 13F | Norinchukin Bank, The | 14.861 | 17,76 | 1.960 | 0,00 | ||||
| 2026-02-13 | 13F | Victory Capital Management Inc | 200.929 | -30,65 | 26.501 | -41,12 | ||||
| 2026-01-21 | 13F | Quilter Plc | 4.553 | -20,86 | 601 | -32,81 | ||||
| 2026-02-04 | 13F | Plato Investment Management Ltd | 17.535 | 5.967,47 | 2.328 | 5.190,91 | ||||
| 2026-02-17 | 13F | Millennium Management Llc | 139.500 | 8,84 | 18.399 | -7,55 | ||||
| 2026-02-10 | 13F | Thoroughbred Financial Services, Llc | 0 | -100,00 | 0 | |||||
| 2026-01-30 | 13F | Laurel Wealth Advisors LLC | 62 | 8 | ||||||
| 2026-02-11 | 13F | Dearborn Partners Llc | 194.025 | 22,35 | 25.590 | 3,89 | ||||
| 2026-02-13 | 13F | Barclays Plc | 690.477 | 34,67 | 91.067 | 14,35 | ||||
| 2026-02-17 | 13F | Concentric Capital Strategies, LP | 0 | -100,00 | 0 | |||||
| 2025-11-14 | 13F | Moore Capital Management, Lp | 0 | -100,00 | 0 | -100,00 | ||||
| 2026-02-10 | 13F | Gulf International Bank (UK) Ltd | 7.670 | 0,00 | 1 | 0,00 | ||||
| 2026-01-15 | 13F | Mn Services Vermogensbeheer B.V. | 60.391 | 1,30 | 8 | -22,22 | ||||
| 2026-02-13 | 13F | Financial Network Wealth Advisors LLC | 730 | 38,00 | 96 | 17,07 | ||||
| 2026-01-16 | 13F | Park Edge Advisors, LLC | 0 | -100,00 | 0 | |||||
| 2026-02-17 | 13F | BCV Asset Management Inc. | 301.925 | 36.675 | ||||||
| 2026-02-17 | 13F | Nomura Holdings Inc | 72.822 | 3,72 | 9.604 | -11,93 | ||||
| 2026-04-08 | 13F | Community Financial Services Group, LLC | 60 | 5 | ||||||
| 2025-10-30 | 13F | Gibbs Wealth Management | 0 | -100,00 | 0 | -100,00 | ||||
| 2026-02-17 | 13F | Toronto Dominion Bank | 596.153 | 21,87 | 78.678 | 3,48 | ||||
| 2026-04-08 | 13F | E Fund Management (Hong Kong) Co., Ltd. | 1.542 | 7,46 | 139 | -11,54 | ||||
| 2026-02-17 | 13F | Schonfeld Strategic Advisors LLC | 9.941 | 1.311 | ||||||
| 2026-02-17 | 13F | Toronto Dominion Bank | Put | 1.900 | -81,73 | 251 | -84,52 | |||
| 2026-02-17 | 13F | Toronto Dominion Bank | Call | 3.200 | 422 | |||||
| 2026-02-10 | 13F | Nomura Asset Management Co Ltd | 17.730 | 13,34 | 2.338 | -3,75 | ||||
| 2025-11-14 | 13F | Axa S.a. | 0 | -100,00 | 0 | -100,00 | ||||
| 2026-02-17 | 13F | Susquehanna International Group, Llp | 51.457 | -78,55 | 6.787 | -81,79 | ||||
| 2026-04-17 | 13F | RFG Advisory, LLC | 26.535 | 2.388 | ||||||
| 2026-01-23 | 13F | Westside Investment Management, Inc. | 338 | 0,00 | 43 | -17,65 | ||||
| 2026-02-17 | 13F | Susquehanna International Group, Llp | Put | 29.900 | -85,10 | 3.944 | -87,35 | |||
| 2026-02-02 | 13F | Cornerstone Planning Group LLC | 1.188 | 42,45 | 139 | 17,80 | ||||
| 2026-02-03 | 13F | Crossmark Global Holdings, Inc. | 4.247 | -51,67 | 560 | -58,94 | ||||
| 2026-02-17 | 13F | Susquehanna International Group, Llp | Call | 39.600 | -30,28 | 5.223 | -40,81 | |||
| 2026-02-04 | 13F | Kepler Cheuvreux (Suisse) SA | 0 | -100,00 | 0 | -100,00 | ||||
| 2025-11-07 | 13F | Shell Asset Management Co | 18.928 | -55,26 | 3 | -75,00 | ||||
| 2026-02-12 | 13F | JPL Wealth Management, LLC | 27.311 | -7,32 | 3.602 | -21,30 | ||||
| 2026-02-17 | 13F | SIH Partners, LLLP | 1.856 | 245 | ||||||
| 2025-11-13 | 13F | Prudential Financial Inc | 0 | -100,00 | 0 | -100,00 | ||||
| 2026-04-23 | 13F | Lansforsakringar Fondforvaltning AB (publ) | 33.226 | 0,00 | 2.989 | -31,91 | ||||
| 2025-11-17 | 13F | Laurion Capital Management LP | 0 | -100,00 | 0 | -100,00 | ||||
| 2026-02-10 | 13F | MUFG Securities EMEA plc | 350.000 | 46.198 | ||||||
| 2026-02-13 | 13F | Morgan Stanley | 2.802.312 | 31,16 | 369.597 | 11,37 | ||||
| 2026-02-06 | 13F | Pnc Financial Services Group, Inc. | 9.704 | -9,33 | 1.280 | -23,04 | ||||
| 2025-11-14 | 13F | Balyasny Asset Management Llc | Call | 0 | -100,00 | 0 | -100,00 | |||
| 2026-04-27 | 13F | Truist Financial Corp | 2.367 | -18,88 | 213 | -44,53 | ||||
| 2025-11-05 | 13F | SOUTH STATE Corp | 0 | -100,00 | 0 | -100,00 | ||||
| 2026-04-06 | 13F | GAMMA Investing LLC | 1.397 | 25,29 | 126 | -14,97 | ||||
| 2026-04-23 | 13F | CBOE Vest Financial, LLC | 47.939 | 81,39 | 4.314 | 23,76 | ||||
| 2026-01-16 | 13F | Wealth Advisory Solutions, LLC | 0 | -100,00 | 0 | |||||
| 2026-02-12 | 13F | Jane Street Group, Llc | 7.751 | -95,72 | 1.022 | -96,37 | ||||
| 2026-02-12 | 13F | Steward Partners Investment Advisory, Llc | 1.618 | 9,40 | 213 | -6,99 | ||||
| 2026-04-27 | 13F | Greenleaf Trust | 0 | -100,00 | 0 | |||||
| 2026-02-10 | 13F | Connor, Clark & Lunn Investment Management Ltd. | 1.259.901 | -38,42 | 166.254 | -47,66 | ||||
| 2026-02-02 | 13F | Benjamin Edwards Inc | 291.641 | 43,27 | 38.541 | 21,89 | ||||
| 2026-02-12 | 13F | Jane Street Group, Llc | Put | 22.200 | 113,46 | 2.928 | 81,24 | |||
| 2026-02-17 | 13F | Fmr Llc | 4.703.318 | 11,12 | 620.678 | -5,56 | ||||
| 2026-02-12 | 13F | Jane Street Group, Llc | Call | 2.200 | 290 | |||||
| 2026-02-12 | 13F | Federation des caisses Desjardins du Quebec | 668.366 | -0,64 | 88.086 | -15,41 | ||||
| 2026-02-04 | 13F | Sentry Investment Management Llc | 0 | -100,00 | 0 | |||||
| 2025-11-14 | 13F | Capula Management Ltd | 0 | -100,00 | 0 | |||||
| 2026-04-24 | 13F | Yousif Capital Management, Llc | 0 | -100,00 | 0 | |||||
| 2026-02-13 | 13F | Dixon Mitchell Investment Counsel Inc. | 210.645 | -1,24 | 27.834 | -15,97 | ||||
| 2026-02-17 | 13F | Fullerton Fund Management Co Ltd | 1.700 | 225 | ||||||
| 2026-04-27 | 13F | Meramec Financial Planners, LLC | 63 | 0,00 | 6 | 0,00 | ||||
| 2026-01-23 | 13F | Tyche Wealth Partners LLC | 2.824 | 372 | ||||||
| 2026-01-23 | 13F | Rsm Us Wealth Management Llc | 2.212 | -2,98 | 294 | -17,23 | ||||
| 2026-02-13 | 13F | Kempen Capital Management N.v. | 31.265 | -8,40 | 4.127 | -22,14 | ||||
| 2026-04-27 | 13F | Td Private Client Wealth Llc | 9 | 28,57 | 1 | |||||
| 2026-02-17 | 13F | Russell Investments Group, Ltd. | 88.968 | 46,06 | 11.788 | 24,24 | ||||
| 2026-04-15 | 13F | Norden Group Llc | 4.090 | 113,02 | 368 | 45,06 | ||||
| 2026-02-17 | 13F | Raymond James Financial Inc | 310.088 | 14,19 | 40.898 | -3,04 | ||||
| 2026-01-21 | 13F | Brown Shipley& Co Ltd | 192 | 0,00 | 25 | -13,79 | ||||
| 2026-02-13 | 13F | Baird Financial Group, Inc. | 26.389 | -39,65 | 3.480 | -48,76 | ||||
| 2025-11-12 | 13F | NewSquare Capital LLC | 0 | -100,00 | 0 | |||||
| 2026-04-24 | 13F | UMA Financial Services, Inc. | 1.109 | 2,59 | 100 | -30,28 | ||||
| 2026-02-17 | 13F | Optiver Holding B.V. | 1.296 | 171 | ||||||
| 2026-04-27 | 13F | Y-Intercept (Hong Kong) Ltd | 58.765 | 80,67 | 5.288 | 23,27 | ||||
| 2026-01-22 | 13F | Bear Mountain Capital, Inc. | 0 | -100,00 | 0 | |||||
| 2026-02-09 | 13F | Waratah Capital Advisors Ltd. | 0 | -100,00 | 0 | |||||
| 2026-02-04 | 13F | Swiss Life Asset Management Ltd | 24.390 | 9,22 | 3.218 | -7,32 | ||||
| 2026-02-02 | 13F | Varma Mutual Pension Insurance Co | 63.706 | -0,39 | 8.418 | -15,24 | ||||
| 2026-02-11 | 13F | Picton Mahoney Asset Management | 218.799 | -36,19 | 28.915 | 54.454,72 | ||||
| 2025-11-14 | 13F | Seldon Capital Lp | 0 | -100,00 | 0 | |||||
| 2026-02-10 | 13F | Forsta Ap-fonden | 35.988 | 0,28 | 4.755 | -14,68 | ||||
| 2026-04-15 | 13F | Gf Fund Management Co. Ltd. | 91.161 | -2,85 | 8.203 | -33,72 | ||||
| 2026-02-11 | 13F | Empowered Funds, LLC | 231 | 30 | ||||||
| 2026-04-28 | 13F | China Universal Asset Management Co., Ltd. | 12.514 | -0,59 | 1.126 | -32,17 | ||||
| 2026-02-18 | 13F | Mackenzie Financial Corp | 2.377.940 | -0,02 | 315.210 | -14,63 | ||||
| 2026-02-10 | 13F | Natixis Advisors, L.p. | 13.450 | -18,11 | 2 | -50,00 | ||||
| 2026-02-11 | 13F | Group One Trading, L.p. | 140 | 18 | ||||||
| 2026-03-09 | 13F/A | CI Private Wealth, LLC | 20.014 | 5,85 | 2.640 | -10,12 | ||||
| 2026-02-13 | 13F | Centiva Capital, LP | 0 | -100,00 | 0 | |||||
| 2026-02-09 | 13F | Harbour Investments, Inc. | 107 | 28,92 | 14 | 16,67 | ||||
| 2026-02-13 | 13F | Verition Fund Management LLC | 0 | -100,00 | 0 | |||||
| 2025-11-21 | 13F/A | CIBC Bancorp USA Inc. | 16.501 | 2.563 | ||||||
| 2026-02-13 | 13F | Bank Of Nova Scotia | 310.413 | -28,68 | 40.962 | -39,42 | ||||
| 2026-02-12 | 13F | CIBC Private Wealth Group, LLC | 1.208 | -39,87 | 159 | -49,04 | ||||
| 2026-01-16 | 13F | Omnia Family Wealth, LLC | 1.754 | 0,00 | 232 | -15,07 | ||||
| 2026-02-17 | 13F | Ameriflex Group, Inc. | 15 | -50,00 | 2 | -75,00 | ||||
| 2026-04-22 | 13F | Janney Montgomery Scott LLC | 5.573 | -17,23 | 1 | |||||
| 2026-02-04 | 13F | Midwest Trust Co | 1.859 | -1,27 | 245 | -16,10 | ||||
| 2026-02-13 | 13F | State Street Corp | 192.037 | 1,88 | 25.328 | -13,49 | ||||
| 2026-02-13 | 13F | Ieq Capital, Llc | 7.671 | 74,90 | 1.012 | 48,46 | ||||
| 2026-02-13 | 13F | PJT Investments Corp. | 530.297 | 0,00 | 69.941 | -15,09 | ||||
| 2026-02-06 | 13F | HighTower Advisors, LLC | 10.607 | 5,35 | 1.400 | -10,49 | ||||
| 2026-02-11 | 13F | Deutsche Bank Ag\ | 630.639 | 56,61 | 83.175 | 32,98 | ||||
| 2026-02-11 | 13F | Metis Global Partners, LLC | 8.297 | -25,31 | 1.095 | -36,54 | ||||
| 2026-02-26 | 13F | TD Capital Management LLC | 45 | 0,00 | 6 | -16,67 | ||||
| 2026-04-15 | 13F | City Holding Co | 90 | 0,00 | 8 | -27,27 | ||||
| 2026-02-09 | 13F | Keating Financial Advisory Services, Inc. | 79 | 10 | ||||||
| 2026-04-21 | 13F | Venturi Wealth Management, LLC | 4.994 | 449 | ||||||
| 2025-11-10 | 13F | Kovitz Investment Group Partners, LLC | 0 | -100,00 | 0 | |||||
| 2026-02-13 | 13F | Caitong International Asset Management Co., Ltd | 123 | -90,43 | 16 | -91,96 | ||||
| 2026-04-13 | 13F | Lee Financial Co | 6.169 | 555 | ||||||
| 2026-02-06 | 13F | Bare Financial Services, Inc | 6 | -84,62 | 1 | -100,00 | ||||
| 2025-11-14 | 13F | Royal Bank Of Canada | Call | 0 | -100,00 | 0 | -100,00 | |||
| 2026-02-05 | 13F | Atria Investments Llc | 0 | -100,00 | 0 | |||||
| 2026-02-10 | 13F | Envestnet Asset Management Inc | 260.397 | -15,82 | 34.345 | -28,52 | ||||
| 2026-02-11 | 13F | Fiera Capital Corp | 1.797.209 | -21,10 | 237.248 | -32,90 | ||||
| 2026-02-13 | 13F | Walleye Trading LLC | 0 | -100,00 | 0 | |||||
| 2025-11-12 | 13F | Catalyst Funds Management Pty Ltd | 0 | -100,00 | 0 | |||||
| 2026-02-13 | 13F | Walleye Trading LLC | Put | 0 | -100,00 | 0 | ||||
| 2026-02-13 | 13F | Walleye Trading LLC | Call | 0 | -100,00 | 0 | ||||
| 2026-02-13 | 13F | Bridgefront Capital, LLC | 3.334 | 440 | ||||||
| 2026-04-27 | 13F | PFG Investments, LLC | 0 | -100,00 | 0 | |||||
| 2026-01-28 | 13F | HB Wealth Management, LLC | 0 | -100,00 | 0 | -100,00 | ||||
| 2026-02-13 | 13F | Evelyn Partners Investment Management Services Ltd | 3.124 | 5,36 | 412 | -10,43 | ||||
| 2026-02-13 | 13F | Evelyn Partners Investment Management (Europe) Ltd | 393 | 0,00 | 52 | -16,39 | ||||
| 2026-04-02 | 13F | Noble Wealth Management PBC | 0 | -100,00 | 0 | |||||
| 2026-02-13 | 13F | Dynamic Technology Lab Private Ltd | 9.090 | 16,69 | 1.199 | -0,91 | ||||
| 2026-01-26 | 13F | Cwm, Llc | 38.225 | 0,92 | 5 | 0,00 | ||||
| 2026-02-17 | 13F | Investment Management Corp of Ontario | 16.442 | 229,43 | 2.169 | 179,74 | ||||
| 2026-01-30 | 13F | Catalytic Wealth RIA, LLC | 0 | -100,00 | 0 | |||||
| 2025-11-14 | 13F | Aquatic Capital Management LLC | 0 | -100,00 | 0 | -100,00 | ||||
| 2025-11-14 | 13F | Brevan Howard Capital Management LP | 0 | -100,00 | 0 | -100,00 | ||||
| 2026-01-29 | 13F | Munich Reinsurance Co Stock Corp in Munich | 32.282 | 4.292 | ||||||
| 2026-02-11 | 13F | Cerity Partners LLC | 111.192 | 191,69 | 14.665 | 147,68 | ||||
| 2025-11-20 | 13F | First Affirmative Financial Network | 2.354 | -6,18 | 366 | -27,58 | ||||
| 2026-02-13 | 13F | Woodbridge CO LTD | 300.694.046 | 0,02 | 39.658.538 | -15,07 | ||||
| 2026-02-06 | 13F | Cullen/frost Bankers, Inc. | 306 | 22,89 | 40 | 5,26 | ||||
| 2026-01-12 | 13F | Contravisory Investment Management, Inc. | 0 | -100,00 | 0 | |||||
| 2026-02-11 | 13F | J.Safra Asset Management Corp | 422 | 56 | ||||||
| 2026-02-12 | 13F | Bank Of Montreal /can/ | Call | 124.000 | -76,52 | 16.364 | -80,04 | |||
| 2026-04-07 | 13F | Signaturefd, Llc | 6.424 | -26,69 | 578 | -49,96 | ||||
| 2026-02-12 | 13F | Bank Of Montreal /can/ | 6.098.897 | -0,21 | 804.864 | -15,17 | ||||
| 2026-02-17 | 13F | SummitTX Capital, L.P. | 5.919 | 358,13 | 781 | 290,00 | ||||
| 2026-02-03 | 13F | Ballentine Partners, LLC | 5.080 | 0,79 | 670 | -14,32 | ||||
| 2026-04-22 | 13F | Princeton Global Asset Management LLC | 60 | 0,00 | 5 | -28,57 | ||||
| 2025-11-12 | 13F | AlphaCore Capital LLC | 0 | -100,00 | 0 | |||||
| 2026-02-10 | 13F | Private Wealth Asset Management, LLC | 568 | -0,87 | 75 | -16,85 | ||||
| 2025-11-12 | 13F | Blair William & Co/il | 0 | -100,00 | 0 | -100,00 | ||||
| 2026-02-10 | 13F | Quantbot Technologies LP | 13.759 | -57,15 | 1.815 | -63,63 | ||||
| 2026-02-17 | 13F | Numerai GP LLC | 52.542 | 208,18 | 6.930 | 161,67 | ||||
| 2026-04-09 | 13F | Vista Investment Partners Llc | 0 | -100,00 | 0 | |||||
| 2026-02-10 | 13F | Lido Advisors, LLC | 45.808 | 1,32 | 6.577 | -6,34 | ||||
| 2026-02-12 | 13F | Aviva Plc | 131.203 | 5,46 | 17.328 | -10,22 | ||||
| 2026-02-13 | 13F | Beutel, Goodman & Co Ltd. | 60.738 | -4,67 | 8 | -11,11 | ||||
| 2026-04-01 | 13F | Bangor Savings Bank | 0 | -100,00 | 0 | |||||
| 2026-04-22 | 13F | Pictet Asset Management Holding SA | 414.770 | 15,52 | 37.320 | -21,35 | ||||
| 2026-04-15 | 13F | Avanza Fonder AB | 16.896 | 0,00 | 2.121 | -30,69 | ||||
| 2026-02-17 | 13F | Two Sigma Investments, Lp | 307.479 | 15,94 | 40.553 | -1,55 | ||||
| 2026-04-13 | 13F | CGC Financial Services, LLC | 315 | 0,00 | 28 | -31,71 | ||||
| 2026-02-11 | 13F | West Family Investments, Inc. | 4.320 | 0,00 | 570 | -15,20 | ||||
| 2025-11-14 | 13F | Williamson Legacy Group, LLC | 0 | -100,00 | 0 | -100,00 | ||||
| 2026-04-28 | 13F | Flagship Harbor Advisors, Llc | 0 | -100,00 | 0 | |||||
| 2025-10-31 | 13F | Whittier Trust Co Of Nevada Inc | 0 | -100,00 | 0 | -100,00 | ||||
| 2026-02-13 | 13F | Entropy Technologies, LP | 18.709 | 137,70 | 2.468 | 101,88 | ||||
| 2026-02-17 | 13F | Lombard Odier Asset Management (Switzerland) SA | 15.351 | -40,62 | 2.026 | -49,54 | ||||
| 2026-02-17 | 13F | Twinbeech Capital Lp | 0 | -100,00 | 0 | |||||
| 2026-04-21 | 13F | Penbrook Management LLC | 24.774 | -0,70 | 2.229 | -32,37 | ||||
| 2026-02-05 | 13F | Bessemer Group Inc | 22.268 | -10,88 | 3 | -33,33 | ||||
| 2026-02-11 | 13F | Curio Wealth, Llc | 163 | 0,00 | 22 | -16,00 | ||||
| 2026-04-15 | 13F | Fortitude Family Office, LLC | 0 | -100,00 | 0 | |||||
| 2026-02-12 | 13F | Renaissance Technologies Llc | 136.395 | 197,84 | 17.989 | 152,90 | ||||
| 2026-02-06 | 13F | Griffin Asset Management, Inc. | 12.471 | 1,55 | 1.645 | -13,79 | ||||
| 2026-04-24 | 13F | Abacus Wealth Partners, LLC | 2.507 | -68,78 | 226 | -78,75 | ||||
| 2026-02-18 | 13F | GWM Advisors LLC | 4.811 | -9,43 | 635 | -23,15 | ||||
| 2025-11-10 | 13F | Marks Group Wealth Management, Inc | 0 | -100,00 | 0 | -100,00 | ||||
| 2026-04-17 | 13F | PKO Investment Management Joint-Stock Co | 13.000 | 0,00 | 1.171 | -31,90 | ||||
| 2026-02-13 | 13F | PCM Encore, LLC | 2.789 | 368 | ||||||
| 2026-02-10 | 13F | State of Wyoming | 836 | 37,95 | 110 | 17,02 | ||||
| 2026-02-12 | 13F | Bank Of Montreal /can/ | Put | 0 | -100,00 | 0 | -100,00 | |||
| 2026-02-17 | 13F | Ameriprise Financial Inc | 47.612 | -61,09 | 6.407 | -66,62 | ||||
| 2025-11-14 | 13F | Strategic Wealth Partners, Ltd. | 7 | 0,00 | 1 | 0,00 | ||||
| 2026-04-27 | 13F | PAX Financial Group, LLC | 2.618 | -4,87 | 236 | -35,08 | ||||
| 2026-04-27 | 13F | Tsfg, Llc | 252 | 0 | ||||||
| 2026-04-28 | 13F | Montrusco Bolton Investments Inc. | 0 | -100,00 | 0 | |||||
| 2026-02-13 | 13F | Rhumbline Advisers | 3.204 | -9,70 | 423 | -23,41 | ||||
| 2026-01-14 | 13F | Clarius Group, LLC | 1.782 | 0,00 | 235 | -14,86 | ||||
| 2026-04-17 | 13F | Sara-Bay Financial | 0 | -100,00 | 0 | |||||
| 2026-02-12 | 13F | Timmons Wealth Management, LLC | 321 | 42 | ||||||
| 2026-02-12 | 13F | Wealthspire Advisors, LLC | 0 | -100,00 | 0 | |||||
| 2026-04-20 | 13F | Kestra Private Wealth Services, Llc | 7.881 | -6,55 | 709 | -36,24 | ||||
| 2026-02-06 | 13F | Cumberland Partners Ltd | 19.022 | 38,46 | 2.513 | 17,82 | ||||
| 2026-02-13 | 13F | Ingalls & Snyder Llc | 5.601 | -1,41 | 1 | |||||
| 2026-02-10 | 13F | Norges Bank | 1.162.529 | 153.417 | ||||||
| 2026-01-30 | 13F/A | M&t Bank Corp | 2.392 | 0,00 | 315 | -15,09 | ||||
| 2026-02-09 | 13F | Huntington National Bank | 817 | 0,00 | 108 | -15,08 | ||||
| 2026-02-03 | 13F | Mitsubishi UFJ Kokusai Asset Management Co., Ltd. | 38.333 | 6,45 | 4.844 | -13,41 | ||||
| 2026-02-13 | 13F | BRITISH COLUMBIA INVESTMENT MANAGEMENT Corp | 399.341 | 269,90 | 52.701 | 214,46 | ||||
| 2026-02-17 | 13F | Select Equity Group, L.P. | 0 | -100,00 | 0 | -100,00 | ||||
| 2025-10-31 | 13F | BCJ Capital Management, LLC | 0 | -100,00 | 0 | -100,00 | ||||
| 2026-04-07 | 13F | Farther Finance Advisors, LLC | 3.572 | -10,86 | 315 | -40,53 | ||||
| 2026-04-14 | 13F | Beacon Investment Advisory Services, Inc. | 469 | 42 | ||||||
| 2026-02-12 | 13F | Empower Advisory Group, LLC | 4.640 | -4,57 | 613 | -18,81 | ||||
| 2026-02-13 | 13F | Pathstone Holdings, LLC | 14.685 | -43,00 | 1.937 | -51,61 | ||||
| 2026-02-13 | 13F | Charles Schwab Investment Management Inc | 339.308 | 2,14 | 44.836 | -13,10 | ||||
| 2025-11-03 | 13F | AustralianSuper Pty Ltd | 128.599 | 19.964 | ||||||
| 2026-04-20 | 13F | Independent Wealth Network Inc. | 0 | -100,00 | 0 | |||||
| 2026-04-13 | 13F | Hm Payson & Co | 0 | -100,00 | 0 | |||||
| 2025-11-10 | 13F | Cary Street Partner Investment Advisory Llc | 0 | -100,00 | 0 | -100,00 | ||||
| 2026-01-13 | 13F | Capital Investment Advisors, LLC | 0 | -100,00 | 0 | |||||
| 2026-04-20 | 13F | Ronald Blue Trust, Inc. | 111 | -61,46 | 10 | -75,68 | ||||
| 2026-02-03 | 13F | International Assets Investment Management, Llc | 0 | -100,00 | 0 | |||||
| 2025-11-07 | 13F | Wealth Alliance | 0 | -100,00 | 0 | |||||
| 2026-02-11 | 13F | CenterBook Partners LP | 3.744 | 494 | ||||||
| 2026-04-20 | 13F | Louisiana State Employees Retirement System | 29.200 | -2,01 | 2.627 | -33,16 | ||||
| 2026-01-28 | 13F | Financial Perspectives, Inc | 400 | 0,00 | 53 | -16,13 | ||||
| 2026-04-21 | 13F | Aaron Wealth Advisors LLC | 5.307 | 478 | ||||||
| 2026-01-13 | 13F | Mather Group, Llc. | 0 | -100,00 | 0 | |||||
| 2026-04-02 | 13F | Ares Financial Consulting, LLC | 26 | 0,00 | 2 | -33,33 | ||||
| 2026-04-22 | 13F | Louisbourg Investments Inc. | 72.832 | 430,85 | 6.561 | 261,83 | ||||
| 2025-11-05 | 13F | Portside Wealth Group, LLC | 0 | -100,00 | 0 | -100,00 | ||||
| 2026-04-01 | 13F | Laurus Investment Counsel Inc. | 1.265 | 0,00 | 114 | -31,93 | ||||
| 2026-02-13 | 13F | Walleye Capital LLC | 0 | -100,00 | 0 | |||||
| 2026-02-13 | 13F | National Bank Of Canada /fi/ | 1.662.274 | -1,61 | 218.556 | -16,46 | ||||
| 2026-02-13 | 13F | Integrated Wealth Concepts LLC | 0 | -100,00 | 0 | -100,00 | ||||
| 2026-01-27 | 13F | TD Waterhouse Canada Inc. | 230.164 | 13,90 | 30.316 | -1,82 | ||||
| 2026-02-04 | 13F | Ameritas Advisory Services, LLC | 0 | -100,00 | 0 | |||||
| 2026-02-13 | 13F | LCC Family Corp. | 3.639.067 | -10,00 | 479.957 | -23,58 | ||||
| 2026-02-13 | 13F | Wells Fargo & Company/mn | 149.457 | 1,62 | 19.712 | -13,72 | ||||
| 2026-02-10 | 13F/A | Northwestern Mutual Wealth Management Co | 4.802 | 51,34 | 633 | 28,66 | ||||
| 2025-10-30 | 13F | Brandywine Oak Private Wealth Llc | 0 | -100,00 | 0 | |||||
| 2026-02-06 | 13F | Gsa Capital Partners Llp | 4.641 | 34,87 | 1 | |||||
| 2026-02-10 | 13F | Hillsdale Investment Management Inc. | 724 | -95,91 | 96 | -96,54 | ||||
| 2026-02-17 | 13F | XTX Topco Ltd | 0 | -100,00 | 0 | |||||
| 2026-02-11 | 13F | LPL Financial LLC | 31.594 | 8,05 | 4.167 | -8,26 | ||||
| 2026-02-17 | 13F | PDT Partners, LLC | 0 | -100,00 | 0 | |||||
| 2026-01-08 | 13F | Pine Haven Investment Counsel, Inc | 0 | -100,00 | 0 | |||||
| 2026-01-23 | 13F | Diversify Advisory Services, LLC | 0 | -100,00 | 0 | -100,00 | ||||
| 2026-02-03 | 13F | Generali Asset Management SPA SGR | 11.585 | 5,19 | 2.098 | -11,81 | ||||
| 2026-04-17 | 13F | Athena Wealth Management, LLC | 0 | -100,00 | 0 | |||||
| 2026-02-13 | 13F | Walleye Capital LLC | Call | 0 | -100,00 | 0 | ||||
| 2025-11-14 | 13F | Peak6 Llc | 0 | -100,00 | 0 | |||||
| 2026-02-13 | 13F | Pinnacle Wealth Planning Services, Inc. | 249 | 33 | ||||||
| 2026-01-09 | 13F | Marshall Financial Group LLC | 0 | -100,00 | 0 | |||||
| 2026-02-13 | 13F | Mariner, LLC | 42.691 | -1,92 | 5.632 | -16,71 | ||||
| 2026-02-13 | 13F | Mufg Securities (canada), Ltd. | 204.028 | -8,81 | 26.931 | -22,47 | ||||
| 2026-01-26 | 13F | Asset Dedication, LLC | 183 | 0,00 | 24 | -14,29 | ||||
| 2026-01-14 | 13F | Net Worth Advisory Group | 1.843 | 243 | ||||||
| 2026-02-17 | 13F | Cetera Investment Advisers | 8.481 | -24,37 | 1.120 | -35,67 | ||||
| 2026-01-27 | 13F | Evergreen Capital Management Llc | 5.743 | 1,79 | 757 | -13,58 | ||||
| 2026-02-10 | 13F | Bnp Paribas Arbitrage, Sa | Call | 0 | -100,00 | 0 | -100,00 | |||
| 2026-02-10 | 13F | PCJ Investment Counsel Ltd. | 0 | -100,00 | 0 | |||||
| 2026-04-20 | 13F | Assenagon Asset Management S.A. | 5.612 | -13,61 | 505 | -41,14 | ||||
| 2026-02-10 | 13F | Rothschild Investment Llc | 152 | 1,33 | 20 | -13,04 | ||||
| 2026-02-13 | 13F | Kilter Group LLC | 0 | -100,00 | 0 | |||||
| 2026-02-19 | 13F | Invesco Ltd. | 2.476.965 | 9,93 | 326.687 | -6,66 | ||||
| 2026-02-03 | 13F | Ewa, Llc | 0 | -100,00 | 0 | |||||
| 2026-02-06 | 13F | Bristol Gate Capital Partners Inc. | 3.994 | -23,55 | 528 | -35,02 | ||||
| 2026-02-13 | 13F | Barclays Plc | Call | 0 | -100,00 | 0 | -100,00 | |||
| 2026-04-24 | 13F | ProShare Advisors LLC | 563.915 | -18,40 | 50.741 | -44,33 | ||||
| 2026-02-12 | 13F | APG Asset Management N.V. | 136.771 | 37,18 | 15.388 | 16,77 | ||||
| 2026-02-17 | 13F | Point72 Asset Management, L.P. | 0 | -100,00 | 0 | -100,00 | ||||
| 2026-02-12 | 13F | UniSuper Management Pty Ltd | 2.700 | 0,00 | 489 | -16,12 | ||||
| 2026-02-13 | 13F | Stifel Financial Corp | 136.290 | 24,82 | 17.976 | 5,98 | ||||
| 2026-02-11 | 13F | Ameritas Investment Partners, Inc. | 16.082 | 2.121 | ||||||
| 2026-02-17 | 13F | Worldquant Millennium Advisors Llc | 0 | -100,00 | 0 | |||||
| 2026-04-28 | 13F | TritonPoint Partners, LLC | 0 | -100,00 | 0 | |||||
| 2025-11-13 | 13F | Jefferies Financial Group Inc. | 0 | -100,00 | 0 | -100,00 | ||||
| 2026-02-17 | 13F | Westwood Holdings Group Inc | 2.889 | -0,03 | 381 | -15,14 | ||||
| 2026-02-12 | 13F | Quadrant Capital Group Llc | 8.709 | 0,72 | 1.149 | -14,52 | ||||
| 2026-02-13 | 13F | Gen-Wealth Partners Inc | 7 | 0,00 | 1 | -100,00 | ||||
| 2026-01-30 | 13F | Wealthfront Advisers Llc | 1.966 | 259 | ||||||
| 2026-04-27 | 13F | Albion Financial Group /ut | 17 | 0,00 | 2 | -50,00 | ||||
| 2026-02-17 | 13F | Nissay Asset Management Corp /japan/ /adv | 64.094 | 7,36 | 8.453 | -8,84 | ||||
| 2026-02-13 | 13F | Gts Securities Llc | 1.858 | -82,89 | 245 | -85,48 | ||||
| 2026-02-02 | 13F | Intact Investment Management Inc. | 6.300 | -71,93 | 831 | -76,15 | ||||
| 2026-02-03 | 13F | Sequoia Financial Advisors, LLC | 4.997 | -23,77 | 659 | -35,27 | ||||
| 2026-02-10 | 13F | CIBC World Markets Inc. | Call | 4.900 | 647 | |||||
| 2026-02-17 | 13F | Advisor Group Holdings, Inc. | 9.126 | -51,06 | 1.206 | -61,50 | ||||
| 2026-02-10 | 13F | CIBC World Markets Inc. | 966.627 | -9,76 | 127.575 | -23,29 | ||||
| 2025-11-12 | 13F | Kingsview Wealth Management, LLC | 0 | -100,00 | 0 | -100,00 | ||||
| 2026-02-17 | 13F | Wiley Bros.-aintree Capital, Llc | 4.652 | -40,44 | 614 | -49,30 | ||||
| 2025-11-12 | 13F | Burgundy Asset Management Ltd. | 1.593 | 0,00 | 283 | -11,60 | ||||
| 2025-11-14 | 13F | Eqis Capital Management, Inc. | 0 | -100,00 | 0 | |||||
| 2026-02-13 | 13F | SEG Family Corp. | 2.901.405 | -11,57 | 382.666 | -24,92 | ||||
| 2026-01-21 | 13F | Stone House Investment Management, LLC | 0 | -100,00 | 0 | |||||
| 2025-10-30 | 13F | Ridgewood Investments LLC | 0 | -100,00 | 0 | -100,00 | ||||
| 2026-01-27 | 13F | Checchi Capital Advisers, LLC | 4.540 | -8,67 | 599 | -22,41 | ||||
| 2026-02-17 | 13F | Scientech Research LLC | 0 | -100,00 | 0 | |||||
| 2026-02-06 | 13F | Envestnet Portfolio Solutions, Inc. | 0 | -100,00 | 0 | |||||
| 2025-11-14 | 13F | Sora Investors Llc | 0 | -100,00 | 0 | -100,00 | ||||
| 2025-11-05 | 13F | Prasad Wealth Partners, LLC | 0 | -100,00 | 0 | -100,00 | ||||
| 2025-12-15 | 13F/A | Hudson Bay Capital Management LP | 0 | -100,00 | 0 | -100,00 | ||||
| 2026-02-13 | 13F | Evelyn Partners Asset Management Ltd | 23 | 0,00 | 3 | 0,00 | ||||
| 2025-11-14 | 13F | Point72 Hong Kong Ltd | 66.597 | 10.344 | ||||||
| 2026-02-02 | 13F | Fifth Third Bancorp | 349 | 17,91 | 46 | 2,22 | ||||
| 2026-02-12 | 13F | Advisors Asset Management, Inc. | 1.020 | -64,00 | 135 | -69,55 | ||||
| 2026-02-17 | 13F | Clear Street Markets Llc | 678 | 33.800,00 | 89 | |||||
| 2025-11-06 | 13F | Financial Advocates Investment Management | 0 | -100,00 | 0 | -100,00 | ||||
| 2025-12-15 | 13F | CTC Alternative Strategies, Ltd. | 0 | -100,00 | 0 | |||||
| 2026-02-17 | 13F | Caisse De Depot Et Placement Du Quebec | 0 | -100,00 | 0 | |||||
| 2026-04-13 | 13F | Massmutual Trust Co Fsb/adv | 302 | -11,95 | 27 | -40,00 | ||||
| 2026-04-24 | 13F | USS Investment Management Ltd | 26.598 | 4,40 | 2.386 | -29,46 | ||||
| 2026-02-11 | 13F | Tacita Capital Inc | 3.736 | -45,03 | 493 | -53,31 | ||||
| 2026-01-21 | 13F | Prime Capital Investment Advisors, LLC | 1.877 | -35,16 | 248 | -44,99 | ||||
| 2026-02-10 | 13F | CIBC Asset Management Inc | 1.607.468 | 17,74 | 212.493 | 0,20 | ||||
| 2026-02-11 | 13F | Harvest Fund Management Co., Ltd | 33.214 | 20,08 | 4 | 0,00 | ||||
| 2026-02-03 | 13F | ASR Vermogensbeheer N.V. | 8.770 | 0,00 | 1.159 | -14,98 | ||||
| 2026-02-17 | 13F | Prelude Capital Management, Llc | 2.395 | 316 | ||||||
| 2026-02-26 | 13F | Anchor Investment Management, LLC | 12 | 0,00 | 2 | 0,00 | ||||
| 2026-04-10 | 13F | Charles Schwab Trust Co | 6.720 | 0,00 | 605 | -31,83 | ||||
| 2026-02-12 | 13F | BRYN MAWR TRUST Co | 24 | 0,00 | 3 | 0,00 | ||||
| 2025-11-06 | 13F | Johnson Investment Counsel Inc | 0 | -100,00 | 0 | -100,00 | ||||
| 2026-04-15 | 13F | Retirement Investment Advisors, Inc. | 1.573 | 0,00 | 207 | 0,00 | ||||
| 2026-04-21 | 13F | Financial Consulate, Inc | 4 | 33,33 | 0 | |||||
| 2026-04-27 | 13F | Cooper Investors Pty Ltd | 42.436 | 3.818 | ||||||
| 2026-02-17 | 13F | Royal Bank Of Canada | Put | 30.000 | 3.957 | |||||
| 2026-02-17 | 13F | Royal Bank Of Canada | 9.784.789 | -4,21 | 1.290.517 | -18,67 | ||||
| 2025-11-14 | 13F | EFG Asset Management (Americas) Corp. | 11.865 | -8,82 | 1.843 | -29,61 | ||||
| 2026-01-23 | 13F | Lester Murray Antman dba SimplyRich | 7.018 | -0,79 | 1 | -100,00 | ||||
| 2026-02-17 | 13F | Gotham Asset Management, LLC | 26.394 | 23,82 | 3.481 | 5,13 | ||||
| 2026-02-10 | 13F | Godfrey Financial Associates, Inc. | 16 | 2 | ||||||
| 2026-02-17 | 13F | Magnetar Financial LLC | 0 | -100,00 | 0 | |||||
| 2025-11-04 | 13F | Landaas & Co /wi /adv | 0 | -100,00 | 0 | -100,00 | ||||
| 2026-01-27 | 13F | Zurcher Kantonalbank (Zurich Cantonalbank) | 185.423 | 340,92 | 24.502 | 275,15 | ||||
| 2026-04-29 | 13F | Impact Investors, Inc | 0 | -100,00 | 0 | |||||
| 2026-02-17 | 13F | Qube Research & Technologies Ltd | 13.758 | -93,37 | 1.816 | -94,37 | ||||
| 2026-04-21 | 13F | Vise Technologies, Inc. | 6.501 | 0,00 | 857 | 0,00 | ||||
| 2026-02-12 | 13F | Bank Of Nova Scotia Trust Co | 45.505 | -12,13 | 6.002 | -25,40 | ||||
| 2026-02-12 | 13F | Swiss National Bank | 416.655 | -8,16 | 55.097 | -21,82 | ||||
| 2025-11-05 | 13F | HORAN Wealth, LLC | 0 | -100,00 | 0 | -100,00 | ||||
| 2026-02-04 | 13F | Abc Arbitrage Sa | 0 | -100,00 | 0 | |||||
| 2026-04-10 | 13F | Armstrong Advisory Group, Inc | 4 | 0,00 | 0 | |||||
| 2026-02-03 | 13F | Bokf, Na | 0 | -100,00 | 0 |