Grundlæggende statistik
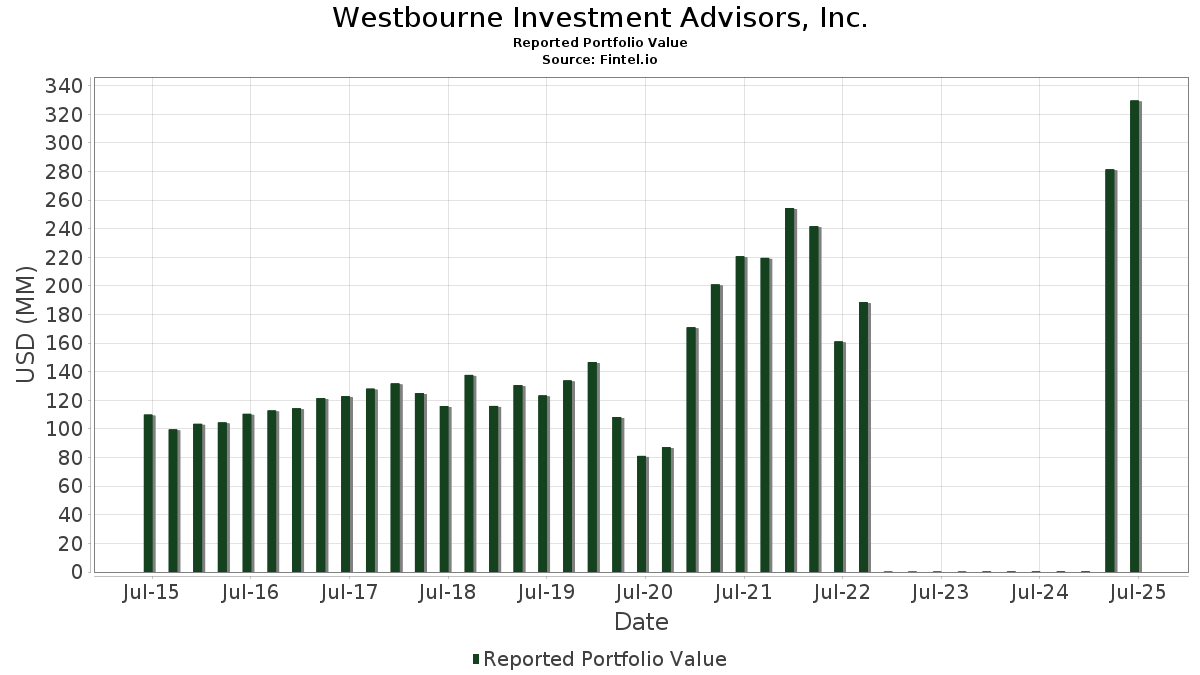
| Porteføljeværdi | $ 329.631.742 |
| Nuværende stillinger | 107 |
Seneste beholdninger, ydeevne, AUM (fra 13F, 13D)
Westbourne Investment Advisors, Inc. har afsløret 107 samlede besiddelser i deres seneste SEC-arkivering. Den seneste porteføljeværdi er beregnet til at være $ 329.631.742 USD. Faktiske aktiver under forvaltning (AUM) er denne værdi plus kontanter (som ikke er oplyst). Westbourne Investment Advisors, Inc.s største beholdninger er Microsoft Corporation (US:MSFT) , Meta Platforms, Inc. (US:META) , Apple Inc. (US:AAPL) , Uber Technologies, Inc. (US:UBER) , and Alphabet Inc. (US:GOOGL) . Westbourne Investment Advisors, Inc.s nye stillinger omfatter Invesco QQQ Trust, Series 1 (US:QQQ) , Adams Diversified Equity Fund, Inc. (US:ADX) , Liberty All-Star Equity Fund (US:USA) , Vanguard Whitehall Funds - Vanguard High Dividend Yield ETF (US:VYM) , and iShares Trust - iShares Russell 1000 ETF (US:IWB) .
Top øger dette kvartal
Vi bruger ændringen i porteføljeallokeringen, fordi dette er den mest meningsfulde metrik. Ændringer kan skyldes handler eller ændringer i aktiekurser.
| Sikkerhed | Aktier (MM) |
Værdi (MM$) |
Portefølje % | ΔPortefølje % |
|---|---|---|---|---|
| 0,05 | 23,85 | 7,2345 | 0,9991 | |
| 0,00 | 2,35 | 0,7141 | 0,7141 | |
| 0,02 | 14,06 | 4,2643 | 0,5963 | |
| 0,01 | 10,65 | 3,2309 | 0,5678 | |
| 0,07 | 1,55 | 0,4709 | 0,4709 | |
| 0,03 | 19,76 | 5,9960 | 0,4581 | |
| 0,19 | 17,88 | 5,4253 | 0,4275 | |
| 0,22 | 9,70 | 2,9422 | 0,3398 | |
| 0,16 | 1,10 | 0,3347 | 0,3347 | |
| 0,54 | 3,56 | 1,0787 | 0,2813 |
Top falder i dette kvartal
Vi bruger ændringen i porteføljeallokeringen, fordi dette er den mest meningsfulde metrik. Ændringer kan skyldes handler eller ændringer i aktiekurser.
| Sikkerhed | Aktier (MM) |
Værdi (MM$) |
Portefølje % | ΔPortefølje % |
|---|---|---|---|---|
| 0,09 | 18,70 | 5,6738 | -1,3211 | |
| 0,01 | 5,73 | 1,7379 | -0,6515 | |
| 0,01 | 5,70 | 1,7282 | -0,5423 | |
| 0,05 | 6,98 | 2,1160 | -0,5115 | |
| 0,09 | 4,67 | 1,4170 | -0,4409 | |
| 0,06 | 3,29 | 0,9979 | -0,4051 | |
| 0,02 | 5,74 | 1,7403 | -0,3637 | |
| 0,02 | 5,74 | 1,7408 | -0,3494 | |
| 0,04 | 7,20 | 2,1855 | -0,3456 | |
| 0,02 | 6,61 | 2,0054 | -0,3309 |
13F og Fondsarkivering
Denne formular blev indsendt den 2025-08-08 for rapporteringsperioden 2025-06-30. Klik på linkikonet for at se den fulde transaktionshistorik.
Opgrader for at låse op for premium-data og eksportere til Excel ![]() .
.
| Sikkerhed | Type | Gennemsnitlig aktiekurs | Aktier (MM) |
Δ Aktier (%) |
Δ Aktier (%) |
Værdi ($MM) |
Portefølje (%) |
ΔPortefølje (%) |
|
|---|---|---|---|---|---|---|---|---|---|
| MSFT / Microsoft Corporation | 0,05 | 2,53 | 23,85 | 35,86 | 7,2345 | 0,9991 | |||
| META / Meta Platforms, Inc. | 0,03 | -0,99 | 19,76 | 26,79 | 5,9960 | 0,4581 | |||
| AAPL / Apple Inc. | 0,09 | 2,84 | 18,70 | -5,02 | 5,6738 | -1,3211 | |||
| UBER / Uber Technologies, Inc. | 0,19 | -0,73 | 17,88 | 27,12 | 5,4253 | 0,4275 | |||
| GOOGL / Alphabet Inc. | 0,10 | -0,14 | 16,87 | 13,80 | 5,1166 | -0,1485 | |||
| GS / The Goldman Sachs Group, Inc. | 0,02 | 5,08 | 14,06 | 36,14 | 4,2643 | 0,5963 | |||
| BAC / Bank of America Corporation | 0,26 | -0,35 | 12,21 | 13,00 | 3,7032 | -0,1345 | |||
| SCHW / The Charles Schwab Corporation | 0,12 | -0,92 | 11,35 | 15,48 | 3,4418 | -0,0482 | |||
| MS / Morgan Stanley | 0,08 | 0,71 | 10,81 | 21,59 | 3,2797 | 0,1210 | |||
| NFLX / Netflix, Inc. | 0,01 | -1,07 | 10,65 | 42,08 | 3,2309 | 0,5678 | |||
| TOST / Toast, Inc. | 0,22 | -0,85 | 9,70 | 32,40 | 2,9422 | 0,3398 | |||
| VLO / Valero Energy Corporation | 0,06 | 2,46 | 7,73 | 4,29 | 2,3451 | -0,2883 | |||
| EXPE / Expedia Group, Inc. | 0,04 | 0,76 | 7,20 | 1,11 | 2,1855 | -0,3456 | |||
| PAYX / Paychex, Inc. | 0,05 | 0,03 | 6,98 | -5,69 | 2,1160 | -0,5115 | |||
| C / Citigroup Inc. | 0,08 | 0,99 | 6,84 | 21,09 | 2,0743 | 0,0684 | |||
| AMZN / Amazon.com, Inc. | 0,03 | 4,40 | 6,63 | 20,39 | 2,0103 | 0,0549 | |||
| HD / The Home Depot, Inc. | 0,02 | 0,47 | 6,61 | 0,52 | 2,0054 | -0,3309 | |||
| SCHG / Schwab Strategic Trust - Schwab U.S. Large-Cap Growth ETF | 0,20 | 1,78 | 5,80 | 18,75 | 1,7584 | 0,0241 | |||
| CB / Chubb Limited | 0,02 | 1,66 | 5,74 | -2,46 | 1,7408 | -0,3494 | |||
| ACN / Accenture plc | 0,02 | 1,12 | 5,74 | -3,14 | 1,7403 | -0,3637 | |||
| CVCO / Cavco Industries, Inc. | 0,01 | 1,88 | 5,73 | -14,84 | 1,7379 | -0,6515 | |||
| ELV / Elevance Health, Inc. | 0,01 | -0,33 | 5,70 | -10,87 | 1,7282 | -0,5423 | |||
| BAH / Booz Allen Hamilton Holding Corporation | 0,05 | 1,61 | 5,39 | 1,18 | 1,6365 | -0,2576 | |||
| CNC / Centene Corporation | 0,09 | -0,11 | 4,67 | -10,69 | 1,4170 | -0,4409 | |||
| SCHV / Schwab Strategic Trust - Schwab U.S. Large-Cap Value ETF | 0,15 | 2,00 | 4,11 | 6,18 | 1,2456 | -0,1280 | |||
| MEOH / Methanex Corporation | 0,12 | 1,26 | 4,01 | -4,47 | 1,2178 | -0,2751 | |||
| DOCU / DocuSign, Inc. | 0,05 | 0,44 | 3,60 | -3,90 | 1,0917 | -0,2384 | |||
| BMBL / Bumble Inc. | 0,54 | 4,32 | 3,56 | 58,42 | 1,0787 | 0,2813 | |||
| SNAP / Snap Inc. | 0,38 | 3,87 | 3,31 | 3,63 | 1,0036 | -0,1305 | |||
| LYB / LyondellBasell Industries N.V. | 0,06 | 1,34 | 3,29 | -16,71 | 0,9979 | -0,4051 | |||
| PM / Philip Morris International Inc. | 0,02 | 0,00 | 2,95 | 14,74 | 0,8953 | -0,0184 | |||
| JPM / JPMorgan Chase & Co. | 0,01 | 4,71 | 2,58 | 23,78 | 0,7819 | 0,0420 | |||
| QQQ / Invesco QQQ Trust, Series 1 | 0,00 | 2,35 | 0,7141 | 0,7141 | |||||
| SPY / SPDR S&P 500 ETF | 0,00 | 1,18 | 1,97 | 11,77 | 0,5962 | -0,0285 | |||
| GOOGL / Alphabet Inc. | 0,01 | 0,21 | 1,89 | 13,85 | 0,5737 | -0,0167 | |||
| LOW / Lowe's Companies, Inc. | 0,01 | -1,58 | 1,67 | -6,33 | 0,5070 | -0,1271 | |||
| XOM / Exxon Mobil Corporation | 0,02 | 0,00 | 1,66 | -9,39 | 0,5038 | -0,1471 | |||
| PEP / PepsiCo, Inc. | 0,01 | 15,46 | 1,58 | 1,68 | 0,4787 | -0,0726 | |||
| ADX / Adams Diversified Equity Fund, Inc. | 0,07 | 1,55 | 0,4709 | 0,4709 | |||||
| V / Visa Inc. | 0,00 | -1,19 | 1,47 | 0,14 | 0,4469 | -0,0759 | |||
| GJR / Strats Trust For Procter & Gambel Security - Preferred Security | 0,01 | 12,27 | 1,46 | 4,97 | 0,4422 | -0,0512 | |||
| COF / Capital One Financial Corporation | 0,01 | 5,08 | 1,41 | 24,71 | 0,4273 | 0,0260 | |||
| XLF / The Select Sector SPDR Trust - The Financial Select Sector SPDR Fund | 0,03 | 2,61 | 1,35 | 7,90 | 0,4102 | -0,0350 | |||
| ABBV / AbbVie Inc. | 0,01 | -4,12 | 1,29 | -15,09 | 0,3928 | -0,1487 | |||
| LLY / Eli Lilly and Company | 0,00 | 0,00 | 1,21 | -5,60 | 0,3682 | -0,0886 | |||
| JNJ / Johnson & Johnson | 0,01 | 15,62 | 1,20 | 6,55 | 0,3653 | -0,0364 | |||
| MCO / Moody's Corporation | 0,00 | -10,33 | 1,20 | -3,47 | 0,3631 | -0,0772 | |||
| USA / Liberty All-Star Equity Fund | 0,16 | 1,10 | 0,3347 | 0,3347 | |||||
| UNH / UnitedHealth Group Incorporated | 0,00 | 10,31 | 1,06 | -34,30 | 0,3221 | -0,2519 | |||
| COP / ConocoPhillips | 0,01 | 0,00 | 0,99 | -14,60 | 0,3018 | -0,1118 | |||
| ABT / Abbott Laboratories | 0,01 | -6,48 | 0,98 | -4,11 | 0,2977 | -0,0659 | |||
| MO / Altria Group, Inc. | 0,02 | 0,00 | 0,94 | -2,38 | 0,2863 | -0,0569 | |||
| IVV / iShares Trust - iShares Core S&P 500 ETF | 0,00 | 0,13 | 0,93 | 10,62 | 0,2814 | -0,0164 | |||
| VYM / Vanguard Whitehall Funds - Vanguard High Dividend Yield ETF | 0,01 | 0,89 | 0,2710 | 0,2710 | |||||
| ARCC / Ares Capital Corporation | 0,04 | 0,87 | 0,2625 | 0,2625 | |||||
| IWB / iShares Trust - iShares Russell 1000 ETF | 0,00 | 0,85 | 0,2575 | 0,2575 | |||||
| MCD / McDonald's Corporation | 0,00 | 0,00 | 0,84 | -6,45 | 0,2554 | -0,0643 | |||
| NSC / Norfolk Southern Corporation | 0,00 | 0,00 | 0,84 | 8,14 | 0,2541 | -0,0212 | |||
| THQ / Abrdn Healthcare Opportunities Fund | 0,05 | 0,83 | 0,2533 | 0,2533 | |||||
| UTG / Reaves Utility Income Fund | 0,02 | 0,83 | 0,2513 | 0,2513 | |||||
| MRK / Merck & Co., Inc. | 0,01 | 21,61 | 0,82 | 7,29 | 0,2500 | -0,0230 | |||
| UTF / Cohen & Steers Infrastructure Fund, Inc | 0,03 | 0,80 | 0,2436 | 0,2436 | |||||
| FI / Fiserv, Inc. | 0,00 | -3,76 | 0,80 | -24,93 | 0,2424 | -0,1354 | |||
| AXP / American Express Company | 0,00 | 0,00 | 0,78 | 18,65 | 0,2354 | 0,0029 | |||
| MAIN / Main Street Capital Corporation | 0,01 | 0,74 | 0,2241 | 0,2241 | |||||
| ETN / Eaton Corporation plc | 0,00 | 0,00 | 0,74 | 31,32 | 0,2240 | 0,0243 | |||
| PSX / Phillips 66 | 0,01 | 0,00 | 0,68 | -3,39 | 0,2078 | -0,0441 | |||
| DNP / DNP Select Income Fund Inc. | 0,07 | 0,67 | 0,2040 | 0,2040 | |||||
| EPD / Enterprise Products Partners L.P. - Limited Partnership | 0,02 | 0,66 | 0,1994 | 0,1994 | |||||
| UNP / Union Pacific Corporation | 0,00 | 0,00 | 0,66 | -2,67 | 0,1990 | -0,0403 | |||
| KO / The Coca-Cola Company | 0,01 | 0,00 | 0,61 | -1,30 | 0,1849 | -0,0343 | |||
| RITM / Rithm Capital Corp. | 0,05 | 0,59 | 0,1798 | 0,1798 | |||||
| MDLZ / Mondelez International, Inc. | 0,01 | 0,00 | 0,59 | -0,51 | 0,1781 | -0,0317 | |||
| BXSL / Blackstone Secured Lending Fund | 0,02 | 0,58 | 0,1763 | 0,1763 | |||||
| PFE / Pfizer Inc. | 0,02 | 20,19 | 0,58 | 15,17 | 0,1751 | -0,0032 | |||
| PCN / PIMCO Corporate & Income Strategy Fund | 0,04 | 0,56 | 0,1694 | 0,1694 | |||||
| AMAT / Applied Materials, Inc. | 0,00 | 0,00 | 0,54 | 26,05 | 0,1647 | 0,0118 | |||
| HON / Honeywell International Inc. | 0,00 | -12,85 | 0,54 | -4,29 | 0,1628 | -0,0361 | |||
| APD / Air Products and Chemicals, Inc. | 0,00 | 0,00 | 0,51 | -4,34 | 0,1540 | -0,0346 | |||
| GE / General Electric Company | 0,00 | 0,00 | 0,51 | 28,68 | 0,1538 | 0,0138 | |||
| LHX / L3Harris Technologies, Inc. | 0,00 | 0,00 | 0,40 | 20,06 | 0,1218 | 0,0028 | |||
| TRI / Thomson Reuters Corporation | 0,00 | 0,00 | 0,39 | 16,12 | 0,1183 | -0,0007 | |||
| AMLP / ALPS ETF Trust - Alerian MLP ETF | 0,01 | 0,38 | 0,1151 | 0,1151 | |||||
| WMT / Walmart Inc. | 0,00 | 0,00 | 0,38 | 11,57 | 0,1142 | -0,0059 | |||
| CSX / CSX Corporation | 0,01 | -0,65 | 0,37 | 10,09 | 0,1128 | -0,0071 | |||
| STWD / Starwood Property Trust, Inc. | 0,02 | 0,35 | 0,1047 | 0,1047 | |||||
| RFI / Cohen & Steers Total Return Realty Fund, Inc. | 0,03 | 0,33 | 0,0995 | 0,0995 | |||||
| RSP / Invesco Exchange-Traded Fund Trust - Invesco S&P 500 Equal Weight ETF | 0,00 | 0,39 | 0,33 | 5,52 | 0,0986 | -0,0110 | |||
| AON / Aon plc | 0,00 | 0,00 | 0,32 | -10,58 | 0,0974 | -0,0302 | |||
| ET / Energy Transfer LP - Limited Partnership | 0,02 | 0,32 | 0,0974 | 0,0974 | |||||
| CG / The Carlyle Group Inc. | 0,01 | 7,02 | 0,31 | 26,21 | 0,0951 | 0,0069 | |||
| VEA / Vanguard Tax-Managed Funds - Vanguard FTSE Developed Markets ETF | 0,01 | 0,00 | 0,31 | 12,36 | 0,0938 | -0,0041 | |||
| MMM / 3M Company | 0,00 | 0,00 | 0,31 | 3,72 | 0,0933 | -0,0121 | |||
| INTC / Intel Corporation | 0,01 | 0,00 | 0,28 | -1,42 | 0,0842 | -0,0158 | |||
| GEV / GE Vernova Inc. | 0,00 | 0,26 | 0,0790 | 0,0790 | |||||
| DIS / The Walt Disney Company | 0,00 | -3,53 | 0,25 | 21,53 | 0,0771 | 0,0026 | |||
| OKE / ONEOK, Inc. | 0,00 | 0,00 | 0,24 | -17,85 | 0,0743 | -0,0315 | |||
| VOT / Vanguard Index Funds - Vanguard Mid-Cap Growth ETF | 0,00 | 0,00 | 0,24 | 16,59 | 0,0726 | -0,0005 | |||
| YUM / Yum! Brands, Inc. | 0,00 | 0,00 | 0,23 | -6,02 | 0,0713 | -0,0174 | |||
| CII / BlackRock Enhanced Large Cap Core Fund, Inc. | 0,01 | 0,23 | 0,0712 | 0,0712 | |||||
| PYPL / PayPal Holdings, Inc. | 0,00 | 0,22 | 0,0654 | 0,0654 | |||||
| GIS / General Mills, Inc. | 0,00 | 0,00 | 0,21 | -13,39 | 0,0629 | -0,0221 | |||
| CSCO / Cisco Systems, Inc. | 0,00 | 0,20 | 0,0621 | 0,0621 | |||||
| BMY / Bristol-Myers Squibb Company | 0,00 | 0,00 | 0,20 | -24,06 | 0,0615 | -0,0334 | |||
| XYL / Xylem Inc. | 0,00 | 0,20 | 0,0610 | 0,0610 | |||||
| VIK / Viking Holdings Ltd | 0,00 | 0,20 | 0,0609 | 0,0609 | |||||
| SPC / Trust for Professional Managers - CrossingBridge Pre-Merger SPAC ETF | 0,03 | 0,00 | 0,00 | 0,0000 | -0,0000 | ||||
| BA / The Boeing Company | 0,00 | -100,00 | 0,00 | 0,0000 |