Grundlæggende statistik
| Institutionelle aktier (lange) | 3.107.857.528 - 78,23% (ex 13D/G) - change of 70,07MM shares 2,31% MRQ |
| Institutionel værdi (lang) | $ 14.762.268 USD ($1000) |
Institutionelt ejerskab og aktionærer
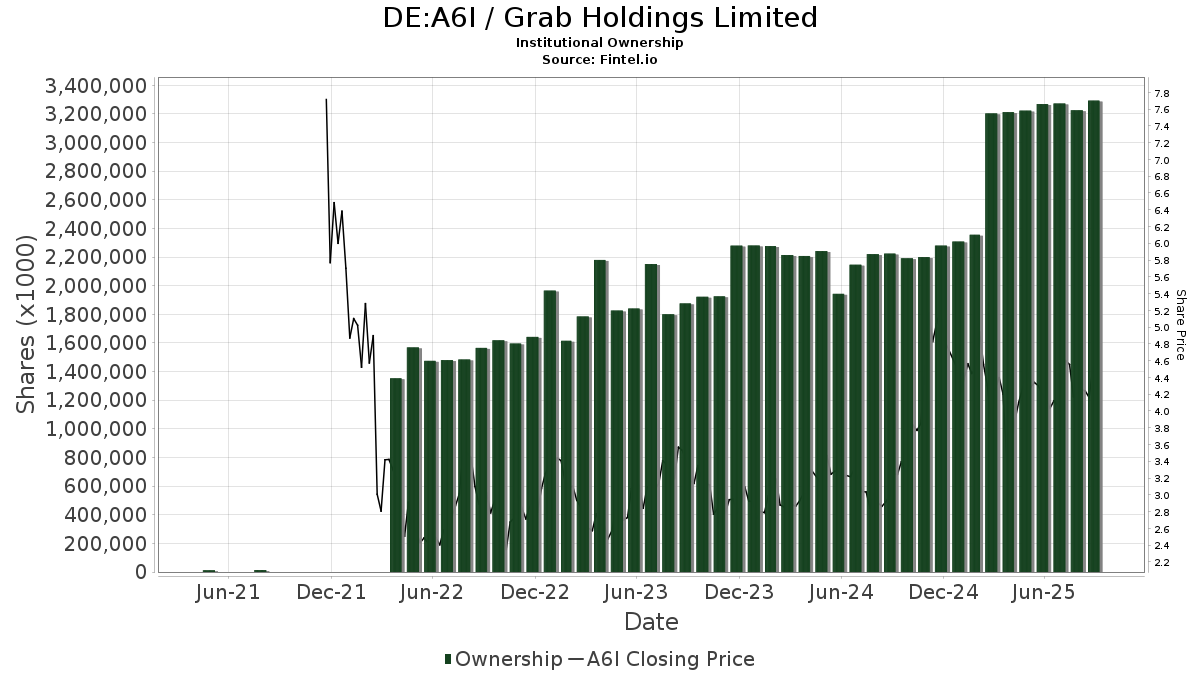
Grab Holdings Limited (DE:A6I) har 545 institutionelle ejere og aktionærer, der har indsendt 13D/G- eller 13F-formularer til Securities Exchange Commission (SEC). Disse institutioner har i alt 3,107,857,528 aktier. Største aktionærer omfatter Uber Technologies, Inc, Sb Investment Advisers (uk) Ltd, Toyota Motor Corp/, MUFG Bank, Ltd., BlackRock, Inc., Morgan Stanley, Tiger Global Management Llc, Invesco Ltd., Marshall Wace, Llp, and Jpmorgan Chase & Co .
Grab Holdings Limited (DB:A6I) institutionel ejerskabsstruktur viser aktuelle positioner i virksomheden efter institutioner og fonde, samt seneste ændringer i positionsstørrelse. Større aktionærer kan omfatte individuelle investorer, investeringsforeninger, hedgefonde eller institutioner. Skema 13D angiver, at investoren besidder (eller besidder) mere end 5 % af virksomheden og har til hensigt (eller har til hensigt at) aktivt at forfølge en ændring i forretningsstrategi. Skema 13G indikerer en passiv investering på over 5%.
The share price as of April 29, 2026 is 3,25 / share. Previously, on May 5, 2025, the share price was 4,35 / share. This represents a decline of 25,38% over that period.
Fondens stemningsscore
Fund Sentiment Score (fka Ownership Accumulation Score) finder de aktier, der bliver mest købt af fonde. Det er resultatet af en sofistikeret, multi-faktor kvantitativ model, der identificerer virksomheder med de højeste niveauer af institutionel akkumulering. Scoringsmodellen bruger en kombination af den samlede stigning i oplyste ejere, ændringerne i porteføljeallokeringer i disse ejere og andre målinger. Tallet går fra 0 til 100, hvor højere tal indikerer et højere niveau af akkumulering for sine jævnaldrende, og 50 er gennemsnittet.
Opdateringsfrekvens: Dagligt
Se Ownership Explorer, som giver en liste over højest rangerende virksomheder.
AI+ Ask Fintel’s AI assistant about Grab Holdings Limited.
Select a question to share a public post with an AI-crafted answer.
Thinking of good questions…
13F og NPORT arkivering
Detaljer om 13F-arkivering er gratis. Detaljer om NP-ansøgninger kræver et premium-medlemskab. Grønne rækker angiver nye positioner. Røde rækker angiver lukkede positioner. Klik på linket ikon for at se den fulde transaktionshistorik.
Opgrader
for at låse premium-data op og eksportere til Excel ![]() .
.
| Fil dato | Kilde | Investor | Type | Gennemsnitlig pris (Øst) |
Aktier | Δ Aktier (%) |
Rapporteret Værdi ($1000) |
Δ Værdi (%) |
Port Alloc (%) |
|
|---|---|---|---|---|---|---|---|---|---|---|
| 2026-02-11 | 13F | Zions Bancorporation, National Association /ut/ | 1.097 | 0,00 | 5 | -16,67 | ||||
| 2026-02-17 | 13F | California State Teachers Retirement System | 3.525.503 | -1,85 | 17.592 | -18,64 | ||||
| 2026-02-18 | 13F | State of Tennessee, Treasury Department | 253.776 | -76,85 | 1.091 | -83,47 | ||||
| 2026-01-29 | 13F | UBS Group AG | Call | 7.814.729 | 390,49 | 38.995 | 306,58 | |||
| 2026-02-17 | 13F | Glenmede Trust Co Na | 18.453 | 36,80 | 92 | 50,82 | ||||
| 2026-01-29 | 13F | UBS Group AG | 12.821.002 | -56,58 | 63.977 | -64,01 | ||||
| 2026-02-17 | 13F | Price T Rowe Associates Inc /md/ | 6.424.434 | 471,92 | 32 | 433,33 | ||||
| 2026-02-12 | 13F | State Board Of Administration Of Florida Retirement System | 118.500 | 0,00 | 591 | -17,11 | ||||
| 2026-02-02 | 13F | Wolverine Asset Management Llc | Put | 2.295.000 | 677,97 | 11.452 | 545,18 | |||
| 2026-02-13 | 13F | Marcho Partners LLP | 3.566.135 | -11,95 | 17.795 | -27,01 | ||||
| 2026-04-30 | 13F | Nisa Investment Advisors, Llc | 29.055 | 5,67 | 106 | -22,63 | ||||
| 2026-02-12 | 13F | Pitcairn Co | 0 | -100,00 | 0 | -100,00 | ||||
| 2026-02-10 | 13F | Principia Wealth Advisory, LLC | 158 | 5,33 | 1 | |||||
| 2026-02-12 | 13F | Steward Partners Investment Advisory, Llc | 7.525 | 128,03 | 38 | 94,74 | ||||
| 2026-02-12 | 13F | Brinker Capital Investments, LLC | 36.562 | 62,66 | 182 | 34,81 | ||||
| 2026-02-13 | 13F | Quarry LP | 2.792 | 14 | ||||||
| 2026-03-16 | 13F/A | Rockefeller Capital Management L.P. | 115.817 | 42,24 | 578 | 17,76 | ||||
| 2026-02-10 | 13F | Norges Bank | 32.361.499 | 161.484 | ||||||
| 2026-02-17 | 13F | DZ BANK AG Deutsche Zentral Genossenschafts Bank, Frankfurt am Main | 11.178.485 | 1.327,06 | 55.781 | 1.083,03 | ||||
| 2026-02-09 | 13F | William Blair Investment Management, Llc | 22.676.283 | -6,55 | 113.155 | -22,54 | ||||
| 2026-02-17 | 13F | Numerai GP LLC | 72.785 | -50,87 | 363 | -59,26 | ||||
| 2026-02-05 | 13F | Baader Bank INC | 57.506 | -0,53 | 282 | -17,30 | ||||
| 2026-04-10 | 13F | Centurion Wealth Management LLC | 56.354 | 13,94 | 206 | -16,26 | ||||
| 2026-04-29 | 13F | Harbour Capital Advisors, LLC | 121.425 | -1,10 | 493 | -21,03 | ||||
| 2026-02-12 | 13F | Voya Investment Management Llc | 2.740.328 | -23,24 | 13.674 | -36,37 | ||||
| 2026-02-17 | 13F | Tcw Group Inc | 11.200 | 56 | ||||||
| 2026-02-10 | 13F | Sittner & Nelson, Llc | 147 | 0,00 | 1 | |||||
| 2026-02-17 | 13F | GAM Holding AG | 333.712 | 140,75 | 1.665 | 99,64 | ||||
| 2026-02-17 | 13F | Ribbit Management Company, LLC | 2.650.000 | 13.224 | ||||||
| 2026-04-28 | 13F | Robertson Stephens Wealth Management, LLC | 10.000 | 37 | ||||||
| 2026-02-17 | 13F | Toronto Dominion Bank | 8.689.627 | 6,01 | 43.361 | -12,13 | ||||
| 2026-04-08 | 13F | Arlington Trust Co LLC | 54 | 0 | ||||||
| 2026-04-13 | 13F | St Germain D J Co Inc | 0 | -100,00 | 0 | |||||
| 2026-04-27 | 13F | Asahi Life Asset Management Co., Ltd. | 0 | -100,00 | 0 | -100,00 | ||||
| 2026-03-27 | 13F | Prosperity Wealth Management, Inc. | 0 | -100,00 | 0 | -100,00 | ||||
| 2025-11-21 | 13F | Nebula Research & Development LLC | 0 | -100,00 | 0 | -100,00 | ||||
| 2026-02-12 | 13F | Dalton Investments LLC | 1.077.600 | 51,95 | 5.377 | 25,95 | ||||
| 2026-02-04 | 13F | Plato Investment Management Ltd | 21.468 | 0,00 | 108 | -16,41 | ||||
| 2026-02-17 | 13F | Raymond James Financial Inc | Call | 10.000 | 30 | |||||
| 2026-02-17 | 13F | Raymond James Financial Inc | 392.960 | -12,39 | 1.961 | -27,41 | ||||
| 2026-02-09 | 13F | Geode Capital Management, Llc | 25.581.834 | 3,27 | 126.155 | -14,36 | ||||
| 2026-02-17 | 13F | SageView Advisory Group, LLC | 664 | 3 | ||||||
| 2026-02-10 | 13F | CIBC World Markets Inc. | 30.625 | -3,77 | 153 | -20,42 | ||||
| 2026-02-11 | 13F | LPL Financial LLC | 455.363 | 31,17 | 2.272 | 8,76 | ||||
| 2026-02-17 | 13F | Engineers Gate Manager LP | 795.977 | 163,33 | 3.972 | 118,31 | ||||
| 2026-02-12 | 13F | Commonwealth Equity Services, Llc | 192.978 | -3,86 | 963 | 96.100,00 | ||||
| 2026-02-17 | 13F | Sig Brokerage, Lp | Call | 112.000 | 0,00 | 559 | -17,21 | |||
| 2026-02-11 | 13F | Buckingham Strategic Partners | 0 | -100,00 | 0 | -100,00 | ||||
| 2026-02-17 | 13F | Quadrature Capital Ltd | 307.912 | -81,50 | 1.536 | -84,65 | ||||
| 2026-02-17 | 13F | Voleon Capital Management Lp | 41.166 | -86,55 | 205 | -88,88 | ||||
| 2026-02-17 | 13F | Oaktree Fund Advisors, LLC | 659.716 | -5,16 | 3.292 | -21,40 | ||||
| 2026-04-27 | 13F | La Banque Postale Asset Management SA | 0 | -100,00 | 0 | -100,00 | ||||
| 2026-04-20 | 13F | Banque Cantonale Vaudoise | 170.438 | 3,88 | 624 | -23,81 | ||||
| 2026-01-30 | 13F | Archer Investment Corp | 500 | 0,00 | 2 | -33,33 | ||||
| 2026-02-17 | 13F | Lazard Asset Management Llc | 472.946 | 45,54 | 2.360 | 20,65 | ||||
| 2026-02-10 | 13F | Ellevest, Inc. | 64.038 | -4,11 | 320 | -20,65 | ||||
| 2026-02-13 | 13F | JustInvest LLC | 129.435 | -7,21 | 646 | -23,12 | ||||
| 2026-02-04 | 13F | MUFG Bank, Ltd. | 142.913.428 | 0,00 | 713.138 | -17,11 | ||||
| 2026-02-09 | 13F | Blue Bell Private Wealth Management, Llc | 105 | 0,00 | 1 | |||||
| 2025-11-14 | 13F | Kinetic Partners Management, LP | 0 | -100,00 | 0 | -100,00 | ||||
| 2026-04-20 | 13F | Fiduciary Alliance LLC | 1.134.759 | 111,53 | 4.448 | 66,22 | ||||
| 2026-02-12 | 13F | Aviva Plc | 5.671.803 | 28,83 | 28.302 | 6,79 | ||||
| 2026-02-13 | 13F | Colony Group, LLC | 36.989 | 29,48 | 185 | 6,98 | ||||
| 2026-02-17 | 13F | Nomura Holdings Inc | 0 | -100,00 | 0 | |||||
| 2026-02-12 | 13F | Skandinaviska Enskilda Banken AB (publ) | 474.066 | 54,22 | 2.366 | 27,84 | ||||
| 2025-11-04 | 13F | Hazlett, Burt & Watson, Inc. | 0 | -100,00 | 0 | |||||
| 2026-04-15 | 13F | FNY Investment Advisers, LLC | 30.840 | 0,46 | 0 | |||||
| 2026-04-24 | 13F | TT International Asset Management LTD | 60.717 | 222 | ||||||
| 2026-02-09 | 13F | Coldstream Capital Management Inc | 15.920 | 79 | ||||||
| 2026-02-13 | 13F | American Century Companies Inc | 431.218 | -33,35 | 2.152 | -44,76 | ||||
| 2026-02-13 | 13F | Parkside Financial Bank & Trust | 154 | 0,00 | 1 | |||||
| 2025-11-14 | 13F | Fortress Investment Group LLC | 0 | -100,00 | 0 | -100,00 | ||||
| 2026-02-17 | 13F | Wiley Bros.-aintree Capital, Llc | 0 | -100,00 | 0 | -100,00 | ||||
| 2026-02-23 | 13F | Virtu Financial LLC | 351.925 | -4,87 | 2 | -50,00 | ||||
| 2026-01-22 | 13F | BOCHK Asset Management Ltd | 0 | -100,00 | 0 | -100,00 | ||||
| 2026-04-07 | 13F | Farther Finance Advisors, LLC | 6.672 | -31,96 | 24 | -50,00 | ||||
| 2026-02-10 | 13F | Sustainable Growth Advisers, LP | 3.896.506 | 94,05 | 19.444 | 60,85 | ||||
| 2026-02-09 | 13F | Hartland & Co., LLC | 162 | 1 | ||||||
| 2026-02-11 | 13F | Cerity Partners LLC | 75.888 | -1,15 | 379 | -18,18 | ||||
| 2025-11-12 | 13F | Huntington National Bank | 0 | -100,00 | 0 | |||||
| 2026-02-04 | 13F | Swiss Life Asset Management Ltd | 381.300 | -24,39 | 1.903 | -37,33 | ||||
| 2026-04-16 | 13F | SG Americas Securities, LLC | 9.804.355 | 111,30 | 36 | 52,17 | ||||
| 2026-04-30 | 13F | Resona Asset Management Co.,Ltd. | 721.569 | 0,40 | 2.628 | -26,94 | ||||
| 2026-01-26 | 13F | Cwm, Llc | 14.243 | 33,89 | 0 | |||||
| 2026-02-13 | 13F | Allianz Se | 4.960 | -47,01 | 25 | -57,14 | ||||
| 2026-02-17 | 13F | Vinva Investment Management Ltd | 1.444.621 | -21,19 | 7.400 | -34,49 | ||||
| 2026-02-13 | 13F | Cornerstone Financial Management LLC | 190 | 1 | ||||||
| 2026-02-13 | 13F | Mariner, LLC | 253.969 | 25,59 | 1.267 | 4,03 | ||||
| 2026-04-29 | 13F | Swedbank AB | 907.688 | 17,50 | 3.322 | -13,80 | ||||
| 2026-02-13 | 13F | Keystone Investors Pte Ltd | 114.217 | 570 | ||||||
| 2026-04-30 | 13F | BRYN MAWR TRUST Co | 0 | -100,00 | 0 | -100,00 | ||||
| 2026-02-10 | 13F | Bank of New York Mellon Corp | 4.234.096 | -34,38 | 21.128 | -45,61 | ||||
| 2026-04-14 | 13F | Tradewinds Capital Management, LLC | 0 | -100,00 | 0 | |||||
| 2026-02-17 | 13F | TCG Advisory Services, LLC | 15.000 | 0,00 | 75 | -17,78 | ||||
| 2026-04-20 | 13F | White Oak Capital Partners Pte. Ltd. | 787.010 | 1,88 | 2.778 | -29,08 | ||||
| 2026-02-10 | 13F | CIBC Asset Management Inc | 288.321 | 22,50 | 1.439 | 1,55 | ||||
| 2026-04-27 | 13F | Canal Capital Management, LLC | 109.662 | 0,00 | 401 | -26,69 | ||||
| 2026-01-27 | 13F | Evergreen Capital Management Llc | 17.862 | 3,28 | 89 | -14,42 | ||||
| 2026-04-21 | 13F | Financial Consulate, Inc | 233 | 1 | ||||||
| 2026-04-23 | 13F | Lazari Capital Management, Inc. | 13.200 | 48 | ||||||
| 2026-02-17 | 13F | Fmr Llc | 306.732 | -4,93 | 1.531 | -21,22 | ||||
| 2026-02-17 | 13F | Mercer Global Advisors Inc /adv | 18.625 | 3,84 | 93 | -14,02 | ||||
| 2025-11-12 | 13F | SeaTown Holdings Pte. Ltd. | 0 | -100,00 | 0 | -100,00 | ||||
| 2026-02-17 | 13F | Prelude Capital Management, Llc | 0 | -100,00 | 0 | -100,00 | ||||
| 2025-11-13 | 13F | Bank Of Montreal /can/ | Call | 0 | -100,00 | 0 | -100,00 | |||
| 2026-02-13 | 13F | Ubs Oconnor Llc | 101.500 | 506 | ||||||
| 2026-02-10 | 13F | Acadian Asset Management Llc | 0 | -100,00 | 0 | |||||
| 2026-02-12 | 13F | Insigneo Advisory Services, Llc | 0 | -100,00 | 0 | |||||
| 2026-02-17 | 13F | Two Sigma Securities, Llc | 132.181 | 12,70 | 660 | -6,66 | ||||
| 2026-01-23 | 13F | Transcend Wealth Collective, Llc | 42.500 | 226,92 | 212 | 171,79 | ||||
| 2026-02-13 | 13F | University Of Texas/texas Am Investment Managment Co | 213.907 | 1.067 | ||||||
| 2026-02-10 | 13F | Goldman Sachs Group Inc | 9.608.542 | -35,80 | 47.947 | -46,79 | ||||
| 2025-11-14 | 13F | Wetherby Asset Management Inc | 10.029 | 60 | ||||||
| 2026-04-20 | 13F | Jfs Wealth Advisors, Llc | 208 | 0,00 | 1 | -100,00 | ||||
| 2026-02-10 | 13F | NS Partners Ltd | 3.124.910 | 17,84 | 15.593 | -2,32 | ||||
| 2026-02-13 | 13F | Marshall Wace, Llp | 72.453.397 | 49,20 | 361.542 | 23,67 | ||||
| 2025-11-12 | 13F | Anfield Capital Management, LLC | 0 | -100,00 | 0 | |||||
| 2026-04-03 | 13F | Investors Research Corp | 50 | 0,00 | 0 | |||||
| 2026-02-19 | 13F | CI Private Wealth, LLC | 129.144 | 1,95 | 643 | -15,62 | ||||
| 2026-02-17 | 13F | Tiger Pacific Capital LP | 0 | -100,00 | 0 | -100,00 | ||||
| 2025-11-14 | 13F | Binnacle Investments Inc | 154 | 0,00 | 1 | |||||
| 2026-02-10 | 13F | Connor, Clark & Lunn Investment Management Ltd. | 0 | -100,00 | 0 | |||||
| 2026-02-17 | 13F | Par Capital Management Inc | Put | 0 | -100,00 | 0 | ||||
| 2026-04-15 | 13F | Milestone Asset Management, Llc | 19.722 | 72 | ||||||
| 2026-02-10 | 13F | Bnp Paribas | 16.513 | 0,00 | 82 | -17,17 | ||||
| 2026-02-12 | 13F | Marex Group plc | 83.674 | 179,74 | 418 | 131,67 | ||||
| 2026-02-18 | 13F | Sb Investment Advisers (uk) Ltd | 401.796.672 | 0,00 | 2.004.965 | -17,11 | ||||
| 2026-02-17 | 13F | Par Capital Management Inc | 0 | -100,00 | 0 | |||||
| 2026-02-13 | 13F | Walleye Trading LLC | 1.146.627 | -11,07 | 5.722 | -26,29 | ||||
| 2026-04-24 | 13F | Keybank National Association/oh | 16.677 | 34,69 | 61 | 0,00 | ||||
| 2026-02-13 | 13F | Walleye Trading LLC | Put | 296.100 | 109,11 | 1.478 | 73,36 | |||
| 2026-02-13 | 13F | Walleye Trading LLC | Call | 1.651.000 | 33,81 | 8.238 | 10,92 | |||
| 2026-02-17 | 13F | Qube Research & Technologies Ltd | 823.430 | -46,34 | 4.109 | -55,53 | ||||
| 2025-11-06 | 13F | Financial Advocates Investment Management | 0 | -100,00 | 0 | -100,00 | ||||
| 2026-02-06 | 13F | Keystone Financial Group | 22.160 | -84,68 | 111 | -87,36 | ||||
| 2026-04-27 | 13F | Sound Income Strategies, LLC | 1 | -99,32 | 0 | |||||
| 2026-01-29 | 13F | Coronation Fund Managers Ltd. | 18.682.302 | -24,41 | 93.225 | -37,34 | ||||
| 2026-04-23 | 13F | Kohmann Bosshard Financial Services, LLC | 1.204 | 1,26 | 4 | -20,00 | ||||
| 2026-02-13 | 13F | SYM FINANCIAL Corp | 5.441 | -0,38 | 27 | -15,62 | ||||
| 2026-02-14 | 13F | Adalta Capital Management LLC | 100.880 | 0,00 | 503 | -17,13 | ||||
| 2025-11-06 | 13F | Ameritas Advisory Services, LLC | 0 | -100,00 | 0 | |||||
| 2026-02-13 | 13F | Umb Bank N A/mo | 3.268 | 0,00 | 16 | -15,79 | ||||
| 2026-04-23 | 13F | Interchange Capital Partners, LLC | 0 | -100,00 | 0 | |||||
| 2026-02-05 | 13F | Bank Julius Baer & Co. Ltd, Zurich | 131.351 | -3,27 | 655 | -19,83 | ||||
| 2026-02-02 | 13F | Principal Financial Group Inc | 13.177.391 | 28,93 | 65.755 | 6,87 | ||||
| 2026-02-13 | 13F | SYM FINANCIAL Corp | Call | 5.700 | 0,00 | 28 | -17,65 | |||
| 2026-02-13 | 13F | Sei Investments Co | 4.908.760 | -8,37 | 24.493 | -24,05 | ||||
| 2025-11-14 | 13F | Lightspeed Management Company, L.L.C. | 0 | -100,00 | 0 | |||||
| 2026-04-17 | 13F | Arkfeld Wealth Strategies, L.L.C. | 19.015 | 0,00 | 75 | -22,92 | ||||
| 2026-04-24 | 13F | Raiffeisen Bank International AG | 71.791 | 66,48 | 253 | 16,06 | ||||
| 2026-02-13 | 13F | Stifel Financial Corp | 11.628 | 58 | ||||||
| 2026-02-17 | 13F | Parallax Volatility Advisers, L.P. | 49.665 | -55,95 | 248 | -63,57 | ||||
| 2026-02-17 | 13F | Parallax Volatility Advisers, L.P. | Put | 40.100 | 122,78 | 200 | 85,19 | |||
| 2026-04-07 | 13F | CoreCap Advisors, LLC | 2.200 | 10,00 | 8 | -11,11 | ||||
| 2026-02-17 | 13F | EFG International AG | 1.141.873 | 5.717 | ||||||
| 2025-11-13 | 13F | Seacrest Wealth Management, Llc | 0 | -100,00 | 0 | |||||
| 2026-02-17 | 13F | Hbk Investments L P | Put | 185.000 | 2,49 | 923 | -15,01 | |||
| 2026-02-03 | 13F | Ballentine Partners, LLC | 10.045 | -6,53 | 50 | -21,87 | ||||
| 2026-02-11 | 13F | Axiom International Investors Llc /de | 2.649.033 | -28,70 | 13.219 | -40,90 | ||||
| 2026-02-17 | 13F | Jones Financial Companies Lllp | 32.365 | 67,58 | 162 | 36,44 | ||||
| 2026-02-12 | 13F | Quadrant Capital Group Llc | 157.725 | -0,40 | 787 | -17,42 | ||||
| 2026-02-17 | 13F | Parallax Volatility Advisers, L.P. | Call | 51.200 | 357,14 | 255 | 280,60 | |||
| 2026-02-17 | 13F | Polar Capital Holdings Plc | 14.388.355 | 10,28 | 71.798 | -8,59 | ||||
| 2026-04-30 | 13F | Candriam Luxembourg S.C.A. | 10.041 | 0,00 | 37 | -28,00 | ||||
| 2026-02-13 | 13F | Prudential Financial Inc | 94.602 | -53,79 | 472 | -61,69 | ||||
| 2026-02-17 | 13F | Hbk Investments L P | Call | 235.000 | 30,12 | 1.173 | 7,82 | |||
| 2026-02-10 | 13F | Gulf International Bank (UK) Ltd | 130.209 | 0,00 | 1 | |||||
| 2026-02-17 | 13F | Citadel Advisors Llc | 17.109.637 | 61,50 | 85.377 | 33,87 | ||||
| 2026-02-17 | 13F | XTX Topco Ltd | 345.567 | 14,72 | 1.724 | -4,91 | ||||
| 2026-02-17 | 13F | Citadel Advisors Llc | Put | 3.383.400 | 65,04 | 16.883 | 36,80 | |||
| 2026-02-17 | 13F | Citadel Advisors Llc | Call | 9.136.300 | -8,94 | 45.590 | -24,52 | |||
| 2026-02-04 | 13F | Atlantic Union Bankshares Corp | 375 | 66,67 | 2 | 0,00 | ||||
| 2026-01-30 | 13F | Jennison Associates Llc | 3.791.286 | 18.919 | ||||||
| 2026-04-20 | 13F | Yorktown Management & Research Co Inc | 52.000 | 0,00 | 190 | -26,64 | ||||
| 2026-04-28 | 13F | Sage Rhino Capital Llc | 11.940 | 1,53 | 44 | -25,86 | ||||
| 2026-02-10 | 13F | Envestnet Asset Management Inc | 350.052 | -41,39 | 1.747 | -51,43 | ||||
| 2026-02-10 | 13F | Bnp Paribas Arbitrage, Sa | 18.527.453 | -10,53 | 92.452 | -25,84 | ||||
| 2026-02-11 | 13F | Manchester Capital Management LLC | 1.884 | 9 | ||||||
| 2026-02-11 | 13F | GW&K Investment Management, LLC | 479 | 0 | ||||||
| 2026-02-13 | 13F | Verition Fund Management LLC | 110.292 | -70,88 | 550 | -75,88 | ||||
| 2026-02-17 | 13F | Private Advisor Group, LLC | Call | 0 | -100,00 | 0 | ||||
| 2026-04-17 | 13F | Bell Investment Advisors, Inc | 1.788 | -28,48 | 7 | -50,00 | ||||
| 2026-04-17 | 13F | Roxbury Financial LLC | 750 | 0,00 | 3 | -33,33 | ||||
| 2026-02-17 | 13F | Jump Financial, LLC | 3.177.873 | -6,26 | 15.858 | -22,30 | ||||
| 2026-04-15 | 13F | Trust Co Of Toledo Na /oh/ | 814 | 0,00 | 3 | -50,00 | ||||
| 2026-02-13 | 13F/A | Abound Financial, Llc | 10.000 | 0,00 | 50 | -18,33 | ||||
| 2026-02-17 | 13F | Tudor Investment Corp Et Al | Put | 150.200 | 749 | |||||
| 2026-04-23 | 13F | Lansforsakringar Fondforvaltning AB (publ) | 1.404.506 | 23,38 | 5.140 | -9,51 | ||||
| 2026-02-17 | 13F | Tudor Investment Corp Et Al | 2.237.767 | 10,71 | 11.166 | -8,23 | ||||
| 2026-02-09 | 13F | Smith Chas P & Associates Pa Cpas | 11.000 | 55 | ||||||
| 2026-02-17 | 13F | Public Employees Retirement System Of Ohio | 710.592 | 0,37 | 3.546 | -16,80 | ||||
| 2026-04-28 | 13F | Oversea-Chinese Banking CORP Ltd | 9.593.077 | -18,85 | 35.058 | -40,51 | ||||
| 2026-02-02 | 13F | Danske Bank A/s | 1.260.520 | 13,56 | 6.290 | -5,88 | ||||
| 2026-02-13 | 13F | Squarepoint Ops LLC | Call | 11.000 | -94,10 | 55 | -95,18 | |||
| 2026-02-13 | 13F | Squarepoint Ops LLC | Put | 11.100 | -76,83 | 55 | -80,90 | |||
| 2026-02-13 | 13F | Clear Street Group Inc. | 93.253 | 465 | ||||||
| 2026-02-13 | 13F | Squarepoint Ops LLC | 7.360.730 | 3,09 | 36.730 | -14,55 | ||||
| 2026-02-18 | 13F | GWM Advisors LLC | 34.948 | -80,73 | 174 | -84,05 | ||||
| 2026-04-27 | 13F | Albion Financial Group /ut | 188 | 0,00 | 1 | |||||
| 2026-04-10 | 13F | Connecticut Capital Management Group, LLC | 0 | -100,00 | 0 | |||||
| 2026-05-01 | 13F | Royal London Asset Management Ltd | 115.652 | 0,00 | 423 | -26,69 | ||||
| 2026-01-15 | 13F | Cherry Creek Investment Advisors, Inc. | 0 | -100,00 | 0 | -100,00 | ||||
| 2026-04-24 | 13F | Optas, LLC | 0 | -100,00 | 0 | -100,00 | ||||
| 2026-02-13 | 13F | Aigen Investment Management, Lp | 202.382 | -17,68 | 1.010 | -31,82 | ||||
| 2026-04-15 | 13F | DAVENPORT & Co LLC | 47.572 | 28,49 | 174 | -5,43 | ||||
| 2026-02-11 | 13F | Capital World Investors | 4.183.646 | 20.876 | ||||||
| 2026-02-17 | 13F | 9823 Capital, L.P. | 35.986 | 180 | ||||||
| 2026-02-18 | 13F | Vident Advisory, LLC | 373.204 | 4,18 | 1.862 | -13,64 | ||||
| 2026-04-30 | 13F | Sompo Japan Nipponkoa Asset Management Co.,ltd. | 0 | -100,00 | 0 | -100,00 | ||||
| 2026-02-03 | 13F | Navellier & Associates Inc | 64.905 | -30,15 | 324 | -42,22 | ||||
| 2026-02-17 | 13F | Capital Fund Management S.a. | Call | 89.800 | -22,72 | 448 | -35,91 | |||
| 2025-11-13 | 13F | Capital International Sarl | 0 | -100,00 | 0 | |||||
| 2026-03-05 | 13F | Gunpowder Capital Management, LLC dba Oliver Wealth Management | 5.000 | 25 | ||||||
| 2025-12-16 | 13F | Garde Capital, Inc. | 0 | -100,00 | 0 | -100,00 | ||||
| 2026-01-26 | 13F | Mirae Asset Global Investments Co., Ltd. | 31.795 | 5,71 | 159 | -12,71 | ||||
| 2026-02-17 | 13F | Hidden Lake Asset Management LP | 2.296.054 | 11.457 | ||||||
| 2026-04-28 | 13F | Bogart Wealth, LLC | 1.500 | 0,00 | 5 | -28,57 | ||||
| 2026-02-03 | 13F | Maxi Investments CY Ltd | 190.000 | 1 | ||||||
| 2026-02-11 | 13F | BIT Capital GmbH | 3.385.500 | 0,00 | 16.894 | -17,11 | ||||
| 2026-02-17 | 13F | Summit Trail Advisors, Llc | 0 | -100,00 | 0 | -100,00 | ||||
| 2026-04-29 | 13F | R Squared Ltd | 171.976 | 1.090,23 | 629 | 773,61 | ||||
| 2026-01-15 | 13F | J. Safra Sarasin Holding AG | 122.740 | 43,43 | 612 | 18,83 | ||||
| 2026-02-17 | 13F | Clearlake Capital Group, L.p. | 5.500.000 | 0,00 | 27.445 | -17,11 | ||||
| 2026-04-07 | 13F | U.S. Capital Wealth Advisors, LLC | 0 | -100,00 | 0 | -100,00 | ||||
| 2026-02-17 | 13F | Worldquant Millennium Advisors Llc | 32.118 | -92,94 | 160 | -94,16 | ||||
| 2026-04-10 | 13F | Intellectus Partners, LLC | 136.250 | 46,90 | 499 | 7,79 | ||||
| 2026-02-17 | 13F | Cantor Fitzgerald, L. P. | 207.458 | 371,65 | 1.035 | 292,05 | ||||
| 2026-02-17 | 13F | Aqr Capital Management Llc | 1.733.120 | -71,73 | 8.648 | -76,57 | ||||
| 2026-04-24 | 13F | Yousif Capital Management, Llc | 59.332 | 0,00 | 217 | -18,73 | ||||
| 2026-04-28 | 13F | SBI Securities Co., Ltd. | 164.059 | 21,64 | 600 | -10,85 | ||||
| 2026-02-06 | 13F | Berbice Capital Management LLC | 1.500 | 0,00 | 7 | -22,22 | ||||
| 2026-04-10 | 13F | Abound Wealth Management | 0 | -100,00 | 0 | |||||
| 2026-04-13 | 13F | True Wealth Design, LLC | 0 | -100,00 | 0 | -100,00 | ||||
| 2026-02-13 | 13F | Uber Technologies, Inc | 535.902.982 | 0,00 | 2.674.156 | -17,11 | ||||
| 2026-05-01 | 13F | Commonwealth Of Pennsylvania Public School Empls Retrmt Sys | 360.672 | -6,62 | 1.320 | -31,50 | ||||
| 2026-01-29 | 13F | Matthews International Capital Management Llc | 2.367.470 | -24,02 | 11.814 | -37,02 | ||||
| 2026-02-11 | 13F | Parallel Advisors, LLC | 6.107 | 305,51 | 30 | 233,33 | ||||
| 2026-02-05 | 13F | Phoenix Holdings Ltd. | 34.600 | 6,13 | 173 | -12,24 | ||||
| 2026-02-17 | 13F | Point72 Asset Management, L.P. | Call | 26.500 | 132 | |||||
| 2026-02-17 | 13F | Point72 Asset Management, L.P. | 10.878.129 | 125,37 | 54.282 | 86,82 | ||||
| 2026-04-14 | 13F | Cohen Capital Management, Inc. | 1.286.301 | 28,14 | 4.708 | -6,03 | ||||
| 2026-02-10 | 13F | Rothschild Investment Llc | 467 | 0,00 | 2 | 0,00 | ||||
| 2026-02-10 | 13F | Cercano Management LLC | 1.600.000 | 7.984 | ||||||
| 2026-02-10 | 13F/A | Suncoast Equity Management | 20.000 | 100 | ||||||
| 2026-04-06 | 13F | GAMMA Investing LLC | 294 | -39,63 | 1 | -50,00 | ||||
| 2026-04-24 | 13F | IFM Investors Pty Ltd | 489.409 | 9,70 | 1.791 | 89.450,00 | ||||
| 2026-02-12 | 13F | EntryPoint Capital, LLC | 15.795 | 0,00 | 79 | -17,89 | ||||
| 2026-04-30 | 13F | Cambridge Investment Research Advisors, Inc. | 42.117 | -9,42 | 0 | |||||
| 2026-02-02 | 13F | Van Berkom & Associates Inc. | 113.800 | -35,01 | 1 | -100,00 | ||||
| 2026-04-23 | 13F | SJS Investment Consulting Inc. | 899 | 33,58 | 3 | 0,00 | ||||
| 2026-02-13 | 13F | Banco Santander, S.A. | 332.888 | 1.661 | ||||||
| 2026-02-17 | 13F | LMR Partners LLP | Call | 77.100 | -26,85 | 385 | -39,43 | |||
| 2026-02-17 | 13F | LMR Partners LLP | 1.071.068 | 498,76 | 5.345 | 396,65 | ||||
| 2025-11-14 | 13F | Oasis Management Co Ltd. | 0 | -100,00 | 0 | -100,00 | ||||
| 2026-02-17 | 13F | LMR Partners LLP | Put | 102.500 | 0,00 | 511 | -17,18 | |||
| 2025-11-13 | 13F | Panagora Asset Management Inc | 0 | -100,00 | 0 | |||||
| 2025-11-13 | 13F | Blue Grotto Capital, LLC | 0 | -100,00 | 0 | -100,00 | ||||
| 2026-02-13 | 13F | Sands Capital Management, Llc | 11.244.055 | -9,98 | 56.108 | -25,38 | ||||
| 2026-02-17 | 13F | Bank Of America Corp /de/ | Call | 0 | -100,00 | 0 | ||||
| 2026-02-12 | 13F | Federation des caisses Desjardins du Quebec | 161.330 | -0,35 | 805 | -17,45 | ||||
| 2026-04-21 | 13F | Huntleigh Advisors, Inc. | 0 | -100,00 | 0 | -100,00 | ||||
| 2026-02-10 | 13F | SCS Capital Management LLC | 264.214 | 0,00 | 1.318 | -17,11 | ||||
| 2025-11-14 | 13F | Point72 Hong Kong Ltd | 0 | -100,00 | 0 | -100,00 | ||||
| 2026-04-21 | 13F | Nemes Rush Group LLC | 1.000 | 0,00 | 4 | -25,00 | ||||
| 2026-01-22 | 13F | Massachusetts Financial Services Co /ma/ | 7.478.218 | 98,55 | 37.316 | 64,58 | ||||
| 2026-02-17 | 13F | Trexquant Investment LP | 3.291.316 | 111,33 | 16.424 | 75,18 | ||||
| 2026-04-20 | 13F | Friedenthal Financial | 0 | -100,00 | 0 | |||||
| 2026-02-13 | 13F | OMERS ADMINISTRATION Corp | 0 | -100,00 | 0 | -100,00 | ||||
| 2025-11-17 | 13F | FSA Wealth Management LLC | 1.100 | 0,00 | 7 | 20,00 | ||||
| 2026-04-24 | 13F | Private Advisor Group, LLC | 33.800 | -15,08 | 124 | -37,88 | ||||
| 2026-01-28 | 13F | Geneos Wealth Management Inc. | 1.300 | 1.200,00 | 6 | |||||
| 2026-02-05 | 13F | DnB Asset Management AS | 2.949.398 | 52,41 | 14.717 | 26,33 | ||||
| 2026-04-10 | 13F | Affinity Wealth Management Llc | 0 | -100,00 | 0 | -100,00 | ||||
| 2026-02-17 | 13F | Two Sigma Investments, Lp | Put | 737.300 | 0,00 | 3.679 | -17,10 | |||
| 2026-02-17 | 13F | Two Sigma Investments, Lp | 4.122.003 | -65,20 | 20.569 | -71,16 | ||||
| 2026-04-16 | 13F | Stanley-Laman Group, Ltd. | 310.000 | -13,89 | 1.135 | -36,86 | ||||
| 2026-04-27 | 13F | HB Wealth Management, LLC | 48.140 | 11,74 | 176 | -17,76 | ||||
| 2026-04-21 | 13F | Trueblood Wealth Management, LLC | 87.270 | 115,85 | 319 | 58,71 | ||||
| 2026-02-09 | 13F | Leavell Investment Management, Inc. | 20.000 | 0,00 | 100 | -17,50 | ||||
| 2026-02-20 | 13F | Sunbelt Securities, Inc. | 7.522 | 624,66 | 38 | 516,67 | ||||
| 2026-02-09 | 13F | Jefferies Financial Group Inc. | 40.636 | 203 | ||||||
| 2026-02-12 | 13F | Alps Advisors Inc | 348.580 | -4,83 | 1.739 | -21,10 | ||||
| 2026-04-17 | 13F | AdvisorNet Financial, Inc | 100.104 | 3,24 | 366 | -24,22 | ||||
| 2026-01-29 | 13F | UBS Group AG | Put | 0 | -100,00 | 0 | -100,00 | |||
| 2026-04-21 | 13F | Robeco Institutional Asset Management B.V. | 290.072 | -40,86 | 1.062 | -56,64 | ||||
| 2026-02-17 | 13F | Ardmore Road Asset Management LP | 2.083.583 | 10.397 | ||||||
| 2026-04-21 | 13F | Laurel Oak Wealth Management, Llc | 29.690 | 109 | ||||||
| 2026-02-13 | 13F | Toroso Investments, LLC | 510.040 | -33,72 | 2.545 | -45,06 | ||||
| 2026-04-30 | 13F | Accredited Investors Inc. | 0 | -100,00 | 0 | |||||
| 2026-02-17 | 13F | Mane Global Capital Management Lp | 8.814.250 | 9.948,16 | 43.983 | 8.230,11 | ||||
| 2026-02-12 | 13F | Hrt Financial Lp | 1.978.977 | -94,19 | 10 | -95,59 | ||||
| 2026-02-13 | 13F | Brown Advisory Inc | 26.378 | 1,03 | 132 | -16,56 | ||||
| 2026-02-03 | 13F | Mitsubishi UFJ Kokusai Asset Management Co., Ltd. | 2.383.899 | 11,23 | 12.110 | -6,14 | ||||
| 2026-02-17 | 13F | Edmond De Rothschild Holding S.a. | 6.433.200 | 12,33 | 32.102 | -6,89 | ||||
| 2026-02-12 | 13F | New York State Common Retirement Fund | 685.248 | 2,21 | 3.419 | -15,29 | ||||
| 2026-02-12 | 13F | Brown Brothers Harriman & Co | 0 | -100,00 | 0 | -100,00 | ||||
| 2026-04-14 | 13F | BSW Wealth Partners | 13.574 | -17,10 | 50 | -39,51 | ||||
| 2026-01-23 | 13F | Intelligence Driven Advisers, LLC | 11.549 | 12,60 | 58 | -6,56 | ||||
| 2026-02-13 | 13F | Platinum Investment Management Ltd | 0 | -100,00 | 0 | -100,00 | ||||
| 2026-02-17 | 13F | Snowden Capital Advisors LLC | 35.436 | -0,29 | 177 | -17,37 | ||||
| 2026-02-05 | 13F | AlphaCore Capital LLC | 32.114 | 6,59 | 160 | -11,60 | ||||
| 2026-04-30 | 13F | ASR Vermogensbeheer N.V. | 74.158 | -82,32 | 271 | -87,04 | ||||
| 2026-04-30 | 13F | Whipplewood Advisors, LLC | 451 | 2 | ||||||
| 2026-02-19 | 13F | Invesco Ltd. | 78.160.528 | -2,05 | 390.021 | -18,81 | ||||
| 2026-02-13 | 13F | Polymer Capital Management (HK) LTD | 148.974 | -88,61 | 743 | -90,56 | ||||
| 2026-04-16 | 13F | Toth Financial Advisory Corp | 615 | 2 | ||||||
| 2026-02-17 | 13F | Ninepoint Partners LP | 0 | -100,00 | 0 | -100,00 | ||||
| 2026-02-12 | 13F | Proficio Capital Partners LLC | 0 | -100,00 | 0 | -100,00 | ||||
| 2025-11-14 | 13F | Gotham Asset Management, LLC | 0 | -100,00 | 0 | -100,00 | ||||
| 2026-02-13 | 13F | Financial Network Wealth Advisors LLC | 205 | 0,00 | 1 | 0,00 | ||||
| 2026-02-13 | 13F | Headlands Technologies LLC | 421.727 | 78,58 | 2.104 | 48,06 | ||||
| 2025-11-13 | 13F | Capital Research Global Investors | 0 | -100,00 | 0 | |||||
| 2026-04-17 | 13F | IFC & Insurance Marketing, Inc. | 0 | -100,00 | 0 | |||||
| 2026-01-29 | 13F | Vanguard Group Inc | 8.910.523 | 2,99 | 44.464 | -14,63 | ||||
| 2026-02-13 | 13F | 1832 Asset Management L.P. | 0 | -100,00 | 0 | |||||
| 2026-02-17 | 13F | Man Group plc | 6.954.257 | 189,61 | 34.702 | 140,06 | ||||
| 2026-02-13 | 13F | Ossiam | 170.250 | 11,09 | 850 | -7,92 | ||||
| 2026-02-12 | 13F | Wealthspire Advisors, LLC | 0 | -100,00 | 0 | |||||
| 2026-05-01 | 13F | Concord Wealth Partners | 0 | -100,00 | 0 | |||||
| 2026-04-27 | 13F | Truist Financial Corp | 74.253 | 35,73 | 272 | -0,37 | ||||
| 2026-04-06 | 13F | Versant Capital Management, Inc | 10.317 | -50,40 | 38 | -64,08 | ||||
| 2026-02-17 | 13F | Woodline Partners LP | 43.706 | 218 | ||||||
| 2026-02-11 | 13F | Metis Global Partners, LLC | 81.263 | 1,75 | 406 | -15,62 | ||||
| 2026-02-13 | 13F | Truvestments Capital Llc | 24 | 0,00 | 0 | |||||
| 2026-02-17 | 13F | D. E. Shaw & Co., Inc. | 24.917.524 | -59,24 | 124.338 | -66,22 | ||||
| 2026-02-17 | 13F | D. E. Shaw & Co., Inc. | Put | 455.000 | 65,45 | 2.270 | 37,16 | |||
| 2026-01-14 | 13F | Clarius Group, LLC | 10.350 | 0,00 | 52 | -17,74 | ||||
| 2026-04-10 | 13F | Perigon Wealth Management, LLC | 10.801 | -1,27 | 40 | -27,78 | ||||
| 2026-02-09 | 13F | Hantz Financial Services, Inc. | 0 | -100,00 | 0 | |||||
| 2026-04-30 | 13F | Cromwell Holdings LLC | 11.884 | 0,00 | 43 | -27,12 | ||||
| 2025-11-14 | 13F | Soros Fund Management Llc | 0 | -100,00 | 0 | -100,00 | ||||
| 2026-04-14 | 13F | Banque Pictet & Cie Sa | 477.700 | 2,58 | 1.748 | -24,75 | ||||
| 2026-02-04 | 13F | Aubrey Capital Management Ltd | 3.052.058 | -27,15 | 15.229 | -39,61 | ||||
| 2026-02-13 | 13F | Manufacturers Life Insurance Company, The | 0 | -100,00 | 0 | |||||
| 2026-02-13 | 13F | Atlas Capital Advisors Llc | 300 | 0,00 | 1 | 0,00 | ||||
| 2026-03-12 | 13F/A | Peak6 Llc | Call | 354.700 | -51,39 | 1.770 | -59,72 | |||
| 2026-03-12 | 13F/A | Peak6 Llc | 1.721.614 | 13,40 | 8.591 | -6,01 | ||||
| 2026-02-13 | 13F | Dai-Ichi Life Insurance Company, Ltd | 86.679 | 0,00 | 433 | -17,08 | ||||
| 2026-02-17 | 13F | SummitTX Capital, L.P. | 25.064 | 125 | ||||||
| 2026-03-12 | 13F/A | Peak6 Llc | Put | 1.291.500 | 13,71 | 6.445 | -5,75 | |||
| 2026-02-13 | 13F | Barclays Plc | 9.281.133 | -16,20 | 46.313 | -30,54 | ||||
| 2026-02-17 | 13F | Amundi | 10.343.858 | 14,14 | 51.616 | -10,87 | ||||
| 2026-02-11 | 13F | Simplex Trading, Llc | 583.776 | -34,99 | 2.913 | 58.160,00 | ||||
| 2026-02-12 | 13F | BlackRock, Inc. | 129.407.123 | -1,21 | 645.742 | -18,11 | ||||
| 2026-02-12 | 13F | Ensign Peak Advisors, Inc | 125.000 | 0,00 | 624 | -17,15 | ||||
| 2026-02-17 | 13F | Investment Management Corp of Ontario | 224.357 | 108,62 | 1.120 | 72,95 | ||||
| 2026-04-20 | 13F | Ronald Blue Trust, Inc. | 29.135 | -6,02 | 107 | -31,17 | ||||
| 2025-11-14 | 13F | ExodusPoint Capital Management, LP | 1.049.410 | 73,60 | 6.317 | 210.466,67 | ||||
| 2026-04-15 | 13F | Activest Wealth Management | 9.850 | 0,00 | 36 | -26,53 | ||||
| 2026-02-13 | 13F | Maia Wealth LLC | 18.000 | 71,43 | 77 | 24,59 | ||||
| 2026-02-13 | 13F | Van Eck Associates Corp | 1.000.418 | 4,49 | 5 | -20,00 | ||||
| 2025-11-07 | 13F | Alberta Investment Management Corp | 0 | -100,00 | 0 | |||||
| 2026-04-21 | 13F | Maseco Llp | 0 | -100,00 | 0 | -100,00 | ||||
| 2026-02-13 | 13F | Public Employees Retirement Association Of Colorado | 402.987 | 0,00 | 2 | 0,00 | ||||
| 2026-02-13 | 13F | Nfj Investment Group, Llc | 1.178.918 | 5.883 | ||||||
| 2026-04-22 | 13F | Stone House Investment Management, LLC | 0 | -100,00 | 0 | -100,00 | ||||
| 2026-02-04 | 13F | Knuff & Co LLC | 16.000 | 33,33 | 80 | 9,72 | ||||
| 2025-11-12 | 13F | Thornburg Investment Management Inc | 0 | -100,00 | 0 | -100,00 | ||||
| 2026-02-12 | 13F | Swiss National Bank | 6.796.200 | -4,21 | 33.913 | -20,60 | ||||
| 2026-02-17 | 13F | Fullerton Fund Management Co Ltd | 29.549 | 165,70 | 147 | 122,73 | ||||
| 2026-01-20 | 13F | Myriad Asset Management US LP | 0 | -100,00 | 0 | |||||
| 2026-02-17 | 13F | Canada Pension Plan Investment Board | 723.832 | 0,00 | 3.612 | -17,12 | ||||
| 2026-02-18 | 13F | Mackenzie Financial Corp | 181.720 | 0,61 | 920 | -15,46 | ||||
| 2026-01-21 | 13F | Leo Wealth, LLC | 17.769 | -53,24 | 89 | -61,40 | ||||
| 2026-02-03 | 13F | Nordwand Advisors, LLC | 113.000 | 0,00 | 564 | -17,21 | ||||
| 2026-02-10 | 13F | Private Wealth Asset Management, LLC | 213 | 0,00 | 1 | 0,00 | ||||
| 2026-02-11 | 13F | Erste Asset Management GmbH | 0 | -100,00 | 0 | -100,00 | ||||
| 2026-02-11 | 13F | Vestcor Inc | 35.644 | 0,00 | 0 | |||||
| 2026-02-11 | 13F | Group One Trading, L.p. | 3.300.311 | -22,56 | 16.469 | -35,81 | ||||
| 2026-02-17 | 13F | Old Mission Capital Llc | 129.134 | 46,58 | 644 | 21,51 | ||||
| 2026-04-15 | 13F | Exchange Traded Concepts, Llc | 1.057.914 | -6,41 | 3.872 | -31,37 | ||||
| 2026-02-13 | 13F | Mml Investors Services, Llc | 12.916 | -31,07 | 64 | -42,86 | ||||
| 2025-11-13 | 13F | Diametric Capital, LP | 0 | -100,00 | 0 | |||||
| 2026-02-05 | 13F | Elyxium Wealth, LLC | 2.000 | 10 | ||||||
| 2026-02-13 | 13F | Natixis | 46.309 | 6,36 | 231 | -11,83 | ||||
| 2026-02-17 | 13F | Laird Norton Trust Company, Llc | 66.062 | 330 | ||||||
| 2026-02-17 | 13F | Advisor Group Holdings, Inc. | 151.948 | 28,93 | 758 | 10,82 | ||||
| 2026-04-29 | 13F | Klp Kapitalforvaltning As | 1.024.800 | 3,38 | 3.751 | -24,18 | ||||
| 2026-02-10 | 13F | Intech Investment Management Llc | 855.838 | 7,32 | 4.271 | -11,04 | ||||
| 2026-04-06 | 13F | Highline Wealth Partners Llc | 0 | -100,00 | 0 | |||||
| 2026-04-29 | 13F | Skopos Labs, Inc. | 0 | -100,00 | 0 | |||||
| 2026-04-14 | 13F | Pictet & Cie (Europe) SA | 235.615 | 19,49 | 862 | -12,31 | ||||
| 2026-02-17 | 13F | Shay Capital LLC | Call | 0 | -100,00 | 0 | -100,00 | |||
| 2026-04-08 | 13F | Wealth Enhancement Advisory Services, Llc | Call | 10.000 | -80,00 | 91 | 42,86 | |||
| 2026-04-08 | 13F | Wealth Enhancement Advisory Services, Llc | 21.027 | -14,41 | 0 | -100,00 | ||||
| 2026-02-03 | 13F | Premier Fund Managers Ltd | 0 | -100,00 | 0 | -100,00 | ||||
| 2026-02-13 | 13F | Healthcare Of Ontario Pension Plan Trust Fund | 3.153.900 | -48,75 | 15.738 | -57,52 | ||||
| 2026-02-17 | 13F | Shay Capital LLC | 0 | -100,00 | 0 | -100,00 | ||||
| 2026-04-17 | 13F | Webster Bank, N. A. | 2.000 | 0,00 | 7 | -22,22 | ||||
| 2026-05-01 | 13F | Fifth Third Bancorp | 1.722 | 23,97 | 6 | 0,00 | ||||
| 2026-02-05 | 13F | Bessemer Group Inc | 2.346 | 254,92 | 0 | |||||
| 2026-04-29 | 13F/A | Salem Investment Counselors Inc | 1.500 | 5 | ||||||
| 2026-02-12 | 13F | Bank Of Montreal /can/ | Put | 3.700 | 0,00 | 18 | -18,18 | |||
| 2026-02-12 | 13F | Bank Of Montreal /can/ | 948.272 | 3,30 | 4.732 | -14,39 | ||||
| 2026-04-22 | 13F | Advocate Investing Services LLC | 7.000 | 0,00 | 26 | -26,47 | ||||
| 2026-02-17 | 13F | Nishkama Capital, LLC | 1.782.744 | 8.896 | ||||||
| 2026-04-29 | 13F | Dsm Capital Partners Llc | 731.172 | -39,32 | 2.676 | -55,49 | ||||
| 2026-04-07 | 13F | Park Avenue Securities Llc | 10.023 | -88,79 | 0 | |||||
| 2026-01-08 | 13F | Nordea Investment Management Ab | 23.685.128 | 19,10 | 119.491 | -0,84 | ||||
| 2025-11-14 | 13F | National Bank Of Canada /fi/ | 0 | -100,00 | 0 | |||||
| 2026-02-18 | 13F | VGI Partners Ltd | 214.462 | 79,52 | 1.070 | 48,82 | ||||
| 2026-02-12 | 13F | APG Asset Management N.V. | 1.483.731 | -6,94 | 6.304 | -22,82 | ||||
| 2026-02-10 | 13F | Eurizon SLJ Capital Ltd | 265.823 | 1.326 | ||||||
| 2026-04-16 | 13F | Diversified Trust Co | 0 | -100,00 | 0 | -100,00 | ||||
| 2026-02-17 | 13F | Jain Global LLC | 8.212.301 | 40.979 | ||||||
| 2026-02-17 | 13F | Gladstone Institutional Advisory LLC | 21.500 | -84,14 | 107 | -86,89 | ||||
| 2025-11-07 | 13F | NewEdge Wealth, LLC | 0 | -100,00 | 0 | -100,00 | ||||
| 2025-11-07 | 13F | Sierra Ocean, Llc | 0 | -100,00 | 0 | -100,00 | ||||
| 2026-04-21 | 13F | GHP Investment Advisors, Inc. | 12 | 0 | ||||||
| 2026-02-17 | 13F | Aragon Global Management, LP | 955.600 | 0,00 | 4.768 | -17,11 | ||||
| 2026-04-28 | 13F | Altfest L J & Co Inc | 0 | -100,00 | 0 | -100,00 | ||||
| 2026-02-13 | 13F | Ieq Capital, Llc | 203.188 | 2,39 | 1.014 | -15,16 | ||||
| 2026-02-20 | 13F/A | Capital Markets Trading UK LLP | 119.618 | 224,28 | 1 | |||||
| 2026-02-03 | 13F | Strengthening Families & Communities, LLC | 4.100 | 20 | ||||||
| 2026-02-12 | 13F | MetLife Investment Management, LLC | 227.800 | 0,00 | 1.137 | -17,14 | ||||
| 2026-02-17 | 13F | Russell Investments Group, Ltd. | 17.113.344 | 3,42 | 85.406 | -14,27 | ||||
| 2026-02-13 | 13F | Public Sector Pension Investment Board | 1.235.205 | -13,48 | 6.164 | -28,29 | ||||
| 2026-04-17 | 13F | Murphy & Mullick Capital Management Corp | 5.000 | 0,00 | 18 | -25,00 | ||||
| 2026-02-17 | 13F | Tiger Global Management Llc | 92.923.788 | 0,00 | 463.690 | -17,11 | ||||
| 2026-02-17 | 13F | Tremblant Capital Group | 22.140.776 | 131,43 | 110.482 | 91,83 | ||||
| 2026-01-27 | 13F | Belpointe Asset Management LLC | 0 | -100,00 | 0 | -100,00 | ||||
| 2026-02-13 | 13F | Charles Schwab Investment Management Inc | 2.114.180 | 5,36 | 10.550 | -12,67 | ||||
| 2026-02-06 | 13F | Evoke Wealth, Llc | 12.622 | 63 | ||||||
| 2026-04-29 | 13F | Standard Life Aberdeen plc | 497.402 | 3,84 | 1.820 | -23,85 | ||||
| 2026-02-06 | 13F | Envestnet Portfolio Solutions, Inc. | 0 | -100,00 | 0 | -100,00 | ||||
| 2026-04-13 | 13F | Massmutual Trust Co Fsb/adv | 7.556 | 63,62 | 28 | 17,39 | ||||
| 2026-04-24 | 13F | Sumitomo Mitsui DS Asset Management Company, Ltd | 290.130 | 0,00 | 1.062 | -26,68 | ||||
| 2026-02-11 | 13F | Franklin Resources Inc | 15.701.389 | 326,98 | 78.350 | 253,93 | ||||
| 2026-04-28 | 13F | PFA Pension, Forsikringsaktieselskab | 1.269.594 | -0,00 | 4.647 | -27,81 | ||||
| 2026-02-11 | 13F | Allianz Asset Management GmbH | 1.709.014 | 76,64 | 8.528 | 46,41 | ||||
| 2026-02-17 | 13F | Equitable Holdings, Inc. | 65.380 | 310,42 | 326 | 243,16 | ||||
| 2026-04-21 | 13F | GFG Capital, LLC | 39.159 | 0,00 | 143 | -26,67 | ||||
| 2026-04-29 | 13F | Montag A & Associates Inc | 7.500 | 27 | ||||||
| 2026-02-04 | 13F | Dogwood Wealth Management LLC | 635 | 0,00 | 3 | 0,00 | ||||
| 2026-02-17 | 13F | Tower Research Capital LLC (TRC) | 492 | -93,83 | 2 | -95,74 | ||||
| 2025-11-12 | 13F | HAP Trading, LLC | Call | 200.400 | 65 | |||||
| 2025-11-14 | 13F | AXA Investment Managers S.A. | 7.543 | 45 | ||||||
| 2026-02-13 | 13F | Macquarie Group Ltd | 4.163.507 | -5,36 | 20.776 | -21,55 | ||||
| 2025-11-14 | 13F | Gpi Capital, L.p. | 0 | -100,00 | 0 | |||||
| 2026-02-10 | 13F | Fideuram Asset Management (Ireland) dac | 136.268 | 627 | ||||||
| 2026-02-13 | 13F | Strategic Global Advisors, LLC | 250.347 | -88,37 | 1.249 | -90,36 | ||||
| 2026-02-05 | 13F | Central Asset Investments & Management Holdings (HK) Ltd | 0 | -100,00 | 0 | -100,00 | ||||
| 2026-02-13 | 13F | Pinnacle Wealth Planning Services, Inc. | 6.432 | 32 | ||||||
| 2026-04-24 | 13F | UMA Financial Services, Inc. | 150 | -70,59 | 1 | -100,00 | ||||
| 2026-02-12 | 13F | Campbell & CO Investment Adviser LLC | 0 | -100,00 | 0 | -100,00 | ||||
| 2026-04-10 | 13F | Centurion Wealth Management LLC | Call | 0 | -100,00 | 0 | ||||
| 2026-04-23 | 13F | Oppenheimer Asset Management Inc. | 52.147 | 22,72 | 191 | -10,38 | ||||
| 2026-01-26 | 13F | KBC Group NV | 1.092.223 | -15,21 | 5 | -28,57 | ||||
| 2026-02-03 | 13F | S-Bank Fund Management Ltd | 320.000 | 0,00 | 1.597 | -17,13 | ||||
| 2026-02-17 | 13F | Credit Agricole S A | 492.999 | -2,35 | 2.460 | -19,05 | ||||
| 2026-02-17 | 13F | Mirabella Financial Services Llp | 363.054 | 1.834 | ||||||
| 2026-02-24 | 13F/A | Pacer Advisors, Inc. | 25.587 | -2,71 | 128 | -19,62 | ||||
| 2026-02-09 | 13F | Wcm Investment Management, Llc | 967.125 | 9,97 | 4.903 | -8,75 | ||||
| 2026-02-17 | 13F | Creative Planning | 251.144 | 7,04 | 1.253 | -11,26 | ||||
| 2026-04-30 | 13F | Warm Springs Advisors Inc. | 458.500 | 12,24 | 1.678 | -17,66 | ||||
| 2026-02-13 | 13F | Morgan Stanley | 112.488.631 | -22,35 | 561.318 | -35,64 | ||||
| 2026-02-06 | 13F | Vestmark Advisory Solutions, Inc. | 27.092 | -48,50 | 135 | -57,28 | ||||
| 2026-02-17 | 13F | Boothbay Fund Management, Llc | 81.439 | -41,04 | 406 | -51,14 | ||||
| 2026-02-23 | 13F | Wealth Preservation Advisors, LLC | 0 | -100,00 | 0 | -100,00 | ||||
| 2026-02-13 | 13F | BRITISH COLUMBIA INVESTMENT MANAGEMENT Corp | 14.500 | -98,99 | 72 | -99,17 | ||||
| 2026-04-24 | 13F | Root Financial Partners, LLC | 141 | -78,21 | 1 | -100,00 | ||||
| 2026-04-06 | 13F | CX Institutional | 85.141 | -5,39 | 0 | |||||
| 2025-11-14 | 13F | Wolverine Trading, Llc | 111.649 | -52,90 | 682 | -41,51 | ||||
| 2025-11-14 | 13F | Wolverine Trading, Llc | Call | 1.676.300 | 155,38 | 10.242 | 217,19 | |||
| 2025-11-14 | 13F | Wolverine Trading, Llc | Put | 282.200 | 186,50 | 1.724 | 256,20 | |||
| 2026-04-30 | 13F | Sumitomo Mitsui Trust Holdings, Inc. | 4.864.941 | 0,04 | 17.806 | -26,62 | ||||
| 2026-02-13 | 13F | Neuberger Berman Group LLC | 513.779 | 230,87 | 2.594 | 177,62 | ||||
| 2026-02-17 | 13F | Eddie Patel Inc | 115.571 | 577 | ||||||
| 2026-04-28 | 13F | Flagship Harbor Advisors, Llc | 0 | -100,00 | 0 | -100,00 | ||||
| 2026-01-16 | 13F | Crewe Advisors LLC | 1.000 | -5,84 | 5 | -33,33 | ||||
| 2026-02-12 | 13F | Marex Group plc | Call | 0 | -100,00 | 0 | -100,00 | |||
| 2025-11-13 | 13F | Glenmede Investment Management, LP | 17.391 | 7,99 | 105 | 28,40 | ||||
| 2026-02-13 | 13F | Vontobel Holding Ltd. | 205.824 | 50,31 | 1.027 | 24,64 | ||||
| 2026-02-13 | 13F | Korea Investment CORP | 1.170.289 | 1,94 | 5.840 | -15,50 | ||||
| 2026-02-13 | 13F | SRS Capital Advisors, Inc. | 6.973 | -45,83 | 35 | -55,84 | ||||
| 2026-02-17 | 13F | Advisory Services Network, LLC | 18.503 | 196,90 | 92 | 148,65 | ||||
| 2026-02-17 | 13F | SIH Partners, LLLP | 86.367 | 4,84 | 431 | -13,13 | ||||
| 2026-04-30 | 13F | LRI Investments, LLC | 1.980 | 240,21 | 7 | 250,00 | ||||
| 2026-01-20 | 13F | Steel Peak Wealth Management LLC | 79.334 | 396 | ||||||
| 2026-01-27 | 13F | Zurcher Kantonalbank (Zurich Cantonalbank) | 847.786 | 2,67 | 4.230 | -14,91 | ||||
| 2026-02-12 | 13F | Advisors Asset Management, Inc. | 34.061 | 26,89 | 170 | 4,97 | ||||
| 2026-02-13 | 13F | Axim Planning & Wealth | 49.658 | 160,59 | 248 | 116,67 | ||||
| 2026-03-04 | 13F | SHP Wealth Management | 211 | 1 | ||||||
| 2026-04-24 | 13F | USS Investment Management Ltd | 659.368 | 0,00 | 2.410 | -26,69 | ||||
| 2026-02-12 | 13F | Scotia Capital Inc. | 206.562 | 4,83 | 1.031 | -13,15 | ||||
| 2026-02-12 | 13F | DRW Securities, LLC | 14.559 | -77,80 | 73 | -81,86 | ||||
| 2026-02-17 | 13F | Bank Of America Corp /de/ | 13.312.084 | 133,46 | 66.427 | 93,52 | ||||
| 2026-02-09 | 13F | Prospera Financial Services Inc | 0 | -100,00 | 0 | -100,00 | ||||
| 2026-02-10 | 13F | Quantbot Technologies LP | 452.288 | -46,10 | 2.257 | -55,34 | ||||
| 2026-02-13 | 13F | Maplelane Capital, Llc | 0 | -100,00 | 0 | -100,00 | ||||
| 2026-02-17 | 13F | Cetera Investment Advisers | 150.956 | -6,46 | 753 | -22,45 | ||||
| 2026-02-10 | 13F | Daiwa Securities Group Inc. | 266.755 | 2,33 | 1 | 0,00 | ||||
| 2026-02-12 | 13F | Jane Street Group, Llc | Call | 1.464.600 | -27,11 | 7.308 | -39,58 | |||
| 2026-02-12 | 13F | Qtron Investments LLC | 115.838 | 8,11 | 578 | -10,39 | ||||
| 2026-02-12 | 13F | Jane Street Group, Llc | 14.131.078 | -13,98 | 70.514 | -28,70 | ||||
| 2026-02-12 | 13F | Jane Street Group, Llc | Put | 5.569.500 | 49,54 | 27.792 | 23,96 | |||
| 2026-04-22 | 13F | Pictet Asset Management Holding SA | 1.792.336 | -0,97 | 6.550 | -27,52 | ||||
| 2026-04-29 | 13F | Police & Firemen's Retirement System of New Jersey | 318.915 | 0,00 | 1.167 | -26,65 | ||||
| 2026-04-24 | 13F | Retirement Systems of Alabama | 712.395 | 0,07 | 2.607 | -26,60 | ||||
| 2026-01-15 | 13F | Allspring Global Investments Holdings, LLC | 15.424.298 | -1,67 | 78.355 | -15,34 | ||||
| 2025-11-13 | 13F | Portolan Capital Management, LLC | 0 | -100,00 | 0 | |||||
| 2026-02-17 | 13F | Two Sigma Advisers, Lp | 0 | -100,00 | 0 | -100,00 | ||||
| 2026-01-30 | 13F | Citizens Financial Group Inc/ri | 0 | -100,00 | 0 | |||||
| 2026-01-30 | 13F/A | M&t Bank Corp | 168.147 | 980,91 | 839 | 801,08 | ||||
| 2026-01-23 | 13F | Assetmark, Inc | 2.036 | -94,03 | 10 | -95,12 | ||||
| 2026-02-11 | 13F | Jpmorgan Chase & Co | 56.669.014 | 1,58 | 282.778 | -15,80 | ||||
| 2026-02-13 | 13F | First Trust Advisors Lp | 302.863 | 30,82 | 1.511 | 8,47 | ||||
| 2026-02-10 | 13F | Andar Capital Management HK Ltd | 0 | -100,00 | 0 | |||||
| 2026-01-27 | 13F | Tokio Marine Asset Management Co Ltd | 54.000 | 0,00 | 269 | -17,23 | ||||
| 2026-04-30 | 13F | Mmbg Investment Advisors Co. | 93.350 | 0,00 | 342 | -26,67 | ||||
| 2025-11-12 | 13F | Strategies Wealth Advisors, LLC | 0 | -100,00 | 0 | |||||
| 2026-02-13 | 13F | Arkadios Wealth Advisors | Call | 0 | -100,00 | 0 | ||||
| 2026-02-17 | 13F | United Capital Financial Advisers, Llc | 15.574 | 78 | ||||||
| 2026-02-13 | 13F | Arkadios Wealth Advisors | 0 | -100,00 | 0 | |||||
| 2026-02-13 | 13F | Wells Fargo & Company/mn | 1.487.114 | -52,17 | 7.421 | -60,35 | ||||
| 2026-02-13 | 13F | Wells Fargo & Company/mn | Put | 1.000.000 | -62,24 | 4.990 | -68,70 | |||
| 2026-02-06 | 13F | Covestor Ltd | Call | 1 | 0,00 | 0 | ||||
| 2026-01-27 | 13F | Asset Management One Co., Ltd. | 2.140.322 | -15,34 | 10.914 | -28,29 | ||||
| 2026-02-06 | 13F | Covestor Ltd | 81 | 0,00 | 0 | |||||
| 2026-02-10 | 13F | Lido Advisors, LLC | 23.124 | 0,00 | 138 | -0,72 | ||||
| 2026-02-11 | 13F | Syon Capital Llc | 76.996 | -3,07 | 384 | -19,67 | ||||
| 2026-04-30 | 13F | Hsbc Holdings Plc | 14.786.634 | 129,07 | 54.056 | 67,79 | ||||
| 2025-11-07 | 13F | Gsa Capital Partners Llp | 0 | -100,00 | 0 | |||||
| 2026-02-17 | 13F | Optiver Holding B.V. | 410 | -89,44 | 2 | -91,30 | ||||
| 2026-02-17 | 13F | Ameriprise Financial Inc | 5.771.575 | 1,92 | 28.800 | -15,52 | ||||
| 2026-02-13 | 13F | Bridgewater Associates, LP | 11.534.093 | -24,00 | 57.555 | -37,01 | ||||
| 2026-01-30 | 13F | State of New Jersey Common Pension Fund D | 1.079.740 | -0,39 | 5.388 | -17,44 | ||||
| 2026-02-17 | 13F | Ameriprise Financial Inc | Call | 4.895.000 | 24.426 | |||||
| 2026-02-13 | 13F | Centaurus Financial, Inc. | 0 | -100,00 | 0 | |||||
| 2026-02-06 | 13F | Larson Financial Group LLC | 10.004 | 53,81 | 50 | 25,64 | ||||
| 2026-02-12 | 13F | Ward Ferry Management (BVI) Ltd | 37.675.992 | 12,53 | 188 | -6,47 | ||||
| 2026-02-06 | 13F | Global Retirement Partners, LLC | 8.516 | 66,91 | 42 | 40,00 | ||||
| 2026-02-13 | 13F | BNP Paribas Asset Management Holding S.A. | 44.360 | 0 | ||||||
| 2026-02-13 | 13F | Transamerica Financial Advisors, Inc. | 25 | -89,32 | 0 | -100,00 | ||||
| 2025-11-14 | 13F | PointState Capital LP | Put | 0 | -100,00 | 0 | -100,00 | |||
| 2025-11-14 | 13F | Point72 (DIFC) Ltd | 81.999 | 51,10 | 494 | 81,25 | ||||
| 2026-02-13 | 13F | State Street Corp | 45.938.139 | 5,67 | 229.231 | -12,41 | ||||
| 2026-02-17 | 13F | Nissay Asset Management Corp /japan/ /adv | 1.029.580 | 246,03 | 5.138 | 186,82 | ||||
| 2026-04-28 | 13F | Ntv Asset Management Llc | 184.925 | -30,77 | 677 | -49,25 | ||||
| 2026-02-05 | 13F | Atria Investments Llc | 19.032 | -15,08 | 95 | -29,85 | ||||
| 2025-11-06 | 13F | Ground Swell Capital, LLC | 0 | -100,00 | 0 | -100,00 | ||||
| 2026-01-28 | 13F | Salomon & Ludwin, LLC | 1.854 | 63,49 | 9 | 50,00 | ||||
| 2026-02-06 | 13F | Pnc Financial Services Group, Inc. | 83.338 | 13,09 | 416 | -6,32 | ||||
| 2026-02-04 | 13F | Summit Wealth Group Llc / Co | 0 | -100,00 | 0 | -100,00 | ||||
| 2026-02-17 | 13F | Northern Trust Corp | 12.968.521 | 2,71 | 64.713 | -14,87 | ||||
| 2026-04-20 | 13F | Assenagon Asset Management S.A. | 54.906.371 | 57,99 | 200.957 | 15,88 | ||||
| 2026-04-28 | 13F | Kepler Cheuvreux (Suisse) SA | 0 | -100,00 | 0 | |||||
| 2026-02-17 | 13F | Creative Planning | Call | 0 | -100,00 | 0 | ||||
| 2026-02-17 | 13F | Oaktree Capital Management Lp | 11.207.699 | -7,33 | 55.926 | -23,19 | ||||
| 2026-02-17 | 13F | Royal Bank Of Canada | 8.306.516 | -12,77 | 41.450 | -27,69 | ||||
| 2026-02-09 | 13F | Intermede Investment Partners Ltd | 1.854.024 | 0,44 | 9 | -18,18 | ||||
| 2026-02-05 | 13F | E Fund Management (Hong Kong) Co., Ltd. | 0 | -100,00 | 0 | |||||
| 2026-02-11 | 13F | Prudential Plc | 10.954.732 | -2,83 | 54.664 | -19,46 | ||||
| 2026-02-17 | 13F | Two Creeks Capital Management, LP | 8.881.384 | -8,09 | 44.318 | -23,81 | ||||
| 2026-04-24 | 13F | Innova Wealth Partners | Call | 0 | -100,00 | 0 | ||||
| 2026-04-24 | 13F | ProShare Advisors LLC | 46.081 | -16,67 | 169 | -38,91 | ||||
| 2026-02-17 | 13F | Susquehanna International Group, Llp | 4.574.428 | -42,99 | 22.826 | -52,75 | ||||
| 2026-02-17 | 13F | Susquehanna International Group, Llp | Put | 6.683.800 | 15,36 | 33.352 | -4,38 | |||
| 2026-02-12 | 13F | California Public Employees Retirement System | 4.857.514 | -2,38 | 24.239 | -19,09 | ||||
| 2025-11-12 | 13F | 111 Capital | 0 | -100,00 | 0 | |||||
| 2026-02-17 | 13F | Susquehanna International Group, Llp | Call | 21.132.100 | 28,18 | 105.449 | 6,25 | |||
| 2026-04-16 | 13F | Evolve Private Wealth, Llc | 31.784 | 23,20 | 116 | -9,37 | ||||
| 2026-02-10 | 13F | Sivia Capital Partners, LLC | 11.622 | 0,00 | 58 | -17,39 | ||||
| 2026-01-30 | 13F | Us Bancorp \de\ | 39.541 | -11,71 | 197 | -26,77 | ||||
| 2026-02-12 | 13F | Federated Hermes, Inc. | 8.836.845 | -20,52 | 44.096 | -34,12 | ||||
| 2026-04-14 | 13F | Udine Wealth Management, Inc. | 442.914 | 9,70 | 1.621 | 80.950,00 | ||||
| 2026-02-02 | 13F | Mutual Advisors, LLC | 117.209 | -0,02 | 585 | -12,84 | ||||
| 2026-04-15 | 13F | Zullo Investment Group, Inc. | 0 | -100,00 | 0 | -100,00 | ||||
| 2026-02-17 | 13F | J. Goldman & Co LP | 3.526.000 | 4.307,50 | 17.595 | 3.557,80 | ||||
| 2026-02-05 | 13F | Boulder Wealth Advisors, LLC | 100 | 0 | ||||||
| 2026-02-10 | 13F | Caz Investments Lp | 1.825.116 | -0,27 | 9.107 | -17,34 | ||||
| 2026-02-17 | 13F | Entrust Global Partners L L C | 0 | -100,00 | 0 | |||||
| 2026-02-09 | 13F | Putnam Fl Investment Management Co | 26.175 | 26,53 | 131 | 4,84 | ||||
| 2026-04-30 | 13F | Independence Bank of Kentucky | 0 | -100,00 | 0 | |||||
| 2026-04-30 | 13F | Nuveen, LLC | 10.168.886 | -2,50 | 37.218 | -28,48 | ||||
| 2026-04-08 | 13F | Miracle Mile Advisors, LLC | 43.643 | 31,32 | 160 | -3,64 | ||||
| 2026-05-01 | 13F | Thrivent Financial For Lutherans | 35.199 | 3,53 | 0 | |||||
| 2026-01-12 | 13F | Traynor Capital Management, Inc. | 12.061 | -0,29 | 60 | -16,67 | ||||
| 2026-02-17 | 13F | Delaware Management Holdings, Inc. | 164.151 | 819 | ||||||
| 2026-04-24 | 13F | Means Investment Co., Inc. | Call | 0 | -100,00 | 0 | ||||
| 2026-02-17 | 13F | PDT Partners, LLC | 0 | -100,00 | 0 | |||||
| 2026-04-27 | 13F | Y-Intercept (Hong Kong) Ltd | 12.628 | 46 | ||||||
| 2026-04-29 | 13F | KERR FINANCIAL PLANNING Corp | 231 | -27,81 | 1 | -100,00 | ||||
| 2026-02-17 | 13F | Spears Abacus Advisors LLC | 120.000 | 0,00 | 599 | -17,17 | ||||
| 2026-02-12 | 13F | CIBC Private Wealth Group, LLC | 33 | 0 | ||||||
| 2026-02-13 | 13F | MAI Capital Management | 33.144 | 205,95 | 165 | 153,85 | ||||
| 2025-11-14 | 13F | ICONIQ Capital, LLC | 0 | -100,00 | 0 | |||||
| 2026-01-23 | 13F | Baillie Gifford & Co | 46.212.934 | -2,97 | 230.603 | -19,57 | ||||
| 2026-02-02 | 13F | Cornerstone Planning Group LLC | 235 | 0,00 | 1 | 0,00 | ||||
| 2026-04-17 | 13F | Krilogy Financial LLC | Call | 52.000 | 22 | |||||
| 2026-02-06 | 13F/A | Rathbone Brothers plc | 18.444 | 38,01 | 92 | 15,00 | ||||
| 2026-02-17 | 13F | Scientech Research LLC | 0 | -100,00 | 0 | |||||
| 2026-02-11 | 13F | Ramirez Asset Management, Inc. | 612.466 | 3.056 | ||||||
| 2026-02-17 | 13F | Wellington Management Group Llp | 34.109.838 | 4,04 | 170.208 | -13,76 | ||||
| 2026-01-23 | 13F | Rsm Us Wealth Management Llc | 22.917 | -26,10 | 116 | -37,63 | ||||
| 2026-04-22 | 13F | Janney Montgomery Scott LLC | 225.739 | -52,37 | 1 | -100,00 | ||||
| 2026-02-10 | 13F | Nomura Asset Management Co Ltd | 836.654 | 0,00 | 4.175 | -17,12 | ||||
| 2026-01-28 | 13F | N.E.W. Advisory Services LLC | 350 | 0,00 | 2 | -50,00 | ||||
| 2026-02-17 | 13F | Millennium Management Llc | 15.678.401 | 121,61 | 78.235 | 83,70 | ||||
| 2026-02-13 | 13F | Caitong International Asset Management Co., Ltd | 9.348 | 111,59 | 47 | 76,92 | ||||
| 2026-01-29 | 13F | IMC-Chicago, LLC | 1.174.069 | -11,00 | 5.859 | -26,23 | ||||
| 2026-02-17 | 13F | Millennium Management Llc | Put | 460.000 | 0,00 | 2.295 | -17,12 | |||
| 2026-02-17 | 13F | Millennium Management Llc | Call | 646.784 | -8,26 | 2.937 | -24,75 | |||
| 2026-01-30 | 13F | Mitsubishi UFJ Trust & Banking Corp | 1.705.433 | 12,98 | 8.510 | -6,35 | ||||
| 2026-02-13 | 13F | Smartleaf Asset Management LLC | 16.198 | 2,28 | 82 | -14,58 | ||||
| 2026-02-17 | 13F | Atom Investors LP | 14.095 | 70 | ||||||
| 2026-04-15 | 13F | FNY Investment Advisers, LLC | Call | 0 | -100,00 | 0 | ||||
| 2026-02-17 | 13F | Artisan Partners Limited Partnership | 27.977.786 | 5,03 | 139.609 | -12,94 | ||||
| 2026-02-11 | 13F | Contrarius Group Holdings Ltd | 0 | -100,00 | 0 | -100,00 | ||||
| 2026-02-12 | 13F | Mount Yale Investment Advisors, LLC | 0 | -100,00 | 0 | -100,00 | ||||
| 2026-02-13 | 13F | Toyota Motor Corp/ | 222.906.079 | 0,00 | 1.112.301 | -17,11 | ||||
| 2026-01-29 | 13F | Sanctuary Advisors, LLC | 26.191 | -0,78 | 131 | -17,72 | ||||
| 2026-04-28 | 13F | GM Advisory Group, Inc. | 0 | -100,00 | 0 | -100,00 | ||||
| 2026-01-22 | 13F | Fiduciary Alliance LLC | Call | 0 | -100,00 | 0 | -100,00 | |||
| 2026-02-05 | 13F | Allworth Financial LP | 10.057 | 24,39 | 50 | 4,17 | ||||
| 2026-02-09 | 13F | Genus Capital Management Inc. | 96.286 | -3,99 | 480 | -20,40 | ||||
| 2026-02-17 | 13F | MIRAE ASSET GLOBAL ETFS HOLDINGS Ltd. | 20.825 | 14,59 | 104 | -5,50 | ||||
| 2026-02-12 | 13F | Principal Securities, Inc. | 0 | -100,00 | 0 | -100,00 | ||||
| 2026-02-17 | 13F | Janus Henderson Group Plc | 615.398 | -0,63 | 3.068 | -17,66 | ||||
| 2026-02-09 | 13F | Mediolanum International Funds Ltd | 2.050.681 | 20,79 | 10.397 | 0,22 | ||||
| 2026-02-17 | 13F | Nomura Holdings Inc | Call | 700.000 | 0,00 | 3.493 | -17,11 | |||
| 2026-02-06 | 13F | EverSource Wealth Advisors, LLC | 15.300 | 12,79 | 76 | -6,17 | ||||
| 2026-04-10 | 13F | Quaker Wealth Management, LLC | 2.000 | -33,33 | 7 | -50,00 | ||||
| 2026-02-17 | 13F | PointState Capital LP | 32.555.483 | 411,14 | 162.452 | 323,69 | ||||
| 2026-04-30 | 13F | Kestra Advisory Services, LLC | 0 | -100,00 | 0 | |||||
| 2026-02-10 | 13F | Td Asset Management Inc | 891.800 | 2,20 | 4.450 | -15,29 | ||||
| 2026-04-27 | 13F | Leonteq Securities AG | 15.146 | 0,00 | 55 | -26,67 | ||||
| 2026-02-11 | 13F | O'shaughnessy Asset Management, Llc | 25.018 | 17,38 | 125 | -3,12 | ||||
| 2026-02-13 | 13F | Capula Management Ltd | 115.614 | 155,31 | 577 | 111,76 | ||||
| 2026-02-17 | 13F | Graham Capital Management, L.P. | 24.234 | 121 | ||||||
| 2026-01-27 | 13F | TD Waterhouse Canada Inc. | 134.142 | 108,69 | 668 | 76,72 | ||||
| 2026-02-13 | 13F | Capula Management Ltd | Put | 250.000 | 0,00 | 1.248 | -17,14 | |||
| 2026-02-13 | 13F | Aspex Management (HK) Ltd | 55.864.875 | 96,81 | 279 | 63,53 | ||||
| 2026-02-17 | 13F | Ancora Advisors, LLC | 0 | -100,00 | 0 | |||||
| 2025-11-14 | 13F | Texas Permanent School Fund | 0 | -100,00 | 0 | -100,00 | ||||
| 2026-02-13 | 13F | DLD Asset Management, LP | Put | 1.215.000 | 62,00 | 6.057 | 34,25 | |||
| 2026-02-13 | 13F | Integrated Wealth Concepts LLC | 0 | -100,00 | 0 | |||||
| 2026-01-23 | 13F | Cambiar Investors Llc | 3.748.271 | -3,57 | 18.704 | -20,07 | ||||
| 2026-02-17 | 13F | Unisphere Establishment | 3.955.331 | 0,00 | 19.737 | -17,11 | ||||
| 2026-04-28 | 13F | Shelton Wealth Management, Llc | 0 | -100,00 | 0 | -100,00 | ||||
| 2026-02-13 | 13F | Walleye Capital LLC | Put | 533.900 | 134,17 | 2.664 | 94,17 | |||
| 2026-04-21 | 13F | PDS Planning, Inc | 16.194 | -33,64 | 59 | -51,24 | ||||
| 2026-04-28 | 13F | Shelton Wealth Management, Llc | Call | 0 | -100,00 | 0 | -100,00 | |||
| 2026-02-18 | 13F/A | Empowered Funds, LLC | 55.978 | -2,71 | 279 | -19,36 | ||||
| 2026-02-06 | 13F | Addison Advisors LLC | 327 | 0,00 | 2 | 0,00 | ||||
| 2026-02-13 | 13F | Walleye Capital LLC | 3.709.271 | 733,51 | 18.509 | 591,15 | ||||
| 2026-02-13 | 13F | Walleye Capital LLC | Call | 144.500 | 68,81 | 721 | 40,00 | |||
| 2026-02-17 | 13F | Quantinno Capital Management LP | 601.023 | 35,11 | 2.999 | 12,03 | ||||
| 2026-04-14 | 13F | Baldwin Brothers Inc/ma | 0 | -100,00 | 0 | -100,00 | ||||
| 2026-04-20 | 13F | Meyer Handelman Co | 24.952 | 91 | ||||||
| 2026-02-17 | 13F | State Of Wisconsin Investment Board | 930.400 | -4,34 | 4.643 | -20,72 | ||||
| 2026-04-27 | 13F | Ethic Inc. | 468.336 | -21,60 | 1.714 | -42,48 | ||||
| 2026-04-07 | 13F | Signaturefd, Llc | 17.479 | 169,78 | 64 | 96,88 | ||||
| 2026-02-11 | 13F | Los Angeles Capital Management Llc | 105.405 | -78,74 | 630 | -78,89 | ||||
| 2026-04-30 | 13F | Teacher Retirement System Of Texas | 1.412.337 | -5,71 | 5.169 | -30,84 | ||||
| 2026-02-13 | 13F | Inspire Advisors, LLC | 71.881 | 359 | ||||||
| 2026-02-17 | 13F | Stansberry Asset Management, Llc | 86.577 | 0,00 | 432 | -17,08 | ||||
| 2026-04-24 | 13F | Deltec Asset Management Llc | 105.000 | 0,00 | 384 | -26,58 | ||||
| 2026-01-27 | 13F | Fortis Capital Advisors, LLC | 0 | -100,00 | 0 | -100,00 | ||||
| 2025-11-14 | 13F | Point72 Europe (London) LLP | 18.738 | 113 | ||||||
| 2026-02-13 | 13F | Pathstone Holdings, LLC | 69.893 | 9,71 | 349 | -9,14 | ||||
| 2026-01-20 | 13F | Cigna Investments Inc /new | 42.426 | 0,00 | 0 | |||||
| 2026-02-13 | 13F | Centiva Capital, LP | 46.839 | -54,47 | 234 | -62,36 | ||||
| 2026-02-10 | 13F | State of Wyoming | 292 | 135,48 | 1 | |||||
| 2026-02-12 | 13F | Andra AP-fonden | 897.900 | 99,05 | 4.481 | 65,01 | ||||
| 2026-04-27 | 13F | Td Private Client Wealth Llc | 132 | 80,82 | 0 | |||||
| 2026-01-28 | 13F | DekaBank Deutsche Girozentrale | 274.058 | 0,00 | 1 | 0,00 | ||||
| 2026-02-03 | 13F | Alpha Cubed Investments, LLC | 23.316 | 0,00 | 116 | -17,14 | ||||
| 2026-02-11 | 13F | Dorsey & Whitney Trust CO LLC | 22.419 | 11,39 | 112 | -8,26 | ||||
| 2026-02-13 | 13F | Blueshift Asset Management, LLC | 110.667 | 54,55 | 552 | 28,07 | ||||
| 2026-02-17 | 13F | Lombard Odier Asset Management (Switzerland) SA | 91.333 | -14,36 | 456 | -29,13 | ||||
| 2026-02-17 | 13F | Voloridge Investment Management, Llc | 27.198 | -96,79 | 136 | -97,35 | ||||
| 2025-11-06 | 13F | Wedbush Securities Inc | 0 | -100,00 | 0 | |||||
| 2026-02-17 | 13F/A | Kovack Advisors, Inc. | 30.795 | -49,07 | 154 | -57,97 | ||||
| 2026-02-17 | 13F | Schonfeld Strategic Advisors LLC | 607.281 | 174,38 | 3.030 | 127,48 | ||||
| 2025-11-07 | 13F | Shell Asset Management Co | 46.250 | -7,06 | 0 | |||||
| 2026-01-22 | 13F | Bartlett & Co. Wealth Management Llc | 0 | -100,00 | 0 | -100,00 | ||||
| 2026-04-30 | 13F | Sequoia Financial Advisors, LLC | 151.710 | 117,32 | 555 | 59,48 | ||||
| 2026-02-12 | 13F | Dimensional Fund Advisors Lp | 305.518 | 1,44 | 1.525 | -15,94 | ||||
| 2026-02-13 | 13F | Bank Of Nova Scotia | 0 | -100,00 | 0 | |||||
| 2026-02-17 | 13F | Balyasny Asset Management Llc | 7.648.631 | 294,54 | 38.167 | 227,04 | ||||
| 2026-02-17 | 13F | Keebeck Alpha, LP | 0 | -100,00 | 0 | -100,00 | ||||
| 2026-02-17 | 13F | RMB Capital Management, LLC | 13.075 | 2,58 | 65 | -14,47 | ||||
| 2026-02-27 | 13F/A | Barclays Plc | Call | 0 | -100,00 | 0 | -100,00 | |||
| 2026-04-28 | 13F | Golden State Wealth Management, LLC | 22.000 | 0,00 | 81 | -26,61 | ||||
| 2026-04-13 | 13F | Leibman Financial Services, Inc. | 506.025 | 33,01 | 1.852 | -2,42 | ||||
| 2026-02-17 | 13F | Scarborough Advisors, LLC | 795 | -56,00 | 4 | -70,00 | ||||
| 2026-02-11 | 13F | Deutsche Bank Ag\ | 7.545.851 | 10,85 | 37.654 | -8,11 | ||||
| 2026-02-12 | 13F | Groupe la Francaise | 489.186 | 108,92 | 2.440 | 73,22 | ||||
| 2026-02-17 | 13F | London & Capital Asset Management Ltd | 948.000 | 4.726 | ||||||
| 2026-02-13 | 13F | Rhumbline Advisers | 519.165 | -6,20 | 2.591 | -22,27 | ||||
| 2026-02-10 | 13F | Savant Capital, LLC | 0 | -100,00 | 0 | |||||
| 2026-02-11 | 13F | Lyell Wealth Management, Lp | 45.500 | 0,00 | 227 | -16,85 | ||||
| 2026-02-17 | 13F | Moore Capital Management, Lp | 2.432.113 | 239,32 | 12.136 | 181,32 | ||||
| 2026-02-17 | 13F | Alliancebernstein L.p. | 413.780 | -3,84 | 2.065 | -20,31 | ||||
| 2025-11-14 | 13F | Bayesian Capital Management, LP | 0 | -100,00 | 0 | -100,00 | ||||
| 2026-02-10 | 13F | National Pension Service | 148.270 | 740 | ||||||
| 2026-02-13 | 13F | Ubs Asset Management Americas Inc | 16.720.421 | 10,34 | 83.435 | -8,54 | ||||
| 2025-11-06 | 13F | Aspect Partners, LLC | 0 | -100,00 | 0 | |||||
| 2026-02-17 | 13F | Sona Asset Management (us) Llc | 0 | -100,00 | 0 | |||||
| 2026-05-01 | 13F | New Republic Capital, LLC | 0 | -100,00 | 0 | -100,00 | ||||
| 2026-01-29 | 13F | James Investment Research Inc | 0 | -100,00 | 0 | |||||
| 2026-04-29 | 13F | American Capital Advisory, LLC | 412 | 2 | ||||||
| 2026-02-11 | 13F | Gordian Capital Singapore Pte Ltd | 4.500 | -76,92 | 22 | -81,20 | ||||
| 2026-01-21 | 13F/A | Euro Pacific Asset Management, LLC | 377.745 | -0,53 | 2 | -50,00 | ||||
| 2026-04-28 | 13F | Handelsbanken Fonder AB | 1.263.448 | -4,11 | 5 | -33,33 | ||||
| 2026-02-11 | 13F | LPL Financial LLC | Call | 0 | -100,00 | 0 | -100,00 | |||
| 2026-02-10 | 13F | Parametrica Management Ltd | 480.000 | 60,00 | 2.395 | 32,61 | ||||
| 2026-02-11 | 13F | Lyrical Asset Management Lp | 755.474 | 3.770 | ||||||
| 2026-04-30 | 13F | Channing Global Advisors, Llc | 294 | 0,00 | 1 | 0,00 | ||||
| 2025-12-03 | 13F | Strategic Investment Solutions, Inc. /IL | 0 | -100,00 | 0 | |||||
| 2026-02-10 | 13F/A | Northwestern Mutual Wealth Management Co | 51.901 | 68,56 | 259 | 39,46 | ||||
| 2026-02-09 | 13F | Legal & General Group Plc | 14.521.528 | -8,83 | 72.462 | -24,43 | ||||
| 2026-02-13 | 13F | L2 Asset Management, LLC | 16.603 | 7,15 | 83 | -11,83 | ||||
| 2026-02-19 | 13F | Atomi Financial Group, Inc. | 15.303 | 0,18 | 76 | -16,48 | ||||
| 2026-02-19 | 13F | Atomi Financial Group, Inc. | Call | 150.000 | 0,00 | 748 | -17,17 | |||
| 2026-02-17 | 13F | MIC Capital Management UK LLP | 5.000.000 | 0,00 | 24.950 | -17,11 | ||||
| 2026-04-29 | 13F | Frank, Rimerman Advisors LLC | 39.366 | 144 | ||||||
| 2026-02-06 | 13F | HighTower Advisors, LLC | 75.030 | -17,49 | 374 | -31,63 | ||||
| 2026-04-21 | 13F | PharVision Advisers, LLC | 0 | -100,00 | 0 | |||||
| 2025-11-04 | 13F | Twenty Acre Capital LP | 0 | -100,00 | 0 | -100,00 | ||||
| 2026-02-13 | 13F | Sculptor Capital LP | Put | 1.184.100 | 0,71 | 5.909 | -16,52 | |||
| 2025-11-14 | 13F | Cubist Systematic Strategies, LLC | 5.355.582 | 236,63 | 32.241 | 302,90 | ||||
| 2026-01-27 | 13F | Journey Advisory Group, LLC | 12.000 | 0,00 | 60 | -18,06 | ||||
| 2026-02-17 | 13F | Driehaus Capital Management Llc | 11.003.892 | 42,90 | 54.909 | 18,45 | ||||
| 2026-02-11 | 13F | Mandatum Life Insurance Co Ltd | 46.719 | 211,46 | 233 | 158,89 | ||||
| 2026-04-13 | 13F | IFP Advisors, Inc | 74.075 | 4,57 | 271 | -23,23 | ||||
| 2026-02-09 | 13F | Jefferies Financial Group Inc. | Call | 0 | -100,00 | 0 | -100,00 | |||
| 2026-02-13 | 13F | Flow Traders U.s. Llc | 23.846 | 0 | ||||||
| 2026-02-13 | 13F | Citigroup Inc | 26.011.733 | -19,71 | 129.799 | -33,45 |
Other Listings
| US:GRAB | 3,67 $ |