Grundlæggende statistik
| Institutionelle aktier (lange) | 185.603.713 - 67,14% (ex 13D/G) - change of -15,02MM shares -7,48% MRQ |
| Institutionel værdi (lang) | $ 10.410.645 USD ($1000) |
Institutionelt ejerskab og aktionærer
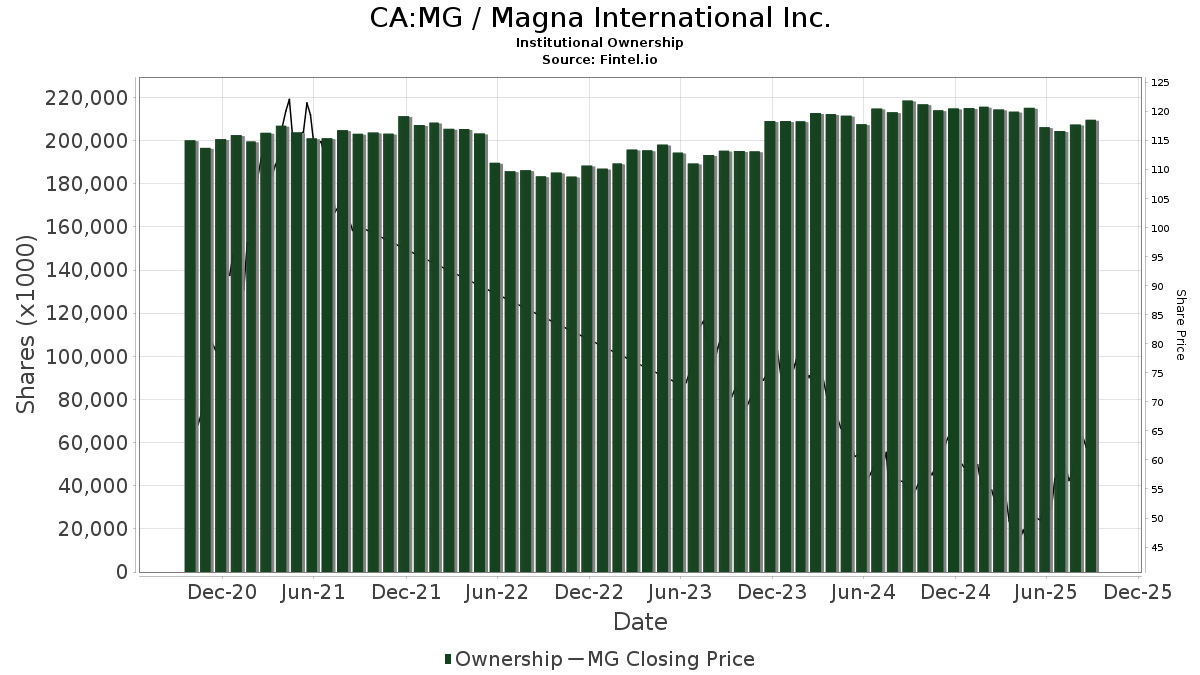
Magna International Inc. (CA:MG) har 443 institutionelle ejere og aktionærer, der har indsendt 13D/G- eller 13F-formularer til Securities Exchange Commission (SEC). Disse institutioner har i alt 185,603,713 aktier. Største aktionærer omfatter Pzena Investment Management Llc, Vanguard Group Inc, Royal Bank Of Canada, Hotchkis & Wiley Capital Management Llc, FIL Ltd, CIBC World Markets Inc., ACR Alpine Capital Research, LLC, Bank Of Montreal /can/, Td Asset Management Inc, and Arrowstreet Capital, Limited Partnership .
Magna International Inc. (TSX:MG) institutionel ejerskabsstruktur viser aktuelle positioner i virksomheden efter institutioner og fonde, samt seneste ændringer i positionsstørrelse. Større aktionærer kan omfatte individuelle investorer, investeringsforeninger, hedgefonde eller institutioner. Skema 13D angiver, at investoren besidder (eller besidder) mere end 5 % af virksomheden og har til hensigt (eller har til hensigt at) aktivt at forfølge en ændring i forretningsstrategi. Skema 13G indikerer en passiv investering på over 5%.
The share price as of April 24, 2026 is 85,96 / share. Previously, on April 28, 2025, the share price was 47,38 / share. This represents an increase of 81,43% over that period.
Fondens stemningsscore
Fund Sentiment Score (fka Ownership Accumulation Score) finder de aktier, der bliver mest købt af fonde. Det er resultatet af en sofistikeret, multi-faktor kvantitativ model, der identificerer virksomheder med de højeste niveauer af institutionel akkumulering. Scoringsmodellen bruger en kombination af den samlede stigning i oplyste ejere, ændringerne i porteføljeallokeringer i disse ejere og andre målinger. Tallet går fra 0 til 100, hvor højere tal indikerer et højere niveau af akkumulering for sine jævnaldrende, og 50 er gennemsnittet.
Opdateringsfrekvens: Dagligt
Se Ownership Explorer, som giver en liste over højest rangerende virksomheder.
AI+ Ask Fintel’s AI assistant about Magna International Inc..
Select a question to share a public post with an AI-crafted answer.
Thinking of good questions…
13F og NPORT arkivering
Detaljer om 13F-arkivering er gratis. Detaljer om NP-ansøgninger kræver et premium-medlemskab. Grønne rækker angiver nye positioner. Røde rækker angiver lukkede positioner. Klik på linket ikon for at se den fulde transaktionshistorik.
Opgrader
for at låse premium-data op og eksportere til Excel ![]() .
.
| Fil dato | Kilde | Investor | Type | Gennemsnitlig pris (Øst) |
Aktier | Δ Aktier (%) |
Rapporteret Værdi ($1000) |
Δ Værdi (%) |
Port Alloc (%) |
|
|---|---|---|---|---|---|---|---|---|---|---|
| 2025-11-14 | 13F | Wetherby Asset Management Inc | 6.715 | 0,40 | 318 | 23,26 | ||||
| 2026-02-12 | 13F | Bank Of Montreal /can/ | Put | 0 | -100,00 | 0 | -100,00 | |||
| 2026-04-24 | 13F | Triasima Portfolio Management inc. | 106.440 | 3,60 | 5.925 | 8,04 | ||||
| 2026-02-17 | 13F | Summit Global Investments | 50.081 | 3 | ||||||
| 2025-11-07 | 13F | Atticus Wealth Management, Llc | 0 | -100,00 | 0 | -100,00 | ||||
| 2026-04-24 | 13F | Bayban | 367 | 20 | ||||||
| 2026-02-11 | 13F | Prudential Plc | 4.128 | -84,84 | 220 | -82,93 | ||||
| 2026-02-17 | 13F | Warren Averett Asset Management, LLC | 6.760 | 3,92 | 360 | 16,88 | ||||
| 2026-01-23 | 13F | Reuter James Wealth Management, Llc | 4.821 | 0,00 | 257 | 12,28 | ||||
| 2026-02-17 | 13F | Susquehanna International Group, Llp | Put | 59.200 | -59,23 | 3.155 | -54,14 | |||
| 2026-02-10 | 13F | Godfrey Financial Associates, Inc. | 16 | 1 | ||||||
| 2026-02-17 | 13F | Susquehanna International Group, Llp | Call | 193.400 | -15,21 | 10.308 | -4,62 | |||
| 2026-02-17 | 13F | Sig Brokerage, Lp | 6.926 | 369 | ||||||
| 2026-02-13 | 13F | Candriam Luxembourg S.C.A. | 275.637 | 11,87 | 14.714 | 26,01 | ||||
| 2026-01-23 | 13F | Rsm Us Wealth Management Llc | 4.775 | 2,31 | 256 | 15,84 | ||||
| 2026-02-12 | 13F | Federated Hermes, Inc. | 81.132 | -1,57 | 4.324 | 10,73 | ||||
| 2026-02-17 | 13F | Agf Management Ltd | 361.836 | 20,80 | 19.287 | 35,91 | ||||
| 2026-04-16 | 13F | Baron Wealth Management LLC | 8.341 | 26,92 | 466 | 32,86 | ||||
| 2026-02-17 | 13F | Royal Bank Of Canada | Put | 0 | -100,00 | 0 | ||||
| 2026-02-05 | 13F | Bessemer Group Inc | 58 | 0 | ||||||
| 2026-02-17 | 13F | Brevan Howard Capital Management LP | 0 | -100,00 | 0 | |||||
| 2026-02-17 | 13F | Royal Bank Of Canada | Call | 0 | -100,00 | 0 | ||||
| 2026-04-15 | 13F | Addenda Capital Inc. | 163.585 | 0,00 | 12.709 | 6,17 | ||||
| 2026-02-06 | 13F | Global Retirement Partners, LLC | 1.469 | 195,57 | 78 | 239,13 | ||||
| 2026-01-23 | 13F | Assetmark, Inc | 5 | 400,00 | 0 | |||||
| 2026-02-06 | 13F | Larson Financial Group LLC | 18 | -35,71 | 1 | -100,00 | ||||
| 2026-02-13 | 13F | Gen-Wealth Partners Inc | 301 | 0,00 | 16 | 14,29 | ||||
| 2025-11-12 | 13F | Simplex Trading, Llc | 0 | -100,00 | 0 | -100,00 | ||||
| 2026-02-11 | 13F | Franklin Resources Inc | 82.516 | 5,17 | 4.399 | 18,35 | ||||
| 2025-11-14 | 13F | Summit Street Capital Management, LLC | 0 | -100,00 | 0 | |||||
| 2026-02-02 | 13F | Cornerstone Planning Group LLC | 7 | 0,00 | 0 | |||||
| 2026-02-12 | 13F | Skandinaviska Enskilda Banken AB (publ) | 1.076.820 | 106,50 | 57.395 | 132,30 | ||||
| 2026-02-17 | 13F | Advisor Group Holdings, Inc. | 19.477 | -12,89 | 1.038 | 0,48 | ||||
| 2026-01-29 | 13F | Argyle Capital Management Inc. | 12.600 | 0,00 | 672 | 12,58 | ||||
| 2026-02-05 | 13F | ACR Alpine Capital Research, LLC | 6.006.268 | -1,15 | 320.134 | 11,20 | ||||
| 2026-02-11 | 13F | Ing Groep Nv | 9.790 | 524 | ||||||
| 2026-02-13 | 13F | Mariner, LLC | 215.754 | 0,34 | 11.500 | 12,89 | ||||
| 2025-10-31 | 13F | Y-Intercept (Hong Kong) Ltd | 0 | -100,00 | 0 | -100,00 | ||||
| 2025-11-07 | 13F | Ontario Teachers Pension Plan Board | 0 | -100,00 | 0 | -100,00 | ||||
| 2026-02-17 | 13F | Nomura Holdings Inc | 72.881 | -16,10 | 3.885 | -5,61 | ||||
| 2026-02-11 | 13F | Capital Analysts, Inc. | 137 | -41,45 | 0 | |||||
| 2026-02-17 | 13F | Nomura Holdings Inc | Call | 171.500 | 14,33 | 9.141 | 28,61 | |||
| 2026-02-17 | 13F | SIG North Trading, ULC | Put | 108.200 | 85,27 | 5.767 | 108,50 | |||
| 2026-03-06 | 13F | Hsbc Holdings Plc | 0 | -100,00 | 0 | |||||
| 2026-02-17 | 13F | SIG North Trading, ULC | Call | 215.400 | -11,43 | 11.481 | -0,36 | |||
| 2026-01-29 | 13F | UBS Group AG | 885.200 | 38,40 | 47.181 | 55,70 | ||||
| 2026-01-20 | 13F | Ascent Group, LLC | 4.741 | 253 | ||||||
| 2026-04-17 | 13F | IFC & Insurance Marketing, Inc. | 0 | -100,00 | 0 | |||||
| 2026-02-17 | 13F | SIG North Trading, ULC | 7.696 | 410 | ||||||
| 2026-02-17 | 13F | Fmr Llc | 481.900 | -1,09 | 25.690 | 11,28 | ||||
| 2025-11-14 | 13F | Gluskin Sheff & Assoc Inc | 0 | -100,00 | 0 | -100,00 | ||||
| 2026-01-26 | 13F | Ckw Financial Group | 1.496 | 0,40 | 0 | |||||
| 2026-02-13 | 13F | National Bank Of Canada /fi/ | 2.727.814 | 7,68 | 145.139 | 21,43 | ||||
| 2026-02-13 | 13F | Aviso Financial Inc. | 0 | -100,00 | 0 | |||||
| 2026-04-14 | 13F | Twelve Points Wealth Management LLC | 16.233 | -6,70 | 906 | -7,37 | ||||
| 2026-02-17 | 13F | Wiley Bros.-aintree Capital, Llc | 46.489 | 74,42 | 2.478 | 96,28 | ||||
| 2026-02-13 | 13F | State Street Corp | 45.012 | -20,02 | 2.399 | -10,02 | ||||
| 2026-02-10 | 13F | Nomura Asset Management Co Ltd | 0 | 0 | ||||||
| 2026-04-13 | 13F | True Wealth Design, LLC | 278 | 129,75 | 16 | 150,00 | ||||
| 2026-02-17 | 13F | Bank Of America Corp /de/ | 2.228.302 | 22,09 | 118.769 | 37,35 | ||||
| 2026-02-05 | 13F | RiverFront Investment Group, LLC | 5.508 | 0,00 | 294 | 12,69 | ||||
| 2026-01-14 | 13F | ORG Wealth Partners, LLC | 20 | 1 | ||||||
| 2026-02-10 | 13F | Connor, Clark & Lunn Investment Management Ltd. | 1.918.616 | -6,02 | 102.283 | 5,76 | ||||
| 2026-02-17 | 13F | Wellington Management Group Llp | 321.499 | -5,96 | 17.161 | 5,93 | ||||
| 2026-02-06 | 13F | Gsa Capital Partners Llp | 0 | -100,00 | 0 | |||||
| 2026-02-13 | 13F | Aigen Investment Management, Lp | 0 | -100,00 | 0 | -100,00 | ||||
| 2026-02-13 | 13F | Sei Investments Co | 122.606 | 159,89 | 6.536 | 192,52 | ||||
| 2025-11-14 | 13F | Mount Yale Investment Advisors, LLC | 0 | -100,00 | 0 | |||||
| 2026-02-17 | 13F | State Of Wisconsin Investment Board | 93.812 | 5.008 | ||||||
| 2026-01-27 | 13F | WealthCollab, LLC | 535 | 0,00 | 29 | 12,00 | ||||
| 2026-02-09 | 13F | Integrity Alliance, Llc. | 6.432 | 21,52 | 343 | 36,80 | ||||
| 2026-02-17 | 13F | Northern Trust Corp | 267.775 | -0,62 | 14.272 | 11,80 | ||||
| 2025-12-16 | 13F | Emergent Wealth Advisors, LLC | 0 | -100,00 | 0 | -100,00 | ||||
| 2026-02-04 | 13F | Asahi Life Asset Management Co., Ltd. | 4.079 | -49,75 | 218 | -43,49 | ||||
| 2026-02-05 | 13F | Atria Investments Llc | 208.114 | -0,67 | 11.092 | 11,74 | ||||
| 2026-02-13 | 13F | Barclays Plc | 288.602 | 3,56 | 15.382 | 16,50 | ||||
| 2026-02-10 | 13F | KERR FINANCIAL PLANNING Corp | 200 | 10 | ||||||
| 2026-01-29 | 13F | Camelot Portfolios, LLC | 3.210 | 171 | ||||||
| 2026-03-02 | 13F | Tobam | 0 | -100,00 | 0 | |||||
| 2026-02-13 | 13F | Palisade Asset Management, LLC | 0 | -100,00 | 0 | |||||
| 2026-01-20 | 13F | Cromwell Holdings LLC | 771 | 0,00 | 41 | 13,89 | ||||
| 2026-01-27 | 13F | Jackson, Grant Investment Advisers, Inc. | 167 | 0,00 | 9 | 14,29 | ||||
| 2026-02-12 | 13F | Commonwealth Equity Services, Llc | 9.020 | -10,45 | 481 | |||||
| 2026-02-17 | 13F | Lighthouse Investment Partners, LLC | 17.882 | 953 | ||||||
| 2026-02-17 | 13F | Schonfeld Strategic Advisors LLC | 66.838 | 384,33 | 3.562 | 445,48 | ||||
| 2026-02-17 | 13F | Fairscale Capital, LLC | 146 | 8 | ||||||
| 2026-04-20 | 13F | CWA Asset Management Group, LLC | 134.371 | 1,94 | 7.499 | 6,75 | ||||
| 2025-10-31 | 13F | Lorne Steinberg Wealth Management Inc. | 0 | -100,00 | 0 | |||||
| 2026-04-24 | 13F | Root Financial Partners, LLC | 20 | 100,00 | 1 | |||||
| 2026-02-13 | 13F | Manufacturers Life Insurance Company, The | 0 | -100,00 | 0 | |||||
| 2026-04-13 | 13F | Massmutual Trust Co Fsb/adv | 855 | 0,94 | 48 | 4,44 | ||||
| 2026-01-27 | 13F | Silphium Asset Management Ltd | 16.700 | 890 | ||||||
| 2025-12-09 | 13F/A | Tudor Investment Corp Et Al | Put | 5.400 | -56,80 | 256 | -47,10 | |||
| 2026-02-10 | 13F | Holderness Investments Co | 3.754 | 200 | ||||||
| 2025-12-09 | 13F/A | Tudor Investment Corp Et Al | Call | 8.500 | -77,33 | 403 | -72,22 | |||
| 2026-01-30 | 13F | Mitsubishi UFJ Trust & Banking Corp | 57.500 | -77,62 | 3.029 | -75,12 | ||||
| 2026-02-13 | 13F | Pinnacle Wealth Planning Services, Inc. | 74 | 4 | ||||||
| 2026-02-10 | 13F | Td Asset Management Inc | 4.753.403 | -7,33 | 253.734 | 4,38 | ||||
| 2026-01-09 | 13F | 180 Wealth Advisors, Llc | 0 | -100,00 | 0 | |||||
| 2026-02-06 | 13F | Harvest Portfolios Group Inc. | 58.414 | -6,86 | 3.114 | 4,81 | ||||
| 2026-01-28 | 13F | Turtle Creek Wealth Advisors, LLC | 9.528 | 0,00 | 508 | 12,42 | ||||
| 2026-02-13 | 13F | Prudential Financial Inc | 23.025 | 1.229 | ||||||
| 2025-11-14 | 13F | Price T Rowe Associates Inc /md/ | 0 | -100,00 | 0 | -100,00 | ||||
| 2026-04-17 | 13F | Kennebec Savings Bank | 567 | 3,66 | 32 | 6,90 | ||||
| 2026-04-10 | 13F/A | PBU - The Pension Fund of Early Childhood & Youth Educators | 166.029 | -19,42 | 9.243 | -15,97 | ||||
| 2026-04-15 | 13F | Bayforest Capital Ltd | 2.266 | -30,81 | 126 | -27,59 | ||||
| 2026-01-27 | 13F | Zurcher Kantonalbank (Zurich Cantonalbank) | 65.830 | -38,01 | 3.514 | -30,19 | ||||
| 2025-11-21 | 13F | Nebula Research & Development LLC | 0 | -100,00 | 0 | |||||
| 2026-04-21 | 13F | Value Partners Investments Inc. | 18.514 | -98,29 | 1.032 | -98,22 | ||||
| 2026-02-17 | 13F/A | Northwest & Ethical Investments L.P. | 433.643 | -2,79 | 23.124 | 9,39 | ||||
| 2026-02-12 | 13F | Renaissance Technologies Llc | 300.284 | -61,03 | 16.005 | -56,16 | ||||
| 2026-02-04 | 13F | Community Bank, N.A. | 602 | 0,00 | 32 | 14,29 | ||||
| 2026-02-17 | 13F | Susquehanna International Group, Llp | 0 | -100,00 | 0 | |||||
| 2026-01-21 | 13F | Edmp, Inc. | 21.243 | 1,62 | 1.132 | 14,34 | ||||
| 2026-02-17 | 13F | Point72 Asset Management, L.P. | 109.413 | -94,09 | 5.832 | -93,35 | ||||
| 2025-10-30 | 13F | Traub Capital Management LLC | 0 | -100,00 | 0 | -100,00 | ||||
| 2026-02-11 | 13F | Brandywine Global Investment Management, LLC | 982.886 | -0,70 | 52.398 | 11,76 | ||||
| 2026-02-17 | 13F | Aqr Capital Management Llc | 1.662.407 | 9.533,79 | 88.624 | 10.747,37 | ||||
| 2026-02-02 | 13F | Chung Wu Investment Group, LLC | 40 | 0,00 | 2 | 100,00 | ||||
| 2026-02-12 | 13F | Swiss National Bank | 709.600 | -7,88 | 37.906 | 3,81 | ||||
| 2026-01-28 | 13F | DekaBank Deutsche Girozentrale | 98.577 | 0,00 | 5 | 25,00 | ||||
| 2026-02-02 | 13F | Fifth Third Bancorp | 301 | 4,51 | 16 | 23,08 | ||||
| 2026-02-11 | 13F | Twin Tree Management, LP | 35.377 | -72,50 | 1.886 | -69,07 | ||||
| 2026-01-15 | 13F | Nisa Investment Advisors, Llc | 14 | 1 | ||||||
| 2025-11-06 | 13F | Versor Investments LP | 0 | -100,00 | 0 | -100,00 | ||||
| 2026-02-11 | 13F | Twin Tree Management, LP | Call | 17.700 | 555,56 | 943 | 642,52 | |||
| 2026-02-11 | 13F | Twin Tree Management, LP | Put | 71.700 | -26,23 | 3.822 | -17,02 | |||
| 2025-10-29 | 13F | JCIC Asset Management Inc. | 0 | -100,00 | 0 | |||||
| 2026-02-13 | 13F | Ieq Capital, Llc | 21.116 | 2,80 | 1.125 | 15,62 | ||||
| 2026-02-17 | 13F | Advisory Services Network, LLC | 0 | -100,00 | 0 | |||||
| 2026-04-23 | 13F | Oppenheimer & Co Inc | 8.811 | 12,41 | 492 | 17,75 | ||||
| 2026-02-09 | 13F | Systematic Financial Management Lp | 68.300 | 39,64 | 3.640 | 57,10 | ||||
| 2026-02-18 | 13F | Beacon Pointe Advisors, LLC | 4.499 | 240 | ||||||
| 2026-01-22 | 13F | Massachusetts Financial Services Co /ma/ | 10.818 | -1,92 | 577 | 10,34 | ||||
| 2026-02-13 | 13F | 1832 Asset Management L.P. | 47.208 | 65,13 | 2.516 | 85,82 | ||||
| 2026-02-13 | 13F | Verition Fund Management LLC | 0 | -100,00 | 0 | -100,00 | ||||
| 2026-04-10 | 13F | Armstrong Advisory Group, Inc | 912 | 55,10 | 51 | 61,29 | ||||
| 2026-02-13 | 13F | Icon Advisers Inc/co | 50.403 | -2,05 | 2.686 | 10,17 | ||||
| 2026-02-17 | 13F | Maryland State Retirement & Pension System | 85.879 | 4,25 | 4.580 | 17,38 | ||||
| 2026-02-10 | 13F | Envestnet Asset Management Inc | 995.040 | -29,78 | 53.036 | -21,01 | ||||
| 2026-02-06 | 13F | Bare Financial Services, Inc | 9 | 0,00 | 0 | |||||
| 2026-02-13 | 13F | JustInvest LLC | 29.850 | 6,34 | 1.591 | 19,62 | ||||
| 2026-03-26 | 13F | Leonteq Securities AG | Call | 0 | -100,00 | 0 | ||||
| 2026-02-06 | 13F | Cullen/frost Bankers, Inc. | 59 | 3 | ||||||
| 2026-02-17 | 13F | Edmond De Rothschild Holding S.a. | 360 | 0,00 | 19 | 11,76 | ||||
| 2026-02-17 | 13F | Scientech Research LLC | 4.871 | 260 | ||||||
| 2026-02-10 | 13F | CIBC World Markets Inc. | 6.061.910 | 18,29 | 323.221 | 33,14 | ||||
| 2026-01-30 | 13F | ARGA Investment Management, LP | 4.193.129 | 1,08 | 223.512 | 13,71 | ||||
| 2026-02-10 | 13F | Basepoint Wealth LLC | 224 | 12 | ||||||
| 2026-02-12 | 13F | Portland Investment Counsel Inc. | 0 | -100,00 | 0 | |||||
| 2026-02-13 | 13F | First Trust Advisors Lp | 166.967 | 18,27 | 8.900 | 33,07 | ||||
| 2026-02-17 | 13F | Worldquant Millennium Advisors Llc | 16.728 | 16,96 | 892 | 31,76 | ||||
| 2026-02-09 | 13F | Todd Asset Management Llc | 9.307 | 7,92 | 496 | 21,57 | ||||
| 2026-02-17 | 13F | Lazard Asset Management Llc | 1.183.042 | 128,76 | 63.069 | 157,45 | ||||
| 2026-02-17 | 13F | Quantinno Capital Management LP | 88.250 | 32,06 | 4.704 | 48,55 | ||||
| 2026-02-18 | 13F | State of Tennessee, Treasury Department | 157.482 | 0,60 | 8.095 | 9,13 | ||||
| 2025-11-10 | 13F | Legacy Financial Advisors, Inc. | 0 | -100,00 | 0 | |||||
| 2026-02-13 | 13F | Atlas Capital Advisors Llc | 1.262 | 67 | ||||||
| 2026-02-12 | 13F | Jane Street Group, Llc | Call | 116.500 | 2,19 | 6.209 | 14,96 | |||
| 2026-02-12 | 13F | Jane Street Group, Llc | 36.212 | -96,99 | 1.930 | -96,61 | ||||
| 2026-01-30 | 13F/A | M&t Bank Corp | 4.681 | 1,06 | 249 | 13,70 | ||||
| 2026-02-12 | 13F | Bank Of Montreal /can/ | 5.305.724 | -13,11 | 282.851 | -2,22 | ||||
| 2026-02-12 | 13F | Jane Street Group, Llc | Put | 4.000 | -84,19 | 213 | -82,22 | |||
| 2026-04-08 | 13F | Legacy Wealth Asset Management, LLC | 11.132 | 1,95 | 621 | 6,88 | ||||
| 2025-11-13 | 13F | Entropy Technologies, LP | 0 | -100,00 | 0 | |||||
| 2026-04-08 | 13F | Wealth Enhancement Advisory Services, Llc | 18.470 | -55,01 | 519 | -77,99 | ||||
| 2026-02-10 | 13F | SBI Okasan Asset Management Co.Ltd. | 34.500 | 1.855 | ||||||
| 2026-02-17 | 13F | Alliancebernstein L.p. | 192.017 | 74,85 | 10.235 | 96,69 | ||||
| 2026-02-10 | 13F | Norges Bank | 3.707.113 | 197.628 | ||||||
| 2026-02-11 | 13F | Deutsche Bank Ag\ | 570.293 | 14,38 | 30.397 | 28,68 | ||||
| 2025-11-06 | 13F | Whipplewood Advisors, LLC | 0 | -100,00 | 0 | |||||
| 2026-01-28 | 13F | Hoey Investments, Inc | 125 | 0,00 | 7 | 20,00 | ||||
| 2026-02-10 | 13F | Natixis Advisors, L.p. | 0 | -100,00 | 0 | -100,00 | ||||
| 2026-01-29 | 13F | Sanctuary Advisors, LLC | 4.631 | 8,13 | 247 | 21,78 | ||||
| 2026-02-17 | 13F | Portolan Capital Management, LLC | 255.481 | 13.617 | ||||||
| 2026-02-17 | 13F | Engineers Gate Manager LP | 26.958 | 1.437 | ||||||
| 2026-02-17 | 13F | Private Advisor Group, LLC | 10.966 | 5,24 | 584 | 18,46 | ||||
| 2026-02-09 | 13F | Frazier Financial Advisors, LLC | 0 | -100,00 | 0 | |||||
| 2026-02-13 | 13F | SRS Capital Advisors, Inc. | 131 | 13.000,00 | 7 | |||||
| 2026-02-11 | 13F | Picton Mahoney Asset Management | 745.714 | 1.949,23 | 39.810 | 3.980.800,00 | ||||
| 2026-04-23 | 13F | Cornerstone Wealth Management, LLC | 6.181 | 345 | ||||||
| 2026-02-13 | 13F | Towarzystwo Funduszy Inwestycyjnych Pzu Sa | 250 | 0,00 | 13 | 18,18 | ||||
| 2026-04-20 | 13F | Jfs Wealth Advisors, Llc | 98 | 0,00 | 5 | 0,00 | ||||
| 2026-04-02 | 13F | Hilltop National Bank | 13 | 0,00 | 1 | |||||
| 2026-02-13 | 13F | Great West Life Assurance Co /can/ | 369.754 | 8,23 | 20 | 26,67 | ||||
| 2026-02-17 | 13F | Russell Investments Group, Ltd. | 2.090.887 | 7,83 | 111.549 | 21,44 | ||||
| 2026-02-18 | 13F | Guardian Capital Lp | 71.945 | 8,28 | 3.837 | 21,89 | ||||
| 2026-01-27 | 13F | Evergreen Capital Management Llc | 4.678 | -1,89 | 249 | 10,67 | ||||
| 2026-02-12 | 13F | Nuveen, LLC | 187.041 | 0,00 | 9.984 | 12,64 | ||||
| 2026-02-12 | 13F | BlackRock, Inc. | 702.331 | 11,75 | 37.434 | 25,71 | ||||
| 2026-02-17 | 13F | Hotchkis & Wiley Capital Management Llc | 9.854.052 | -9,00 | 525.221 | 2,37 | ||||
| 2025-11-14 | 13F | Knightsbridge Asset Management, Llc | 135.163 | -5,33 | 6.404 | 16,18 | ||||
| 2026-01-29 | 13F | IMC-Chicago, LLC | 40.855 | 24,26 | 2.178 | 39,82 | ||||
| 2026-02-06 | 13F | Shakespeare Wealth Management, Inc. | 4.140 | 221 | ||||||
| 2026-01-29 | 13F | IMC-Chicago, LLC | Put | 36.300 | -15,78 | 1.935 | -5,29 | |||
| 2026-02-02 | 13F | Danske Bank A/s | 1.736 | -27,67 | 93 | -17,86 | ||||
| 2026-01-29 | 13F | IMC-Chicago, LLC | Call | 42.300 | -34,82 | 2.255 | -26,68 | |||
| 2026-02-12 | 13F | Dimensional Fund Advisors Lp | 3.760.683 | 14,06 | 200.459 | 28,34 | ||||
| 2026-02-13 | 13F | Quarry LP | 118 | 6 | ||||||
| 2025-11-14 | 13F | Point72 Italy, S.r.l. | 225.633 | 10.690 | ||||||
| 2026-02-13 | 13F | Beutel, Goodman & Co Ltd. | 800 | 0,00 | 0 | |||||
| 2026-02-13 | 13F | Umb Bank N A/mo | 178 | 134,21 | 9 | 200,00 | ||||
| 2026-02-13 | 13F | Cornerstone Financial Management LLC | 31 | 2 | ||||||
| 2026-02-11 | 13F | Metis Global Partners, LLC | 6.163 | -27,37 | 329 | -18,41 | ||||
| 2026-04-21 | 13F | Venturi Wealth Management, LLC | 3.792 | 0,90 | 212 | 5,50 | ||||
| 2026-02-13 | 13F | Ubs Asset Management Americas Inc | 516 | 28 | ||||||
| 2026-02-12 | 13F | Skopos Labs, Inc. | 27.721 | 0,84 | 1.491 | 41,10 | ||||
| 2026-02-12 | 13F | BRYN MAWR TRUST Co | 1.300 | 0,00 | 69 | 13,11 | ||||
| 2025-11-14 | 13F | Atom Investors LP | 0 | -100,00 | 0 | |||||
| 2026-02-13 | 13F | Shepherd Kaplan Krochuk, Llc | 17.288 | -9,47 | 921 | 1,88 | ||||
| 2026-02-03 | 13F | Strengthening Families & Communities, LLC | 0 | -100,00 | 0 | |||||
| 2026-02-10 | 13F | State of Wyoming | 21.381 | 92,97 | 1.140 | 117,14 | ||||
| 2026-02-13 | 13F | National Bank Of Canada /fi/ | Call | 296 | 57,45 | 1.578 | 77,19 | |||
| 2026-02-11 | 13F | Letko, Brosseau & Associates Inc | 4.067.800 | -1,36 | 217.137 | 11,10 | ||||
| 2026-02-13 | 13F | National Bank Of Canada /fi/ | Put | 82 | 1,23 | 437 | 14,10 | |||
| 2026-02-06 | 13F | Leonteq Securities AG | 5.296 | -60,68 | 282 | -55,80 | ||||
| 2026-02-12 | 13F | Hrt Financial Lp | 22.677 | 1 | ||||||
| 2026-01-30 | 13F | Us Bancorp \de\ | 131.966 | -8,45 | 7.034 | 2,99 | ||||
| 2026-02-17 | 13F | Toronto Dominion Bank | 1.648.230 | 31,32 | 87.869 | 47,84 | ||||
| 2026-02-17 | 13F | Toronto Dominion Bank | Put | 4.000 | -57,45 | 213 | -52,13 | |||
| 2026-02-17 | 13F | Toronto Dominion Bank | Call | 32.200 | -73,63 | 1.717 | -70,33 | |||
| 2026-02-02 | 13F | Tevis Investment Management | 30.364 | 0,00 | 1.439 | 0,00 | ||||
| 2026-02-02 | 13F | Truist Financial Corp | 6.687 | 0,71 | 356 | 13,38 | ||||
| 2026-04-07 | 13F | Farther Finance Advisors, LLC | 11.682 | 62,66 | 660 | 72,77 | ||||
| 2026-02-10 | 13F | CIBC Asset Management Inc | 1.293.727 | 165,23 | 69.501 | 200,96 | ||||
| 2026-02-17 | 13F | Investment Management Corp of Ontario | 32.510 | 231,43 | 1.733 | 273,28 | ||||
| 2026-04-21 | 13F | Vise Technologies, Inc. | 9.674 | 0,00 | 516 | 0,00 | ||||
| 2026-02-03 | 13F | Sequoia Financial Advisors, LLC | 26.165 | 31,01 | 1.395 | 47,36 | ||||
| 2026-01-15 | 13F | Royal Fund Management, LLC | 51.082 | 32,43 | 2.723 | 48,99 | ||||
| 2026-01-27 | 13F | TD Waterhouse Canada Inc. | 689.923 | -24,96 | 36.671 | -13,56 | ||||
| 2025-11-14 | 13F | Capstone Investment Advisors, Llc | 7.257 | -17,21 | 344 | 1,48 | ||||
| 2026-02-09 | 13F | Employees Retirement System of Texas | 2.713 | 0,00 | 0 | |||||
| 2026-02-17 | 13F | Canada Pension Plan Investment Board | 2.034.587 | 52,59 | 108.465 | 71,72 | ||||
| 2026-02-20 | 13F | Sunbelt Securities, Inc. | 185 | 10 | ||||||
| 2026-04-21 | 13F | Financial Consulate, Inc | 69 | 4 | ||||||
| 2026-02-17 | 13F | Raymond James Financial Inc | 184.910 | 2,00 | 9.856 | 14,74 | ||||
| 2026-02-11 | 13F | Empowered Funds, LLC | 42.686 | -9,60 | 2.275 | 1,70 | ||||
| 2026-04-20 | 13F | Ronald Blue Trust, Inc. | 5.059 | -6,14 | 282 | -1,74 | ||||
| 2026-02-03 | 13F | Crossmark Global Holdings, Inc. | 16.907 | 16,18 | 901 | 30,77 | ||||
| 2026-02-13 | 13F | Stifel Financial Corp | 73.175 | -2,89 | 3.900 | 9,24 | ||||
| 2026-02-02 | 13F | Mutual Advisors, LLC | 26.177 | -0,13 | 1.395 | 15,58 | ||||
| 2026-04-22 | 13F | Gold Investment Management Ltd. | 996 | 0,71 | 56 | 5,77 | ||||
| 2026-01-28 | 13F | Geneos Wealth Management Inc. | 150 | 0,00 | 8 | 0,00 | ||||
| 2026-02-11 | 13F | LPL Financial LLC | 51.716 | 24,74 | 2.756 | 40,33 | ||||
| 2026-02-13 | 13F | Citigroup Inc | 668.960 | 29,46 | 35.709 | 45,82 | ||||
| 2026-02-17 | 13F | Jones Financial Companies Lllp | 141.072 | 5,90 | 7.519 | 21,08 | ||||
| 2026-04-22 | 13F | QV Investors Inc. | 586.191 | -2,07 | 33 | 3,23 | ||||
| 2026-02-13 | 13F | Caitong International Asset Management Co., Ltd | 0 | -100,00 | 0 | |||||
| 2026-02-12 | 13F | Principal Securities, Inc. | 0 | -100,00 | 0 | |||||
| 2026-04-15 | 13F | Avanza Fonder AB | 337 | 0,00 | 26 | 8,33 | ||||
| 2026-02-10 | 13F | Intech Investment Management Llc | 6.058 | -97,83 | 323 | -97,56 | ||||
| 2026-02-13 | 13F | Becker Capital Management Inc | 9.869 | -10,60 | 526 | 0,57 | ||||
| 2026-02-04 | 13F | Swiss Life Asset Management Ltd | 18.053 | -0,39 | 962 | 11,99 | ||||
| 2026-02-05 | 13F | Td Private Client Wealth Llc | 7 | 0 | ||||||
| 2026-02-04 | 13F | Midwest Trust Co | 196.606 | -1,31 | 10.479 | 11,02 | ||||
| 2026-02-13 | 13F | Nfj Investment Group, Llc | 150.869 | -9,04 | 8.041 | 2,33 | ||||
| 2026-02-17 | 13F | Guardian Partners Inc. | 0 | -100,00 | 0 | |||||
| 2026-02-10 | 13F | Goldman Sachs Group Inc | 2.568.080 | -16,57 | 136.879 | -6,14 | ||||
| 2026-02-17 | 13F | Numerai GP LLC | 3.999 | -90,26 | 213 | -89,05 | ||||
| 2026-02-17 | 13F | Gotham Asset Management, LLC | 62.381 | 321,41 | 3.325 | 374,18 | ||||
| 2026-02-09 | 13F | Legal & General Group Plc | 3.677.657 | 9,45 | 196.311 | 23,28 | ||||
| 2026-02-17 | 13F | National Asset Management, Inc. | 5.668 | -0,28 | 302 | 12,27 | ||||
| 2026-01-30 | 13F | Valued Wealth Advisors LLC | 3 | 0,00 | 0 | |||||
| 2026-02-04 | 13F | Marco Investment Management Llc | 59.220 | -1,66 | 3.156 | 10,62 | ||||
| 2026-02-05 | 13F | Cambridge Investment Research Advisors, Inc. | 6.773 | 0,44 | 0 | |||||
| 2026-02-12 | 13F | Marex Group plc | 17.276 | 921 | ||||||
| 2026-02-13 | 13F | Bank Of Nova Scotia | 2.285.095 | 4,30 | 121.813 | 17,34 | ||||
| 2026-02-17 | 13F | Parallax Volatility Advisers, L.P. | 34.212 | 1.824 | ||||||
| 2026-02-17 | 13F | Janus Henderson Group Plc | 16.491 | 0,00 | 879 | 12,98 | ||||
| 2026-02-17 | 13F | Balyasny Asset Management Llc | 3.791 | -62,39 | 202 | -57,65 | ||||
| 2026-04-09 | 13F | Pacifica Partners Inc. | 375 | 0,00 | 21 | 0,00 | ||||
| 2026-02-04 | 13F | Plato Investment Management Ltd | 69.752 | 74,52 | 3.741 | 99,10 | ||||
| 2025-11-14 | 13F | Voloridge Investment Management, Llc | 0 | -100,00 | 0 | -100,00 | ||||
| 2026-02-10 | 13F | Scheer, Rowlett & Associates Investment Management Ltd. | 410.369 | -48,43 | 21.877 | -41,96 | ||||
| 2026-02-12 | 13F | M&G Plc | 62.165 | -14,15 | 3.295 | -3,20 | ||||
| 2026-02-13 | 13F | Johnson Investment Counsel Inc | 0 | -100,00 | 0 | |||||
| 2026-02-05 | 13F | Qsemble Capital Management, LP | 72.252 | 496,78 | 3.851 | 572,08 | ||||
| 2026-02-05 | 13F | Heathbridge Capital Management Ltd. | 0 | -100,00 | 0 | |||||
| 2026-02-17 | 13F | Two Sigma Advisers, Lp | 28.200 | 45,36 | 1.503 | 63,55 | ||||
| 2026-02-10 | 13F | Bnp Paribas Arbitrage, Sa | 994 | 241,58 | 53 | 300,00 | ||||
| 2026-02-12 | 13F | Aviva Plc | 201.012 | 6,07 | 10.724 | 19,55 | ||||
| 2026-02-02 | 13F | Nkcfo Llc | 8.000 | 0 | ||||||
| 2026-02-24 | 13F | SG Trading Solutions, LLC | 27.025 | 1 | ||||||
| 2026-02-12 | 13F | Brinker Capital Investments, LLC | 32.079 | 32,32 | 1.710 | 48,87 | ||||
| 2026-01-12 | 13F | Horizon Financial Services, Llc | 0 | -100,00 | 0 | |||||
| 2025-11-14 | 13F | Axa S.a. | 0 | -100,00 | 0 | -100,00 | ||||
| 2026-02-12 | 13F | APG Asset Management N.V. | 139.890 | -6,62 | 6.358 | 5,25 | ||||
| 2026-02-06 | 13F | GPS Wealth Strategies Group, LLC | 0 | -100,00 | 0 | |||||
| 2026-02-13 | 13F | Neuberger Berman Group LLC | 139.230 | 67,50 | 7.432 | 88,68 | ||||
| 2026-02-17 | 13F | Capital Fund Management S.a. | Call | 0 | -100,00 | 0 | ||||
| 2026-02-17 | 13F | Capital Fund Management S.a. | 0 | -100,00 | 0 | |||||
| 2026-01-30 | 13F | Lincluden Management Ltd | 642.618 | -3,97 | 47 | 51,61 | ||||
| 2026-02-17 | 13F | BCV Asset Management Inc. | 970.305 | 76.042 | ||||||
| 2026-02-11 | 13F | Westerkirk Capital Inc. | 800 | -92,79 | 43 | -92,00 | ||||
| 2025-11-14 | 13F | Zimmer Partners, LP | 0 | -100,00 | 0 | -100,00 | ||||
| 2026-02-11 | 13F | Tacita Capital Inc | 9.986 | 136,30 | 533 | 166,00 | ||||
| 2026-02-11 | 13F | Manchester Capital Management LLC | 641 | 34 | ||||||
| 2026-02-17 | 13F | SageView Advisory Group, LLC | 94 | 5 | ||||||
| 2026-04-20 | 13F | City State Bank | 50 | 0,00 | 3 | 0,00 | ||||
| 2026-04-23 | 13F | MQS Management LLC | 5.922 | 331 | ||||||
| 2026-02-11 | 13F | Cerity Partners LLC | 36.824 | -1,55 | 1.963 | 10,72 | ||||
| 2026-03-12 | 13F/A | Peak6 Llc | Put | 3.100 | -64,77 | 165 | -60,34 | |||
| 2026-01-14 | 13F | Net Worth Advisory Group | 8.831 | 17,45 | 471 | 32,02 | ||||
| 2026-03-12 | 13F/A | Peak6 Llc | Call | 435.600 | -27,25 | 23.217 | -18,17 | |||
| 2026-02-17 | 13F | Ameriprise Financial Inc | 28.100 | 18,00 | 1.569 | 38,36 | ||||
| 2026-02-18 | 13F | Vident Advisory, LLC | 67.007 | -15,40 | 3.575 | -4,77 | ||||
| 2026-02-13 | 13F | BRITISH COLUMBIA INVESTMENT MANAGEMENT Corp | 138.848 | -8,92 | 7.402 | 2,51 | ||||
| 2026-04-22 | 13F | Stone House Investment Management, LLC | 6 | -93,75 | 0 | -100,00 | ||||
| 2026-01-26 | 13F | Private Trust Co Na | 241 | 0,00 | 13 | 9,09 | ||||
| 2026-02-17 | 13F | Banco Bilbao Vizcaya Argentaria, S.a. | 0 | -100,00 | 0 | |||||
| 2026-02-13 | 13F | Arrowstreet Capital, Limited Partnership | 4.487.583 | -7,98 | 239.204 | 3,53 | ||||
| 2026-02-18 | 13F | Achmea Investment Management B.V. | 0 | -100,00 | 0 | |||||
| 2026-01-28 | 13F | CAPROCK Group, Inc. | 27.436 | 19,14 | 1.462 | 38,32 | ||||
| 2026-02-05 | 13F | AlphaCore Capital LLC | 5.738 | -3,35 | 306 | 8,54 | ||||
| 2026-02-09 | 13F | Morningstar Investment Management LLC | 25.922 | 1 | ||||||
| 2025-11-07 | 13F | Sierra Ocean, Llc | 0 | -100,00 | 0 | |||||
| 2026-02-10 | 13F/A | Northwestern Mutual Wealth Management Co | 1.218 | 41,63 | 65 | 60,00 | ||||
| 2026-01-13 | 13F | Matrix Trust Co | 0 | -100,00 | 0 | |||||
| 2026-02-12 | 13F | Bank Of Nova Scotia Trust Co | 10.847 | 578 | ||||||
| 2026-04-15 | 13F | Merit Financial Group, LLC | 5.329 | 15,85 | 297 | 21,22 | ||||
| 2026-02-11 | 13F | Zions Bancorporation, National Association /ut/ | 80 | 0,00 | 4 | 33,33 | ||||
| 2026-04-23 | 13F | Accurate Wealth Management, LLC | 18.655 | -15,55 | 1.079 | -13,05 | ||||
| 2026-02-12 | 13F | Groupe la Francaise | 5.141 | 1,28 | 274 | 14,17 | ||||
| 2026-02-10 | 13F | Hillsdale Investment Management Inc. | 725.425 | 2,29 | 38.741 | 15,33 | ||||
| 2026-02-13 | 13F | Kilter Group LLC | 62 | 210,00 | 3 | |||||
| 2026-02-24 | 13F | DGS Capital Management, LLC | 44.101 | 18,50 | 2.351 | 33,30 | ||||
| 2026-02-13 | 13F | Bridgewater Associates, LP | 47.351 | -4,56 | 2.528 | 7,49 | ||||
| 2026-02-11 | 13F | Simplex Trading, Llc | Call | 69.000 | -42,79 | 3.678 | 73.440,00 | |||
| 2026-02-17 | 13F | Aquatic Capital Management LLC | 0 | -100,00 | 0 | |||||
| 2026-02-11 | 13F | Simplex Trading, Llc | Put | 9.400 | -91,40 | 501 | 9.920,00 | |||
| 2026-02-17 | 13F | Man Group plc | 591.178 | 21,34 | 31.555 | 36,67 | ||||
| 2026-02-13 | 13F | Turtle Creek Asset Management Inc. | 1.058.852 | -45,70 | 56.437 | -38,91 | ||||
| 2026-02-17 | 13F | Steadfast Capital Management Lp | 165.952 | 8.845 | ||||||
| 2025-11-05 | 13F | Fullcircle Wealth Llc | 21.789 | 4,84 | 1.066 | 23,95 | ||||
| 2025-11-07 | 13F/A | Abn Amro Investment Solutions | 6.739 | -26,48 | 361 | -30,17 | ||||
| 2026-04-06 | 13F | Versant Capital Management, Inc | 1.313 | 39,98 | 73 | 48,98 | ||||
| 2026-02-09 | 13F | Harbour Investments, Inc. | 641 | 0,00 | 34 | 13,33 | ||||
| 2026-02-17 | 13F | Qube Research & Technologies Ltd | 26.174 | -25,80 | 1.395 | -16,47 | ||||
| 2026-02-09 | 13F | Hantz Financial Services, Inc. | 30.566 | -0,15 | 2 | 0,00 | ||||
| 2025-11-12 | 13F | Transce3nd, LLC | 0 | -100,00 | 0 | -100,00 | ||||
| 2026-02-12 | 13F | UniSuper Management Pty Ltd | 4.600 | 0,00 | 337 | 10,89 | ||||
| 2026-02-11 | 13F | Syon Capital Llc | 5.939 | 317 | ||||||
| 2026-02-13 | 13F | Walleye Trading LLC | Call | 14.800 | -51,48 | 789 | -45,47 | |||
| 2026-02-13 | 13F | Walleye Trading LLC | 18.713 | -39,43 | 997 | -31,85 | ||||
| 2026-02-13 | 13F | Walleye Trading LLC | Put | 62.700 | -29,71 | 3.342 | -20,94 | |||
| 2026-02-13 | 13F | Toroso Investments, LLC | 17.935 | 37,53 | 956 | 54,78 | ||||
| 2026-02-06 | 13F | HighTower Advisors, LLC | 8.527 | 4,51 | 454 | 17,62 | ||||
| 2026-04-20 | 13F | Ritholtz Wealth Management | 67.875 | 22,13 | 3.788 | 27,89 | ||||
| 2026-02-13 | 13F | Eventide Asset Management, Llc | 21.379 | 6,23 | 1.147 | 21,40 | ||||
| 2026-02-13 | 13F | C M Bidwell & Associates Ltd | 5.640 | 301 | ||||||
| 2026-02-13 | 13F | Dixon Mitchell Investment Counsel Inc. | 80 | 4 | ||||||
| 2026-01-12 | 13F | CVA Family Office, LLC | 4.055 | 0,00 | 216 | 12,50 | ||||
| 2026-02-12 | 13F | Towle & Co | 202.374 | -7,20 | 10.787 | 4,39 | ||||
| 2026-02-13 | 13F | Arkadios Wealth Advisors | 4.767 | 7,29 | 254 | 20,95 | ||||
| 2026-02-17 | 13F | Trexquant Investment LP | 109.832 | 5.854 | ||||||
| 2026-02-09 | 13F | Huntington National Bank | 242 | 0,00 | 13 | 9,09 | ||||
| 2026-04-24 | 13F | Pzena Investment Management Llc | 25.329.355 | -13,00 | 1.967.838 | -7,62 | ||||
| 2026-02-17 | 13F | Cetera Investment Advisers | 138.191 | 8,73 | 7.366 | 22,30 | ||||
| 2026-04-06 | 13F | CX Institutional | 0 | -100,00 | 0 | |||||
| 2026-02-11 | 13F | Group One Trading, L.p. | Put | 2.400 | -91,08 | 128 | -90,03 | |||
| 2026-04-24 | 13F | USS Investment Management Ltd | 4.588 | 254 | ||||||
| 2026-02-11 | 13F | Group One Trading, L.p. | Call | 14.800 | -22,11 | 789 | -12,44 | |||
| 2026-02-11 | 13F | Group One Trading, L.p. | 22.408 | 2,24 | 1.194 | 15,03 | ||||
| 2026-01-26 | 13F | Cwm, Llc | 2.220 | 6,42 | 0 | |||||
| 2026-02-17 | 13F | Signature Equity Partners, LLC | 74 | 4 | ||||||
| 2025-11-14 | 13F | Sagard Holdings Management Inc. | 423 | 0,00 | 20 | 25,00 | ||||
| 2026-02-13 | 13F | Virtus ETF Advisers LLC | 6.824 | -45,41 | 420 | -45,74 | ||||
| 2026-01-26 | 13F | AE Wealth Management LLC | 5.192 | 17,44 | 277 | 32,06 | ||||
| 2026-02-11 | 13F | Fox Run Management, L.l.c. | 19.297 | 1.029 | ||||||
| 2026-02-13 | 13F | Chou Associates Management Inc. | 10.000 | 0,00 | 533 | 12,68 | ||||
| 2026-02-06 | 13F | EverSource Wealth Advisors, LLC | 779 | 35,71 | 42 | 51,85 | ||||
| 2026-01-15 | 13F | Frank, Rimerman Advisors LLC | 6.415 | 0,55 | 342 | 12,91 | ||||
| 2026-01-15 | 13F | Mn Services Vermogensbeheer B.V. | 101.121 | 1,52 | 5 | 25,00 | ||||
| 2026-02-18 | 13F | Mackenzie Financial Corp | 1.574.518 | 70,38 | 84.302 | 92,58 | ||||
| 2026-04-13 | 13F | Gateway Investment Advisers Llc | 10.537 | 6,43 | 588 | 11,57 | ||||
| 2026-02-17 | 13F | Graham Capital Management, L.P. | 43.724 | 30,66 | 2.330 | 47,00 | ||||
| 2026-04-17 | 13F | Stephenson National Bank & Trust | 6.774 | 0,62 | 378 | 5,59 | ||||
| 2026-02-03 | 13F | K.J. Harrison & Partners Inc | 5.913 | 21,44 | 316 | 33,47 | ||||
| 2026-03-24 | 13F/A | Barclays Plc | Call | 0 | -100,00 | 0 | -100,00 | |||
| 2026-02-06 | 13F | Creative Financial Designs Inc /adv | 0 | -100,00 | 0 | |||||
| 2026-02-06 | 13F | Harmony Asset Management Llc | 4.079 | 217 | ||||||
| 2026-02-13 | 13F | Parkside Financial Bank & Trust | 1.544 | 0,00 | 82 | 12,33 | ||||
| 2026-02-17 | 13F | Amundi | 1.462.468 | 160,14 | 77.950 | 181,82 | ||||
| 2025-11-14 | 13F | Cubist Systematic Strategies, LLC | 0 | -100,00 | 0 | -100,00 | ||||
| 2026-02-13 | 13F | BNP Paribas Asset Management Holding S.A. | 207.815 | 15 | ||||||
| 2026-04-16 | 13F | Park National Corp /oh/ | 268 | 15 | ||||||
| 2026-02-19 | 13F | CI Private Wealth, LLC | 34.649 | 10,57 | 1.844 | 24,19 | ||||
| 2026-02-05 | 13F | Leuthold Group, Llc | 147.172 | 26,57 | 7.844 | 42,39 | ||||
| 2026-02-12 | 13F | CIBC Private Wealth Group, LLC | 229 | 0,00 | 12 | 20,00 | ||||
| 2026-02-12 | 13F | Steward Partners Investment Advisory, Llc | 2.587 | 0,00 | 138 | 12,30 | ||||
| 2026-01-30 | 13F | Bogart Wealth, LLC | 221 | 0,00 | 12 | 10,00 | ||||
| 2026-04-21 | 13F | Nemes Rush Group LLC | 27 | 0,00 | 2 | 0,00 | ||||
| 2026-02-12 | 13F | Advisors Asset Management, Inc. | 32.200 | -11,87 | 1.716 | -0,87 | ||||
| 2026-04-16 | 13F | SG Americas Securities, LLC | 13.931 | 498,41 | 1 | |||||
| 2026-04-20 | 13F | YANKCOM Partnership | 267 | 0,00 | 15 | 0,00 | ||||
| 2026-02-11 | 13F | West Family Investments, Inc. | 0 | -100,00 | 0 | -100,00 | ||||
| 2026-02-11 | 13F | O'shaughnessy Asset Management, Llc | 253.521 | 26,50 | 13.513 | 42,32 | ||||
| 2026-02-13 | 13F | Rhumbline Advisers | 2.480 | -10,76 | 132 | 0,76 | ||||
| 2025-11-07 | 13F | Shell Asset Management Co | 6.509 | -83,91 | 0 | -100,00 | ||||
| 2026-04-23 | 13F | North Star Investment Management Corp. | 272 | 0,00 | 15 | 7,14 | ||||
| 2026-02-13 | 13F | American Century Companies Inc | 625.046 | 3,91 | 33.320 | 16,92 | ||||
| 2026-02-10 | 13F | Forsta Ap-fonden | 62.000 | -57,27 | 3.310 | -51,88 | ||||
| 2026-02-13 | 13F | Morgan Stanley | 2.635.095 | -16,66 | 140.451 | -6,25 | ||||
| 2026-04-07 | 13F | Signaturefd, Llc | 11.388 | 3,16 | 636 | 7,99 | ||||
| 2026-02-11 | 13F | Commonwealth Retirement Investments LLC | 200 | 11 | ||||||
| 2026-02-13 | 13F | Public Sector Pension Investment Board | 0 | -100,00 | 0 | |||||
| 2026-04-17 | 13F | AdvisorNet Financial, Inc | 0 | -100,00 | 0 | |||||
| 2026-01-13 | 13F | CoreCap Advisors, LLC | 0 | -100,00 | 0 | |||||
| 2026-02-13 | 13F | Smartleaf Asset Management LLC | 76 | 7,04 | 4 | 33,33 | ||||
| 2026-02-06 | 13F | Pnc Financial Services Group, Inc. | 15.101 | -2,99 | 805 | 9,09 | ||||
| 2026-02-12 | 13F | Earnest Partners Llc | 17.216 | -7,99 | 918 | 3,50 | ||||
| 2026-02-19 | 13F | Mcguire Capital Advisors Inc | 24 | 1 | ||||||
| 2026-02-06 | 13F | Aviance Capital Partners, LLC | 31.414 | -4,80 | 1.674 | 7,10 | ||||
| 2026-02-13 | 13F | Osmosis Investment Management UK Ltd | 6.354 | 339 | ||||||
| 2026-01-29 | 13F | Vanguard Group Inc | 12.322.391 | 2,23 | 656.907 | 15,02 | ||||
| 2025-11-06 | 13F | Ameritas Advisory Services, LLC | 0 | -100,00 | 0 | -100,00 | ||||
| 2026-02-17 | 13F | Ancora Advisors, LLC | 13 | 1 | ||||||
| 2025-11-10 | 13F | New Millennium Group LLC | 0 | -100,00 | 0 | |||||
| 2026-01-30 | 13F | AMG National Trust Bank | 68.191 | -0,43 | 3.635 | 12,02 | ||||
| 2025-11-14 | 13F | Wolverine Trading, Llc | 11.449 | -66,61 | 537 | -59,26 | ||||
| 2026-02-03 | 13F | Manske Wealth Management | 4.766 | -0,89 | 254 | 11,89 | ||||
| 2025-11-14 | 13F | Wolverine Trading, Llc | Call | 61.700 | 24,40 | 2.896 | 51,86 | |||
| 2025-11-14 | 13F | Wolverine Trading, Llc | Put | 60.000 | 83,49 | 2.816 | 124,03 | |||
| 2026-02-11 | 13F | Parallel Advisors, LLC | 3.024 | 22,73 | 161 | 38,79 | ||||
| 2026-02-17 | 13F | Clear Street Markets Llc | 2.000 | 42,86 | 107 | 60,61 | ||||
| 2026-02-17 | 13F | Mercer Global Advisors Inc /adv | 9.479 | 11,69 | 505 | 25,62 | ||||
| 2026-02-12 | 13F | Ensign Peak Advisors, Inc | 13.391 | 0,00 | 715 | 12,62 | ||||
| 2026-02-10 | 13F | Gulf International Bank (UK) Ltd | 15.730 | 0,00 | 1 | -100,00 | ||||
| 2026-02-13 | 13F | Walleye Capital LLC | Put | 17.300 | -29,96 | 922 | -21,20 | |||
| 2026-02-13 | 13F | Walleye Capital LLC | 172 | -99,25 | 9 | -99,17 | ||||
| 2026-02-13 | 13F | Walleye Capital LLC | Call | 8.700 | 464 | |||||
| 2026-04-06 | 13F | GAMMA Investing LLC | 122 | 0,00 | 7 | 0,00 | ||||
| 2026-02-12 | 13F | Grey Fox Wealth Advisors, LLC | 0 | -100,00 | 0 | |||||
| 2026-04-24 | 13F | Kendall Capital Management | 9.430 | 2,17 | 526 | 7,13 | ||||
| 2026-01-30 | 13F | Turning Point Benefit Group, Inc. | 5 | 0,00 | 0 | |||||
| 2026-02-13 | 13F | Golden State Wealth Management, LLC | 65 | 0,00 | 3 | 0,00 | ||||
| 2026-02-17 | 13F | Two Sigma Investments, Lp | 18.287 | 975 | ||||||
| 2026-02-12 | 13F | Quadrant Capital Group Llc | 1.022 | 0,00 | 54 | 12,50 | ||||
| 2026-02-02 | 13F | Millstone Evans Group, LLC | 800 | 0,00 | 43 | 13,51 | ||||
| 2026-02-13 | 13F | Korea Investment CORP | 159.768 | -15,63 | 8.528 | -4,97 | ||||
| 2026-01-23 | 13F | Cambiar Investors Llc | 8.475 | 90,45 | 452 | 114,76 | ||||
| 2026-02-04 | 13F | D'Orazio & Associates, Inc. | 4.400 | 235 | ||||||
| 2026-01-13 | 13F | Kathmere Capital Management, LLC | 9.262 | 53,02 | 494 | 72,38 | ||||
| 2026-02-04 | 13F | Pacer Advisors, Inc. | 386.996 | 116,46 | 17.132 | 102,27 | ||||
| 2026-02-17 | 13F | Public Employees Retirement System Of Ohio | 138.926 | -0,52 | 7.416 | 12,03 | ||||
| 2026-02-23 | 13F | Beaird Harris Wealth Management, LLC | 12 | 0,00 | 1 | |||||
| 2026-02-13 | 13F | Wexford Capital Lp | 0 | -100,00 | 0 | |||||
| 2026-02-12 | 13F | Federation des caisses Desjardins du Quebec | 2.678.488 | 1,48 | 142.460 | 14,90 | ||||
| 2026-04-13 | 13F | Salem Investment Counselors Inc | 2.100 | 117 | ||||||
| 2026-02-17 | 13F | Optiver Holding B.V. | 84 | 4 | ||||||
| 2026-02-11 | 13F | Erste Asset Management GmbH | 0 | 0 | ||||||
| 2026-02-17 | 13F | Harris Associates L P | 206.680 | -90,43 | 11.016 | -89,24 | ||||
| 2026-02-02 | 13F | Montag A & Associates Inc | 248 | 0,00 | 13 | 18,18 | ||||
| 2025-10-31 | 13F | Whittier Trust Co Of Nevada Inc | 0 | -100,00 | 0 | -100,00 | ||||
| 2025-11-14 | 13F | AXA Investment Managers S.A. | 10.328 | 489 | ||||||
| 2026-02-13 | 13F | Alberta Investment Management Corp | 52.000 | 2.772 | ||||||
| 2025-11-10 | 13F | Rossby Financial, LCC | 0 | -100,00 | 0 | -100,00 | ||||
| 2026-02-12 | 13F | Brown Brothers Harriman & Co | 76 | 4 | ||||||
| 2026-02-17 | 13F | D. E. Shaw & Co., Inc. | Call | 29.400 | 0,00 | 1.567 | 12,57 | |||
| 2026-04-22 | 13F | Janney Montgomery Scott LLC | 43.528 | 1,11 | 2 | 0,00 | ||||
| 2026-02-09 | 13F | Mediolanum International Funds Ltd | 73.585 | 93,77 | 3.952 | 121,72 | ||||
| 2026-02-09 | 13F | IPG Investment Advisors LLC | 82.950 | -54,94 | 4.421 | -49,31 | ||||
| 2026-02-17 | 13F | D. E. Shaw & Co., Inc. | 10.416 | -65,71 | 555 | -61,40 | ||||
| 2026-02-13 | 13F | Royal London Asset Management Ltd | 11.875 | 0,00 | 633 | 12,46 | ||||
| 2026-02-17 | 13F | D. E. Shaw & Co., Inc. | Put | 63.800 | -59,31 | 3.402 | -54,21 | |||
| 2026-02-18 | 13F | GWM Advisors LLC | 289 | 54,55 | 15 | 87,50 | ||||
| 2025-10-30 | 13F | Ridgewood Investments LLC | 0 | -100,00 | 0 | |||||
| 2026-02-10 | 13F | Rothschild Investment Llc | 400 | 0,00 | 21 | 16,67 | ||||
| 2026-02-17 | 13F | Laird Norton Trust Company, Llc | 13.797 | 735 | ||||||
| 2026-02-04 | 13F | LRI Investments, LLC | 0 | -100,00 | 0 | |||||
| 2026-04-14 | 13F | Nbc Securities, Inc. | 0 | -100,00 | 0 | |||||
| 2026-04-17 | 13F | CENTRAL TRUST Co | 6.504 | 1,58 | 363 | 6,16 | ||||
| 2026-04-20 | 13F | LVW Advisors, LLC | 11.001 | 614 | ||||||
| 2026-02-13 | 13F | Natixis | 223.272 | 13,87 | 11.900 | 28,09 | ||||
| 2026-02-09 | 13F | Waratah Capital Advisors Ltd. | 220.000 | 214,29 | 11.726 | 253,62 | ||||
| 2026-04-07 | 13F | Central Pacific Bank - Trust Division | 2.240 | 0,00 | 125 | 5,04 | ||||
| 2026-02-03 | 13F | Buck Wealth Strategies, LLC | 271.462 | -4,84 | 14.469 | 7,05 | ||||
| 2026-02-10 | 13F | Acadian Asset Management Llc | 113.747 | 365,83 | 6 | 500,00 | ||||
| 2026-02-13 | 13F | Integrated Wealth Concepts LLC | 9.893 | -30,53 | 527 | -21,81 | ||||
| 2026-02-17 | 13F | SummitTX Capital, L.P. | 0 | -100,00 | 0 | |||||
| 2026-02-10 | 13F | Viawealth, Llc | 6.479 | -23,68 | 345 | -14,18 | ||||
| 2026-01-20 | 13F | Cigna Investments Inc /new | 4.597 | 0,00 | 0 | |||||
| 2026-02-11 | 13F | Jpmorgan Chase & Co | 1.535.121 | -12,59 | 81.822 | -1,66 | ||||
| 2026-02-17 | 13F | New Vernon Capital Holdings II LLC | 1.397 | 0,00 | 102 | 54,55 | ||||
| 2025-11-07 | 13F | CenterBook Partners LP | 8.932 | -65,16 | 423 | -57,23 | ||||
| 2026-02-17 | 13F | Royal Bank Of Canada | 11.929.452 | -6,99 | 635.839 | 4,63 | ||||
| 2025-11-05 | 13F | Plante Moran Financial Advisors, LLC | 0 | -100,00 | 0 | -100,00 | ||||
| 2026-04-13 | 13F | IFP Advisors, Inc | 616 | -26,75 | 34 | -22,73 | ||||
| 2026-02-17 | 13F | Creative Planning | 174.254 | 82,57 | 9.288 | 105,37 | ||||
| 2026-02-13 | 13F | Van Eck Associates Corp | 9.114 | 2,65 | 0 | |||||
| 2026-01-23 | 13F | Bridgewater Advisors Inc. | 5.519 | 9,63 | 298 | 19,28 | ||||
| 2026-02-13 | 13F | Kestra Advisory Services, LLC | 0 | -100,00 | 0 | |||||
| 2026-02-05 | 13F | Allworth Financial LP | 888 | 42,08 | 47 | 62,07 | ||||
| 2026-02-17 | 13F | Adage Capital Partners Gp, L.l.c. | 0 | -100,00 | 0 | |||||
| 2026-02-17 | 13F | Capital Fund Management S.a. | Put | 10.800 | -26,03 | 576 | -16,79 | |||
| 2026-02-13 | 13F | Charles Schwab Investment Management Inc | 1.620.675 | 1,05 | 86.511 | 13,82 | ||||
| 2026-02-13 | 13F | Wells Fargo & Company/mn | 159.192 | 0,34 | 8.485 | 12,88 | ||||
| 2026-04-08 | 13F | NorthCrest Asset Manangement, LLC | 9.060 | -49,62 | 500 | -49,54 | ||||
| 2026-02-05 | 13F | 1620 Investment Advisors, Inc. | 8.232 | 2,68 | 439 | 15,57 | ||||
| 2026-04-13 | 13F | Mather Group, Llc. | 25 | 1 | ||||||
| 2026-02-17 | 13F | Lombard Odier Asset Management (Switzerland) SA | 40.039 | 2.135 | ||||||
| 2026-02-17 | 13F | Tower Research Capital LLC (TRC) | 469 | -64,14 | 25 | -60,66 | ||||
| 2026-04-22 | 13F | Pictet Asset Management Holding SA | 114.611 | 9,83 | 6.380 | 14,54 | ||||
| 2026-02-03 | 13F | McIlrath & Eck, LLC | 210 | 0,00 | 11 | 22,22 | ||||
| 2026-01-26 | 13F | Mirae Asset Global Investments Co., Ltd. | 62.032 | 3.306 | ||||||
| 2026-03-04 | 13F | SHP Wealth Management | 100 | 5 | ||||||
| 2026-01-28 | 13F | HB Wealth Management, LLC | 3.786 | 202 | ||||||
| 2026-02-17 | 13F | Utah Retirement Systems | 30.000 | 0,00 | 1.601 | 12,67 | ||||
| 2026-02-17 | 13F | Occudo Quantitative Strategies Lp | 101.108 | 80,18 | 5.389 | 102,75 | ||||
| 2026-01-27 | 13F | Meritage Portfolio Management | 74.204 | -0,98 | 3.955 | 11,41 | ||||
| 2026-02-17 | 13F | FIL Ltd | 7.755.088 | 140,89 | 413.420 | 171,03 | ||||
| 2025-11-12 | 13F | 111 Capital | 15.458 | 732 | ||||||
| 2025-11-03 | 13F | Annis Gardner Whiting Capital Advisors, LLC | 0 | -100,00 | 0 | |||||
| 2026-02-19 | 13F | Invesco Ltd. | 1.259.325 | 4,97 | 67.122 | 18,09 | ||||
| 2026-02-03 | 13F | SBI Securities Co., Ltd. | 6.387 | 22,40 | 340 | 37,65 | ||||
| 2026-02-13 | 13F | Mufg Securities (canada), Ltd. | 403.351 | -7,97 | 21.507 | 3,58 | ||||
| 2026-02-10 | 13F | Bank of New York Mellon Corp | 474.194 | -0,80 | 25.275 | 11,59 | ||||
| 2026-02-11 | 13F | Allianz Asset Management GmbH | 604.995 | 296,92 | 32.294 | 347,09 | ||||
| 2026-02-17 | 13F | Millennium Management Llc | 357.908 | 126,43 | 19.081 | 154,81 | ||||
| 2026-04-03 | 13F | Investors Research Corp | 0 | -100,00 | 0 | |||||
| 2026-04-23 | 13F | Oppenheimer Asset Management Inc. | 1.050.136 | -17,58 | 58.608 | -13,69 | ||||
| 2025-11-14 | 13F | DZ BANK AG Deutsche Zentral Genossenschafts Bank, Frankfurt am Main | 0 | -100,00 | 0 | -100,00 | ||||
| 2026-02-17 | 13F | Grantham, Mayo, Van Otterloo & Co. LLC | 1.117.408 | 35,55 | 59.568 | 52,51 | ||||
| 2026-02-13 | 13F | Vontobel Holding Ltd. | 4.988 | 17,20 | 266 | 31,84 | ||||
| 2026-02-23 | 13F | Mv Capital Management, Inc. | 4 | 0 | ||||||
| 2026-04-14 | 13F | Thurston, Springer, Miller, Herd & Titak, Inc. | 193 | 0,52 | 11 | 0,00 | ||||
| 2026-02-09 | 13F | Waratah Capital Advisors Ltd. | Call | 0 | -100,00 | 0 | -100,00 | |||
| 2026-02-17 | 13F | Credit Agricole S A | 17.270 | 57,31 | 920 | 76,92 | ||||
| 2026-02-10 | 13F | Savant Capital, LLC | 4.281 | 228 | ||||||
| 2026-02-14 | 13F | Copley Financial Group, Inc. | 5.383 | 26,90 | 287 | 43,00 | ||||
| 2026-04-23 | 13F | SJS Investment Consulting Inc. | 133 | 64,20 | 7 | 75,00 | ||||
| 2026-02-10 | 13F | Bruce G. Allen Investments, LLC | 201 | 0,00 | 11 | 11,11 | ||||
| 2026-02-13 | 13F | MAI Capital Management | 700 | 118,07 | 37 | 146,67 | ||||
| 2026-04-17 | 13F | Bell Investment Advisors, Inc | 181 | -37,59 | 10 | -33,33 | ||||
| 2026-04-10 | 13F | Perigon Wealth Management, LLC | 11.023 | 6,69 | 615 | 11,82 | ||||
| 2026-02-02 | 13F | Intact Investment Management Inc. | 1.574.620 | 0,70 | 83.939 | 13,28 | ||||
| 2026-04-08 | 13F | Grove Bank & Trust | 641 | 0,00 | 36 | 2,94 | ||||
| 2026-02-03 | 13F | Generali Asset Management SPA SGR | 28.748 | 5,33 | 2.103 | 16,90 | ||||
| 2026-04-10 | 13F | Abound Wealth Management | 1 | 0 | ||||||
| 2026-04-17 | 13F | HHM Wealth Advisors, LLC | 30 | 2 | ||||||
| 2026-02-12 | 13F | Scotia Capital Inc. | 353.344 | -14,43 | 18.779 | -3,12 | ||||
| 2026-02-03 | 13F | Ethic Inc. | 4.683 | -2,21 | 250 | 10,18 | ||||
| 2026-02-03 | 13F | Mitsubishi UFJ Kokusai Asset Management Co., Ltd. | 6.325 | -23,42 | 346 | -11,76 | ||||
| 2025-11-13 | 13F | Macquarie Group Ltd | 0 | -100,00 | 0 | -100,00 | ||||
| 2026-02-13 | 13F | Victory Capital Management Inc | 0 | -100,00 | 0 | |||||
| 2026-02-05 | 13F | Western Wealth Management, LLC | 6.459 | 0,54 | 344 | 13,16 | ||||
| 2026-04-16 | 13F | Evolve Private Wealth, Llc | 5.705 | 4,07 | 318 | 8,90 | ||||
| 2026-02-17 | 13F | Citadel Advisors Llc | Put | 69.600 | -74,72 | 3.710 | -71,56 | |||
| 2026-02-17 | 13F | Citadel Advisors Llc | Call | 128.400 | -35,77 | 6.844 | -27,75 | |||
| 2026-04-21 | 13F | Wasatch Advisors Inc | 9.067 | 13,39 | 506 | 18,78 | ||||
| 2026-02-17 | 13F | Mork Capital Management, LLC | 54.000 | 0,00 | 2.878 | 12,51 | ||||
| 2026-02-13 | 13F | Colony Group, LLC | 7.551 | 74,31 | 403 | 96,10 | ||||
| 2026-02-17 | 13F | Citadel Advisors Llc | 57.475 | 3.063 | ||||||
| 2026-02-09 | 13F | Geode Capital Management, Llc | 2.426.843 | 6,81 | 128.774 | 20,36 | ||||
| 2026-02-10 | 13F | Quantbot Technologies LP | 44.199 | -77,89 | 2.356 | -75,13 | ||||
| 2026-02-03 | 13F | ASR Vermogensbeheer N.V. | 9.249 | 0,00 | 494 | 12,56 | ||||
| 2026-04-07 | 13F | Eastern Bank | 0 | -100,00 | 0 | |||||
| 2026-02-14 | 13F | Rockefeller Capital Management L.P. | 350.502 | 32,73 | 18.634 | 48,93 | ||||
| 2026-02-17 | 13F | PDT Partners, LLC | 14.000 | 746 |