Grundlæggende statistik
| Institutionelle ejere | 463 total, 447 long only, 0 short only, 16 long/short - change of -20,72% MRQ |
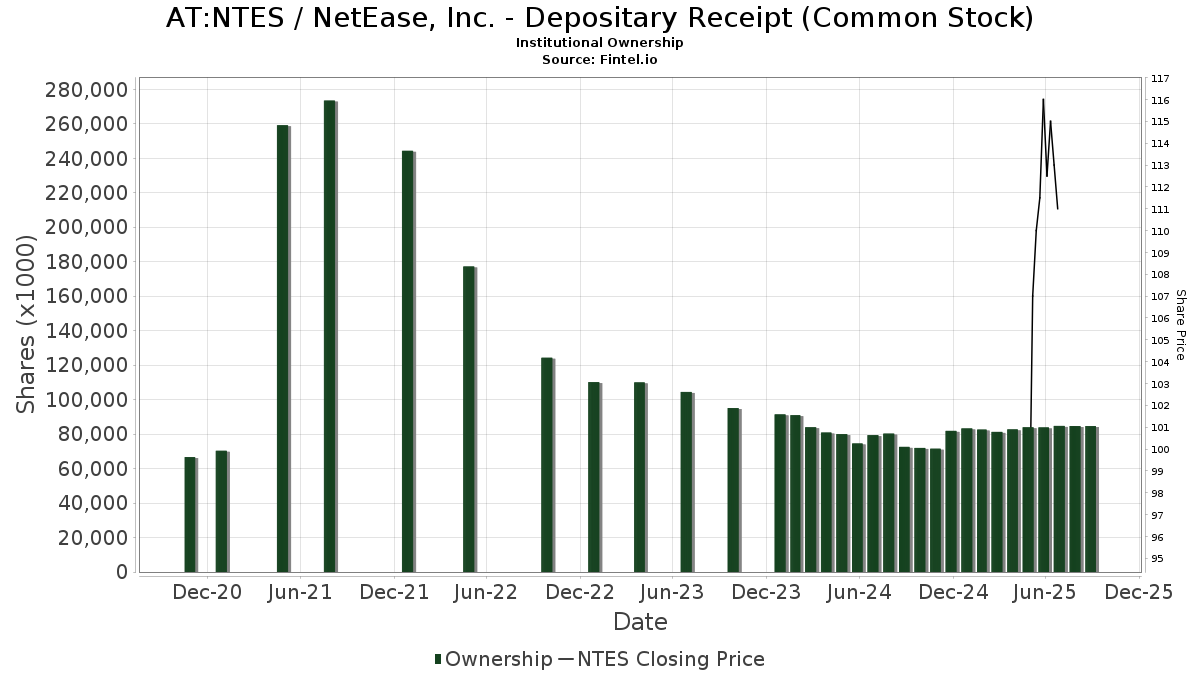
| Del pris | 94,00 |
| Gennemsnitlig porteføljeallokering | 0.1897 % - change of -56,69% MRQ |
| Institutionelle aktier (lange) | 56.034.570 (ex 13D/G) - change of -12,92MM shares -18,74% MRQ |
| Institutionel værdi (lang) | $ 7.135.875 USD ($1000) |
Institutionelt ejerskab og aktionærer
NetEase, Inc. - Depositary Receipt (Common Stock) (AT:NTES) har 463 institutionelle ejere og aktionærer, der har indsendt 13D/G- eller 13F-formularer til Securities Exchange Commission (SEC). Disse institutioner har i alt 56,034,570 aktier. Største aktionærer omfatter Ubs Asset Management Americas Inc, Ninety One UK Ltd, Orbis Allan Gray Ltd, Greenwoods Asset Management Hong Kong Ltd., Harding Loevner Lp, Dodge & Cox, Fmr Llc, Capital World Investors, Invesco Ltd., and Arrowstreet Capital, Limited Partnership .
NetEase, Inc. - Depositary Receipt (Common Stock) (WBAG:NTES) institutionel ejerskabsstruktur viser aktuelle positioner i virksomheden efter institutioner og fonde, samt seneste ændringer i positionsstørrelse. Større aktionærer kan omfatte individuelle investorer, investeringsforeninger, hedgefonde eller institutioner. Skema 13D angiver, at investoren besidder (eller besidder) mere end 5 % af virksomheden og har til hensigt (eller har til hensigt at) aktivt at forfølge en ændring i forretningsstrategi. Skema 13G indikerer en passiv investering på over 5%.
The share price as of April 24, 2026 is 94,00 / share. Previously, on May 9, 2025, the share price was 92,80 / share. This represents an increase of 1,29% over that period.
Fondens stemningsscore
Fund Sentiment Score (fka Ownership Accumulation Score) finder de aktier, der bliver mest købt af fonde. Det er resultatet af en sofistikeret, multi-faktor kvantitativ model, der identificerer virksomheder med de højeste niveauer af institutionel akkumulering. Scoringsmodellen bruger en kombination af den samlede stigning i oplyste ejere, ændringerne i porteføljeallokeringer i disse ejere og andre målinger. Tallet går fra 0 til 100, hvor højere tal indikerer et højere niveau af akkumulering for sine jævnaldrende, og 50 er gennemsnittet.
Opdateringsfrekvens: Dagligt
Se Ownership Explorer, som giver en liste over højest rangerende virksomheder.
AI+ Ask Fintel’s AI assistant about NetEase, Inc. - Depositary Receipt (Common Stock).
Select a question to share a public post with an AI-crafted answer.
Thinking of good questions…
13F og NPORT arkivering
Detaljer om 13F-arkivering er gratis. Detaljer om NP-ansøgninger kræver et premium-medlemskab. Grønne rækker angiver nye positioner. Røde rækker angiver lukkede positioner. Klik på linket ikon for at se den fulde transaktionshistorik.
Opgrader
for at låse premium-data op og eksportere til Excel ![]() .
.
| Fil dato | Kilde | Investor | Type | Gennemsnitlig pris (Øst) |
Aktier | Δ Aktier (%) |
Rapporteret Værdi ($1000) |
Δ Værdi (%) |
Port Alloc (%) |
|
|---|---|---|---|---|---|---|---|---|---|---|
| 2026-04-15 | 13F | Hartford Financial Management Inc. | 30 | 0,00 | 3 | -25,00 | ||||
| 2026-02-13 | 13F | Wells Fargo & Company/mn | 52.041 | 18,70 | 7.162 | 7,47 | ||||
| 2026-01-07 | 13F | Sagespring Wealth Partners, Llc | 1.555 | 1,24 | 214 | -8,15 | ||||
| 2026-02-13 | 13F | Aurora Investment Counsel | 16.406 | -14,52 | 2.258 | -22,63 | ||||
| 2026-02-12 | 13F | Hollencrest Capital Management | 0 | -100,00 | 0 | |||||
| 2026-02-17 | 13F | D. E. Shaw & Co., Inc. | 115.674 | 89,65 | 15.919 | 71,73 | ||||
| 2026-01-23 | 13F | Westside Investment Management, Inc. | 347 | 5,15 | 51 | 4,08 | ||||
| 2026-02-17 | 13F | GAM Holding AG | 10.903 | 35,58 | 1.500 | 22,75 | ||||
| 2026-02-12 | 13F | Renaissance Technologies Llc | 1.088.688 | 0,52 | 149.825 | -8,99 | ||||
| 2026-02-13 | 13F | Pinnacle Wealth Planning Services, Inc. | 232 | 32 | ||||||
| 2026-04-17 | 13F | AdvisorNet Financial, Inc | 1.941 | 22,77 | 217 | 0,00 | ||||
| 2026-02-12 | 13F | Marex Group plc | 1.826 | 251 | ||||||
| 2026-02-17 | 13F | Wellington Management Group Llp | 555.948 | -2,63 | 76.510 | -11,84 | ||||
| 2026-02-10 | 13F | Daiwa Securities Group Inc. | 5.700 | 29,55 | 1 | |||||
| 2026-02-12 | 13F | Penserra Capital Management LLC | 7.955 | -3,29 | 1 | 0,00 | ||||
| 2025-11-13 | 13F | Mark Sheptoff Financial Planning, Llc | 0 | -100,00 | 0 | |||||
| 2026-02-03 | 13F | NewEdge Wealth, LLC | 22.434 | 5,08 | 3.087 | 3,97 | ||||
| 2026-02-03 | 13F | Manning & Napier Advisors Llc | 39.607 | -2,29 | 5.563 | -9,72 | ||||
| 2026-03-27 | 13F | Prosperity Wealth Management, Inc. | 0 | -100,00 | 0 | |||||
| 2026-02-09 | 13F | Atlantic Trust, LLC | 0 | -100,00 | 0 | |||||
| 2026-01-13 | 13F | Guerra Pan Advisors, Llc | 9.555 | 0,00 | 1.315 | -9,50 | ||||
| 2025-10-30 | 13F | Ridgewood Investments LLC | Call | 0 | -100,00 | 0 | -100,00 | |||
| 2026-02-05 | 13F | Atria Investments Llc | 8.134 | 44,12 | 1.119 | 30,57 | ||||
| 2026-01-27 | 13F | WealthCollab, LLC | 54 | 0,00 | 7 | -12,50 | ||||
| 2026-02-13 | 13F | Verition Fund Management LLC | 1.674 | -12,77 | 230 | -20,96 | ||||
| 2026-02-10 | 13F | Guardcap Asset Management Ltd | 16.415 | -16,72 | 2.259 | -24,57 | ||||
| 2026-02-13 | 13F | Verition Fund Management LLC | Put | 15.000 | -53,56 | 2.064 | -57,95 | |||
| 2026-02-13 | 13F | Verition Fund Management LLC | Call | 7.400 | -50,34 | 1.018 | -55,04 | |||
| 2026-04-21 | 13F | Maseco Llp | 0 | -100,00 | 0 | |||||
| 2025-11-14 | 13F | Boothbay Fund Management, Llc | Call | 0 | -100,00 | 0 | -100,00 | |||
| 2025-11-14 | 13F | Strategic Wealth Partners, Ltd. | 37 | 6 | ||||||
| 2026-02-13 | 13F | Prudential Financial Inc | 4.400 | -6,38 | 606 | -15,27 | ||||
| 2026-02-17 | 13F | Millennium Management Llc | Call | 47.400 | -81,47 | 6.523 | -83,22 | |||
| 2026-02-17 | 13F | Millennium Management Llc | Put | 5.000 | 0,00 | 688 | -9,35 | |||
| 2026-02-11 | 13F | Simplex Trading, Llc | Put | 17.800 | -56,05 | 2.450 | 40.716,67 | |||
| 2026-02-11 | 13F | Simplex Trading, Llc | Call | 12.600 | -28,00 | 1.734 | 86.600,00 | |||
| 2026-02-12 | 13F | BRYN MAWR TRUST Co | 0 | -100,00 | 0 | -100,00 | ||||
| 2026-02-17 | 13F | Millennium Management Llc | 386.811 | 156,75 | 53.233 | 132,47 | ||||
| 2026-01-30 | 13F | Mitsubishi UFJ Trust & Banking Corp | 67.211 | 22,12 | 9.250 | 10,57 | ||||
| 2026-04-06 | 13F | InTrack Investment Management Inc | 8.724 | 69,17 | 977 | 37,66 | ||||
| 2026-02-02 | 13F | Qrg Capital Management, Inc. | 6.723 | 7,77 | 925 | -2,43 | ||||
| 2026-02-05 | 13F | Allworth Financial LP | 199 | -72,28 | 27 | -75,23 | ||||
| 2026-01-28 | 13F | DekaBank Deutsche Girozentrale | 9.200 | 0,00 | 1 | -100,00 | ||||
| 2026-02-13 | 13F | Mariner, LLC | 47.277 | -0,51 | 6.508 | -9,89 | ||||
| 2026-04-22 | 13F | Pinnacle Bancorp, Inc. | 455 | 0,00 | 51 | -19,35 | ||||
| 2026-01-30 | 13F | BancorpSouth Bank | 8.255 | 0,00 | 1.136 | -9,41 | ||||
| 2026-02-13 | 13F | SRS Capital Advisors, Inc. | 594 | 607,14 | 82 | 575,00 | ||||
| 2025-11-14 | 13F | Wetherby Asset Management Inc | 10.739 | -1,10 | 1.632 | 11,70 | ||||
| 2026-04-14 | 13F | Prospera Financial Services Inc | 10.163 | -0,31 | 1.137 | -18,90 | ||||
| 2026-03-04 | 13F | Rehmann Capital Advisory Group | 2.538 | 24,47 | 352 | 13,92 | ||||
| 2026-04-24 | 13F | UMA Financial Services, Inc. | 6 | -53,85 | 1 | -100,00 | ||||
| 2026-02-12 | 13F | Skopos Labs, Inc. | 16.256 | 170,98 | 2.265 | 184,91 | ||||
| 2025-11-12 | 13F | CIBC Bancorp USA Inc. | 1.566 | 238 | ||||||
| 2026-01-15 | 13F | Lodestone Wealth Management LLC | 6 | 1 | ||||||
| 2026-02-11 | 13F | Capital World Investors | 1.507.792 | -2,91 | 207.502 | -12,09 | ||||
| 2026-04-02 | 13F | Byrne Asset Management LLC | 215 | -2,27 | 24 | -20,00 | ||||
| 2026-02-05 | 13F | Elyxium Wealth, LLC | 37 | 5 | ||||||
| 2026-04-15 | 13F | Exchange Traded Concepts, Llc | 33.773 | -14,52 | 3.781 | -30,48 | ||||
| 2026-02-17 | 13F | Tower Research Capital LLC (TRC) | 3.184 | 148,56 | 438 | 125,77 | ||||
| 2026-02-18 | 13F | GWM Advisors LLC | 0 | -100,00 | 0 | |||||
| 2026-01-27 | 13F | Zurcher Kantonalbank (Zurich Cantonalbank) | 1.119 | 10,68 | 154 | 0,00 | ||||
| 2026-02-13 | 13F | Keystone Investors Pte Ltd | 4.546 | 626 | ||||||
| 2026-02-17 | 13F | Orbis Allan Gray Ltd | 3.389.449 | -18,47 | 466.456 | -26,18 | ||||
| 2026-03-03 | 13F/A | Caitong International Asset Management Co., Ltd | 237 | -27,74 | 33 | -34,69 | ||||
| 2026-01-15 | 13F | Gunderson Capital Management Inc. | 0 | -100,00 | 0 | |||||
| 2026-01-26 | 13F | Reyes Financial Architecture, Inc. | 65 | -16,67 | 9 | -27,27 | ||||
| 2025-11-13 | 13F | Hsbc Holdings Plc | Put | 0 | -100,00 | 0 | -100,00 | |||
| 2025-11-13 | 13F | Hsbc Holdings Plc | Call | 0 | -100,00 | 0 | -100,00 | |||
| 2026-04-24 | 13F | TT International Asset Management LTD | 1.908 | 214 | ||||||
| 2026-02-11 | 13F | Capital International Investors | 260.368 | 1,27 | 36.054 | -7,61 | ||||
| 2026-04-16 | 13F | Pine Haven Investment Counsel, Inc | 2.000 | 0,00 | 224 | -18,91 | ||||
| 2026-02-05 | 13F | LGT Fund Management Co Ltd. | 14.900 | 2.093 | ||||||
| 2026-02-13 | 13F | Acumen Wealth Advisors, LLC | 78 | 11 | ||||||
| 2026-04-07 | 13F | Park Avenue Securities Llc | 2.240 | -18,81 | 0 | |||||
| 2026-04-15 | 13F | FNY Investment Advisers, LLC | 0 | -100,00 | 0 | |||||
| 2026-02-02 | 13F | Fifth Third Bancorp | 16.844 | 14,24 | 2.318 | 3,48 | ||||
| 2025-11-14 | 13F | Boothbay Fund Management, Llc | Put | 0 | -100,00 | 0 | -100,00 | |||
| 2025-11-14 | 13F | Main Management ETF Advisors, LLC | 0 | -100,00 | 0 | |||||
| 2026-02-17 | 13F | Cresset Asset Management, LLC | 0 | -100,00 | 0 | -100,00 | ||||
| 2026-02-18 | 13F/A | Empowered Funds, LLC | 1.586 | 218 | ||||||
| 2026-02-10 | 13F | Bank of New York Mellon Corp | 5.833 | -2,18 | 803 | -11,48 | ||||
| 2026-02-13 | 13F | Heron Bay Capital Management | 5.302 | -0,56 | 730 | -10,00 | ||||
| 2026-02-11 | 13F | Axiom International Investors Llc /de | 60.162 | -23,82 | 8.279 | -31,03 | ||||
| 2026-04-13 | 13F | IFP Advisors, Inc | 5 | 1 | ||||||
| 2026-02-17 | 13F | Snowden Capital Advisors LLC | 0 | -100,00 | 0 | |||||
| 2025-11-14 | 13F | Price T Rowe Associates Inc /md/ | 0 | -100,00 | 0 | |||||
| 2026-02-13 | 13F | Dodge & Cox | 2.154.376 | -6,03 | 296.485 | -14,91 | ||||
| 2026-02-13 | 13F | Ieq Capital, Llc | 5.464 | 7,14 | 752 | -3,10 | ||||
| 2026-02-04 | 13F | Legacy Financial Advisors, Inc. | 0 | -100,00 | 0 | |||||
| 2026-02-04 | 13F | MONECO Advisors, LLC | 1.497 | 206 | ||||||
| 2026-02-13 | 13F | Brown Advisory Inc | 4.325 | 595 | ||||||
| 2026-02-13 | 13F/A | Alberta Investment Management Corp | 0 | -100,00 | 0 | -100,00 | ||||
| 2026-04-10 | 13F/A | PBU - The Pension Fund of Early Childhood & Youth Educators | 321.279 | 0,00 | 35.964 | -18,66 | ||||
| 2026-01-15 | 13F | Allspring Global Investments Holdings, LLC | 2.310 | 49,42 | 341 | 47,19 | ||||
| 2026-01-27 | 13F | First Horizon Corp | 320 | 8,47 | 44 | 0,00 | ||||
| 2026-04-21 | 13F | Guinness Asset Management LTD | 77.374 | 10,63 | 8.661 | -11,12 | ||||
| 2026-02-18 | 13F | Beacon Pointe Advisors, LLC | Call | 5.000 | 127,27 | 688 | 105,99 | |||
| 2026-02-04 | 13F | Pacer Advisors, Inc. | 0 | -100,00 | 0 | |||||
| 2026-01-22 | 13F | Massachusetts Financial Services Co /ma/ | 1.217.124 | -2,72 | 167.501 | -11,92 | ||||
| 2026-02-13 | 13F | Panagora Asset Management Inc | 13.655 | -0,91 | 1.879 | -10,27 | ||||
| 2026-02-17 | 13F | Public Employees Retirement System Of Ohio | 105.480 | 0,00 | 14.516 | -9,45 | ||||
| 2026-02-17 | 13F | Harding Loevner Lp | 2.476.401 | -2,57 | 340.840 | -11,77 | ||||
| 2026-02-17 | 13F | Polar Capital Holdings Plc | 1.750 | 0,00 | 241 | -9,43 | ||||
| 2026-02-19 | 13F | Mcguire Capital Advisors Inc | 912 | 126 | ||||||
| 2026-01-29 | 13F | WT Asset Management Ltd | 0 | -100,00 | 0 | |||||
| 2026-02-11 | 13F | Stirlingshire Investments, Inc. | 3.122 | 430 | ||||||
| 2026-02-11 | 13F | Prestige Wealth Management Group LLC | 10 | 0,00 | 1 | 0,00 | ||||
| 2026-02-05 | 13F | May Hill Capital, LLC | 5.746 | 112,42 | 791 | 92,21 | ||||
| 2026-01-23 | 13F | LOM Asset Management Ltd | 230 | 0,00 | 32 | -11,43 | ||||
| 2026-01-21 | 13F | Greenleaf Trust | 2.000 | 3,04 | 275 | -6,78 | ||||
| 2026-02-02 | 13F | Davis Selected Advisers | 426.164 | -28,34 | 58.649 | -35,12 | ||||
| 2026-02-18 | 13F | Beacon Pointe Advisors, LLC | 122 | -52,90 | 17 | -58,97 | ||||
| 2026-02-06 | 13F | Gsa Capital Partners Llp | 0 | -100,00 | 0 | |||||
| 2026-02-10 | 13F | Parametrica Management Ltd | 0 | -100,00 | 0 | |||||
| 2025-11-13 | 13F | Connor, Clark & Lunn Investment Management Ltd. | 0 | -100,00 | 0 | |||||
| 2026-02-17 | 13F | Tiger Pacific Capital LP | 0 | -100,00 | 0 | |||||
| 2026-02-13 | 13F | Resources Investment Advisors, LLC. | 2.088 | -2,20 | 287 | -11,42 | ||||
| 2026-02-13 | 13F | Arkadios Wealth Advisors | 1.859 | 5,87 | 256 | -4,14 | ||||
| 2026-02-13 | 13F | Integrated Wealth Concepts LLC | 0 | -100,00 | 0 | |||||
| 2026-01-27 | 13F | Evergreen Capital Management Llc | 0 | -100,00 | 0 | |||||
| 2026-02-19 | 13F | Atomi Financial Group, Inc. | 14.041 | 15,96 | 1.932 | 5,00 | ||||
| 2026-02-10 | 13F | Acadian Asset Management Llc | 16.665 | -23,44 | 2 | -33,33 | ||||
| 2026-02-17 | 13F | RMB Capital Management, LLC | 4.757 | -17,21 | 655 | -25,09 | ||||
| 2026-01-22 | 13F | Harwood Advisory Group, LLC | 15 | 0,00 | 2 | 0,00 | ||||
| 2026-04-03 | 13F | Ridgewood Investments LLC | 8.228 | 7,35 | 921 | -20,94 | ||||
| 2026-04-22 | 13F | Janney Montgomery Scott LLC | 5.395 | -65,26 | 1 | -100,00 | ||||
| 2026-02-13 | 13F | MAI Capital Management | 3.079 | 0,00 | 424 | -9,42 | ||||
| 2026-02-09 | 13F | Geode Capital Management, Llc | 71.004 | -4,27 | 9.772 | -13,32 | ||||
| 2026-02-17 | 13F | Boothbay Fund Management, Llc | 2.420 | 10,40 | 333 | 0,00 | ||||
| 2026-04-13 | 13F | Trust Co | 2 | 0,00 | 0 | |||||
| 2026-04-21 | 13F | PDS Planning, Inc | 2.144 | 4,33 | 240 | -15,25 | ||||
| 2026-02-02 | 13F | Ativo Capital Management LLC | 37.086 | -10,28 | 5.104 | -18,77 | ||||
| 2026-02-17 | 13F | Cape Investment Advisory, Inc. | 11 | 2 | ||||||
| 2026-02-12 | 13F | New York State Common Retirement Fund | 97.386 | -30,31 | 13.402 | -36,90 | ||||
| 2026-04-16 | 13F | Davis Capital Management | 500 | 0,00 | 56 | -19,12 | ||||
| 2025-10-29 | 13F | Stegent Equity Advisors, Inc. | 0 | -100,00 | 0 | |||||
| 2026-02-11 | 13F | Erste Asset Management GmbH | 0 | 0 | ||||||
| 2026-02-09 | 13F | Expressive Wealth LLC | 2.764 | 380 | ||||||
| 2026-02-11 | 13F | Capital Wealth Planning, LLC | 105.551 | 37,52 | 15.575 | 33,52 | ||||
| 2026-02-13 | 13F | Transamerica Financial Advisors, Inc. | 21 | -97,11 | 3 | -98,18 | ||||
| 2026-03-17 | 13F/A | Barclays Plc | Call | 0 | -100,00 | 0 | -100,00 | |||
| 2026-02-12 | 13F | Pitcairn Co | 0 | -100,00 | 0 | |||||
| 2026-01-29 | 13F | Kestra Private Wealth Services, Llc | 0 | -100,00 | 0 | |||||
| 2026-02-12 | 13F | Wealthspire Advisors, LLC | 0 | -100,00 | 0 | |||||
| 2025-11-06 | 13F | Financial Advocates Investment Management | 0 | -100,00 | 0 | |||||
| 2026-02-19 | 13F | Invesco Ltd. | 1.219.347 | -9,75 | 167.807 | -18,29 | ||||
| 2026-02-05 | 13F | Bank Julius Baer & Co. Ltd, Zurich | 6.900 | 950 | ||||||
| 2026-04-08 | 13F | Legacy Wealth Asset Management, LLC | 6.136 | 75,51 | 687 | 42,62 | ||||
| 2025-11-04 | 13F | IMC-Chicago, LLC | 0 | -100,00 | 0 | -100,00 | ||||
| 2026-01-28 | 13F | Salomon & Ludwin, LLC | 3 | 0,00 | 0 | |||||
| 2026-01-27 | 13F | TD Waterhouse Canada Inc. | 856 | 91,93 | 118 | 77,27 | ||||
| 2026-02-11 | 13F | West Family Investments, Inc. | 3.114 | 0,00 | 429 | -9,51 | ||||
| 2026-02-09 | 13F | Choate Investment Advisors | 1.718 | 0,00 | 236 | -9,58 | ||||
| 2026-04-20 | 13F | Ronald Blue Trust, Inc. | 3.159 | -5,45 | 354 | -23,09 | ||||
| 2026-02-11 | 13F | Group One Trading, L.p. | Put | 7.100 | -28,28 | 977 | -35,04 | |||
| 2026-02-17 | 13F | Bank Of America Corp /de/ | 626.999 | 18,73 | 86.288 | 7,50 | ||||
| 2026-02-11 | 13F | Group One Trading, L.p. | Call | 62.700 | 3,12 | 8.629 | -6,62 | |||
| 2026-02-17 | 13F | Jones Financial Companies Lllp | 6.468 | -1,93 | 890 | -8,53 | ||||
| 2026-02-09 | 13F | Todd Asset Management Llc | 336.485 | -1,01 | 46.308 | -10,37 | ||||
| 2026-02-11 | 13F | Simplex Trading, Llc | 0 | -100,00 | 0 | -100,00 | ||||
| 2026-02-13 | 13F | Lavaca Capital Llc | 210 | 0,00 | 29 | -9,68 | ||||
| 2026-02-03 | 13F | Crossmark Global Holdings, Inc. | 123.275 | -0,01 | 16.965 | -9,46 | ||||
| 2026-02-05 | 13F | Thrivent Financial For Lutherans | 77.502 | -6,94 | 11 | -16,67 | ||||
| 2026-02-06 | 13F | Greenwoods Asset Management Hong Kong Ltd. | 3.212.200 | 0,00 | 442.063 | -9,45 | ||||
| 2026-02-17 | 13F | BTG Pactual Asset Management US LLC | 1.457 | 201 | ||||||
| 2026-02-02 | 13F | Truist Financial Corp | 33.539 | 7,89 | 4.616 | -2,31 | ||||
| 2026-02-13 | 13F | Causeway Capital Management Llc | 0 | -100,00 | 0 | |||||
| 2026-02-10 | 13F | Bnp Paribas Arbitrage, Sa | Call | 0 | -100,00 | 0 | -100,00 | |||
| 2026-02-12 | 13F | Alps Advisors Inc | 5.725 | -2,40 | 788 | -11,67 | ||||
| 2026-04-21 | 13F | Moseley Investment Management Inc | 1.900 | -5,00 | 213 | -22,91 | ||||
| 2026-02-13 | 13F | Atlas Capital Advisors Llc | 338 | 0,00 | 47 | 2,22 | ||||
| 2025-11-14 | 13F | Arrowpoint Investment Partners (Singapore) Pte. Ltd. | 0 | -100,00 | 0 | |||||
| 2026-04-24 | 13F | Ninety One North America, Inc. | 505.933 | 1,14 | 56.634 | -17,73 | ||||
| 2026-02-11 | 13F | IMA Wealth, Inc. | 17 | 2 | ||||||
| 2026-02-17 | 13F | Balyasny Asset Management Llc | Call | 1.600 | -5,88 | 220 | -14,73 | |||
| 2025-11-14 | 13F | Arrowpoint Investment Partners (Singapore) Pte. Ltd. | Put | 0 | -100,00 | 0 | ||||
| 2026-02-17 | 13F | Balyasny Asset Management Llc | 119.303 | 16.418 | ||||||
| 2026-02-10 | 13F | Fideuram Asset Management (Ireland) dac | 5.367 | 544 | ||||||
| 2026-02-11 | 13F | OPTIMAS CAPITAL Ltd | 30.477 | -50,92 | 4.194 | -55,56 | ||||
| 2026-04-01 | 13F | Bangor Savings Bank | 0 | -100,00 | 0 | |||||
| 2026-01-29 | 13F | Calamos Advisors LLC | Call | 0 | -100,00 | 0 | ||||
| 2025-11-14 | 13F | Point72 Asset Management, L.P. | 0 | -100,00 | 0 | -100,00 | ||||
| 2026-04-09 | 13F | Park Place Capital Corp | 73 | -8,75 | 8 | -27,27 | ||||
| 2026-02-06 | 13F | Larson Financial Group LLC | 54 | 8,00 | 7 | 0,00 | ||||
| 2026-02-05 | 13F | Burford Brothers, Inc. | 2.058 | 0,00 | 283 | -9,29 | ||||
| 2026-02-10 | 13F | State of Wyoming | 710 | 98 | ||||||
| 2026-04-22 | 13F | Spire Wealth Management | 200 | -54,13 | 22 | -63,33 | ||||
| 2025-11-14 | 13F | Squarepoint Ops LLC | Put | 0 | -100,00 | 0 | -100,00 | |||
| 2026-02-17 | 13F | Captrust Financial Advisors | 13.112 | 72,50 | 1.804 | 56,19 | ||||
| 2026-04-15 | 13F | Financial Management Professionals, Inc. | 181 | 0,00 | 20 | -16,67 | ||||
| 2026-02-10 | 13F | Jupiter Asset Management Ltd | 27.539 | -2,10 | 3.790 | -11,37 | ||||
| 2025-11-14 | 13F | Axa S.a. | 0 | -100,00 | 0 | |||||
| 2026-04-20 | 13F | Banque Cantonale Vaudoise | 4.398 | -4,83 | 492 | -22,64 | ||||
| 2026-02-17 | 13F | DZ BANK AG Deutsche Zentral Genossenschafts Bank, Frankfurt am Main | 8 | 0,00 | 1 | 0,00 | ||||
| 2026-02-05 | 13F | Cambridge Investment Research Advisors, Inc. | 4.710 | 2,97 | 1 | |||||
| 2026-02-17 | 13F | Fmr Llc | 1.867.943 | 76,58 | 257.066 | 59,89 | ||||
| 2025-11-14 | 13F | Squarepoint Ops LLC | 0 | -100,00 | 0 | -100,00 | ||||
| 2026-04-06 | 13F | Highline Wealth Partners Llc | 523 | -11,05 | 59 | -27,50 | ||||
| 2026-02-02 | 13F | Benjamin Edwards Inc | 0 | -100,00 | 0 | |||||
| 2026-04-15 | 13F | Trust Point Inc. | 3.214 | 0,00 | 360 | -18,78 | ||||
| 2026-02-13 | 13F | Barclays Plc | 14.527 | -29,63 | 1.999 | -36,28 | ||||
| 2026-03-03 | 13F/A | Ovata Capital Management Ltd | 6.800 | -73,12 | 937 | -75,66 | ||||
| 2026-04-14 | 13F | BSW Wealth Partners | 2.147 | 240 | ||||||
| 2026-02-24 | 13F | MidFirst Bank | 412 | 3 | ||||||
| 2026-02-17 | 13F | Two Sigma Advisers, Lp | 10.100 | 236,67 | 1.390 | 205,27 | ||||
| 2026-02-17 | 13F | Prelude Capital Management, Llc | 3.927 | -36,06 | 540 | -42,12 | ||||
| 2026-02-03 | 13F | SBI Securities Co., Ltd. | 830 | 5,20 | 114 | -4,20 | ||||
| 2026-02-09 | 13F | Morningstar Investment Management LLC | 0 | -100,00 | 0 | -100,00 | ||||
| 2026-02-12 | 13F | Quadrant Capital Group Llc | 2.562 | -3,83 | 353 | -12,87 | ||||
| 2026-02-17 | 13F | Blair William & Co/il | 2.552 | 51,45 | 351 | 37,11 | ||||
| 2026-04-24 | 13F | Yousif Capital Management, Llc | 3.497 | 0,00 | 391 | -18,37 | ||||
| 2026-02-09 | 13F | Main Street Research LLC | 4.000 | -2,08 | 550 | -11,29 | ||||
| 2026-02-11 | 13F | Cookson Peirce & Co Inc | 4.961 | 2,18 | 683 | -7,46 | ||||
| 2026-04-21 | 13F | Vise Technologies, Inc. | 7.507 | 0,00 | 1.033 | 0,00 | ||||
| 2026-02-13 | 13F | State Street Corp | 34.956 | -44,58 | 4.811 | -49,82 | ||||
| 2026-04-21 | 13F | Financial Consulate, Inc | 75 | 1.150,00 | 8 | |||||
| 2026-02-12 | 13F | Callan Family Office, LLC | 11.446 | 68,10 | 1.575 | 52,32 | ||||
| 2026-02-17 | 13F | Northern Trust Corp | 551.628 | 7,46 | 75.915 | -2,70 | ||||
| 2026-01-15 | 13F | Range Financial Group LLC | 12.781 | 1.759 | ||||||
| 2026-02-11 | 13F | Franklin Resources Inc | 10.339 | -0,03 | 1.423 | -9,48 | ||||
| 2026-02-03 | 13F | Sequoia Financial Advisors, LLC | 6.170 | 0,31 | 849 | -9,10 | ||||
| 2026-02-17 | 13F | Citadel Advisors Llc | 10.405 | 1.432 | ||||||
| 2026-02-17 | 13F | Citadel Advisors Llc | Call | 30.700 | -20,88 | 4.225 | -28,37 | |||
| 2026-01-26 | 13F | KBC Group NV | 42.308 | 0,00 | 6 | -16,67 | ||||
| 2026-01-29 | 13F | Matthews International Capital Management Llc | 23.901 | 0,95 | 3.289 | -8,59 | ||||
| 2026-01-08 | 13F | Maridea Wealth Management LLC | 0 | -100,00 | 0 | |||||
| 2026-01-16 | 13F | TB Alternative Assets Ltd. | 0 | -100,00 | 0 | -100,00 | ||||
| 2026-02-17 | 13F | Citadel Advisors Llc | Put | 32.300 | -31,28 | 4.445 | -37,77 | |||
| 2026-02-10 | 13F | Ilmarinen Mutual Pension Insurance Co | 27.452 | 0,00 | 4 | -25,00 | ||||
| 2026-02-06 | 13F | Leonteq Securities AG | 4.790 | 81,16 | 659 | 64,34 | ||||
| 2026-02-24 | 13F | SG Trading Solutions, LLC | 3.567 | 0 | ||||||
| 2026-02-05 | 13F | Bessemer Group Inc | 139 | 178,00 | 0 | |||||
| 2025-11-14 | 13F | Schonfeld Strategic Advisors LLC | 0 | -100,00 | 0 | -100,00 | ||||
| 2026-01-30 | 13F | Valued Wealth Advisors LLC | 4 | 0,00 | 1 | |||||
| 2026-02-03 | 13F | Legacy Wealth Managment, LLC/ID | 17 | 0,00 | 2 | 0,00 | ||||
| 2026-02-17 | 13F | Shelton Capital Management | 5.134 | -31,46 | 707 | -37,96 | ||||
| 2026-04-24 | 13F | Keybank National Association/oh | 7.565 | 3,09 | 847 | -16,15 | ||||
| 2026-02-13 | 13F | Kestra Advisory Services, LLC | 0 | -100,00 | 0 | |||||
| 2026-02-05 | 13F | Td Private Client Wealth Llc | 1.518 | -38,47 | 209 | -44,39 | ||||
| 2026-02-10 | 13F | Mitsubishi UFJ Morgan Stanley Securities Co., Ltd. | 1.575 | 217 | ||||||
| 2026-02-12 | 13F | Aviva Plc | 68.828 | -6,56 | 9.472 | -15,39 | ||||
| 2026-01-29 | 13F | China Universal Asset Management Co., Ltd. | 26.100 | 0,00 | 3.592 | -9,46 | ||||
| 2026-02-13 | 13F | Polymer Capital Management (HK) LTD | 30.007 | 39,57 | 4.130 | 26,39 | ||||
| 2026-02-13 | 13F | Stifel Financial Corp | 26.282 | 25,68 | 3.617 | 13,78 | ||||
| 2026-01-08 | 13F | Tuttle Tactical Management LLC | 4.951 | 681 | ||||||
| 2025-10-30 | 13F | Twin Peaks Wealth Advisors, LLC | 0 | -100,00 | 0 | |||||
| 2026-02-02 | 13F | Cornerstone Planning Group LLC | 35 | -84,02 | 5 | -98,32 | ||||
| 2026-02-13 | 13F | Pathstone Holdings, LLC | 5.019 | 35,61 | 691 | 22,78 | ||||
| 2026-01-27 | 13F | Novem Group | 0 | -100,00 | 0 | |||||
| 2026-04-24 | 13F | Medallion Wealth Advisors, LLC | 52 | 0,00 | 6 | -28,57 | ||||
| 2026-02-17 | 13F | FIL Ltd | 0 | -100,00 | 0 | |||||
| 2026-02-06 | 13F | Fischer Financial Services, Inc. | 5.000 | 0,00 | 688 | -9,35 | ||||
| 2026-04-06 | 13F | Versant Capital Management, Inc | 19 | 2 | ||||||
| 2026-02-12 | 13F | Federation des caisses Desjardins du Quebec | 782 | 18,31 | 108 | 7,00 | ||||
| 2025-11-06 | 13F | Abc Arbitrage Sa | 0 | -100,00 | 0 | |||||
| 2026-01-12 | 13F | Daymark Wealth Partners, Llc | 1.660 | -0,06 | 228 | -9,52 | ||||
| 2026-04-13 | 13F | True Wealth Design, LLC | 7 | -82,05 | 1 | -100,00 | ||||
| 2026-01-15 | 13F | Nisa Investment Advisors, Llc | 106 | 41,33 | 15 | 27,27 | ||||
| 2026-02-09 | 13F | William Blair Investment Management, Llc | 7.037 | 169,51 | 968 | 144,44 | ||||
| 2026-02-11 | 13F | J.Safra Asset Management Corp | 19 | 3 | ||||||
| 2025-11-13 | 13F | J Hagan Capital, Inc. | 0 | -100,00 | 0 | |||||
| 2026-01-08 | 13F | Fulton Bank, N.a. | 0 | -100,00 | 0 | |||||
| 2026-02-17 | 13F | Old Mission Capital Llc | 19.993 | 2.751 | ||||||
| 2026-01-23 | 13F | Assetmark, Inc | 130.869 | 169,52 | 18.010 | 144,04 | ||||
| 2026-02-11 | 13F | Capital International Sarl | 12.031 | -0,97 | 1.656 | -10,35 | ||||
| 2026-04-17 | 13F | Hanson & Doremus Investment Management | 1.963 | 0,00 | 0 | |||||
| 2026-02-10 | 13F | Natixis Advisors, L.p. | 49.552 | -39,42 | 7 | -50,00 | ||||
| 2026-02-12 | 13F | Advisors Asset Management, Inc. | 16.285 | 5,03 | 2.241 | -4,88 | ||||
| 2025-11-14 | 13F | Brandes Investment Partners, Lp | 0 | -100,00 | 0 | -100,00 | ||||
| 2026-04-16 | 13F | BI Asset Management Fondsmaeglerselskab A/S | 340.241 | 0,11 | 38 | -17,39 | ||||
| 2026-01-21 | 13F | Newbridge Financial Services Group, Inc. | 0 | -100,00 | 0 | |||||
| 2026-03-10 | 13F | MY.Alpha Management HK Advisors Ltd | 87.871 | 12.093 | ||||||
| 2026-04-24 | 13F | Strs Ohio | 353 | -9,49 | 40 | -26,42 | ||||
| 2026-02-11 | 13F | Jpmorgan Chase & Co | 258.790 | 207,21 | 35.615 | 178,17 | ||||
| 2026-02-11 | 13F | Jpmorgan Chase & Co | Put | 15.000 | 0,00 | 2.064 | -9,43 | |||
| 2026-02-03 | 13F | Ballentine Partners, LLC | 4.837 | 9,51 | 666 | -0,89 | ||||
| 2026-02-13 | 13F | Kayne Anderson Rudnick Investment Management Llc | 7 | -98,10 | 1 | -100,00 | ||||
| 2026-02-17 | 13F | Banco Bilbao Vizcaya Argentaria, S.a. | 0 | -100,00 | 0 | |||||
| 2026-01-27 | 13F | Regions Financial Corp | 3.378 | 0,33 | 465 | -9,20 | ||||
| 2026-02-05 | 13F | Park Square Financial Group, LLC | 0 | -100,00 | 0 | |||||
| 2026-04-15 | 13F | Myriad Asset Management US LP | 0 | -100,00 | 0 | |||||
| 2025-11-14 | 13F | ExodusPoint Capital Management, LP | 0 | -100,00 | 0 | |||||
| 2026-02-09 | 13F | Fisher Asset Management, LLC | 1.112.284 | -1,83 | 153.073 | -11,11 | ||||
| 2025-11-14 | 13F | Bayesian Capital Management, LP | 0 | -100,00 | 0 | |||||
| 2026-02-17 | 13F | J. Goldman & Co LP | 0 | -100,00 | 0 | |||||
| 2026-02-06 | 13F | Global Retirement Partners, LLC | 1.368 | -31,36 | 188 | -37,75 | ||||
| 2026-02-02 | 13F | Nkcfo Llc | 2.000 | 0,00 | 0 | |||||
| 2026-02-12 | 13F | Commonwealth Equity Services, Llc | 4.961 | 7,06 | 683 | |||||
| 2026-02-17 | 13F | EFG International AG | 80 | 11 | ||||||
| 2026-02-17 | 13F | Nomura Holdings Inc | 10.428 | -22,83 | 1.435 | -30,10 | ||||
| 2026-02-17 | 13F | Wiley Bros.-aintree Capital, Llc | 6.486 | -27,89 | 893 | -34,70 | ||||
| 2025-10-31 | 13F | Whittier Trust Co | 0 | -100,00 | 0 | |||||
| 2026-02-17 | 13F | Advisor Group Holdings, Inc. | 4.088 | -88,12 | 563 | -88,81 | ||||
| 2025-11-14 | 13F | Binnacle Investments Inc | 61 | 0,00 | 9 | 12,50 | ||||
| 2026-01-23 | 13F | Rsm Us Wealth Management Llc | 5.282 | -19,04 | 742 | -25,23 | ||||
| 2026-04-21 | 13F | One Wealth Advisors, LLC | 3.528 | 0,89 | 395 | -18,09 | ||||
| 2025-10-27 | 13F | RWC Asset Management LLP | 0 | -100,00 | 0 | -100,00 | ||||
| 2026-02-06 | 13F | Profund Advisors Llc | 24.255 | -13,32 | 3.338 | -21,54 | ||||
| 2026-02-13 | 13F | University of Illinois Foundation | 25 | 4 | ||||||
| 2026-04-23 | 13F | Harbor Investment Advisory, Llc | 8.819 | 0,00 | 987 | -18,63 | ||||
| 2026-02-03 | 13F | Ethic Inc. | 2.035 | 44,94 | 280 | 31,46 | ||||
| 2026-02-10 | 13F | Nomura Asset Management Co Ltd | 1.650 | 0,00 | 227 | -9,20 | ||||
| 2026-02-17 | 13F | CastleKnight Management LP | 7.200 | 0,00 | 991 | -9,51 | ||||
| 2026-02-06 | 13F | Pnc Financial Services Group, Inc. | 10.924 | 3,52 | 1.503 | -6,24 | ||||
| 2026-02-13 | 13F | Marshall Wace, Llp | 79.207 | 10.900 | ||||||
| 2026-01-26 | 13F | Cwm, Llc | 845 | 36,51 | 0 | |||||
| 2026-02-13 | 13F | Parkside Financial Bank & Trust | 19 | 0,00 | 3 | 0,00 | ||||
| 2026-04-21 | 13F | Aaron Wealth Advisors LLC | 5.834 | 147,52 | 653 | 101,54 | ||||
| 2026-02-11 | 13F | Capital International Inc /ca/ | 193.997 | 1,94 | 26.698 | -7,70 | ||||
| 2026-02-13 | 13F | Centiva Capital, LP | 0 | -100,00 | 0 | -100,00 | ||||
| 2026-04-14 | 13F | Sanchez Gaunt Capital Management, LLC | 4.069 | 455 | ||||||
| 2026-04-06 | 13F | Washington Trust Advisors, Inc. | 50 | -19,35 | 6 | -37,50 | ||||
| 2026-04-14 | 13F | Thurston, Springer, Miller, Herd & Titak, Inc. | 20 | 0,00 | 2 | 0,00 | ||||
| 2026-02-13 | 13F | Strategic Global Advisors, LLC | 51.376 | -3,38 | 7.070 | -12,52 | ||||
| 2026-02-11 | 13F | Deutsche Bank Ag\ | 71.468 | 111,08 | 9.835 | 91,12 | ||||
| 2026-02-13 | 13F | Hel Ved Capital Management Ltd | 0 | -100,00 | 0 | |||||
| 2026-02-13 | 13F | Sei Investments Co | 10.510 | -62,92 | 1.447 | -66,43 | ||||
| 2026-04-22 | 13F | Larry Mathis Financial Planning, LLC | 2.461 | -0,53 | 275 | -19,12 | ||||
| 2026-01-29 | 13F | Teachers Retirement System Of The State Of Kentucky | 210.900 | 0,00 | 29 | -9,37 | ||||
| 2026-01-30 | 13F | Sigma Planning Corp | 0 | -100,00 | 0 | |||||
| 2026-02-06 | 13F | Envestnet Portfolio Solutions, Inc. | 0 | -100,00 | 0 | |||||
| 2026-02-17 | 13F | TCG Advisory Services, LLC | 0 | -100,00 | 0 | |||||
| 2025-11-14 | 13F | M&t Bank Corp | 0 | -100,00 | 0 | |||||
| 2026-04-20 | 13F | Ritholtz Wealth Management | 11.836 | 24,94 | 1.325 | 1,61 | ||||
| 2026-02-12 | 13F | Steward Partners Investment Advisory, Llc | 1.157 | 0,00 | 159 | -9,14 | ||||
| 2026-02-13 | 13F | Destination Wealth Management | 2.397 | -7,38 | 330 | -16,28 | ||||
| 2026-04-07 | 13F | Signaturefd, Llc | 4.151 | -3,33 | 465 | -21,36 | ||||
| 2026-04-17 | 13F | Boston Private Wealth Llc | 17.444 | -12,46 | 1.953 | -28,81 | ||||
| 2026-02-17 | 13F | LMR Partners LLP | 21.080 | 292,33 | 2.901 | 255,51 | ||||
| 2026-02-17 | 13F | Clark Capital Management Group, Inc. | 0 | -100,00 | 0 | |||||
| 2025-11-12 | 13F | Victory Capital Management Inc | 0 | -100,00 | 0 | |||||
| 2026-04-15 | 13F | Compagnie Lombard Odier SCmA | 800 | 0,00 | 90 | -19,09 | ||||
| 2026-02-13 | 13F | Smartleaf Asset Management LLC | 536 | 17,29 | 75 | 8,70 | ||||
| 2026-02-10 | 13F | Close Asset Management Ltd | 250 | 0,00 | 0 | |||||
| 2026-02-12 | 13F | Campbell & CO Investment Adviser LLC | 0 | -100,00 | 0 | |||||
| 2025-11-14 | 13F | Point72 Asia (Singapore) Pte. Ltd. | 0 | -100,00 | 0 | |||||
| 2026-01-28 | 13F | Financial Perspectives, Inc | 1.821 | 0,00 | 251 | -9,42 | ||||
| 2026-02-13 | 13F | American Century Companies Inc | 927.633 | 15,47 | 127.661 | 4,55 | ||||
| 2026-02-10 | 13F | AdvisorShares Investments LLC | 2.347 | -2,21 | 323 | -11,54 | ||||
| 2026-02-19 | 13F | CI Private Wealth, LLC | 216.200 | 85,24 | 29.737 | 67,63 | ||||
| 2026-01-28 | 13F | Geneos Wealth Management Inc. | 16 | 77,78 | 2 | 100,00 | ||||
| 2026-02-09 | 13F | Accent Capital Management, LLC | 180 | 0,00 | 25 | -11,11 | ||||
| 2026-01-15 | 13F | Frank, Rimerman Advisors LLC | 6.441 | 0,19 | 886 | -9,31 | ||||
| 2025-11-07 | 13F | Gf Fund Management Co. Ltd. | 0 | -100,00 | 0 | |||||
| 2026-04-17 | 13F | Outlook Wealth Advisors, LLC | 2.550 | 0,63 | 285 | -18,10 | ||||
| 2026-02-17 | 13F | Quantinno Capital Management LP | 27.328 | 49,69 | 3.761 | 35,54 | ||||
| 2026-02-02 | 13F | Horizon Investments, LLC | 726 | 100 | ||||||
| 2026-02-17 | 13F | Limestone Investment Advisors LP | 26.467 | 0,00 | 3.642 | -9,45 | ||||
| 2026-01-27 | 13F | Checchi Capital Advisers, LLC | 2.526 | -0,63 | 348 | -10,10 | ||||
| 2026-02-12 | 13F | Principal Securities, Inc. | 0 | -100,00 | 0 | -100,00 | ||||
| 2026-02-17 | 13F | Amundi | 362.167 | -1,38 | 49.841 | -10,14 | ||||
| 2026-02-10 | 13F | NINE MASTS CAPITAL Ltd | 4.235 | 584 | ||||||
| 2026-02-13 | 13F | Potomac Fund Management Inc /adv | 4.299 | 592 | ||||||
| 2026-02-17 | 13F | Jain Global LLC | 0 | -100,00 | 0 | |||||
| 2026-02-12 | 13F | Bank Of Montreal /can/ | 17.010 | -97,43 | 2.341 | -97,68 | ||||
| 2026-02-17 | 13F | Royal Bank Of Canada | 70.880 | -61,34 | 9.754 | -65,00 | ||||
| 2026-04-21 | 13F | Venturi Wealth Management, LLC | 0 | -100,00 | 0 | |||||
| 2026-02-12 | 13F | Advisory Resource Group | 9.274 | 10,63 | 1.276 | 0,16 | ||||
| 2026-02-11 | 13F | Fox Run Management, L.l.c. | 7.126 | 981 | ||||||
| 2026-02-10 | 13F | Envestnet Asset Management Inc | 145.795 | -34,06 | 20.064 | -40,30 | ||||
| 2025-11-04 | 13F | High Note Wealth, LLC | 0 | -100,00 | 0 | |||||
| 2026-02-13 | 13F | First Trust Advisors Lp | 46.507 | -35,71 | 6.400 | -41,79 | ||||
| 2026-02-17 | 13F | SIH Partners, LLLP | 263.263 | 5,17 | 36.230 | -4,77 | ||||
| 2025-11-07 | 13F | Sierra Ocean, Llc | 0 | -100,00 | 0 | |||||
| 2026-02-06 | 13F | Hardy Reed LLC | 8.482 | -0,66 | 1.167 | -10,02 | ||||
| 2026-02-11 | 13F | Greykasell Wealth Strategies, Inc. | 1.396 | 0,00 | 192 | -9,43 | ||||
| 2026-02-12 | 13F | Dimensional Fund Advisors Lp | 923.326 | 9,71 | 127.274 | -0,43 | ||||
| 2026-02-14 | 13F | Rockefeller Capital Management L.P. | 2.176 | 9,73 | 300 | -0,66 | ||||
| 2026-02-17 | 13F | Advisory Services Network, LLC | 0 | -100,00 | 0 | |||||
| 2026-01-12 | 13F | CVA Family Office, LLC | 700 | 0,00 | 96 | -9,43 | ||||
| 2026-01-23 | 13F | Steigerwald, Gordon & Koch Inc. | 250 | 0,00 | 34 | -8,11 | ||||
| 2026-04-15 | 13F | Iams Wealth Management, Llc | 5.714 | 27,01 | 640 | 3,23 | ||||
| 2026-02-17 | 13F | Ancora Advisors, LLC | 159 | -86,75 | 22 | -83,06 | ||||
| 2025-11-14 | 13F | Point72 Hong Kong Ltd | 55.781 | -25,47 | 8.478 | -15,83 | ||||
| 2026-01-15 | 13F | Capital Advisors Inc/ok | 1.500 | 0,00 | 206 | -9,25 | ||||
| 2026-02-17 | 13F | Mercer Global Advisors Inc /adv | 2.177 | 8,96 | 300 | -0,99 | ||||
| 2026-02-12 | 13F | BlackRock, Inc. | 861.735 | -3,78 | 118.592 | -12,88 | ||||
| 2025-11-05 | 13F | SOUTH STATE Corp | 0 | -100,00 | 0 | |||||
| 2026-04-23 | 13F | North Star Investment Management Corp. | 21 | -38,24 | 2 | -50,00 | ||||
| 2026-02-11 | 13F | Havemeyer Place LP | 1.346 | 185 | ||||||
| 2025-11-13 | 13F | Baird Financial Group, Inc. | 0 | -100,00 | 0 | |||||
| 2026-02-18 | 13F | Mackenzie Financial Corp | 138.044 | -26,88 | 19.350 | -32,56 | ||||
| 2025-11-14 | 13F | Trexquant Investment LP | 0 | -100,00 | 0 | |||||
| 2026-02-17 | 13F | Hillhouse Capital Advisors, Ltd. | 0 | -100,00 | 0 | |||||
| 2026-02-17 | 13F | Guggenheim Capital Llc | 11.222 | -31,91 | 1.544 | -38,34 | ||||
| 2026-02-17 | 13F | Russell Investments Group, Ltd. | 122.904 | -11,46 | 16.914 | -19,83 | ||||
| 2026-02-06 | 13F | Kilter Group LLC | 0 | -100,00 | 0 | -100,00 | ||||
| 2026-04-07 | 13F | Farther Finance Advisors, LLC | 1.846 | 3,88 | 208 | -14,75 | ||||
| 2026-04-08 | 13F | Wealth Enhancement Advisory Services, Llc | 4.730 | -37,09 | 534 | -51,46 | ||||
| 2026-02-13 | 13F | JustInvest LLC | 9.894 | 8,25 | 1.362 | -2,09 | ||||
| 2026-04-09 | 13F | Sanders Morris Harris Llc | 5.925 | 663 | ||||||
| 2026-01-26 | 13F | Asset Dedication, LLC | 1.148 | -13,81 | 158 | -22,28 | ||||
| 2026-02-11 | 13F | LPL Financial LLC | 21.605 | -50,69 | 2.973 | -55,35 | ||||
| 2026-01-23 | 13F | Sumitomo Mitsui Trust Holdings, Inc. | 6.992 | 12,74 | 962 | 2,12 | ||||
| 2026-02-17 | 13F/A | Intesa Sanpaolo S.p.a. | 5.976 | 843 | ||||||
| 2026-02-10 | 13F | Mawer Investment Management Ltd. | 559.896 | 24,02 | 77.053 | 12,30 | ||||
| 2026-02-17 | 13F | Lazard Asset Management Llc | 354.287 | -3,76 | 48.757 | -12,86 | ||||
| 2026-02-17 | 13F | Toronto Dominion Bank | 1.160 | 0,00 | 159 | -9,66 | ||||
| 2026-01-29 | 13F | UBS Group AG | 425.902 | -2,12 | 58.613 | -11,37 | ||||
| 2026-02-18 | 13F | Cim, Llc | 0 | -100,00 | 0 | |||||
| 2026-02-10 | 13F | Goldman Sachs Group Inc | 179.120 | 7,31 | 24.651 | -2,83 | ||||
| 2026-04-21 | 13F | Old National Bancorp /in/ | 2.528 | -2,09 | 283 | -20,56 | ||||
| 2026-02-13 | 13F | Citigroup Inc | 162.675 | -1,68 | 22.387 | -10,98 | ||||
| 2026-01-29 | 13F | Sanctuary Advisors, LLC | 18.303 | -3,95 | 2.519 | -13,05 | ||||
| 2026-04-15 | 13F | Bayforest Capital Ltd | 0 | -100,00 | 0 | |||||
| 2026-02-10 | 13F | Norges Bank | 16.712 | 2.300 | ||||||
| 2026-02-13 | 13F | Ubs Asset Management Americas Inc | 8.144.927 | -4,75 | 1.120.905 | -13,76 | ||||
| 2026-04-20 | 13F | Arta Finance Wealth Management LLC | 2.399 | 13,54 | 269 | -7,59 | ||||
| 2026-02-11 | 13F | O'shaughnessy Asset Management, Llc | 49.617 | 16,71 | 6.828 | 5,68 | ||||
| 2026-02-06 | 13F | Abn Amro Investment Solutions | 16.878 | -12,45 | 2.323 | -20,75 | ||||
| 2026-02-06 | 13F/A | Rathbone Brothers plc | 0 | -100,00 | 0 | -100,00 | ||||
| 2026-02-06 | 13F | EverSource Wealth Advisors, LLC | 670 | 2,13 | 92 | -7,07 | ||||
| 2026-02-13 | 13F | Banco Santander, S.A. | 6.484 | 0,00 | 892 | -9,44 | ||||
| 2026-02-17 | 13F | Summit Global Investments | 3.571 | 9,31 | 0 | |||||
| 2026-01-29 | 13F | UBS Group AG | Put | 82.500 | 1,98 | 11.354 | -7,66 | |||
| 2026-01-29 | 13F | UBS Group AG | Call | 121.600 | -7,39 | 16.735 | -16,15 | |||
| 2026-04-24 | 13F | Ninety One SA (PTY) Ltd | 68.946 | 16,26 | 7.581 | -7,11 | ||||
| 2026-04-17 | 13F | Brown, Lisle/cummings, Inc. | 9 | 1 | ||||||
| 2026-01-27 | 13F | Proffitt & Goodson Inc | 50 | 0,00 | 7 | -14,29 | ||||
| 2026-02-13 | 13F | Mml Investors Services, Llc | 4.720 | -40,76 | 650 | -46,41 | ||||
| 2026-02-03 | 13F | Chesapeake Capital Corp /il/ | 4.296 | 0,00 | 591 | -9,36 | ||||
| 2026-02-14 | 13F | Frec Markets, Inc. | 1.603 | 221 | ||||||
| 2026-02-10 | 13F | Bnp Paribas Arbitrage, Sa | Put | 120 | -80,07 | 1.651 | -81,95 | |||
| 2026-02-14 | 13F | Taikang Asset Management (Hong Kong) Co Ltd | 62.000 | 12,73 | 8.532 | 2,07 | ||||
| 2026-02-17 | 13F | Engineers Gate Manager LP | 29.366 | 315,89 | 4.041 | 276,61 | ||||
| 2026-02-10 | 13F | Bnp Paribas Arbitrage, Sa | 194.625 | 30,41 | 26.784 | 18,08 | ||||
| 2026-02-13 | 13F | Headlands Technologies LLC | 15.296 | 2.105 | ||||||
| 2025-11-13 | 13F | Riggs Asset Managment Co. Inc. | 0 | -100,00 | 0 | -100,00 | ||||
| 2026-01-29 | 13F | Rakuten Securities, Inc. | 105 | 320,00 | 14 | 366,67 | ||||
| 2026-03-20 | 13F/A | Hsbc Holdings Plc | 19.392 | 0,04 | 2.668 | -9,41 | ||||
| 2026-02-11 | 13F | Myriad Asset Management Advisors LLC | 10.696 | 1.472 | ||||||
| 2026-02-13 | 13F | BNP Paribas Asset Management Holding S.A. | 69.947 | 1.922,17 | 10 | |||||
| 2026-02-10 | 13F | Peapack Gladstone Financial Corp | 2.209 | 8,98 | 0 | |||||
| 2026-02-12 | 13F | Brown Brothers Harriman & Co | 231 | -46,15 | 32 | -52,31 | ||||
| 2026-01-29 | 13F | Dunhill Financial, LLC | 3 | 0,00 | 0 | |||||
| 2026-02-05 | 13F | Central Asset Investments & Management Holdings (HK) Ltd | 0 | -100,00 | 0 | |||||
| 2026-02-17 | 13F | MIRAE ASSET GLOBAL ETFS HOLDINGS Ltd. | 112.498 | -22,64 | 15.482 | -29,96 | ||||
| 2026-02-10 | 13F | CIBC World Markets Inc. | 1.460 | 201 | ||||||
| 2026-02-13 | 13F | Great West Life Assurance Co /can/ | 15.263 | 0,00 | 2 | 0,00 | ||||
| 2026-01-27 | 13F | Institute for Wealth Management, LLC. | 25.370 | 3.491 | ||||||
| 2026-01-28 | 13F | B. Metzler seel. Sohn & Co. AG | 1.980 | 272 | ||||||
| 2026-02-09 | 13F | Legal & General Group Plc | 98.055 | -21,47 | 13.494 | -28,92 | ||||
| 2026-04-21 | 13F | Guinness Atkinson Asset Management Inc | 20.880 | 31,65 | 2.337 | 5,79 | ||||
| 2025-11-07 | 13F | Vanguard Group Inc | 0 | -100,00 | 0 | -100,00 | ||||
| 2026-02-17 | 13F | Private Advisor Group, LLC | 30.709 | 48,75 | 4.226 | 34,71 | ||||
| 2026-01-30 | 13F | Us Bancorp \de\ | 41.164 | -31,21 | 5.665 | -37,72 | ||||
| 2026-02-13 | 13F | Umb Bank N A/mo | 273 | 21,88 | 38 | 8,82 | ||||
| 2026-02-06 | 13F | Fairtree Asset Management (Pty) Ltd | 3.937 | 542 | ||||||
| 2026-02-09 | 13F | Summitry Llc | 2.772 | 40,57 | 381 | 27,42 | ||||
| 2026-04-21 | 13F | Robeco Institutional Asset Management B.V. | 145.001 | -0,37 | 16.231 | -18,96 | ||||
| 2026-04-20 | 13F | Jfs Wealth Advisors, Llc | 131 | 0,00 | 15 | -22,22 | ||||
| 2026-02-13 | 13F | Gts Securities Llc | 9.392 | 59,73 | 1.293 | 44,68 | ||||
| 2026-02-06 | 13F | True Light Capital Pte. Ltd. | 27.202 | 3.744 | ||||||
| 2026-02-06 | 13F | Handelsbanken Fonder AB | 499.115 | -0,60 | 69 | -10,53 | ||||
| 2026-02-12 | 13F | Perseverance Asset Management International | 0 | -100,00 | 0 | |||||
| 2026-01-22 | 13F | Richardson Financial Services Inc. | 32 | -85,19 | 4 | -87,50 | ||||
| 2026-02-17 | 13F | Royal Capital Wealth Management, LLC | 2.000 | 0,00 | 275 | -9,24 | ||||
| 2026-02-17 | 13F | Edmond De Rothschild Holding S.a. | 40.000 | 6,38 | 5.505 | -3,68 | ||||
| 2026-02-03 | 13F | Cheviot Value Management, LLC | 18 | 0,00 | 2 | 0,00 | ||||
| 2025-11-13 | 13F | Nemes Rush Group LLC | 0 | -100,00 | 0 | |||||
| 2026-02-12 | 13F | XY Capital Ltd | Call | 1.600 | 220 | |||||
| 2026-02-12 | 13F | XY Capital Ltd | Put | 1.600 | 220 | |||||
| 2026-02-12 | 13F | XY Capital Ltd | 13.295 | 1.830 | ||||||
| 2026-02-17 | 13F | Raymond James Financial Inc | 22.490 | 24,16 | 3.095 | 12,42 | ||||
| 2026-01-29 | 13F | IMC-Chicago, LLC | Put | 47.300 | -39,59 | 6.509 | -45,30 | |||
| 2026-02-12 | 13F | Polen Capital Management Llc | 0 | -100,00 | 0 | |||||
| 2026-01-29 | 13F | IMC-Chicago, LLC | Call | 71.600 | -7,01 | 9.854 | -15,81 | |||
| 2026-02-04 | 13F | Ameritas Advisory Services, LLC | 6.528 | -21,21 | 898 | -28,67 | ||||
| 2026-02-05 | 13F | Mission Wealth Management, Lp | 2.514 | 0,00 | 346 | -9,69 | ||||
| 2026-02-13 | 13F | Advyzon Investment Management, LLC | 9.618 | 14,54 | 1.324 | 3,68 | ||||
| 2026-02-12 | 13F | Jane Street Group, Llc | Call | 36.900 | 6,65 | 5.078 | -3,42 | |||
| 2026-02-12 | 13F | Jane Street Group, Llc | 192.268 | 39,53 | 26.460 | 26,33 | ||||
| 2026-02-09 | 13F/A | Swedbank AB | 192.100 | 35,19 | 26.437 | 22,41 | ||||
| 2026-02-12 | 13F | Jane Street Group, Llc | Put | 65.300 | -50,57 | 8.987 | -55,24 | |||
| 2026-01-23 | 13F | Bridgewater Advisors Inc. | 2.571 | -0,08 | 338 | -5,59 | ||||
| 2025-11-14 | 13F | Wolverine Trading, Llc | Put | 16.000 | -48,72 | 2.422 | -41,49 | |||
| 2026-02-13 | 13F | Natixis | 1.860 | 0,00 | 256 | -9,57 | ||||
| 2026-02-12 | 13F | Hrt Financial Lp | 10.400 | 511,76 | 1 | |||||
| 2026-04-22 | 13F | Pictet Asset Management Holding SA | 11.500 | -5,74 | 1.287 | -23,30 | ||||
| 2026-01-29 | 13F | Advisors Capital Management, LLC | 1.552 | 0,71 | 214 | -8,97 | ||||
| 2026-02-13 | 13F | Pin Oak Investment Advisors Inc | 107 | 0,00 | 0 | -100,00 | ||||
| 2026-01-30 | 13F | Bogart Wealth, LLC | 0 | -100,00 | 0 | |||||
| 2026-03-26 | 13F/A | Peak6 Llc | 0 | -100,00 | 0 | -100,00 | ||||
| 2025-11-14 | 13F | Scientech Research LLC | 0 | -100,00 | 0 | |||||
| 2025-11-14 | 13F | Wolverine Trading, Llc | 28.951 | 276,57 | 4.382 | 330,03 | ||||
| 2026-02-20 | 13F | Sunbelt Securities, Inc. | 1.967 | 271 | ||||||
| 2025-11-14 | 13F | Wolverine Trading, Llc | Call | 25.700 | -25,51 | 3.890 | -15,01 | |||
| 2025-11-14 | 13F | Two Sigma Investments, Lp | 0 | -100,00 | 0 | |||||
| 2026-02-17 | 13F | Ameriprise Financial Inc | 38.857 | -77,24 | 5.347 | -79,42 | ||||
| 2026-02-03 | 13F | Mitsubishi UFJ Kokusai Asset Management Co., Ltd. | 5.677 | 0,00 | 838 | -2,90 | ||||
| 2026-01-30 | 13F | FengHe Fund Management Pte. Ltd. | 12.400 | 1.706 | ||||||
| 2026-04-13 | 13F | Mather Group, Llc. | 303 | 34 | ||||||
| 2026-04-16 | 13F | SG Americas Securities, LLC | 0 | -100,00 | 0 | |||||
| 2025-12-18 | 13F | Danske Bank A/s | 0 | -100,00 | 0 | |||||
| 2026-02-04 | 13F | Twin Lakes Capital Management, LLC | 83 | 0,00 | 11 | -8,33 | ||||
| 2026-02-13 | 13F | Tairen Capital Ltd | 0 | -100,00 | 0 | |||||
| 2026-01-14 | 13F | USA Financial Portformulas Corp | 0 | -100,00 | 0 | |||||
| 2026-02-17 | 13F | Laird Norton Trust Company, Llc | 14.565 | 2.004 | ||||||
| 2026-03-17 | 13F/A | Barclays Plc | Put | 0 | -100,00 | 0 | -100,00 | |||
| 2026-02-12 | 13F | Qtron Investments LLC | 0 | -100,00 | 0 | |||||
| 2026-02-17 | 13F | Dark Forest Capital Management Lp | 0 | -100,00 | 0 | -100,00 | ||||
| 2026-01-16 | 13F | Standard Life Aberdeen plc | 26.682 | 31,02 | 3.672 | 19,50 | ||||
| 2026-04-24 | 13F | Root Financial Partners, LLC | 15 | 275,00 | 2 | |||||
| 2026-02-11 | 13F | Allianz Asset Management GmbH | 6.449 | -38,74 | 888 | -44,53 | ||||
| 2026-02-09 | 13F | Huntington National Bank | 1.106 | -6,27 | 152 | -15,08 | ||||
| 2026-01-28 | 13F | HB Wealth Management, LLC | 2.349 | 21,02 | 323 | 9,49 | ||||
| 2026-02-13 | 13F | Walleye Trading LLC | Call | 19.900 | 107,29 | 2.739 | 87,66 | |||
| 2026-02-02 | 13F | Core Alternative Capital | 200 | 0,00 | 28 | -10,00 | ||||
| 2026-02-13 | 13F | Walleye Trading LLC | 15.970 | -42,48 | 2.198 | -47,93 | ||||
| 2026-04-07 | 13F | Carolina Wealth Advisors, LLC | 2.488 | 279 | ||||||
| 2026-02-17 | 13F | Boreal Capital Management LLC | 70 | 0,00 | 10 | -10,00 | ||||
| 2026-02-13 | 13F | Walleye Trading LLC | Put | 8.600 | -79,62 | 1.184 | -81,55 | |||
| 2026-02-13 | 13F | Vontobel Holding Ltd. | 21.075 | 0,53 | 2.900 | -8,98 | ||||
| 2026-02-17 | 13F | Temasek Holdings (Private) Ltd | 469.728 | 28,31 | 64.644 | 16,18 | ||||
| 2026-01-27 | 13F | Brighton Jones Llc | 0 | -100,00 | 0 | |||||
| 2026-02-13 | 13F | National Bank Of Canada /fi/ | 512 | 70 | ||||||
| 2026-02-04 | 13F | LRI Investments, LLC | 60 | 17,65 | 8 | 14,29 | ||||
| 2026-02-13 | 13F | Flow Traders U.s. Llc | 0 | -100,00 | 0 | |||||
| 2025-10-31 | 13F | Whittier Trust Co Of Nevada Inc | 0 | -100,00 | 0 | |||||
| 2026-02-17 | 13F | Seldon Capital Lp | 0 | -100,00 | 0 | -100,00 | ||||
| 2026-04-13 | 13F | Loring Wolcott & Coolidge Fiduciary Advisors Llp/ma | 700 | 0,00 | 79 | -15,22 | ||||
| 2026-02-20 | 13F | Kovitz Investment Group Partners, LLC | 0 | -100,00 | 0 | |||||
| 2026-01-23 | 13F | Diversify Advisory Services, LLC | 0 | -100,00 | 0 | |||||
| 2026-01-26 | 13F | Mirae Asset Global Investments Co., Ltd. | 34.483 | -11,37 | 4.746 | -19,75 | ||||
| 2026-01-29 | 13F | Concurrent Investment Advisors, LLC | 2.740 | 7,45 | 377 | -2,58 | ||||
| 2026-02-13 | 13F | Van Eck Associates Corp | 634.513 | -6,94 | 87 | -15,53 | ||||
| 2026-02-12 | 13F | Ci Investments Inc. | 72.356 | 9,06 | 9.958 | 99.470,00 | ||||
| 2026-02-13 | 13F | Colony Group, LLC | 17.646 | 865,85 | 2.428 | 776,53 | ||||
| 2026-04-15 | 13F | Generali Investments CEE, investicni spolecnost, a.s. | 9.251 | -19,73 | 1.036 | -34,74 | ||||
| 2025-11-14 | 13F | Two Sigma Securities, Llc | 0 | -100,00 | 0 | |||||
| 2026-02-17 | 13F | SageView Advisory Group, LLC | 90 | 12 | ||||||
| 2026-02-13 | 13F | PCM Encore, LLC | 2.316 | 319 | ||||||
| 2026-04-22 | 13F | Union Bancaire Privee, UBP SA | 2.095 | -13,07 | 201 | -31,63 | ||||
| 2026-02-17 | 13F | Dv Equities, Llc | 6.785 | 934 | ||||||
| 2025-11-12 | 13F | NewSquare Capital LLC | 0 | -100,00 | 0 | |||||
| 2025-11-06 | 13F | Midwest Trust Co | 0 | -100,00 | 0 | -100,00 | ||||
| 2026-04-17 | 13F | Bell Investment Advisors, Inc | 71 | 16,39 | 8 | -12,50 | ||||
| 2026-04-23 | 13F | Oppenheimer Asset Management Inc. | 17.187 | -2,29 | 1.924 | -20,54 | ||||
| 2026-01-08 | 13F | Nordea Investment Management Ab | 269.408 | -3,24 | 37.100 | -11,92 | ||||
| 2026-02-17 | 13F | United Capital Financial Advisers, Llc | 1.660 | 20,38 | 228 | 9,09 | ||||
| 2026-02-10 | 13F/A | Northwestern Mutual Wealth Management Co | 7.372 | 178,08 | 1.015 | 152,24 | ||||
| 2026-02-13 | 13F | Morgan Stanley | 894.440 | 25,37 | 123.093 | 13,52 | ||||
| 2026-02-11 | 13F | TCTC Holdings, LLC | 3.634 | 500 | ||||||
| 2026-01-09 | 13F | Marshall Financial Group LLC | 0 | -100,00 | 0 | |||||
| 2026-02-17 | 13F | Optiver Holding B.V. | 160 | 0,00 | 22 | -8,33 | ||||
| 2026-04-06 | 13F | Rosenberg Matthew Hamilton | 1.572 | 0,00 | 176 | -18,98 | ||||
| 2025-11-10 | 13F | Everstar Asset Management, LLC | 0 | -100,00 | 0 | |||||
| 2025-11-14 | 13F | AXA Investment Managers S.A. | 31.529 | 4.792 | ||||||
| 2026-02-12 | 13F | Bank of Jackson Hole Trust | 0 | -100,00 | 0 | |||||
| 2026-03-12 | 13F/A | Peak6 Llc | Call | 3.400 | -98,69 | 468 | -98,82 | |||
| 2026-02-17 | 13F | Quadrature Capital Ltd | 41.012 | 5.644 | ||||||
| 2026-02-17 | 13F | Cederberg Capital Ltd | 569.475 | 0,00 | 87 | 0,00 | ||||
| 2026-04-14 | 13F | Nbc Securities, Inc. | 297 | 160,53 | 33 | 120,00 | ||||
| 2026-04-06 | 13F | GAMMA Investing LLC | 46 | 43,75 | 5 | 25,00 | ||||
| 2026-02-13 | 13F | Aspex Management (HK) Ltd | 147.655 | 0,00 | 20 | -9,09 | ||||
| 2026-03-12 | 13F/A | Peak6 Llc | Put | 400 | 0,00 | 55 | -8,33 | |||
| 2026-01-30 | 13F | Flossbach Von Storch Ag | 15.000 | -14,29 | 2.064 | -22,38 | ||||
| 2026-04-24 | 13F | Abacus Wealth Partners, LLC | 2.900 | -0,92 | 325 | -19,40 | ||||
| 2026-02-09 | 13F | AIA Group Ltd | 6.984 | 961 | ||||||
| 2026-02-17 | 13F | Qube Research & Technologies Ltd | 208.656 | 98,18 | 28.715 | 79,45 | ||||
| 2026-01-26 | 13F | Private Trust Co Na | 16 | -89,40 | 2 | -90,91 | ||||
| 2026-02-12 | 13F | StoneX Group Inc. | 0 | -100,00 | 0 | |||||
| 2026-02-11 | 13F | Cerity Partners LLC | 19.314 | -4,48 | 2.658 | -13,54 | ||||
| 2026-02-17 | 13F | Credit Agricole S A | 23.270 | -16,26 | 3.202 | -24,18 | ||||
| 2026-04-10 | 13F | Abound Wealth Management | 2 | -50,00 | 0 | |||||
| 2026-02-06 | 13F | HighTower Advisors, LLC | 61.616 | -2,27 | 8.480 | -11,51 | ||||
| 2026-02-10 | 13F | Savant Capital, LLC | 3.721 | -0,03 | 512 | -9,38 | ||||
| 2026-02-12 | 13F | DRW Securities, LLC | 8.078 | 1.112 | ||||||
| 2026-02-06 | 13F | Kingdom Financial Group LLC. | 2.120 | 292 | ||||||
| 2026-02-17 | 13F | Grantham, Mayo, Van Otterloo & Co. LLC | 2.700 | -82,47 | 372 | -84,15 | ||||
| 2026-01-22 | 13F | Bear Mountain Capital, Inc. | 1.778 | -1,28 | 242 | -11,72 | ||||
| 2026-02-10 | 13F | Brookmont Capital Management | 10.072 | 1.386 | ||||||
| 2026-04-10 | 13F | Perigon Wealth Management, LLC | 2.474 | 277 | ||||||
| 2026-02-18 | 13F | Vident Advisory, LLC | 19.411 | 117,10 | 2.671 | 96,69 | ||||
| 2026-01-21 | 13F | Sound Income Strategies, LLC | 15 | 0,00 | 2 | 0,00 | ||||
| 2026-02-13 | 13F | Arrowstreet Capital, Limited Partnership | 1.218.256 | -32,65 | 167.656 | -39,02 | ||||
| 2026-02-13 | 13F | Rhumbline Advisers | 6.659 | -0,92 | 916 | -10,28 | ||||
| 2026-01-16 | 13F | Crewe Advisors LLC | 12 | 0,00 | 2 | 0,00 | ||||
| 2026-02-10 | 13F | Bnp Paribas | 120 | 0,00 | 17 | -11,11 | ||||
| 2026-02-17 | 13F | Man Group plc | 874.835 | -17,09 | 120.395 | -24,93 | ||||
| 2026-02-06 | 13F | Vestmark Advisory Solutions, Inc. | 4.214 | 4,23 | 580 | -5,70 | ||||
| 2026-02-17 | 13F | Veritas Asset Management LLP | 32.957 | -24,17 | 4.536 | -31,34 | ||||
| 2026-02-05 | 13F | HighMark Wealth Management LLC | 0 | -100,00 | 0 | |||||
| 2026-02-17 | 13F | Cetera Investment Advisers | 11.433 | -48,93 | 1.573 | -53,76 | ||||
| 2026-02-17 | 13F | Aspen Grove Capital, LLC | 0 | -100,00 | 0 | |||||
| 2026-02-11 | 13F | Renaissance Group Llc | 27.577 | -32,14 | 3.795 | -38,55 | ||||
| 2025-11-13 | 13F | Canada Pension Plan Investment Board | 0 | -100,00 | 0 | -100,00 | ||||
| 2026-02-11 | 13F | Syon Capital Llc | 2.091 | 49,46 | 288 | 35,38 | ||||
| 2026-01-23 | 13F | Lester Murray Antman dba SimplyRich | 4.928 | 0,04 | 1 | |||||
| 2026-02-11 | 13F | Parallel Advisors, LLC | 2.314 | 2,75 | 318 | -7,02 | ||||
| 2026-02-12 | 13F | Mount Yale Investment Advisors, LLC | 0 | -100,00 | 0 | |||||
| 2026-02-13 | 13F | Neuberger Berman Group LLC | 80.248 | 9,23 | 11.062 | -0,94 | ||||
| 2026-04-17 | 13F | HHM Wealth Advisors, LLC | 6 | 0,00 | 1 | |||||
| 2026-04-20 | 13F | TrueMark Investments, LLC | 0 | -100,00 | 0 | |||||
| 2026-02-11 | 13F | Marks Group Wealth Management, Inc | 1.798 | -3,18 | 247 | -12,41 | ||||
| 2026-01-21 | 13F | Sowell Financial Services LLC | 0 | -100,00 | 0 | |||||
| 2026-02-09 | 13F | Hantz Financial Services, Inc. | 11.091 | 27,63 | 2 | 0,00 | ||||
| 2026-04-15 | 13F | DAVENPORT & Co LLC | 11.492 | -0,41 | 1.286 | -18,97 | ||||
| 2026-02-12 | 13F | CIBC Private Wealth Group, LLC | 1.522 | -2,81 | 209 | -12,18 | ||||
| 2026-02-17 | 13F | Creative Planning | 43.710 | 9,84 | 6.015 | -0,55 | ||||
| 2026-02-12 | 13F | Logan Capital Management Inc | 14.171 | 0,00 | 1.950 | -9,43 | ||||
| 2026-02-12 | 13F | Brinker Capital Investments, LLC | 9.582 | -2,28 | 1.319 | -11,54 | ||||
| 2026-02-17 | 13F | Susquehanna International Group, Llp | Put | 194.100 | -29,72 | 26.712 | -36,37 | |||
| 2026-02-12 | 13F | Integrated Quantitative Investments LLC | 21.618 | 21,44 | 2.975 | 9,98 | ||||
| 2026-02-17 | 13F | Susquehanna International Group, Llp | Call | 226.900 | -18,18 | 31.226 | -25,91 | |||
| 2026-02-13 | 13F | Toroso Investments, LLC | 5.687 | -17,57 | 783 | -25,38 | ||||
| 2026-02-09 | 13F | Harbour Investments, Inc. | 379 | 7.480,00 | 52 | |||||
| 2026-02-17 | 13F | Susquehanna International Group, Llp | 73.024 | -8,11 | 10.050 | -16,80 | ||||
| 2026-01-07 | 13F | Baldwin Brothers Inc/ma | 0 | -100,00 | 0 | |||||
| 2026-02-13 | 13F | Ausdal Financial Partners, Inc. | 9.522 | -15,62 | 1.310 | -23,62 | ||||
| 2026-01-28 | 13F | CAPROCK Group, Inc. | 4.700 | 17,53 | 647 | 18,32 | ||||
| 2026-04-02 | 13F | Ares Financial Consulting, LLC | 8 | 0,00 | 1 | -100,00 | ||||
| 2026-04-24 | 13F | Ninety One UK Ltd | 6.286.216 | -0,15 | 703.679 | -18,78 | ||||
| 2026-04-22 | 13F | Stone House Investment Management, LLC | 4 | 0 | ||||||
| 2026-02-12 | 13F | Rossby Financial, LCC | 760 | 5.328,57 | 105 | 5.100,00 | ||||
| 2026-04-17 | 13F | Willner & Heller, Llc | 3.078 | 3,18 | 345 | -16,10 | ||||
| 2026-02-13 | 13F | Walleye Capital LLC | Put | 1.200 | 165 | |||||
| 2026-02-18 | 13F | VGI Partners Ltd | 0 | -100,00 | 0 | |||||
| 2026-02-09 | 13F | Hartland & Co., LLC | 59 | 8 | ||||||
| 2026-02-13 | 13F | Walleye Capital LLC | 1 | 0 | ||||||
| 2026-02-13 | 13F | Schroder Investment Management Group | 36.535 | 3,67 | 5.028 | -6,14 | ||||
| 2026-02-17 | 13F | XTX Topco Ltd | 0 | -100,00 | 0 | |||||
| 2026-02-13 | 13F | Walleye Capital LLC | Call | 4.700 | 647 | |||||
| 2026-04-23 | 13F | CWM Advisors, LLC | 21 | -99,77 | 2 | -99,84 |