Grundlæggende statistik
| Institutionelle aktier (lange) | 20.420.598 - 29,04% (ex 13D/G) - change of 1,32MM shares 6,90% MRQ |
| Institutionel værdi (lang) | $ 284.937 USD ($1000) |
Institutionelt ejerskab og aktionærer
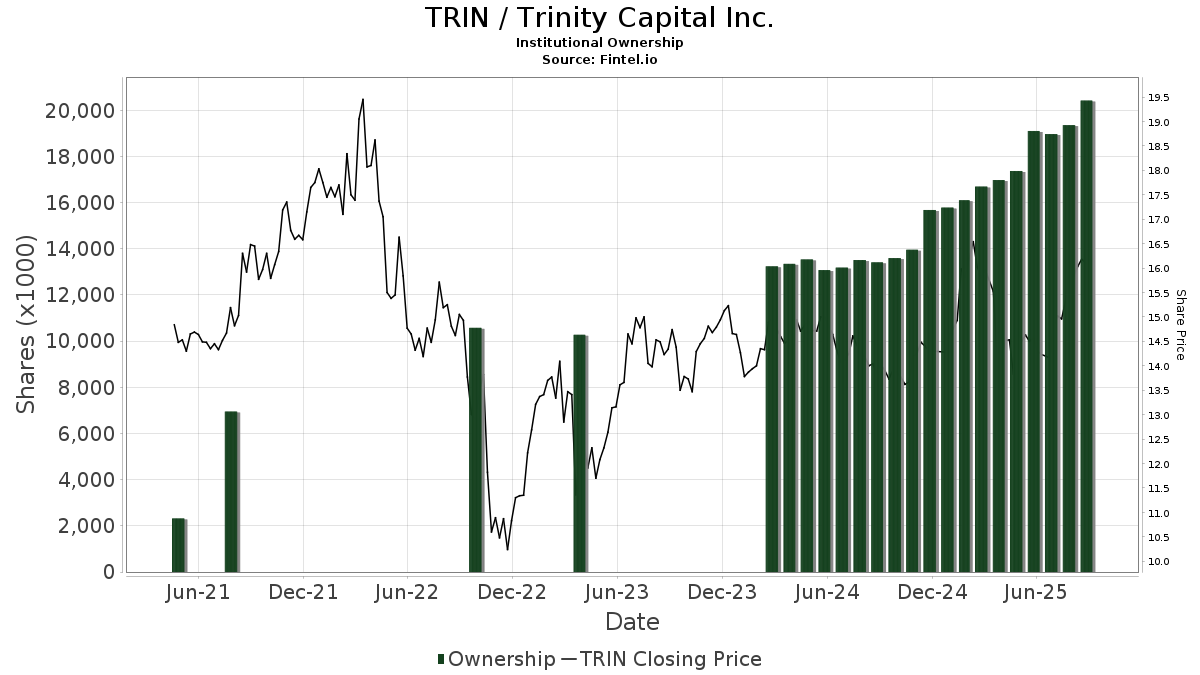
Trinity Capital Inc. (US:TRIN) har 154 institutionelle ejere og aktionærer, der har indsendt 13D/G- eller 13F-formularer til Securities Exchange Commission (SEC). Disse institutioner har i alt 20,420,598 aktier. Største aktionærer omfatter Van Eck Associates Corp, BIZD - VanEck Vectors BDC Income ETF, Melia Wealth LLC, Rockefeller Capital Management L.P., Invesco Ltd., Emerald Advisers, Llc, KBWD - Invesco KBW High Dividend Yield Financial ETF, QVT Financial LP, Two Sigma Advisers, Lp, and UBS Group AG .
Trinity Capital Inc. (NasdaqGS:TRIN) institutionel ejerskabsstruktur viser aktuelle positioner i virksomheden efter institutioner og fonde, samt seneste ændringer i positionsstørrelse. Større aktionærer kan omfatte individuelle investorer, investeringsforeninger, hedgefonde eller institutioner. Skema 13D angiver, at investoren besidder (eller besidder) mere end 5 % af virksomheden og har til hensigt (eller har til hensigt at) aktivt at forfølge en ændring i forretningsstrategi. Skema 13G indikerer en passiv investering på over 5%.
The share price as of September 11, 2025 is 16,12 / share. Previously, on September 12, 2024, the share price was 13,92 / share. This represents an increase of 15,80% over that period.
Fondens stemningsscore
Fund Sentiment Score (fka Ownership Accumulation Score) finder de aktier, der bliver mest købt af fonde. Det er resultatet af en sofistikeret, multi-faktor kvantitativ model, der identificerer virksomheder med de højeste niveauer af institutionel akkumulering. Scoringsmodellen bruger en kombination af den samlede stigning i oplyste ejere, ændringerne i porteføljeallokeringer i disse ejere og andre målinger. Tallet går fra 0 til 100, hvor højere tal indikerer et højere niveau af akkumulering for sine jævnaldrende, og 50 er gennemsnittet.
Opdateringsfrekvens: Dagligt
Se Ownership Explorer, som giver en liste over højest rangerende virksomheder.
Institutionel Put/Call-forhold
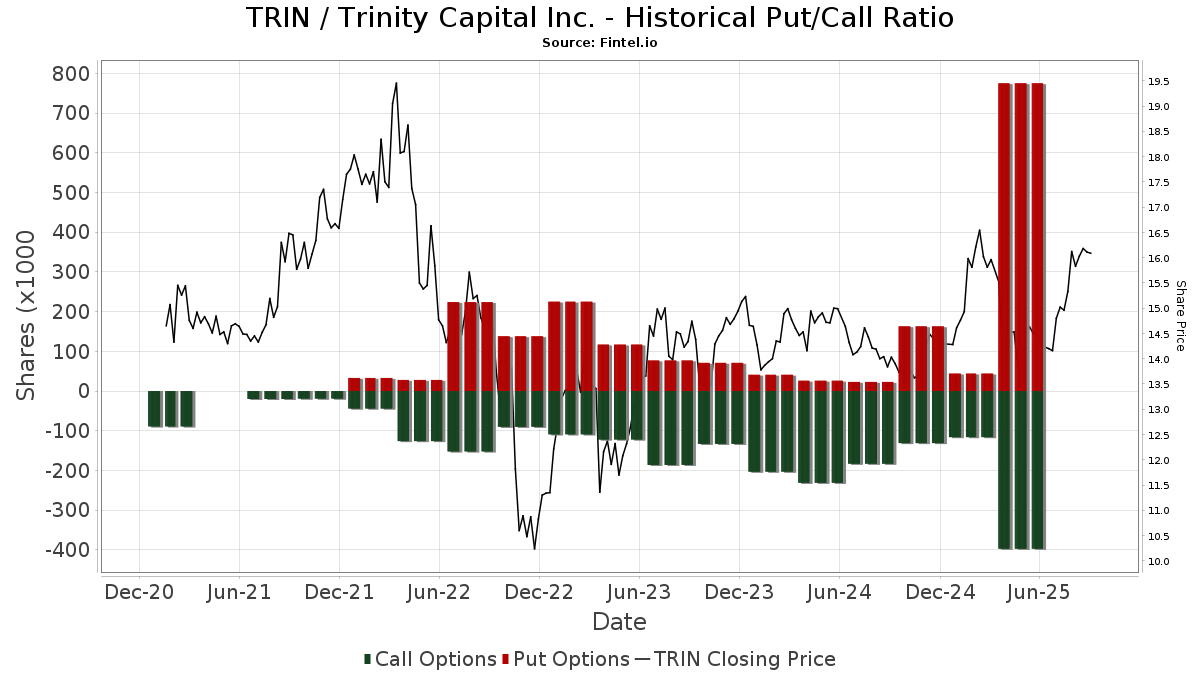
Ud over at indberette standardaktie- og gældsudstedelser skal institutter med mere end 100 mill. aktiver under forvaltning også oplyse deres put- og call-optionsbeholdninger. Da salgsoptioner generelt indikerer negativ stemning, og købsoptioner indikerer positiv stemning, kan vi få en fornemmelse af den overordnede institutionelle stemning ved at plotte forholdet mellem put og kald. Diagrammet til højre viser det historiske put/call-forhold for dette instrument.
Brug af Put/Call Ratio som en indikator for investorernes stemning overvinder en af de vigtigste mangler ved at bruge totalt institutionelt ejerskab, som er, at en betydelig mængde af aktiver under forvaltning investeres passivt for at spore indekser. Passivt forvaltede fonde køber typisk ikke optioner, så indikatoren for put/call-forholdet følger mere nøje følelsen af aktivt forvaltede fonde.
13D/G-arkivering
Vi præsenterer 13D/G ansøgninger separat fra 13F ansøgninger på grund af den forskellige behandling af SEC. 13D/G-ansøgninger kan indgives af grupper af investorer (med én ledende), hvorimod 13F-ansøgninger ikke kan. Dette resulterer i situationer, hvor en investor kan indsende en 13D/G, der rapporterer én værdi for de samlede aktier (der repræsenterer alle de aktier, der ejes af investorgruppen), men derefter indsender en 13F, der rapporterer en anden værdi for de samlede aktier (der udelukkende repræsenterer deres egne) ejendomsret). Det betyder, at aktieejerskab af 13D/G-arkiver og 13F-arkiveringer ofte ikke er direkte sammenlignelige, så vi præsenterer dem separat.
Bemærk: Fra den 16. maj 2021 viser vi ikke længere ejere, der ikke har indsendt en 13D/G inden for det seneste år. Tidligere viste vi den fulde historie af 13D/G-arkiver. Generelt skal enheder, der er forpligtet til at indgive 13D/G-ansøgninger, indgive mindst årligt, før de indsender en afsluttende ansøgning. Dog forlader fonde nogle gange positioner uden at indsende en afsluttende ansøgning (dvs. de afvikler), så visning af den fulde historie resulterede nogle gange i forvirring om det nuværende ejerskab. For at undgå forvirring viser vi nu kun 'aktuelle' ejere - det vil sige - ejere, der har anmeldt inden for det seneste år.
Upgrade to unlock premium data.
| Fil dato | Form | Investor | Forrige Aktier |
Seneste Aktier |
Δ Aktier (Procent) |
Ejendomsret (Procent) |
Δ Ejerskab (Procent) |
|
|---|---|---|---|---|---|---|---|---|
| 2025-02-27 | Eagle Point Credit Management LLC | 3,336,668 | 360,475 | -89.20 | 0.60 | -96.13 |
13F og NPORT arkivering
Detaljer om 13F-arkivering er gratis. Detaljer om NP-ansøgninger kræver et premium-medlemskab. Grønne rækker angiver nye positioner. Røde rækker angiver lukkede positioner. Klik på linket ikon for at se den fulde transaktionshistorik.
Opgrader
for at låse premium-data op og eksportere til Excel ![]() .
.
| Fil dato | Kilde | Investor | Type | Gennemsnitlig pris (Øst) |
Aktier | Δ Aktier (%) |
Rapporteret Værdi ($1000) |
Δ Værdi (%) |
Port Alloc (%) |
|
|---|---|---|---|---|---|---|---|---|---|---|
| 2025-08-06 | 13F | Round Rock Advisors, LLC | 580.619 | 8,95 | 8.169 | 1,11 | ||||
| 2025-07-31 | 13F | Oppenheimer & Co Inc | 30.390 | 15,50 | 428 | 7,29 | ||||
| 2025-08-06 | 13F | First Horizon Advisors, Inc. | 2.289 | 32 | ||||||
| 2025-08-13 | 13F | Invesco Ltd. | 838.194 | 2,66 | 11.793 | -4,72 | ||||
| 2025-06-25 | NP | HSSAX - Emerald Banking and Finance Fund Class A | 59.403 | 0,00 | 863 | -4,96 | ||||
| 2025-08-13 | 13F | Texas Capital Bank Wealth Management Services Inc | 22.066 | -48,84 | 310 | -52,53 | ||||
| 2025-03-28 | NP | DVDN - Kingsbarn Dividend Opportunity ETF | 3.879 | 59 | ||||||
| 2025-08-14 | 13F | Tudor Investment Corp Et Al | 20.077 | 36,31 | 282 | 26,46 | ||||
| 2025-08-13 | 13F | Legacy Capital Wealth Partners, LLC | 89.257 | -3,08 | 1.256 | -10,10 | ||||
| 2025-08-06 | 13F | Commonwealth Equity Services, Llc | 138.248 | 16,22 | 2 | 0,00 | ||||
| 2025-08-01 | 13F | Y-Intercept (Hong Kong) Ltd | 151.828 | 2.136 | ||||||
| 2025-08-14 | 13F | Kovitz Investment Group Partners, LLC | 18.553 | -4,07 | 271 | -7,85 | ||||
| 2025-08-13 | 13F | Townsquare Capital Llc | 0 | -100,00 | 0 | |||||
| 2025-07-28 | 13F | Axxcess Wealth Management, Llc | 0 | -100,00 | 0 | |||||
| 2025-08-12 | 13F | Advisors Asset Management, Inc. | 268.699 | 40,29 | 3.781 | 30,21 | ||||
| 2025-08-01 | 13F | Envestnet Asset Management Inc | 54.411 | 0,25 | 766 | -6,93 | ||||
| 2025-05-15 | 13F | CAPROCK Group, Inc. | 21.000 | 329 | ||||||
| 2025-07-30 | 13F | D.a. Davidson & Co. | 20.590 | 95,39 | 290 | 81,76 | ||||
| 2025-08-14 | 13F | Jane Street Group, Llc | Put | 0 | -100,00 | 0 | -100,00 | |||
| 2025-08-14 | 13F | Ameriprise Financial Inc | 296.212 | 6,31 | 4.157 | -1,59 | ||||
| 2025-08-14 | 13F | Vident Advisory, LLC | 46.640 | 109,91 | 656 | 95,24 | ||||
| 2025-07-08 | 13F/A | Salem Investment Counselors Inc | 500 | 7 | ||||||
| 2025-09-10 | NP | Putnam ETF Trust - Putnam BDC ETF - | 513.629 | 22,55 | 7.699 | 26,44 | ||||
| 2025-08-12 | 13F | CIBC Private Wealth Group, LLC | 2.253 | 0,00 | 32 | 3,33 | ||||
| 2025-08-15 | 13F | Morgan Stanley | 276.839 | 48,85 | 3.895 | 38,17 | ||||
| 2025-07-01 | 13F | Confluence Investment Management Llc | 59.052 | 0,01 | 831 | -7,26 | ||||
| 2025-07-18 | 13F | PFG Investments, LLC | 13.129 | -0,57 | 185 | -8,00 | ||||
| 2025-08-13 | 13F | ExodusPoint Capital Management, LP | 0 | -100,00 | 0 | |||||
| 2025-08-13 | 13F | Kennedy Capital Management, Inc. | 265.864 | 8,56 | 3.741 | 0,75 | ||||
| 2025-08-14 | 13F | Bank Of America Corp /de/ | 188.121 | 67,64 | 2.647 | 55,56 | ||||
| 2025-05-15 | 13F | Mariner, LLC | 0 | -100,00 | 0 | |||||
| 2025-08-14 | 13F | Jane Street Group, Llc | Call | 10.300 | 1,98 | 145 | -5,88 | |||
| 2025-08-14 | 13F | Jane Street Group, Llc | 19.186 | 270 | ||||||
| 2025-08-12 | 13F | Jpmorgan Chase & Co | 3.843 | 54 | ||||||
| 2025-08-22 | NP | Eagle Point Enhanced Income Trust | 74.896 | 1.054 | ||||||
| 2025-08-06 | 13F | Smh Capital Advisors Inc | 135.485 | -0,39 | 1.906 | -7,52 | ||||
| 2025-08-12 | 13F | Hillsdale Investment Management Inc. | 0 | -100,00 | 0 | |||||
| 2025-08-14 | 13F | Millennium Management Llc | 491.727 | 34,99 | 6.919 | 25,28 | ||||
| 2025-08-13 | 13F | Beacon Pointe Advisors, LLC | 52.400 | 737 | ||||||
| 2025-08-14 | 13F | Aquatic Capital Management LLC | 27.140 | -39,77 | 382 | -44,22 | ||||
| 2025-07-31 | 13F | MQS Management LLC | 10.114 | 142 | ||||||
| 2025-07-18 | 13F | Trust Co Of Vermont | 1.400 | -79,86 | 20 | -81,90 | ||||
| 2025-08-14 | 13F | UBS Group AG | 591.316 | 30,47 | 8.320 | 21,09 | ||||
| 2025-08-14 | 13F | Schonfeld Strategic Advisors LLC | 15.332 | 216 | ||||||
| 2025-07-10 | 13F | Moody National Bank Trust Division | 18.537 | 1,12 | 261 | -6,14 | ||||
| 2025-07-10 | 13F | Wealth Enhancement Advisory Services, Llc | 16.524 | 22,60 | 236 | 15,69 | ||||
| 2025-05-15 | 13F | Concentric Capital Strategies, LP | 0 | -100,00 | 0 | |||||
| 2025-08-13 | 13F | Russell Investments Group, Ltd. | 25 | -92,82 | 0 | -100,00 | ||||
| 2025-09-04 | 13F/A | Advisor Group Holdings, Inc. | 60.877 | 49,63 | 857 | 38,74 | ||||
| 2025-08-14 | 13F | McIlrath & Eck, LLC | 4.186 | 0,00 | 59 | -7,94 | ||||
| 2025-08-29 | 13F | Total Investment Management Inc | 100 | 1 | ||||||
| 2025-08-05 | 13F | Simplex Trading, Llc | 261 | 0 | ||||||
| 2025-07-22 | 13F | Awm Capital, Llc | 64.583 | 14,77 | 952 | 8,06 | ||||
| 2025-08-12 | 13F | BlackRock, Inc. | 315.266 | 30,74 | 4.436 | 21,34 | ||||
| 2025-08-12 | 13F | Dynamic Technology Lab Private Ltd | 26.177 | 24,06 | 368 | 15,00 | ||||
| 2025-08-04 | 13F | Emerald Mutual Fund Advisers Trust | 577.713 | 0,00 | 8.128 | -7,19 | ||||
| 2025-08-08 | 13F | Cetera Investment Advisers | 72.808 | -1,69 | 1.024 | -8,73 | ||||
| 2025-08-14 | 13F | Principal Street Partners, LLC | 24.713 | -7,54 | 348 | -14,32 | ||||
| 2025-08-13 | 13F | Quantbot Technologies LP | 155.851 | 322,26 | 2.193 | 292,13 | ||||
| 2025-08-13 | 13F | PharVision Advisers, LLC | 26.488 | 89,73 | 373 | 76,30 | ||||
| 2025-08-15 | 13F | CI Private Wealth, LLC | 209.838 | 159,64 | 2.952 | 140,98 | ||||
| 2025-08-14 | 13F/A | Rockefeller Capital Management L.P. | 895.784 | 1,89 | 12.604 | -5,43 | ||||
| 2025-07-28 | 13F | Melia Wealth LLC | 1.148.936 | 4,08 | 16.166 | -3,41 | ||||
| 2025-04-17 | 13F | Sound Income Strategies, LLC | 0 | -100,00 | 0 | |||||
| 2025-08-14 | 13F | Gotham Asset Management, LLC | 50.000 | 54,80 | 704 | 43,76 | ||||
| 2025-08-15 | 13F | Tower Research Capital LLC (TRC) | 90 | 172,73 | 1 | |||||
| 2025-08-14 | 13F | Van Eck Associates Corp | 1.520.403 | 10,63 | 21 | 5,00 | ||||
| 2025-08-12 | 13F | Financial Advocates Investment Management | 15.250 | 215 | ||||||
| 2025-08-13 | 13F | Bare Financial Services, Inc | 258 | 4 | ||||||
| 2025-08-12 | 13F | Entropy Technologies, LP | 0 | -100,00 | 0 | |||||
| 2025-08-28 | NP | TRIFX - Catalyst/SMH Total Return Income Fund Class A | 70.337 | 0,00 | 990 | -7,22 | ||||
| 2025-05-30 | NP | PRISX - T. Rowe Price Financial Services Fund, Inc. This fund is a listed as child fund of Price T Rowe Associates Inc /md/ and if that institution has disclosed ownership in this security, then these positions will not be double counted when calculating total shares and total value | 93.024 | -52,42 | 1.410 | -50,16 | ||||
| 2025-08-14 | 13F | Balyasny Asset Management Llc | 0 | -100,00 | 0 | |||||
| 2025-07-28 | NP | KBWD - Invesco KBW High Dividend Yield Financial ETF This fund is a listed as child fund of Invesco Ltd. and if that institution has disclosed ownership in this security, then these positions will not be double counted when calculating total shares and total value | 803.349 | -16,31 | 11.697 | -26,42 | ||||
| 2025-08-13 | 13F | Truvestments Capital Llc | 2.573 | -10,25 | 36 | -16,28 | ||||
| 2025-08-14 | 13F | Royal Bank Of Canada | 34.239 | 33,07 | 482 | 23,59 | ||||
| 2025-08-08 | 13F | Geode Capital Management, Llc | 14.443 | 0,00 | 203 | -6,88 | ||||
| 2025-08-12 | 13F | SRS Capital Advisors, Inc. | 622 | 0,00 | 9 | -11,11 | ||||
| 2025-07-25 | NP | First Trust Specialty Finance & Financial Opportunities Fund This fund is a listed as child fund of First Trust Advisors Lp and if that institution has disclosed ownership in this security, then these positions will not be double counted when calculating total shares and total value | 48.000 | 0,00 | 699 | -12,09 | ||||
| 2025-08-11 | 13F | Lsv Asset Management | 10.161 | 3,54 | 0 | |||||
| 2025-05-14 | 13F | Northwestern Mutual Wealth Management Co | 0 | -100,00 | 0 | |||||
| 2025-08-15 | 13F | Keel Point, LLC | 12.426 | 0,00 | 175 | -7,45 | ||||
| 2025-07-16 | 13F | Eagle Global Advisors Llc | 21.280 | 0,00 | 299 | -7,14 | ||||
| 2025-08-14 | 13F | Sovereign's Capital Management, LLC | 140.268 | 0,00 | 1.974 | -7,20 | ||||
| 2025-08-11 | 13F | Alps Advisors Inc | 23.152 | 3,46 | 326 | -4,13 | ||||
| 2025-08-13 | 13F | Rinkey Investments | 11.957 | -41,63 | 168 | -45,81 | ||||
| 2025-07-29 | 13F | Private Trust Co Na | 1.685 | 24 | ||||||
| 2025-08-12 | 13F | Clear Street Markets Llc | 0 | -100,00 | 0 | |||||
| 2025-07-16 | 13F | Exeter Financial, LLC | 10.166 | 143 | ||||||
| 2025-07-31 | 13F | Catalyst Capital Advisors LLC | 70.337 | 0,00 | 990 | -7,22 | ||||
| 2025-08-14 | 13F | Wells Fargo & Company/mn | 154.759 | 257,68 | 2.177 | 232,37 | ||||
| 2025-08-14 | 13F | Raymond James Financial Inc | 58.792 | 9,90 | 827 | 2,10 | ||||
| 2025-08-18 | 13F | Geneos Wealth Management Inc. | 7.566 | 6,53 | 106 | -0,93 | ||||
| 2025-07-10 | 13F | Peoples Bank/KS | 0 | -100,00 | 0 | |||||
| 2025-04-22 | 13F | Synergy Financial Management, LLC | 0 | -100,00 | 0 | |||||
| 2025-08-14 | 13F | Smartleaf Asset Management LLC | 76 | -50,97 | 1 | -50,00 | ||||
| 2025-07-21 | 13F | Mirae Asset Global Investments Co., Ltd. | 25.000 | 78,57 | 352 | 58,82 | ||||
| 2025-07-28 | 13F | Naviter Wealth, LLC | 21.970 | 18,12 | 320 | 8,84 | ||||
| 2025-06-23 | NP | PPNMX - SmallCap Growth Fund I R-3 | 179.519 | 0,00 | 2.608 | -5,03 | ||||
| 2025-07-22 | 13F | Gsa Capital Partners Llp | 12.330 | -38,77 | 0 | |||||
| 2025-07-18 | 13F | Union Bancaire Privee, UBP SA | 11.760 | 5,08 | 24.658 | 14.489,94 | ||||
| 2025-07-31 | 13F | Quest Partners LLC | 61.157 | 64.275,79 | 860 | 85.900,00 | ||||
| 2025-08-04 | 13F | Emerald Advisers, Llc | 829.710 | 3,87 | 11.674 | -3,59 | ||||
| 2025-08-11 | 13F | Empowered Funds, LLC | 14.168 | -8,33 | 199 | -14,96 | ||||
| 2025-08-26 | NP | GAFCX - Virtus AlphaSimplex Global Alternatives Fund Class C | 2.493 | 35 | ||||||
| 2025-08-12 | 13F | Aigen Investment Management, Lp | 12.758 | 180 | ||||||
| 2025-07-24 | 13F | Ronald Blue Trust, Inc. | 5.929 | 40,33 | 83 | 29,69 | ||||
| 2025-08-11 | 13F | Hexagon Capital Partners LLC | 0 | -100,00 | 0 | |||||
| 2025-08-13 | 13F | EverSource Wealth Advisors, LLC | 1.598 | 58,06 | 22 | 46,67 | ||||
| 2025-08-15 | 13F | Kestra Advisory Services, LLC | 13.677 | 192 | ||||||
| 2025-08-08 | 13F | Creative Planning | 0 | -100,00 | 0 | |||||
| 2025-08-12 | 13F | LPL Financial LLC | 459.325 | 23,15 | 6.463 | 14,29 | ||||
| 2025-06-27 | NP | LBO - WHITEWOLF Publicly Listed Private Equity ETF | 15.456 | 14,29 | 225 | 8,74 | ||||
| 2025-05-15 | 13F | Talon Private Wealth, LLC | 0 | -100,00 | 0 | -100,00 | ||||
| 2025-08-14 | 13F | Susquehanna International Group, Llp | Call | 223.200 | 3.140 | |||||
| 2025-08-08 | 13F | Pnc Financial Services Group, Inc. | 3.000 | 0,00 | 42 | -6,67 | ||||
| 2025-08-14 | 13F | Susquehanna International Group, Llp | Put | 15.100 | 212 | |||||
| 2025-07-31 | 13F | Caitong International Asset Management Co., Ltd | 32 | 0,00 | 0 | |||||
| 2025-08-13 | 13F | Marshall Wace, Llp | 24.563 | 346 | ||||||
| 2025-08-14 | 13F | Cubist Systematic Strategies, LLC | 92.690 | -20,94 | 1.304 | -26,62 | ||||
| 2025-07-02 | 13F | First Financial Bank - Trust Division | 38.665 | 0,00 | 544 | -7,17 | ||||
| 2025-04-22 | 13F | Cambridge Investment Research Advisors, Inc. | 0 | -100,00 | 0 | |||||
| 2025-07-25 | 13F | Cwm, Llc | 288 | 3,60 | 0 | |||||
| 2025-08-14 | 13F | Alliancebernstein L.p. | 0 | -100,00 | 0 | |||||
| 2025-08-19 | 13F | Advisory Services Network, LLC | 160.176 | 52,66 | 2.401 | 51,01 | ||||
| 2025-08-11 | 13F | Private Advisor Group, LLC | 26.478 | 19,47 | 373 | 11,04 | ||||
| 2025-08-14 | 13F | Price T Rowe Associates Inc /md/ | 0 | -100,00 | 0 | |||||
| 2025-08-14 | 13F | State Street Corp | 56.370 | 257,75 | 822 | 233,74 | ||||
| 2025-07-24 | NP | FNCMX - Fidelity Nasdaq Composite Index Fund This fund is a listed as child fund of Fmr Llc and if that institution has disclosed ownership in this security, then these positions will not be double counted when calculating total shares and total value | 14.443 | 0,00 | 210 | -12,13 | ||||
| 2025-07-09 | 13F | Triumph Capital Management | 0 | -100,00 | 0 | |||||
| 2025-07-30 | 13F | Denali Advisors Llc | 102.530 | 1.443 | ||||||
| 2025-08-14 | 13F | Bnp Paribas Arbitrage, Sa | 68 | 1 | ||||||
| 2025-08-12 | 13F | Trexquant Investment LP | 190.369 | -23,78 | 2.678 | -29,27 | ||||
| 2025-08-12 | 13F | Franklin Resources Inc | 507.169 | 53,28 | 7.136 | 42,24 | ||||
| 2025-05-14 | 13F | Susquehanna International Group, Llp | 0 | -100,00 | 0 | -100,00 | ||||
| 2025-08-14 | 13F | Verition Fund Management LLC | 0 | -100,00 | 0 | |||||
| 2025-07-15 | 13F | Colonial River Wealth Management, LLC | 0 | -100,00 | 0 | |||||
| 2025-08-13 | 13F | Jump Financial, LLC | 135.320 | 1.904 | ||||||
| 2025-08-14 | 13F | Hrt Financial Lp | 210.981 | 39,16 | 3 | 0,00 | ||||
| 2025-08-14 | 13F | Ambassador Advisors, LLC | 247.098 | 4,38 | 3.477 | -3,12 | ||||
| 2025-08-14 | 13F | Qube Research & Technologies Ltd | 264.187 | 8,12 | 3.717 | 0,35 | ||||
| 2025-08-14 | 13F | First Commonwealth Financial Corp /pa/ | 23.741 | 0,00 | 334 | -6,96 | ||||
| 2025-08-21 | NP | BIZD - VanEck Vectors BDC Income ETF | 1.464.692 | 5,83 | 20.608 | -1,77 | ||||
| 2025-05-12 | 13F | Fmr Llc | 0 | -100,00 | 0 | |||||
| 2025-08-14 | 13F | Citadel Advisors Llc | Put | 10.400 | -61,90 | 146 | -64,65 | |||
| 2025-08-14 | 13F | Harvest Investment Services, LLC | 11.979 | 0,13 | 169 | -7,18 | ||||
| 2025-08-14 | 13F | GWM Advisors LLC | 10.238 | 2,84 | 144 | -4,00 | ||||
| 2025-07-29 | 13F | Chicago Partners Investment Group LLC | 97.296 | -0,10 | 1.461 | 8,54 | ||||
| 2025-08-14 | 13F | PDT Partners, LLC | 0 | -100,00 | 0 | |||||
| 2025-08-11 | 13F | Citigroup Inc | 0 | -100,00 | 0 | |||||
| 2025-08-14 | 13F | Citadel Advisors Llc | Call | 163.500 | 54,25 | 2.300 | 43,21 | |||
| 2025-05-28 | NP | SMLV - SPDR SSGA US Small Cap Low Volatility Index ETF This fund is a listed as child fund of State Street Corp and if that institution has disclosed ownership in this security, then these positions will not be double counted when calculating total shares and total value | 80.482 | 28,20 | 1.220 | 34,36 | ||||
| 2025-08-07 | 13F | Allworth Financial LP | 3.778 | 53 | ||||||
| 2025-08-14 | 13F | Boothbay Fund Management, Llc | 10.058 | 142 | ||||||
| 2025-08-12 | 13F | Cornerstone Wealth Management, LLC | 32.453 | 10,48 | 457 | 2,47 | ||||
| 2025-07-30 | NP | BFOR - Barron's 400 ETF | 23.152 | -8,89 | 337 | -19,76 | ||||
| 2025-07-14 | 13F | U.S. Capital Wealth Advisors, LLC | 21.000 | 295 | ||||||
| 2025-05-15 | 13F | EJF Capital LLC | 0 | -100,00 | 0 | |||||
| 2025-07-17 | 13F | GraniteShares Advisors LLC | 193.748 | 6,67 | 2.726 | -0,98 | ||||
| 2025-07-11 | 13F | Annex Advisory Services, LLC | 12.227 | 0,00 | 172 | -7,03 | ||||
| 2025-08-13 | 13F | Guggenheim Capital Llc | 39.261 | 5,73 | 552 | -1,78 | ||||
| 2025-08-14 | 13F | Group One Trading, L.p. | 14.378 | -2,98 | 202 | -9,82 | ||||
| 2025-08-14 | 13F | QVT Financial LP | Put | 750.000 | 10.552 | |||||
| 2025-08-13 | 13F | Jones Financial Companies Lllp | 326 | 226,00 | 5 | 300,00 | ||||
| 2025-05-14 | 13F | Comerica Bank | 0 | -100,00 | 0 | |||||
| 2025-08-07 | 13F | Hennion & Walsh Asset Management, Inc. | 255.096 | 3,22 | 3.589 | -4,19 | ||||
| 2025-05-14 | 13F | Campbell & CO Investment Adviser LLC | 0 | -100,00 | 0 | |||||
| 2025-07-09 | 13F | Sunpointe, LLC | 12.000 | 175 | ||||||
| 2025-07-11 | 13F | Farther Finance Advisors, LLC | 2.450 | 0,00 | 34 | -10,53 | ||||
| 2025-08-13 | 13F | M&t Bank Corp | 12.000 | 0,00 | 169 | -7,18 | ||||
| 2025-08-14 | 13F | Two Sigma Investments, Lp | 537.558 | -43,17 | 7.563 | -47,26 | ||||
| 2025-08-04 | 13F | Canton Hathaway, LLC | 96.571 | 1,38 | 1 | 0,00 | ||||
| 2025-05-13 | 13F | BKD Wealth Advisors, LLC | 0 | -100,00 | 0 | |||||
| 2025-08-12 | 13F | Global Retirement Partners, LLC | 1.203 | 0,00 | 17 | -5,88 | ||||
| 2025-08-14 | 13F | Quarry LP | 8.746 | 96,89 | 123 | 83,58 | ||||
| 2025-08-14 | 13F | Brevan Howard Capital Management LP | 62.231 | 876 | ||||||
| 2025-08-13 | 13F | Northern Trust Corp | 93.592 | 785,78 | 1.317 | 722,50 | ||||
| 2025-07-21 | 13F | Ameriflex Group, Inc. | 0 | -100,00 | 0 | |||||
| 2025-08-13 | 13F | JT Stratford LLC | 10.855 | 153 | ||||||
| 2025-08-14 | 13F | D. E. Shaw & Co., Inc. | 19.452 | -81,59 | 274 | -82,95 | ||||
| 2025-07-29 | NP | NKMCX - North Square Kennedy MicroCap Fund Class I | 11.913 | 81,35 | 173 | 60,19 | ||||
| 2025-07-28 | 13F | Harbour Investments, Inc. | 0 | -100,00 | 0 | |||||
| 2025-08-12 | 13F | Proequities, Inc. | 0 | 0 | ||||||
| 2025-08-14 | 13F | Citadel Advisors Llc | 0 | -100,00 | 0 | -100,00 | ||||
| 2025-08-14 | 13F | Ares Management Llc | 545.723 | 0,00 | 7.678 | -7,19 | ||||
| 2025-08-14 | 13F | Goldman Sachs Group Inc | 97.208 | -28,87 | 1.368 | -33,99 | ||||
| 2025-08-29 | NP | GraniteShares ETF Trust - GraniteShares HIPS US High Income ETF | 193.748 | 6,67 | 2.726 | -0,98 | ||||
| 2025-07-03 | 13F | Garde Capital, Inc. | 1.548 | 0,00 | 22 | -8,70 | ||||
| 2025-06-25 | NP | HSPGX - Emerald Growth Fund Class A | 338.791 | 0,00 | 4.923 | -5,04 | ||||
| 2025-08-14 | 13F | Two Sigma Advisers, Lp | 709.500 | -35,12 | 9.983 | -39,79 | ||||
| 2025-08-14 | 13F | Stifel Financial Corp | 423.164 | -0,30 | 5.954 | -7,48 | ||||
| 2025-08-12 | 13F | XTX Topco Ltd | 0 | -100,00 | 0 |
Other Listings
| DE:9F7 | 13,58 € |