Grundlæggende statistik
| Institutionelle aktier (lange) | 250.194.758 - 108,68% (ex 13D/G) - change of -71,78MM shares -22,29% MRQ |
| Institutionel værdi (lang) | $ 8.434.525 USD ($1000) |
Institutionelt ejerskab og aktionærer
Rexford Industrial Realty, Inc. (US:REXR) har 427 institutionelle ejere og aktionærer, der har indsendt 13D/G- eller 13F-formularer til Securities Exchange Commission (SEC). Disse institutioner har i alt 250,194,758 aktier. Største aktionærer omfatter BlackRock, Inc., Vanguard Group Inc, Price T Rowe Associates Inc /md/, Capital International Investors, Principal Financial Group Inc, State Street Corp, Soroban Capital Partners LP, Massachusetts Financial Services Co /ma/, Geode Capital Management, Llc, and Dimensional Fund Advisors Lp .
Rexford Industrial Realty, Inc. (NYSE:REXR) institutionel ejerskabsstruktur viser aktuelle positioner i virksomheden efter institutioner og fonde, samt seneste ændringer i positionsstørrelse. Større aktionærer kan omfatte individuelle investorer, investeringsforeninger, hedgefonde eller institutioner. Skema 13D angiver, at investoren besidder (eller besidder) mere end 5 % af virksomheden og har til hensigt (eller har til hensigt at) aktivt at forfølge en ændring i forretningsstrategi. Skema 13G indikerer en passiv investering på over 5%.
The share price as of April 20, 2026 is 37,45 / share. Previously, on April 21, 2025, the share price was 31,70 / share. This represents an increase of 18,14% over that period.

Fondens stemningsscore
Fund Sentiment Score (fka Ownership Accumulation Score) finder de aktier, der bliver mest købt af fonde. Det er resultatet af en sofistikeret, multi-faktor kvantitativ model, der identificerer virksomheder med de højeste niveauer af institutionel akkumulering. Scoringsmodellen bruger en kombination af den samlede stigning i oplyste ejere, ændringerne i porteføljeallokeringer i disse ejere og andre målinger. Tallet går fra 0 til 100, hvor højere tal indikerer et højere niveau af akkumulering for sine jævnaldrende, og 50 er gennemsnittet.
Opdateringsfrekvens: Dagligt
Se Ownership Explorer, som giver en liste over højest rangerende virksomheder.
AI+ Ask Fintel’s AI assistant about Rexford Industrial Realty, Inc..
Select a question to share a public post with an AI-crafted answer.
Thinking of good questions…
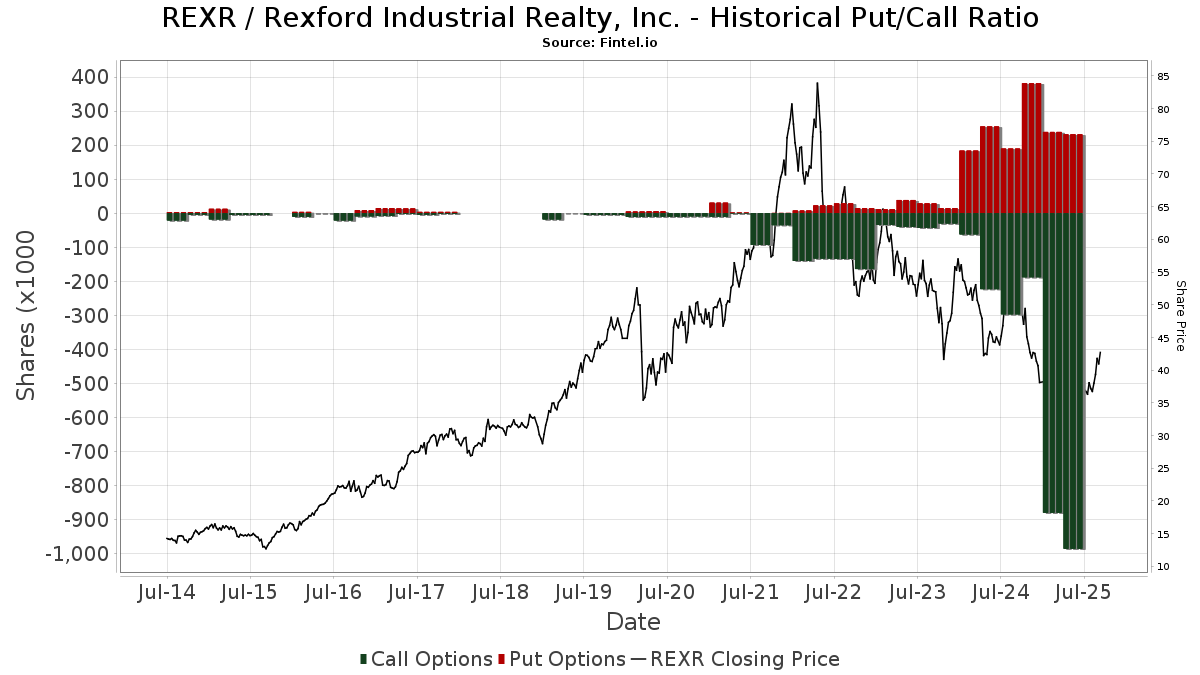
Institutionel Put/Call-forhold
Ud over at indberette standardaktie- og gældsudstedelser skal institutter med mere end 100 mill. aktiver under forvaltning også oplyse deres put- og call-optionsbeholdninger. Da salgsoptioner generelt indikerer negativ stemning, og købsoptioner indikerer positiv stemning, kan vi få en fornemmelse af den overordnede institutionelle stemning ved at plotte forholdet mellem put og kald. Diagrammet til højre viser det historiske put/call-forhold for dette instrument.
Brug af Put/Call Ratio som en indikator for investorernes stemning overvinder en af de vigtigste mangler ved at bruge totalt institutionelt ejerskab, som er, at en betydelig mængde af aktiver under forvaltning investeres passivt for at spore indekser. Passivt forvaltede fonde køber typisk ikke optioner, så indikatoren for put/call-forholdet følger mere nøje følelsen af aktivt forvaltede fonde.
13D/G-arkivering
Vi præsenterer 13D/G ansøgninger separat fra 13F ansøgninger på grund af den forskellige behandling af SEC. 13D/G-ansøgninger kan indgives af grupper af investorer (med én ledende), hvorimod 13F-ansøgninger ikke kan. Dette resulterer i situationer, hvor en investor kan indsende en 13D/G, der rapporterer én værdi for de samlede aktier (der repræsenterer alle de aktier, der ejes af investorgruppen), men derefter indsender en 13F, der rapporterer en anden værdi for de samlede aktier (der udelukkende repræsenterer deres egne) ejendomsret). Det betyder, at aktieejerskab af 13D/G-arkiver og 13F-arkiveringer ofte ikke er direkte sammenlignelige, så vi præsenterer dem separat.
Bemærk: Fra den 16. maj 2021 viser vi ikke længere ejere, der ikke har indsendt en 13D/G inden for det seneste år. Tidligere viste vi den fulde historie af 13D/G-arkiver. Generelt skal enheder, der er forpligtet til at indgive 13D/G-ansøgninger, indgive mindst årligt, før de indsender en afsluttende ansøgning. Dog forlader fonde nogle gange positioner uden at indsende en afsluttende ansøgning (dvs. de afvikler), så visning af den fulde historie resulterede nogle gange i forvirring om det nuværende ejerskab. For at undgå forvirring viser vi nu kun 'aktuelle' ejere - det vil sige - ejere, der har anmeldt inden for det seneste år.
Upgrade to unlock premium data.
| Fil dato | Form | Investor | Forrige Aktier |
Seneste Aktier |
Δ Aktier (Procent) |
Ejendomsret (Procent) |
Δ Ejerskab (Procent) |
|
|---|---|---|---|---|---|---|---|---|
| 2026-03-27 | VANGUARD GROUP INC | 28,981,854 | 0 | -100.00 | 0.00 | -100.00 | ||
| 2026-02-09 | STATE STREET CORP | 11,910,143 | 11,486,620 | -3.56 | 4.90 | -2.00 | ||
| 2025-08-14 | PRICE T ROWE ASSOCIATES INC /MD/ | 28,322,917 | 26,615,304 | -6.03 | 11.20 | -13.18 | ||
| 2025-04-29 | BlackRock, Inc. | 27,067,079 | 26,566,151 | -1.85 | 11.70 | -8.59 |
13F og NPORT arkivering
Detaljer om 13F-arkivering er gratis. Detaljer om NP-ansøgninger kræver et premium-medlemskab. Grønne rækker angiver nye positioner. Røde rækker angiver lukkede positioner. Klik på linket ikon for at se den fulde transaktionshistorik.
Opgrader
for at låse premium-data op og eksportere til Excel ![]() .
.
| Fil dato | Kilde | Investor | Type | Gennemsnitlig pris (Øst) |
Aktier | Δ Aktier (%) |
Rapporteret Værdi ($1000) |
Δ Værdi (%) |
Port Alloc (%) |
|
|---|---|---|---|---|---|---|---|---|---|---|
| 2026-02-05 | 13F | Gamco Investors, Inc. Et Al | 19.731 | 0,00 | 764 | -5,92 | ||||
| 2026-02-11 | 13F | Allianz Asset Management GmbH | 227.792 | 0,91 | 8.820 | -4,96 | ||||
| 2026-02-17 | 13F | Public Employees Retirement System Of Ohio | 396.873 | -3,00 | 15.367 | -8,64 | ||||
| 2026-02-06 | 13F | Twin Capital Management Inc | 24.920 | -0,05 | 965 | -5,86 | ||||
| 2026-02-10 | 13F | Cbre Clarion Securities Llc | 603.046 | 1,52 | 23.350 | -4,38 | ||||
| 2026-02-11 | 13F | Janney Montgomery Scott LLC | 36.274 | -3,50 | 1 | 0,00 | ||||
| 2026-01-26 | 13F | Duff & Phelps Investment Management Co | 1.145.690 | 1,02 | 44.361 | -4,85 | ||||
| 2026-02-17 | 13F | Boothbay Fund Management, Llc | 10.776 | 417 | ||||||
| 2026-02-11 | 13F | Capital International Investors | 20.840.867 | -0,49 | 807.143 | -6,27 | ||||
| 2026-01-26 | 13F | Moran Wealth Management, LLC | 27.396 | 15,16 | 1.061 | 8,50 | ||||
| 2026-02-17 | 13F | Advisory Services Network, LLC | 0 | -100,00 | 0 | |||||
| 2026-02-06 | 13F | HighTower Advisors, LLC | 280.892 | 0,26 | 10.876 | -5,57 | ||||
| 2026-02-11 | 13F | Capital Analysts, Inc. | 105 | 0,00 | 0 | |||||
| 2026-02-13 | 13F | Transamerica Financial Advisors, Inc. | 44 | 2 | ||||||
| 2026-02-17 | 13F | Aster Capital Management (DIFC) Ltd | 0 | -100,00 | 0 | |||||
| 2026-04-10 | 13F | Quaker Wealth Management, LLC | 9 | 0,00 | 0 | |||||
| 2026-01-26 | 13F | Consolidated Portfolio Review Corp | 0 | -100,00 | 0 | |||||
| 2026-02-17 | 13F | Weiss Asset Management LP | 0 | -100,00 | 0 | -100,00 | ||||
| 2026-02-10 | 13F | Quantbot Technologies LP | 840 | 33 | ||||||
| 2026-02-17 | 13F | Waterfront Capital Partners, LLC | 0 | -100,00 | 0 | -100,00 | ||||
| 2026-02-17 | 13F | Dark Forest Capital Management Lp | 0 | -100,00 | 0 | -100,00 | ||||
| 2026-02-17 | 13F | Sagewood Asset Management LP | 6.240 | 242 | ||||||
| 2026-02-13 | 13F | Healthcare Of Ontario Pension Plan Trust Fund | 180.000 | 1.700,00 | 6.970 | 1.595,62 | ||||
| 2026-02-13 | 13F | Y-Intercept (Hong Kong) Ltd | 14.674 | -83,10 | 568 | -84,08 | ||||
| 2026-01-22 | 13F | Massachusetts Financial Services Co /ma/ | 6.258.274 | -17,27 | 242.320 | -22,08 | ||||
| 2026-03-03 | 13F/A | Caitong International Asset Management Co., Ltd | 5.631 | 237,39 | 218 | 220,59 | ||||
| 2026-02-11 | 13F | Meeder Asset Management Inc | 1.113 | 724,44 | 43 | 760,00 | ||||
| 2026-02-06 | 13F | Pnc Financial Services Group, Inc. | 14.046 | 6,75 | 544 | 0,56 | ||||
| 2026-03-12 | 13F/A | Peak6 Llc | 2.376 | -95,91 | 92 | -96,19 | ||||
| 2026-01-22 | 13F | V-Square Quantitative Management LLC | 789 | 31 | ||||||
| 2026-02-11 | 13F | SOUTH STATE Corp | 55 | 0,00 | 2 | 0,00 | ||||
| 2026-02-17 | 13F | Norinchukin Bank, The | 10.631 | -4,74 | 412 | -10,26 | ||||
| 2026-03-12 | 13F/A | Peak6 Llc | Put | 42.400 | -44,50 | 1.642 | -47,74 | |||
| 2026-02-17 | 13F | Shelton Capital Management | 7.687 | 0,00 | 298 | -6,01 | ||||
| 2026-02-10 | 13F | Anchor Capital Advisors Llc | 1.080.234 | -2,78 | 41.827 | -8,43 | ||||
| 2026-02-09 | 13F | MQS Management LLC | 8.535 | 41,99 | 330 | 33,60 | ||||
| 2026-02-11 | 13F | Los Angeles Capital Management Llc | 1.095 | 45 | ||||||
| 2026-01-29 | 13F | UMA Financial Services, Inc. | 68 | -35,24 | 3 | -50,00 | ||||
| 2026-02-11 | 13F | Jpmorgan Chase & Co | 1.414.169 | -63,63 | 54.757 | -65,74 | ||||
| 2026-01-30 | 13F | Safe Harbor Family Capital, LLC | 7.485 | 290 | ||||||
| 2025-11-12 | 13F | Intech Investment Management Llc | 0 | -100,00 | 0 | -100,00 | ||||
| 2026-02-12 | 13F | Wealthspire Advisors, LLC | 0 | -100,00 | 0 | |||||
| 2026-02-17 | 13F | Farringdon Capital, Ltd. | 16.269 | -23,41 | 630 | -27,95 | ||||
| 2026-04-13 | 13F | Mather Group, Llc. | 393 | 13 | ||||||
| 2026-02-12 | 13F | Campbell & CO Investment Adviser LLC | 12.728 | 493 | ||||||
| 2026-02-13 | 13F | Pacific Center for Financial Services | 6 | 0,00 | 0 | |||||
| 2026-02-13 | 13F | Kestra Advisory Services, LLC | 0 | -100,00 | 0 | |||||
| 2026-02-12 | 13F | Colonial Trust Co / SC | 103 | 0,00 | 4 | -25,00 | ||||
| 2026-01-29 | 13F | Comerica Bank | 80.326 | -16,45 | 3.110 | -21,31 | ||||
| 2026-01-30 | 13F | American Capital Advisory, LLC | 11 | 0,00 | 0 | |||||
| 2026-01-30 | 13F | North Star Investment Management Corp. | 8.297 | 0,14 | 321 | -5,59 | ||||
| 2026-02-09 | 13F | Harbour Investments, Inc. | 413 | -11,56 | 16 | -21,05 | ||||
| 2026-02-17 | 13F | Cape Investment Advisory, Inc. | 326 | 169,42 | 13 | 200,00 | ||||
| 2026-02-12 | 13F | Federation des caisses Desjardins du Quebec | 37.877 | 21,57 | 1.467 | 14,53 | ||||
| 2026-02-12 | 13F | Ci Investments Inc. | 0 | -100,00 | 0 | |||||
| 2026-02-12 | 13F | Xponance, Inc. | 22.031 | -17,81 | 853 | -22,52 | ||||
| 2026-02-17 | 13F | Raymond James Financial Inc | 430.066 | 2,09 | 16.652 | -3,84 | ||||
| 2026-02-17 | 13F | SageView Advisory Group, LLC | 210 | 8 | ||||||
| 2026-02-06 | 13F | Global Retirement Partners, LLC | 1.429 | 3.472,50 | 55 | 5.400,00 | ||||
| 2025-11-14 | 13F | Nekton Capital Ltd. | 59.333 | 2.439 | ||||||
| 2026-02-11 | 13F | Deutsche Bank Ag\ | 133.860 | -0,42 | 5.183 | -6,21 | ||||
| 2026-02-17 | 13F | Russell Investments Group, Ltd. | 68.168 | 6,72 | 2.643 | 0,65 | ||||
| 2026-02-05 | 13F | New York Life Investment Management Llc | 20.954 | -12,96 | 811 | -18,00 | ||||
| 2026-02-12 | 13F | CIBC Private Wealth Group, LLC | 5.109 | 3,86 | 198 | -2,48 | ||||
| 2026-01-27 | 13F | First Horizon Corp | 20 | 300,00 | 1 | |||||
| 2026-02-13 | 13F | Marshall Wace, Llp | 0 | -100,00 | 0 | |||||
| 2026-02-11 | 13F | Cerity Partners LLC | 92.604 | -7,77 | 3.586 | -13,13 | ||||
| 2026-04-16 | 13F | Vert Asset Management LLC | 115.021 | -2,81 | 3.765 | -17,85 | ||||
| 2026-02-13 | 13F | Royal London Asset Management Ltd | 2.472.103 | -2,48 | 95.720 | -8,15 | ||||
| 2026-04-06 | 13F | CX Institutional | 649 | 139,48 | 0 | |||||
| 2026-02-11 | 13F | Simplex Trading, Llc | Call | 9.300 | -93,94 | 360 | 5.900,00 | |||
| 2026-02-17 | 13F | Algert Global Llc | 138.870 | 5 | ||||||
| 2026-02-13 | 13F | Neuberger Berman Group LLC | 16.815 | 1,82 | 651 | -3,98 | ||||
| 2026-02-13 | 13F | Wells Fargo & Company/mn | 761.394 | 4,30 | 29.481 | -1,76 | ||||
| 2026-02-11 | 13F | Simplex Trading, Llc | Put | 5.100 | -43,33 | 197 | ||||
| 2026-02-12 | 13F | APG Asset Management US Inc. | 350.557 | 0,00 | 13.574 | -7,46 | ||||
| 2026-04-07 | 13F | Signaturefd, Llc | 3.431 | 0,67 | 112 | -14,50 | ||||
| 2026-02-05 | 13F | Isthmus Partners, Llc | 7.542 | -0,49 | 292 | -6,11 | ||||
| 2026-01-29 | 13F | Coronation Fund Managers Ltd. | 409.723 | 4,87 | 15.864 | -1,23 | ||||
| 2026-04-17 | 13F | Bell Investment Advisors, Inc | 46 | 43,75 | 2 | 0,00 | ||||
| 2026-02-13 | 13F | Hudson Bay Capital Management LP | 395.377 | 15.309 | ||||||
| 2026-02-06 | 13F | EverSource Wealth Advisors, LLC | 3.363 | -3,72 | 130 | -9,09 | ||||
| 2026-02-20 | 13F | Sunbelt Securities, Inc. | 99 | 0,00 | 4 | -25,00 | ||||
| 2026-01-27 | 13F | Horst & Graben Wealth Management LLC | 9.939 | -0,07 | 385 | -5,88 | ||||
| 2026-01-26 | 13F | Mirae Asset Global Investments Co., Ltd. | 6.917 | 33,40 | 268 | 25,35 | ||||
| 2026-02-13 | 13F | Truvestments Capital Llc | 83.088 | -0,56 | 3.217 | -6,32 | ||||
| 2026-02-18 | 13F | Caitlin John, LLC | 1.088 | -84,67 | 42 | -85,57 | ||||
| 2026-01-26 | 13F | Whittier Trust Co | 403.918 | 5,20 | 15.680 | -1,99 | ||||
| 2026-01-29 | 13F | Pictet Asset Management Holding SA | 35.150 | 7,45 | 1.361 | 1,26 | ||||
| 2026-02-17 | 13F | Prosperity Bancshares Inc | 1.224 | 47 | ||||||
| 2026-02-12 | 13F | Dimensional Fund Advisors Lp | 3.496.852 | 2,06 | 135.406 | -3,87 | ||||
| 2026-04-15 | 13F | Spirit Of America Management Corp/ny | 10.500 | 0,00 | 344 | -15,52 | ||||
| 2026-02-17 | 13F | Sophron Capital Management L.P. | 185.944 | 7.200 | ||||||
| 2026-02-13 | 13F | Toroso Investments, LLC | 41.208 | 7,95 | 1.596 | 1,66 | ||||
| 2026-02-17 | 13F | Summit Trail Advisors, Llc | 15.168 | 40,21 | 594 | 32,96 | ||||
| 2025-11-04 | 13F | Guerra Advisors Inc | 40 | 2 | ||||||
| 2026-02-17 | 13F | Creative Planning | 102.362 | 26,84 | 3.963 | 19,48 | ||||
| 2026-02-10 | 13F | Envestnet Asset Management Inc | 489.385 | -5,66 | 18.949 | -11,15 | ||||
| 2026-02-02 | 13F | Davis Selected Advisers | 344.830 | -12,73 | 13.352 | -17,81 | ||||
| 2026-02-13 | 13F | Parkside Financial Bank & Trust | 696 | 16,97 | 27 | 8,33 | ||||
| 2026-02-13 | 13F | Barclays Plc | 188.518 | -90,55 | 7.299 | -91,10 | ||||
| 2026-02-13 | 13F | Smartleaf Asset Management LLC | 42 | 2,44 | 2 | 0,00 | ||||
| 2026-02-10 | 13F | Savant Capital, LLC | 0 | -100,00 | 0 | |||||
| 2025-11-03 | 13F | Annis Gardner Whiting Capital Advisors, LLC | 0 | -100,00 | 0 | |||||
| 2026-02-13 | 13F | Alberta Investment Management Corp | 685.504 | 11,97 | 26.543 | 5,46 | ||||
| 2026-02-13 | 13F | Treasurer of the State of North Carolina | 97.674 | -8,33 | 4 | -25,00 | ||||
| 2025-11-14 | 13F | HighVista Strategies LLC | 0 | -100,00 | 0 | -100,00 | ||||
| 2026-02-09 | 13F | Hartland & Co., LLC | 982 | 15,12 | 38 | 8,57 | ||||
| 2026-01-16 | 13F | Standard Life Aberdeen plc | 84.439 | -5,00 | 3.269 | -11,46 | ||||
| 2026-02-12 | 13F | M&G Plc | 883.769 | -3,62 | 34.467 | -8,33 | ||||
| 2026-02-17 | 13F | Oddo Bhf Asset Management Sas | 0 | -100,00 | 0 | |||||
| 2026-03-06 | 13F | Hsbc Holdings Plc | 387.836 | 17,68 | 15.017 | 10,84 | ||||
| 2026-02-13 | 13F | American Century Companies Inc | 99.017 | -81,66 | 3.834 | -82,73 | ||||
| 2025-11-06 | 13F | Whipplewood Advisors, LLC | 0 | -100,00 | 0 | |||||
| 2026-02-02 | 13F | Strs Ohio | 31.971 | -66,75 | 1.238 | -68,70 | ||||
| 2026-02-17 | 13F | Alliancebernstein L.p. | 405.249 | 3,99 | 15.691 | -2,05 | ||||
| 2026-02-10 | 13F | Measured Wealth Private Client Group, LLC | 592 | 0,00 | 23 | -8,33 | ||||
| 2026-02-17 | 13F | Fmr Llc | 2.339.525 | -3,51 | 90.586 | -9,12 | ||||
| 2026-02-12 | 13F | Cibc World Markets Corp | 1.158.390 | 105,80 | 44.853 | 124,02 | ||||
| 2026-02-17 | 13F | Utah Retirement Systems | 39.110 | 0,00 | 1.514 | -5,79 | ||||
| 2026-02-03 | 13F | Drucker Wealth 3.0, LLC | 14.463 | 55,07 | 560 | 46,21 | ||||
| 2025-11-14 | 13F | AXA Investment Managers S.A. | 129.778 | 5.335 | ||||||
| 2025-11-10 | 13F | Greenland Capital Management LP | 0 | -100,00 | 0 | -100,00 | ||||
| 2026-02-13 | 13F | Van Eck Associates Corp | 130.715 | 4,13 | 5 | 0,00 | ||||
| 2026-01-08 | 13F | Nordea Investment Management Ab | 187.818 | -13,46 | 7.284 | -18,17 | ||||
| 2026-02-12 | 13F | Chilton Capital Management Llc | 309.620 | -9,53 | 12.110 | -14,65 | ||||
| 2026-04-08 | 13F | Wealth Enhancement Advisory Services, Llc | 44.310 | -32,63 | 1.468 | -42,54 | ||||
| 2026-04-14 | 13F | Nbc Securities, Inc. | 733 | 3,68 | 24 | -14,81 | ||||
| 2026-02-17 | 13F/A | RBF Capital, LLC | 10.000 | 0,00 | 387 | -5,84 | ||||
| 2026-02-09 | 13F | Hantz Financial Services, Inc. | 6.588 | 84,90 | 0 | |||||
| 2026-01-29 | 13F | Koa Wealth Management, LLC | 45.860 | 12,89 | 1.776 | 6,29 | ||||
| 2026-02-17 | 13F | Citadel Advisors Llc | 434.900 | -24,06 | 16.839 | -28,48 | ||||
| 2025-10-31 | 13F | Symphony Financial, Ltd. Co. | 0 | -100,00 | 0 | -100,00 | ||||
| 2026-02-12 | 13F | Bank Of Montreal /can/ | 28.920 | -46,10 | 1.120 | -49,25 | ||||
| 2026-02-13 | 13F | State Street Corp | 11.484.490 | -3,08 | 449.502 | -8,66 | ||||
| 2026-02-17 | 13F | Citadel Advisors Llc | Put | 36.900 | -46,91 | 1.429 | -50,02 | |||
| 2026-02-17 | 13F | Citadel Advisors Llc | Call | 47.000 | -72,83 | 1.820 | -74,42 | |||
| 2026-02-17 | 13F | Tudor Investment Corp Et Al | Call | 0 | -100,00 | 0 | -100,00 | |||
| 2026-02-19 | 13F | CI Private Wealth, LLC | 12.643 | 56,69 | 490 | 47,73 | ||||
| 2026-02-23 | 13F | Mv Capital Management, Inc. | 7 | 16,67 | 0 | |||||
| 2026-02-12 | 13F | Principal Securities, Inc. | 0 | -100,00 | 0 | |||||
| 2025-11-13 | 13F | Kennedy Capital Management, Inc. | 0 | -100,00 | 0 | |||||
| 2026-02-17 | 13F | T. Rowe Price Investment Management, Inc. | 33 | 0,00 | 0 | |||||
| 2026-02-17 | 13F | FIL Ltd | 111.288 | 4,08 | 4.309 | -1,96 | ||||
| 2026-02-17 | 13F | Quantinno Capital Management LP | 93.790 | 37,92 | 3.632 | 29,91 | ||||
| 2026-04-10 | 13F | Abound Wealth Management | 5 | 0,00 | 0 | |||||
| 2026-02-12 | 13F | Nuveen, LLC | 2.828.584 | -5,71 | 109.523 | -11,19 | ||||
| 2026-01-26 | 13F | Private Trust Co Na | 524 | 103,10 | 20 | 100,00 | ||||
| 2026-02-10 | 13F | Westpac Banking Corp | 75.432 | 14,84 | 2.921 | 8,15 | ||||
| 2026-04-20 | 13F | State of Alaska, Department of Revenue | 138.530 | 0,13 | 5 | -20,00 | ||||
| 2026-01-30 | 13F | State of New Jersey Common Pension Fund D | 273.200 | -4,88 | 10.578 | -10,41 | ||||
| 2026-02-12 | 13F | Brinker Capital Investments, LLC | 12.648 | 41,62 | 490 | 33,24 | ||||
| 2026-01-22 | 13F | True North Advisors, LLC | 0 | -100,00 | 0 | |||||
| 2026-01-22 | 13F | Ofi Invest Asset Management | 12.189 | -3,09 | 402 | -8,86 | ||||
| 2026-02-19 | 13F | Invesco Ltd. | 605.390 | -70,62 | 23.441 | -72,33 | ||||
| 2026-02-12 | 13F | Centersquare Investment Management Llc | 2.862.569 | -5,29 | 110.839 | -10,79 | ||||
| 2026-02-13 | 13F | BNP Paribas Asset Management Holding S.A. | 698.780 | 35,54 | 27 | 28,57 | ||||
| 2026-02-17 | 13F | Schonfeld Strategic Advisors LLC | 5.435 | 210 | ||||||
| 2026-02-17 | 13F | Argosy-Lionbridge Management, LLC | 538.661 | -10,94 | 20.864 | -16,09 | ||||
| 2026-02-02 | 13F | Fifth Third Bancorp | 2.040 | 3,03 | 79 | -3,70 | ||||
| 2026-02-09 | 13F | PGGM Investments | 981.766 | -45,02 | 38 | -47,95 | ||||
| 2026-02-17 | 13F | Cambria Investment Management, L.P. | 16.295 | 0,03 | 631 | -5,83 | ||||
| 2026-04-16 | 13F | Evolve Private Wealth, Llc | 19.252 | -14,28 | 630 | -28,33 | ||||
| 2026-02-10 | 13F | Natixis Advisors, L.p. | 421.375 | 3,68 | 16 | 0,00 | ||||
| 2026-02-10 | 13F/A | Northwestern Mutual Wealth Management Co | 14.175 | 392,02 | 549 | 364,41 | ||||
| 2026-02-10 | 13F | Ilmarinen Mutual Pension Insurance Co | 34.000 | 0,00 | 1 | 0,00 | ||||
| 2026-02-17 | 13F | Elequin Capital Lp | 74 | 3 | ||||||
| 2026-02-09 | 13F | Huntington National Bank | 548 | -1,26 | 21 | -4,55 | ||||
| 2025-11-14 | 13F | Masterton Capital Management, LP | 0 | -100,00 | 0 | |||||
| 2026-02-02 | 13F | Wolverine Asset Management Llc | 72.385 | 2.803 | ||||||
| 2026-02-13 | 13F | Sterling Capital Management LLC | 57.334 | -5,28 | 2.220 | -10,81 | ||||
| 2026-02-13 | 13F | Charles Schwab Investment Management Inc | 3.327.085 | 3,43 | 128.825 | -2,58 | ||||
| 2026-02-17 | 13F | Royal Bank Of Canada | 255.463 | -63,52 | 9.892 | -65,64 | ||||
| 2026-02-11 | 13F | Empowered Funds, LLC | 3.222 | 125 | ||||||
| 2026-02-13 | 13F | Nfj Investment Group, Llc | 0 | -100,00 | 0 | |||||
| 2025-11-14 | 13F | Fred Alger Management, Llc | 0 | -100,00 | 0 | -100,00 | ||||
| 2026-04-02 | 13F | Marex Group plc | 0 | -100,00 | 0 | -100,00 | ||||
| 2026-01-29 | 13F | State Of Michigan Retirement System | 54.882 | -2,31 | 2.125 | -7,97 | ||||
| 2025-11-07 | 13F | Synovus Financial Corp | 14.105 | -0,36 | 580 | 15,11 | ||||
| 2025-11-17 | 13F | Kestra Investment Management, LLC | 0 | -100,00 | 0 | -100,00 | ||||
| 2026-02-12 | 13F | New York State Common Retirement Fund | 112.291 | -4,26 | 4.348 | -9,83 | ||||
| 2026-02-06 | 13F | Fairtree Asset Management (Pty) Ltd | 22.659 | 0,00 | 877 | -5,80 | ||||
| 2026-02-10 | 13F | Nomura Asset Management Co Ltd | 349.880 | 1,85 | 13.547 | -4,07 | ||||
| 2026-02-11 | 13F | Parallel Advisors, LLC | 6.374 | 11,14 | 247 | 4,68 | ||||
| 2026-02-17 | 13F | Wellington Management Group Llp | 2.484.087 | -0,59 | 96.184 | -6,37 | ||||
| 2026-02-13 | 13F | SRS Capital Advisors, Inc. | 10.736 | -41,06 | 416 | -44,52 | ||||
| 2026-01-27 | 13F | Zurcher Kantonalbank (Zurich Cantonalbank) | 162.156 | 5,89 | 6.279 | -0,27 | ||||
| 2026-01-26 | 13F | Whittier Trust Co Of Nevada Inc | 173.394 | 1,12 | 6.731 | -5,79 | ||||
| 2026-02-12 | 13F | Hilton Capital Management, LLC | 33.623 | 10,95 | 1.302 | 4,50 | ||||
| 2025-11-14 | 13F | Axa S.a. | 0 | -100,00 | 0 | |||||
| 2026-02-10 | 13F | Connor, Clark & Lunn Investment Management Ltd. | 327.234 | 12.670 | ||||||
| 2025-11-14 | 13F | WealthTrak Capital Management LLC | 0 | -100,00 | 0 | |||||
| 2026-02-13 | 13F | Neo Ivy Capital Management | 0 | -100,00 | 0 | -100,00 | ||||
| 2026-01-29 | 13F | Quent Capital, LLC | 997 | 0,30 | 39 | -5,00 | ||||
| 2026-02-09 | 13F | William Blair Investment Management, Llc | 935.111 | 7,75 | 36.207 | 1,49 | ||||
| 2026-02-13 | 13F | Kayne Anderson Rudnick Investment Management Llc | 2.700 | 0,00 | 105 | -5,45 | ||||
| 2026-02-06 | 13F | Diamond Hill Capital Management Inc | 426.840 | 0,00 | 16.527 | -5,81 | ||||
| 2026-04-14 | 13F | Zrc Wealth Management, Llc | 43 | 1 | ||||||
| 2026-01-16 | 13F | First Pacific Financial | 0 | -100,00 | 0 | |||||
| 2026-02-17 | 13F | United Capital Financial Advisers, Llc | 0 | -100,00 | 0 | |||||
| 2026-02-17 | 13F | TCG Advisory Services, LLC | 5.834 | 0,00 | 226 | -5,86 | ||||
| 2026-04-08 | 13F | Ausbil Investment Management Ltd | 0 | -100,00 | 0 | |||||
| 2026-02-13 | 13F | LGT Financial Advisors LLC | 174 | 1,16 | 7 | -14,29 | ||||
| 2026-02-17 | 13F | Abel Hall, LLC | 8.714 | 19,21 | 337 | 12,33 | ||||
| 2026-02-09 | 13F | Fisher Asset Management, LLC | 66.823 | 0,05 | 2.587 | -5,76 | ||||
| 2026-02-05 | 13F | Atria Investments Llc | 14.818 | -11,53 | 574 | -16,72 | ||||
| 2025-11-14 | 13F | Holocene Advisors, LP | 0 | -100,00 | 0 | -100,00 | ||||
| 2026-02-06 | 13F | Larson Financial Group LLC | 474 | 100,00 | 18 | 100,00 | ||||
| 2026-02-13 | 13F | Natixis | 0 | -100,00 | 0 | |||||
| 2026-01-15 | 13F | Retirement Systems of Alabama | 597.393 | -1,11 | 23.131 | -6,86 | ||||
| 2026-02-12 | 13F | Jane Street Group, Llc | Call | 91.700 | 214,04 | 3.551 | 195,83 | |||
| 2026-04-16 | 13F | Capital Advisors, Ltd. LLC | 223 | -32,42 | 0 | |||||
| 2026-02-13 | 13F | Rhumbline Advisers | 656.491 | -4,74 | 25.419 | -10,28 | ||||
| 2026-02-12 | 13F | Jane Street Group, Llc | 207.512 | 8.035 | ||||||
| 2026-02-03 | 13F | International Assets Investment Management, Llc | 105 | 4 | ||||||
| 2026-02-12 | 13F | Jane Street Group, Llc | Put | 61.700 | 196,63 | 2.389 | 179,42 | |||
| 2026-02-17 | 13F | Delaware Management Holdings, Inc. | 1.071.238 | 41.479 | ||||||
| 2026-02-17 | 13F | Bayesian Capital Management, LP | 0 | -100,00 | 0 | |||||
| 2026-02-06 | 13F | ProShare Advisors LLC | 9.315 | -7,25 | 361 | -12,62 | ||||
| 2026-02-12 | 13F | Skopos Labs, Inc. | 6.820 | 266 | ||||||
| 2025-11-13 | 13F | Arrowstreet Capital, Limited Partnership | 0 | -100,00 | 0 | |||||
| 2026-02-12 | 13F | BlackRock, Inc. | 38.006.662 | 7,98 | 1.471.618 | 1,70 | ||||
| 2026-02-17 | 13F | Cetera Investment Advisers | 47.762 | 0,20 | 1.849 | -5,62 | ||||
| 2026-01-29 | 13F | IMC-Chicago, LLC | Call | 0 | -100,00 | 0 | -100,00 | |||
| 2026-02-17 | 13F | California State Teachers Retirement System | 225.021 | 0,39 | 8.713 | -5,45 | ||||
| 2026-02-13 | 13F | Wealth Alliance | 0 | -100,00 | 0 | |||||
| 2026-02-14 | 13F | Rockefeller Capital Management L.P. | 4.884 | 8,75 | 189 | 2,72 | ||||
| 2026-01-15 | 13F | Warwick Investment Management, Inc. | 8.657 | 0,00 | 335 | -5,63 | ||||
| 2026-02-13 | 13F | 1832 Asset Management L.P. | 0 | -100,00 | 0 | |||||
| 2026-04-02 | 13F | MJT & Associates Financial Advisory Group, Inc. | 6 | 0,00 | 0 | |||||
| 2025-12-09 | 13F/A | Tudor Investment Corp Et Al | Put | 0 | -100,00 | 0 | -100,00 | |||
| 2026-02-09 | 13F | Knights of Columbus Asset Advisors LLC | 42.566 | -6,85 | 1.648 | -12,25 | ||||
| 2026-02-04 | 13F | Oregon Public Employees Retirement Fund | 46.244 | -2,73 | 1.791 | -8,39 | ||||
| 2026-04-14 | 13F | Moisand Fitzgerald Tamayo, LLC | 0 | -100,00 | 0 | |||||
| 2026-02-12 | 13F | California Public Employees Retirement System | 449.821 | 2,33 | 17.417 | -3,62 | ||||
| 2026-02-17 | 13F | Bank Of America Corp /de/ | 2.239.710 | -14,36 | 86.722 | -19,34 | ||||
| 2026-04-20 | 13F | Friedenthal Financial | 0 | -100,00 | 0 | |||||
| 2026-02-17 | 13F | NEOS Investment Management LLC | 31.056 | 43,08 | 1.202 | 34,75 | ||||
| 2026-02-10 | 13F | Eurizon Capital SGR S.p.A. | 16.732 | 659 | ||||||
| 2026-02-18 | 13F | First Citizens Bank & Trust Co | 21.279 | 5,62 | 824 | -0,60 | ||||
| 2026-01-29 | 13F | Vanguard Group Inc | 31.930.569 | -1,22 | 1.236.352 | -6,96 | ||||
| 2026-02-17 | 13F | Guggenheim Capital Llc | 0 | -100,00 | 0 | |||||
| 2026-02-12 | 13F | Cloud Capital Management, LLC | 0 | -100,00 | 0 | |||||
| 2026-02-10 | 13F | Goldman Sachs Group Inc | 2.205.098 | -72,81 | 85.381 | -74,39 | ||||
| 2026-02-13 | 13F | Brasada Capital Management, Lp | 26.040 | -5,76 | 1.016 | -11,03 | ||||
| 2026-02-12 | 13F | Quadrant Capital Group Llc | 11.545 | 10,25 | 447 | 3,95 | ||||
| 2026-02-13 | 13F | Citigroup Inc | 263.537 | 41,33 | 10.204 | 33,12 | ||||
| 2026-02-17 | 13F | Susquehanna International Group, Llp | 38.991 | 85,25 | 1.510 | 74,45 | ||||
| 2026-02-17 | 13F | Susquehanna International Group, Llp | Put | 154.500 | -40,99 | 5.982 | -44,42 | |||
| 2026-02-17 | 13F | Susquehanna International Group, Llp | Call | 18.400 | -94,03 | 712 | -94,38 | |||
| 2025-11-07 | 13F | TCTC Holdings, LLC | 0 | -100,00 | 0 | -100,00 | ||||
| 2026-02-09 | 13F | Quest Partners LLC | 13.582 | -1,03 | 526 | -6,91 | ||||
| 2026-02-09 | 13F | Keating Financial Advisory Services, Inc. | 77 | 3 | ||||||
| 2026-02-13 | 13F | Sei Investments Co | 606.913 | -0,03 | 23.500 | -5,85 | ||||
| 2026-01-15 | 13F | Allspring Global Investments Holdings, LLC | 24.071 | 13,22 | 939 | 5,62 | ||||
| 2026-01-23 | 13F | Halbert Hargrove Global Advisors, Llc | 0 | -100,00 | 0 | |||||
| 2026-02-11 | 13F | T3 Companies, LLC | 11.500 | 445 | ||||||
| 2026-04-14 | 13F | Perpetual Ltd | 8.860 | 290 | ||||||
| 2026-04-15 | 13F | FNY Investment Advisers, LLC | 0 | -100,00 | 0 | |||||
| 2025-11-14 | 13F | Cohen & Steers, Inc. | 0 | -100,00 | 0 | |||||
| 2026-02-09 | 13F | New Age Alpha Advisors, LLC | 201.528 | -9,41 | 7.803 | -14,67 | ||||
| 2026-02-04 | 13F | Securian Asset Management, Inc | 16.929 | -4,27 | 655 | -9,78 | ||||
| 2026-04-07 | 13F | Park Avenue Securities Llc | 0 | -100,00 | 0 | |||||
| 2026-02-11 | 13F | LPL Financial LLC | 65.019 | -43,60 | 2.518 | -46,89 | ||||
| 2026-02-06 | 13F | Profund Advisors Llc | 0 | -100,00 | 0 | |||||
| 2026-02-11 | 13F | Ameritas Investment Partners, Inc. | 42.573 | 1.648 | ||||||
| 2026-02-04 | 13F | First Foundation Advisors | 77.454 | -1,72 | 2.999 | -7,41 | ||||
| 2026-02-13 | 13F | Victory Capital Management Inc | 34.968 | -6,33 | 1.354 | -11,80 | ||||
| 2026-04-15 | 13F | Exchange Traded Concepts, Llc | 3.755 | 23,68 | 123 | 4,27 | ||||
| 2026-02-11 | 13F | Twin Tree Management, LP | Put | 61.200 | 5,70 | 2.370 | -0,46 | |||
| 2026-02-11 | 13F | Sunrise Financial Services, LLC | 53 | 2 | ||||||
| 2025-11-07 | 13F | Shell Asset Management Co | 3.179 | -53,22 | 0 | |||||
| 2026-02-05 | 13F | North Dakota State Investment Board | 8.373 | 324 | ||||||
| 2026-02-09 | 13F | Wiser Advisor Group LLC | 830 | 1,10 | 32 | -3,03 | ||||
| 2025-11-14 | 13F | Texas Permanent School Fund | 0 | -100,00 | 0 | |||||
| 2026-02-02 | 13F | Sachetta, LLC | 106 | 0,00 | 4 | 0,00 | ||||
| 2026-01-28 | 13F | DekaBank Deutsche Girozentrale | 64.054 | 0,00 | 3 | 50,00 | ||||
| 2026-02-17 | 13F | Lantern Wealth Advisors, LLC | 0 | -100,00 | 0 | |||||
| 2026-02-10 | 13F | Lido Advisors, LLC | 5.517 | 0,27 | 229 | 0,44 | ||||
| 2026-02-10 | 13F | Commonwealth Of Pennsylvania Public School Empls Retrmt Sys | 134.370 | -2,88 | 5.203 | -8,53 | ||||
| 2026-02-10 | 13F | Bnp Paribas Arbitrage, Sa | 914.878 | 2,84 | 35.424 | -3,13 | ||||
| 2025-11-14 | 13F | Wetherby Asset Management Inc | 6.344 | 1,67 | 261 | 17,65 | ||||
| 2026-02-17 | 13F | Redwood Investment Management, Llc | 28.377 | 1 | ||||||
| 2026-01-27 | 13F | Asset Management One Co., Ltd. | 328.403 | -1,57 | 12.798 | -6,70 | ||||
| 2026-02-10 | 13F | Rothschild Investment Llc | 37.516 | -0,05 | 1.453 | -5,90 | ||||
| 2025-11-21 | 13F/A | CIBC Bancorp USA Inc. | 1.162.062 | 47.772 | ||||||
| 2025-11-04 | 13F | American Assets Capital Advisers, LLC | 15.239 | -63,66 | 626 | -58,01 | ||||
| 2026-04-06 | 13F | Highline Wealth Partners Llc | 1.316 | 0,00 | 43 | -14,00 | ||||
| 2026-04-10 | 13F/A | Aegon Asset Management Uk Plc | 32.596 | 0,00 | 1.260 | 125.800,00 | ||||
| 2026-04-20 | 13F | Kestra Private Wealth Services, Llc | 0 | -100,00 | 0 | |||||
| 2026-04-07 | 13F | Farther Finance Advisors, LLC | 2.154 | 20,74 | 71 | 1,45 | ||||
| 2026-02-10 | 13F | Root Financial Partners, LLC | 225 | -27,65 | 9 | -33,33 | ||||
| 2026-02-17 | 13F | Captrust Financial Advisors | 17.858 | -4,06 | 691 | -9,67 | ||||
| 2026-02-02 | 13F | Truist Financial Corp | 6.987 | 3,33 | 271 | -2,53 | ||||
| 2026-02-13 | 13F | Cornerstone Financial Management LLC | 13 | 1 | ||||||
| 2026-04-16 | 13F | SG Americas Securities, LLC | 549.251 | -17,71 | 18 | -32,00 | ||||
| 2026-02-17 | 13F | Janus Henderson Group Plc | 102.083 | 0,00 | 3.949 | -5,84 | ||||
| 2026-01-28 | 13F | Salomon & Ludwin, LLC | 129 | 0,00 | 5 | 0,00 | ||||
| 2026-01-14 | 13F | Pallas Capital Advisors LLC | 7.014 | -0,69 | 272 | -6,55 | ||||
| 2026-01-22 | 13F | Vision Financial Markets Llc | 0 | -100,00 | 0 | |||||
| 2026-01-22 | 13F | Brookwood Investment Group LLC | 10.672 | 4,35 | 413 | -1,67 | ||||
| 2026-01-05 | 13F | Chesapeake Asset Management Llc | 0 | -100,00 | 0 | -100,00 | ||||
| 2026-02-17 | 13F | Tower Research Capital LLC (TRC) | 9.318 | -52,71 | 361 | -55,56 | ||||
| 2026-02-09 | 13F | Wcm Investment Management, Llc | 54.510 | 0,00 | 2.166 | -4,37 | ||||
| 2026-01-23 | 13F | Robeco Institutional Asset Management B.V. | 124.253 | 19,18 | 4.811 | 12,28 | ||||
| 2026-02-17 | 13F | Imprint Wealth LLC | 0 | -100,00 | 0 | |||||
| 2026-02-17 | 13F | Maryland State Retirement & Pension System | 11.518 | 0,00 | 446 | -5,92 | ||||
| 2025-11-13 | 13F | BRITISH COLUMBIA INVESTMENT MANAGEMENT Corp | 0 | -100,00 | 0 | |||||
| 2026-02-13 | 13F | Stifel Financial Corp | 89.187 | -6,57 | 3.453 | -12,00 | ||||
| 2026-01-23 | 13F | Assetmark, Inc | 43.409 | 3,76 | 1.681 | -2,27 | ||||
| 2026-02-09 | 13F | Avalon Trust Co | 1.640 | 0,00 | 64 | -5,97 | ||||
| 2026-02-17 | 13F | Infrastructure Capital Advisors, Llc | 30.745 | 5,76 | 1.190 | -0,92 | ||||
| 2026-02-17 | 13F | Clear Street Markets Llc | 600 | 23 | ||||||
| 2025-11-13 | 13F | Employees Retirement System of Texas | 0 | -100,00 | 0 | -100,00 | ||||
| 2026-02-06 | 13F | Gsa Capital Partners Llp | 8.064 | 0 | ||||||
| 2026-02-17 | 13F | Clear Street Markets Llc | Put | 600 | 23 | |||||
| 2026-02-11 | 13F | Capital International Inc /ca/ | 96.409 | 26,74 | 3.733 | 19,35 | ||||
| 2026-02-17 | 13F | Soroban Capital Partners LP | 9.191.038 | 0,00 | 377.844 | 0,00 | ||||
| 2026-01-08 | 13F | Fulton Bank, N.a. | 5.496 | -5,21 | 213 | -10,92 | ||||
| 2026-01-28 | 13F | Teacher Retirement System Of Texas | 7.829 | -75,60 | 303 | -77,03 | ||||
| 2025-11-14 | 13F | Man Group plc | 0 | -100,00 | 0 | |||||
| 2026-02-13 | 13F | Nan Shan Life Insurance Co., Ltd. | 517.579 | 0,00 | 20.041 | -5,81 | ||||
| 2026-01-23 | 13F | TFC Financial Management | 14 | 0,00 | 1 | |||||
| 2026-02-11 | 13F | Twin Tree Management, LP | 0 | -100,00 | 0 | -100,00 | ||||
| 2026-02-05 | 13F | Thrivent Financial For Lutherans | 106.501 | 3,53 | 4 | 0,00 | ||||
| 2026-01-28 | 13F | Arizona State Retirement System | 65.879 | -5,94 | 2.551 | -11,43 | ||||
| 2026-02-06 | 13F | Handelsbanken Fonder AB | 87.602 | 40,61 | 3 | 50,00 | ||||
| 2026-02-11 | 13F | Twin Tree Management, LP | Call | 0 | -100,00 | 0 | -100,00 | |||
| 2026-02-17 | 13F | DoubleLine ETF Adviser LP | 15.323 | 4,59 | 593 | -1,50 | ||||
| 2026-01-26 | 13F | KBC Group NV | 6.894 | 0,00 | 0 | |||||
| 2026-02-12 | 13F | Advisors Asset Management, Inc. | 0 | -100,00 | 0 | |||||
| 2026-01-21 | 13F | Azzad Asset Management Inc /adv | 8.716 | 1,08 | 337 | -4,80 | ||||
| 2025-11-14 | 13F | Mount Yale Investment Advisors, LLC | 0 | -100,00 | 0 | -100,00 | ||||
| 2026-01-28 | 13F | Klp Kapitalforvaltning As | 52.800 | 6,88 | 2.064 | 0,73 | ||||
| 2026-04-13 | 13F | True Wealth Design, LLC | 193 | -32,52 | 6 | -45,45 | ||||
| 2026-02-12 | 13F | MetLife Investment Management, LLC | 119.982 | -6,26 | 4.646 | -11,71 | ||||
| 2025-11-14 | 13F | Land & Buildings Investment Management, LLC | 0 | -100,00 | 0 | |||||
| 2026-02-06 | 13F | Pathway Financial Advisers, LLC | 0 | -100,00 | 0 | |||||
| 2026-02-17 | 13F | State Of Wisconsin Investment Board | 21.536 | -47,46 | 834 | -50,56 | ||||
| 2026-02-05 | 13F | Northwestern Mutual Investment Management Company, Llc | 51.973 | -1,25 | 2.012 | -6,98 | ||||
| 2026-02-05 | 13F | Bessemer Group Inc | 440 | 0,00 | 0 | |||||
| 2026-02-10 | 13F | Daiwa Securities Group Inc. | 97.754 | 2,88 | 4 | 0,00 | ||||
| 2026-02-06 | 13F | Bare Financial Services, Inc | 91 | 30,00 | 4 | 50,00 | ||||
| 2026-02-13 | 13F | Morgan Stanley | 3.265.811 | -26,53 | 126.452 | -30,80 | ||||
| 2026-02-03 | 13F | Sumitomo Mitsui DS Asset Management Company, Ltd | 53.370 | 0,00 | 2.066 | -5,83 | ||||
| 2026-02-17 | 13F | Tudor Investment Corp Et Al | 468.424 | 18.137 | ||||||
| 2026-02-13 | 13F | Pathstone Holdings, LLC | 18.292 | 25,01 | 709 | 17,80 | ||||
| 2026-02-09 | 13F/A | Fideuram - Intesa Sanpaolo Private Banking S.p.a. | 880 | 34 | ||||||
| 2026-04-13 | 13F | IFP Advisors, Inc | 767 | 8,03 | 25 | -7,41 | ||||
| 2026-02-09 | 13F | Geode Capital Management, Llc | 4.644.325 | -1,00 | 179.862 | -6,75 | ||||
| 2026-02-09 | 13F | Ar Asset Management Inc | 57.050 | -25,96 | 2 | -33,33 | ||||
| 2026-04-20 | 13F | Louisiana State Employees Retirement System | 66.800 | 3,89 | 2.186 | -12,17 | ||||
| 2026-02-11 | 13F | Group One Trading, L.p. | Call | 17.700 | -73,46 | 685 | -75,02 | |||
| 2026-02-11 | 13F | Group One Trading, L.p. | Put | 22.900 | -30,18 | 887 | -34,27 | |||
| 2026-02-12 | 13F | Federated Hermes, Inc. | 18.681 | 5,12 | 723 | -0,96 | ||||
| 2026-02-12 | 13F | IFM Investors Pty Ltd | 37.990 | -1,58 | 1 | -99,94 | ||||
| 2025-11-12 | 13F | Simplex Trading, Llc | 0 | -100,00 | 0 | |||||
| 2026-02-11 | 13F | Group One Trading, L.p. | 3.807 | 147 | ||||||
| 2026-02-10 | 13F | CIBC World Markets Inc. | 1.000.030 | 0,00 | 38.721 | -5,81 | ||||
| 2025-11-13 | 13F | Inceptionr Llc | 0 | -100,00 | 0 | |||||
| 2026-02-03 | 13F | Mitsubishi UFJ Kokusai Asset Management Co., Ltd. | 183.326 | 2,60 | 7.155 | -2,59 | ||||
| 2026-02-11 | 13F | Vestcor Inc | 43.651 | 0,00 | 2 | 0,00 | ||||
| 2026-02-10 | 13F | CIBC Asset Management Inc | 6.722 | 0,00 | 260 | -5,80 | ||||
| 2026-02-17 | 13F | Apollo Management Holdings, L.P. | 233.090 | 9.025 | ||||||
| 2026-01-28 | 13F | B. Metzler seel. Sohn & Co. AG | 54.510 | 0,00 | 2.111 | -5,80 | ||||
| 2026-02-04 | 13F | Dogwood Wealth Management LLC | 0 | -100,00 | 0 | |||||
| 2025-11-12 | 13F | NewSquare Capital LLC | 0 | -100,00 | 0 | -100,00 | ||||
| 2026-02-13 | 13F | Pinnacle Wealth Planning Services, Inc. | 258 | 10 | ||||||
| 2026-02-17 | 13F | Gotham Asset Management, LLC | 186.875 | -23,63 | 7.236 | -28,08 | ||||
| 2026-02-17 | 13F | Advisor Group Holdings, Inc. | 4.595 | -45,70 | 178 | -48,85 | ||||
| 2026-02-03 | 13F | Sequoia Financial Advisors, LLC | 19.065 | -9,73 | 738 | -14,98 | ||||
| 2026-02-17 | 13F | Capital Fund Management S.a. | Call | 0 | -100,00 | 0 | ||||
| 2026-02-10 | 13F | Pasadena Private Wealth, LLC | Call | 6.500 | 29 | |||||
| 2026-02-23 | 13F | Wealth Preservation Advisors, LLC | 47 | 0,00 | 2 | 0,00 | ||||
| 2025-11-14 | 13F | Mariner, LLC | 0 | -100,00 | 0 | |||||
| 2026-04-10 | 13F | Oak Thistle LLC | 99.243 | 63,71 | 3.248 | 38,39 | ||||
| 2026-02-03 | 13F | Crossmark Global Holdings, Inc. | 14.305 | -0,05 | 554 | -5,95 | ||||
| 2026-02-17 | 13F | Capital Fund Management S.a. | Put | 0 | -100,00 | 0 | ||||
| 2026-02-13 | 13F | Heitman Real Estate Securities Llc | 10.232 | 0,00 | 396 | -5,71 | ||||
| 2026-02-10 | 13F | Bank of New York Mellon Corp | 1.866.204 | 4,36 | 72.259 | -1,70 | ||||
| 2026-02-13 | 13F | Kempen Capital Management N.v. | 166.396 | 30,21 | 6.443 | 22,63 | ||||
| 2025-10-30 | 13F | Twin Peaks Wealth Advisors, LLC | 0 | -100,00 | 0 | |||||
| 2026-01-27 | 13F | Bayforest Capital Ltd | 0 | -100,00 | 0 | |||||
| 2026-02-13 | 13F | Police & Firemen's Retirement System of New Jersey | 98.501 | -5,65 | 3.814 | -11,14 | ||||
| 2026-02-06 | 13F | Envestnet Portfolio Solutions, Inc. | 21.720 | 4,50 | 841 | -1,52 | ||||
| 2026-02-12 | 13F | Benson Wealth Management INC | 47 | 2 | ||||||
| 2026-02-04 | 13F | Swiss Life Asset Management Ltd | 10.855 | 1,05 | 420 | -4,76 | ||||
| 2026-01-29 | 13F | Teachers Retirement System Of The State Of Kentucky | 64.863 | 0,00 | 3 | 0,00 | ||||
| 2026-04-06 | 13F | GAMMA Investing LLC | 3.208 | 5,21 | 105 | -11,86 | ||||
| 2026-02-12 | 13F | EntryPoint Capital, LLC | 0 | -100,00 | 0 | |||||
| 2026-02-17 | 13F | Ameriprise Financial Inc | 814.934 | 6,55 | 31.559 | 0,35 | ||||
| 2026-02-10 | 13F | Principia Wealth Advisory, LLC | 20 | 0,00 | 1 | |||||
| 2026-02-11 | 13F | Metis Global Partners, LLC | 54.944 | 3,23 | 2.127 | -2,79 | ||||
| 2026-04-15 | 13F | Gf Fund Management Co. Ltd. | 3.579 | -8,72 | 117 | -22,52 | ||||
| 2026-02-12 | 13F | Paralel Advisors LLC | 40.000 | 0,00 | 1.549 | -5,84 | ||||
| 2026-02-03 | 13F | Farmers & Merchants Investments Inc | 202 | 8,02 | 8 | 0,00 | ||||
| 2026-02-12 | 13F | Alps Advisors Inc | 0 | -100,00 | 0 | |||||
| 2026-04-08 | 13F | Legacy Wealth Asset Management, LLC | 15.286 | 6,63 | 500 | -9,91 | ||||
| 2026-02-12 | 13F | Voya Investment Management Llc | 17.233 | -12,36 | 667 | -17,45 | ||||
| 2026-02-03 | 13F | American Assets Inc | 0 | -100,00 | 0 | |||||
| 2026-02-12 | 13F | Swiss National Bank | 466.716 | 1,70 | 18.071 | -4,21 | ||||
| 2026-02-05 | 13F | Td Private Client Wealth Llc | 16.148 | 5,90 | 625 | -0,16 | ||||
| 2026-02-17 | 13F | Pinnacle Financial Partners, Inc. | 13.435 | 520 | ||||||
| 2026-02-02 | 13F | Cornerstone Planning Group LLC | 43 | 59,26 | 2 | |||||
| 2026-04-15 | 13F | Merit Financial Group, LLC | 17.379 | 19,44 | 569 | 0,89 | ||||
| 2026-01-23 | 13F | Private Wealth Management Group, LLC | 23 | 0,00 | 1 | |||||
| 2026-02-17 | 13F | Magnetar Financial LLC | 21.543 | 834 | ||||||
| 2026-02-04 | 13F | Versor Investments LP | 29.071 | 1.126 | ||||||
| 2026-04-13 | 13F | Massmutual Trust Co Fsb/adv | 874 | 7,37 | 29 | -9,68 | ||||
| 2026-02-12 | 13F | Rossby Financial, LCC | 67 | 91,43 | 3 | 100,00 | ||||
| 2026-02-13 | 13F | MAI Capital Management | 236 | 2,16 | 9 | 0,00 | ||||
| 2026-01-21 | 13F | Raleigh Capital Management Inc. | 0 | 0 | ||||||
| 2026-01-23 | 13F | Optima Capital Llc | 1 | 0 | ||||||
| 2026-02-17 | 13F | Nomura Holdings Inc | 865.145 | 57,96 | 33.498 | 48,78 | ||||
| 2025-11-14 | 13F | Freestone Grove Partners LP | 0 | -100,00 | 0 | |||||
| 2026-02-06 | 13F | Covestor Ltd | 5.464 | -11,31 | 0 | |||||
| 2026-02-13 | 13F | Meixler Investment Management, Ltd. | 11.364 | 8,29 | 440 | 2,09 | ||||
| 2026-02-17 | 13F | Wiley Bros.-aintree Capital, Llc | 7.617 | -32,21 | 295 | -35,67 | ||||
| 2026-04-17 | 13F | Fifth Third Wealth Advisors LLC | 6.995 | 11,83 | 229 | -5,79 | ||||
| 2026-02-05 | 13F/A | Fulcrum Asset Management LLP | 1.370 | 0,00 | 54 | -3,57 | ||||
| 2026-02-13 | 13F | Prudential Financial Inc | 141.878 | -31,48 | 5.494 | -35,47 | ||||
| 2026-02-18 | 13F | GWM Advisors LLC | 8.500 | 329 | ||||||
| 2026-02-06 | 13F | Motco | 491 | 0,00 | 19 | -5,00 | ||||
| 2026-02-13 | 13F | Dynamic Technology Lab Private Ltd | 10.190 | 395 | ||||||
| 2026-01-27 | 13F | Evergreen Capital Management Llc | 0 | -100,00 | 0 | |||||
| 2026-02-09 | 13F | Legal & General Group Plc | 2.731.914 | 12,17 | 105.780 | 5,65 | ||||
| 2025-10-21 | 13F | Optimum Investment Advisors | 150 | 0,00 | 6 | 20,00 | ||||
| 2026-02-09 | 13F | Atlantic Trust, LLC | 138 | -1,43 | 5 | 0,00 | ||||
| 2025-10-24 | 13F | Hemington Wealth Management | 33 | 0,00 | 0 | |||||
| 2026-02-11 | 13F | Hughes Financial Services, LLC | 30 | 0,00 | 1 | 0,00 | ||||
| 2026-01-30 | 13F | Us Bancorp \de\ | 5.320 | -11,61 | 206 | -17,00 | ||||
| 2026-04-06 | 13F | Versant Capital Management, Inc | 815 | 149,24 | 27 | 116,67 | ||||
| 2026-02-11 | 13F | Manchester Capital Management LLC | 46 | 2 | ||||||
| 2026-02-17 | 13F | Adage Capital Partners Gp, L.l.c. | 0 | -100,00 | 0 | |||||
| 2026-02-05 | 13F | Elyxium Wealth, LLC | 277 | 11 | ||||||
| 2026-02-13 | 13F | First Trust Advisors Lp | 58.115 | -3,35 | 2.250 | -8,94 | ||||
| 2025-11-14 | 13F | Verition Fund Management LLC | 0 | -100,00 | 0 | |||||
| 2026-02-11 | 13F | Cedar Mountain Advisors, LLC | 163 | 0,00 | 6 | 0,00 | ||||
| 2026-02-13 | 13F | Macquarie Group Ltd | 1.620.333 | -2,67 | 62.739 | -8,33 | ||||
| 2026-02-17 | 13F | CWM Advisors, LLC | 8.300 | 12,15 | 321 | 5,59 | ||||
| 2025-11-13 | 13F | Prudent Man Advisors, LLC | 0 | -100,00 | 0 | |||||
| 2026-02-17 | 13F | ClearAlpha Technologies LP | 6.359 | 246 | ||||||
| 2026-02-13 | 13F | Manufacturers Life Insurance Company, The | 0 | -100,00 | 0 | |||||
| 2026-02-24 | 13F/A | Pacer Advisors, Inc. | 141.414 | -8,59 | 5.476 | -13,92 | ||||
| 2026-04-16 | 13F | Westmount Partners, LLC | 7.990 | 0,00 | 262 | -15,53 | ||||
| 2025-11-14 | 13F | Wolverine Trading, Llc | 5.950 | 5,50 | 247 | 21,08 | ||||
| 2026-01-29 | 13F | IMC-Chicago, LLC | 12.732 | 493 | ||||||
| 2026-02-17 | 13F | Millennium Management Llc | 171.834 | -54,17 | 6.653 | -56,84 | ||||
| 2025-11-14 | 13F | Wolverine Trading, Llc | Call | 31.800 | -5,36 | 1.321 | 8,46 | |||
| 2026-01-29 | 13F | IMC-Chicago, LLC | Put | 31.600 | 14,08 | 1.224 | 7,47 | |||
| 2025-11-07 | 13F | Presima Inc. | 0 | -100,00 | 0 | -100,00 | ||||
| 2025-11-14 | 13F | Wolverine Trading, Llc | Put | 11.400 | -14,93 | 474 | -2,47 | |||
| 2026-02-13 | 13F | Ubs Asset Management Americas Inc | 526 | 78,31 | 20 | 66,67 | ||||
| 2026-02-09 | 13F | 44 Wealth Management Llc | 17.577 | 1,37 | 681 | -4,49 | ||||
| 2026-01-21 | 13F | Avantra Family Wealth, Inc. | 6.415 | -1,31 | 248 | -7,12 | ||||
| 2026-02-13 | 13F | Ieq Capital, Llc | 0 | -100,00 | 0 | |||||
| 2026-02-17 | 13F | Jones Financial Companies Lllp | 3.271 | 75,95 | 127 | 63,64 | ||||
| 2026-02-13 | 13F/A | Virtus ETF Advisers LLC | 0 | -100,00 | 0 | |||||
| 2026-01-28 | 13F | M&t Bank Corp | Call | 447 | 4 | |||||
| 2026-02-10 | 13F | Bruce G. Allen Investments, LLC | 28 | 0,00 | 1 | 0,00 | ||||
| 2026-02-17 | 13F | Virtus Investment Advisers, Inc. | 4.029 | -1,54 | 156 | -7,14 | ||||
| 2026-01-15 | 13F | Nisa Investment Advisors, Llc | 35.758 | -25,38 | 1.404 | -29,73 | ||||
| 2026-01-16 | 13F | Ronald Blue Trust, Inc. | 0 | -100,00 | 0 | |||||
| 2026-02-11 | 13F | O'shaughnessy Asset Management, Llc | 13.472 | 45,79 | 522 | 37,47 | ||||
| 2025-10-30 | 13F | Covestor Ltd | Put | 0 | -100,00 | 0 | ||||
| 2026-02-17 | 13F | Canada Pension Plan Investment Board | 360.845 | 0,00 | 13.972 | -5,82 | ||||
| 2026-02-17 | 13F | Landmark Investment Partners, L.p. | Call | 35.700 | -68,18 | 1.382 | -70,03 | |||
| 2026-02-17 | 13F | Northern Trust Corp | 3.378.050 | -4,00 | 130.798 | -9,58 | ||||
| 2026-02-06 | 13F | Meiji Yasuda Asset Management Co Ltd. | 5.331 | -2,84 | 206 | -8,44 | ||||
| 2026-01-23 | 13F | Deprince Race & Zollo Inc | 562.507 | 1,41 | 21.780 | -4,49 | ||||
| 2026-02-10 | 13F | Marshall & Sterling Wealth Advisors Inc. | 0 | -100,00 | 0 | |||||
| 2026-02-13 | 13F | Public Employees Retirement Association Of Colorado | 20.595 | 0,00 | 1 | |||||
| 2026-01-29 | 13F | UBS Group AG | 860.478 | -62,89 | 33.318 | -65,05 | ||||
| 2026-02-11 | 13F | Zions Bancorporation, National Association /ut/ | 506 | 20 | ||||||
| 2026-02-10 | 13F | New Mexico Educational Retirement Board | 51.500 | 0,00 | 2 | -50,00 | ||||
| 2026-01-29 | 13F | Dunhill Financial, LLC | 13 | 1 | ||||||
| 2026-01-21 | 13F | Yousif Capital Management, Llc | 79.463 | -3,11 | 3.146 | -6,70 | ||||
| 2026-02-17 | 13F | Amundi | 135.918 | 10,87 | 5.263 | 3,04 | ||||
| 2026-02-06 | 13F | Evoke Wealth, Llc | 25.093 | 0,08 | 983 | -5,67 | ||||
| 2026-02-13 | 13F | Mml Investors Services, Llc | 5.478 | 11,43 | 212 | 4,95 | ||||
| 2026-02-17 | 13F | Ancora Advisors, LLC | 326 | 13 | ||||||
| 2026-02-17 | 13F | XTX Topco Ltd | 199.747 | 2.164,71 | 7.734 | 2.036,46 | ||||
| 2026-01-28 | 13F | Universal- Beteiligungs- und Servicegesellschaft mbH | 399.795 | 12,93 | 15.803 | 8,59 | ||||
| 2026-04-13 | 13F | Reinhart Partners, Inc. | 160.416 | -6,31 | 5.250 | -20,80 | ||||
| 2026-02-02 | 13F | Danske Bank A/s | 2.800 | 0,00 | 108 | -6,09 | ||||
| 2026-02-12 | 13F/A | Pinebridge Investments Llc | 72.096 | 2.792 | ||||||
| 2026-01-23 | 13F | Sumitomo Mitsui Trust Holdings, Inc. | 323.592 | 24,33 | 12.529 | 17,09 | ||||
| 2026-01-30 | 13F | New York State Teachers Retirement System | 218.887 | -1,16 | 8 | -11,11 | ||||
| 2025-10-22 | 13F | Geneos Wealth Management Inc. | 0 | -100,00 | 0 | -100,00 | ||||
| 2026-02-02 | 13F | Principal Financial Group Inc | 11.518.739 | 19,53 | 446.006 | 12,58 | ||||
| 2026-02-13 | 13F | JustInvest LLC | 26.772 | 10,90 | 1.037 | 4,44 | ||||
| 2026-02-20 | 13F/A | Prestige Wealth Management Group LLC | 0 | -100,00 | 0 | |||||
| 2025-11-14 | 13F | Lazard Asset Management Llc | 0 | -100,00 | 0 | |||||
| 2026-02-06 | 13F | Resona Asset Management Co.,Ltd. | 97.468 | -6,96 | 3.796 | -12,68 | ||||
| 2026-02-03 | 13F | Everence Capital Management Inc | 20.460 | 0,00 | 1 | |||||
| 2026-01-26 | 13F | AE Wealth Management LLC | 6.084 | 1,18 | 236 | -4,86 | ||||
| 2026-02-17 | 13F | Mercer Global Advisors Inc /adv | 13.507 | 14,36 | 523 | 7,63 | ||||
| 2026-02-17 | 13F | Engineers Gate Manager LP | 663.472 | 1.208,52 | 25.690 | 1.132,68 | ||||
| 2026-02-02 | 13F | Oppenheimer Asset Management Inc. | 33.164 | -5,54 | 1.284 | -11,02 | ||||
| 2026-02-13 | 13F | LRT Capital Management, LLC | 0 | -100,00 | 0 | |||||
| 2026-04-13 | 13F | Creative Financial Designs Inc /adv | 104 | 0,97 | 3 | 0,00 | ||||
| 2026-02-06 | 13F | Aew Capital Management L P | 5.200 | 246,67 | 201 | 229,51 | ||||
| 2026-02-17 | 13F | Price T Rowe Associates Inc /md/ | 28.336.003 | 2,41 | 1.097 | -3,52 | ||||
| 2025-11-13 | 13F | FORA Capital, LLC | 0 | -100,00 | 0 | |||||
| 2026-02-18 | 13F | State of Tennessee, Treasury Department | 611.184 | 0,21 | 24.771 | -1,20 | ||||
| 2026-02-27 | 13F | Strategic Investment Solutions, Inc. /IL | 93 | 0,00 | 4 | 0,00 | ||||
| 2026-01-29 | 13F | Sanctuary Advisors, LLC | 21.229 | -16,74 | 822 | -21,66 | ||||
| 2026-01-23 | 13F | Avion Wealth | 42 | -6,67 | 0 | |||||
| 2026-02-13 | 13F | Umb Bank N A/mo | 2.956 | 25,52 | 114 | 18,75 | ||||
| 2025-10-28 | 13F | BRYN MAWR TRUST Co | 2.440 | 100 | ||||||
| 2026-04-15 | 13F | Activest Wealth Management | 117 | 4 | ||||||
| 2025-11-03 | 13F | Pandora Wealth, Inc. | 0 | -100,00 | 0 | |||||
| 2026-02-13 | 13F | Edgestream Partners, L.P. | 171.063 | 6.624 | ||||||
| 2026-02-10 | 13F | Mutual Of America Capital Management Llc | 96.676 | -11,35 | 3.743 | -16,51 | ||||
| 2026-02-12 | 13F | Ensign Peak Advisors, Inc | 14.651 | -66,97 | 567 | -68,90 | ||||
| 2026-02-17 | 13F | Graham Capital Management, L.P. | 27.130 | 1.050 | ||||||
| 2026-01-30 | 13F/A | M&t Bank Corp | 25.271 | 353,94 | 979 | 327,51 | ||||
| 2026-02-13 | 13F | Quarry LP | 2.999 | 116 | ||||||
| 2026-02-10 | 13F | Pasadena Private Wealth, LLC | 15.392 | 596 | ||||||
| 2026-02-06 | 13F | Cullen/frost Bankers, Inc. | 54 | 0,00 | 2 | 0,00 | ||||
| 2026-02-03 | 13F | F/M Investments LLC | 0 | -100,00 | 0 | |||||
| 2026-02-05 | 13F | High Note Wealth, LLC | 132 | -2,94 | 5 | 0,00 | ||||
| 2026-02-10 | 13F | Norges Bank | 1.905.402 | 73.777 | ||||||
| 2026-02-12 | 13F | State Board Of Administration Of Florida Retirement System | 159.207 | 0,00 | 6.164 | -5,82 | ||||
| 2026-01-20 | 13F | Cromwell Holdings LLC | 37 | 0,00 | 1 | 0,00 | ||||
| 2026-02-05 | 13F | Allworth Financial LP | 905 | -7,93 | 35 | -12,50 | ||||
| 2026-01-14 | 13F | Hennion & Walsh Asset Management, Inc. | 10.255 | -2,61 | 397 | -8,10 | ||||
| 2026-02-13 | 13F | Landscape Capital Management, L.l.c. | 8.338 | 323 | ||||||
| 2026-02-13 | 13F | Great West Life Assurance Co /can/ | 519.033 | -4,61 | 20 | -9,09 | ||||
| 2026-01-26 | 13F | Cwm, Llc | 27.276 | 1,69 | 1 | 0,00 | ||||
| 2026-02-05 | 13F | Amalgamated Bank | 102.509 | -4,88 | 4 | -25,00 | ||||
| 2026-02-11 | 13F | Rise Advisors, LLC | 0 | -100,00 | 0 | |||||
| 2026-02-03 | 13F | Pilgrim Partners Asia Pte Ltd | 0 | -100,00 | 0 | -100,00 | ||||
| 2026-02-13 | 13F | National Bank Of Canada /fi/ | 2.098.000 | 53,14 | 81.235 | 44,24 | ||||
| 2026-04-13 | 13F | Global X Japan Co., Ltd. | 1.308 | 2,43 | 43 | -14,29 | ||||
| 2026-02-17 | 13F | Cresset Asset Management, LLC | 0 | -100,00 | 0 | |||||
| 2026-02-12 | 13F | Commonwealth Equity Services, Llc | 8.389 | -82,79 | 325 | 16.100,00 | ||||
| 2025-11-13 | 13F | Schroder Investment Management Group | 0 | -100,00 | 0 | |||||
| 2026-02-12 | 13F | Sun Life Financial Inc | 0 | -100,00 | 0 | |||||
| 2026-02-17 | 13F | Aqr Capital Management Llc | 569.436 | -2,65 | 22.049 | -8,31 | ||||
| 2026-02-17 | 13F | Nissay Asset Management Corp /japan/ /adv | 35.717 | 1,21 | 1.383 | -4,69 | ||||
| 2026-02-17 | 13F | Polymer Capital Management (US) LLC | 15.809 | 612 | ||||||
| 2026-02-17 | 13F | Westwood Holdings Group Inc | 807.226 | 16,20 | 31.256 | 9,45 | ||||
| 2026-02-11 | 13F | Franklin Resources Inc | 89.568 | 92,88 | 3.468 | 81,76 | ||||
| 2025-11-14 | 13F | PineBridge Investments, L.P. | 83.457 | -64,89 | 3.431 | -59,43 | ||||
| 2026-01-27 | 13F | Lecap Asset Management Ltd | 0 | -100,00 | 0 | |||||
| 2026-02-12 | 13F | UniSuper Management Pty Ltd | 48.300 | -28,23 | 1.870 | -32,39 | ||||
| 2026-02-11 | 13F | Capital Group Private Client Services, Inc. | 0 | -100,00 | 0 |
Other Listings
| DE:3I0 | 31,39 € |