Grundlæggende statistik
| Institutionelle aktier (lange) | 190.706.307 - 68,99% (ex 13D/G) - change of -10,44MM shares -5,18% MRQ |
| Institutionel værdi (lang) | $ 10.638.622 USD ($1000) |
Institutionelt ejerskab og aktionærer
Magna International Inc. (US:MGA) har 438 institutionelle ejere og aktionærer, der har indsendt 13D/G- eller 13F-formularer til Securities Exchange Commission (SEC). Disse institutioner har i alt 190,706,307 aktier. Største aktionærer omfatter Pzena Investment Management Llc, Vanguard Group Inc, Royal Bank Of Canada, Hotchkis & Wiley Capital Management Llc, FIL Ltd, CIBC World Markets Inc., ACR Alpine Capital Research, LLC, Bank Of Montreal /can/, Td Asset Management Inc, and Arrowstreet Capital, Limited Partnership .
Magna International Inc. (NYSE:MGA) institutionel ejerskabsstruktur viser aktuelle positioner i virksomheden efter institutioner og fonde, samt seneste ændringer i positionsstørrelse. Større aktionærer kan omfatte individuelle investorer, investeringsforeninger, hedgefonde eller institutioner. Skema 13D angiver, at investoren besidder (eller besidder) mere end 5 % af virksomheden og har til hensigt (eller har til hensigt at) aktivt at forfølge en ændring i forretningsstrategi. Skema 13G indikerer en passiv investering på over 5%.
The share price as of March 27, 2026 is 54,38 / share. Previously, on March 31, 2025, the share price was 33,99 / share. This represents an increase of 59,99% over that period.

Fondens stemningsscore
Fund Sentiment Score (fka Ownership Accumulation Score) finder de aktier, der bliver mest købt af fonde. Det er resultatet af en sofistikeret, multi-faktor kvantitativ model, der identificerer virksomheder med de højeste niveauer af institutionel akkumulering. Scoringsmodellen bruger en kombination af den samlede stigning i oplyste ejere, ændringerne i porteføljeallokeringer i disse ejere og andre målinger. Tallet går fra 0 til 100, hvor højere tal indikerer et højere niveau af akkumulering for sine jævnaldrende, og 50 er gennemsnittet.
Opdateringsfrekvens: Dagligt
Se Ownership Explorer, som giver en liste over højest rangerende virksomheder.
AI+ Ask Fintel’s AI assistant about Magna International Inc..
Select a question to share a public post with an AI-crafted answer.
Thinking of good questions…
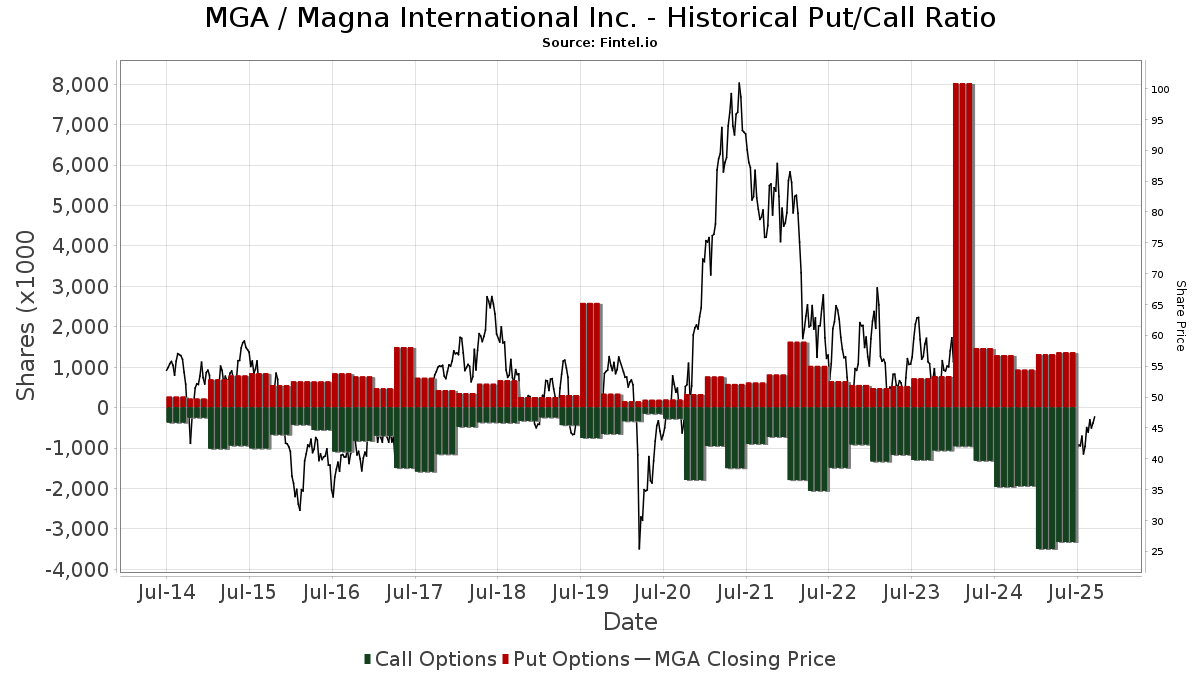
Institutionel Put/Call-forhold
Ud over at indberette standardaktie- og gældsudstedelser skal institutter med mere end 100 mill. aktiver under forvaltning også oplyse deres put- og call-optionsbeholdninger. Da salgsoptioner generelt indikerer negativ stemning, og købsoptioner indikerer positiv stemning, kan vi få en fornemmelse af den overordnede institutionelle stemning ved at plotte forholdet mellem put og kald. Diagrammet til højre viser det historiske put/call-forhold for dette instrument.
Brug af Put/Call Ratio som en indikator for investorernes stemning overvinder en af de vigtigste mangler ved at bruge totalt institutionelt ejerskab, som er, at en betydelig mængde af aktiver under forvaltning investeres passivt for at spore indekser. Passivt forvaltede fonde køber typisk ikke optioner, så indikatoren for put/call-forholdet følger mere nøje følelsen af aktivt forvaltede fonde.
13D/G-arkivering
Vi præsenterer 13D/G ansøgninger separat fra 13F ansøgninger på grund af den forskellige behandling af SEC. 13D/G-ansøgninger kan indgives af grupper af investorer (med én ledende), hvorimod 13F-ansøgninger ikke kan. Dette resulterer i situationer, hvor en investor kan indsende en 13D/G, der rapporterer én værdi for de samlede aktier (der repræsenterer alle de aktier, der ejes af investorgruppen), men derefter indsender en 13F, der rapporterer en anden værdi for de samlede aktier (der udelukkende repræsenterer deres egne) ejendomsret). Det betyder, at aktieejerskab af 13D/G-arkiver og 13F-arkiveringer ofte ikke er direkte sammenlignelige, så vi præsenterer dem separat.
Bemærk: Fra den 16. maj 2021 viser vi ikke længere ejere, der ikke har indsendt en 13D/G inden for det seneste år. Tidligere viste vi den fulde historie af 13D/G-arkiver. Generelt skal enheder, der er forpligtet til at indgive 13D/G-ansøgninger, indgive mindst årligt, før de indsender en afsluttende ansøgning. Dog forlader fonde nogle gange positioner uden at indsende en afsluttende ansøgning (dvs. de afvikler), så visning af den fulde historie resulterede nogle gange i forvirring om det nuværende ejerskab. For at undgå forvirring viser vi nu kun 'aktuelle' ejere - det vil sige - ejere, der har anmeldt inden for det seneste år.
Upgrade to unlock premium data.
| Fil dato | Form | Investor | Forrige Aktier |
Seneste Aktier |
Δ Aktier (Procent) |
Ejendomsret (Procent) |
Δ Ejerskab (Procent) |
|
|---|---|---|---|---|---|---|---|---|
| 2025-07-17 | BlackRock, Inc. | 10,384,567 | 14,201,674 | 36.76 | 5.00 | 4.17 |
13F og NPORT arkivering
Detaljer om 13F-arkivering er gratis. Detaljer om NP-ansøgninger kræver et premium-medlemskab. Grønne rækker angiver nye positioner. Røde rækker angiver lukkede positioner. Klik på linket ikon for at se den fulde transaktionshistorik.
Opgrader
for at låse premium-data op og eksportere til Excel ![]() .
.
| Fil dato | Kilde | Investor | Type | Gennemsnitlig pris (Øst) |
Aktier | Δ Aktier (%) |
Rapporteret Værdi ($1000) |
Δ Værdi (%) |
Port Alloc (%) |
|
|---|---|---|---|---|---|---|---|---|---|---|
| 2025-11-14 | 13F | Wetherby Asset Management Inc | 6.715 | 0,40 | 318 | 23,26 | ||||
| 2026-02-13 | 13F | Towarzystwo Funduszy Inwestycyjnych Pzu Sa | 0 | -100,00 | 0 | |||||
| 2026-02-12 | 13F | Bank Of Montreal /can/ | Put | 0 | -100,00 | 0 | -100,00 | |||
| 2026-02-17 | 13F | Summit Global Investments | 50.081 | 3 | ||||||
| 2025-11-07 | 13F | Atticus Wealth Management, Llc | 0 | -100,00 | 0 | -100,00 | ||||
| 2026-02-11 | 13F | Prudential Plc | 4.128 | -84,84 | 220 | -82,93 | ||||
| 2026-02-17 | 13F | Warren Averett Asset Management, LLC | 6.760 | 3,92 | 360 | 16,88 | ||||
| 2026-01-23 | 13F | Reuter James Wealth Management, Llc | 4.821 | 0,00 | 257 | 12,28 | ||||
| 2026-02-17 | 13F | Susquehanna International Group, Llp | Put | 59.200 | -59,23 | 3.155 | -54,14 | |||
| 2026-02-10 | 13F | Godfrey Financial Associates, Inc. | 16 | 1 | ||||||
| 2026-02-17 | 13F | Susquehanna International Group, Llp | Call | 193.400 | -15,21 | 10.308 | -4,62 | |||
| 2026-02-17 | 13F | Sig Brokerage, Lp | 6.926 | 369 | ||||||
| 2026-01-16 | 13F | Kendall Capital Management | 9.230 | 4,47 | 492 | 17,46 | ||||
| 2026-02-13 | 13F | Candriam Luxembourg S.C.A. | 275.637 | 11,87 | 14.714 | 26,01 | ||||
| 2026-01-23 | 13F | Rsm Us Wealth Management Llc | 4.775 | 2,31 | 256 | 15,84 | ||||
| 2026-02-12 | 13F | Federated Hermes, Inc. | 81.132 | -1,57 | 4.324 | 10,73 | ||||
| 2026-02-17 | 13F | Agf Management Ltd | 361.836 | 20,80 | 19.287 | 35,91 | ||||
| 2026-02-17 | 13F | Royal Bank Of Canada | Put | 0 | -100,00 | 0 | ||||
| 2026-02-05 | 13F | Bessemer Group Inc | 58 | 0 | ||||||
| 2026-02-17 | 13F | Brevan Howard Capital Management LP | 0 | -100,00 | 0 | |||||
| 2026-02-17 | 13F | Royal Bank Of Canada | Call | 0 | -100,00 | 0 | ||||
| 2026-02-06 | 13F | Global Retirement Partners, LLC | 1.469 | 195,57 | 78 | 239,13 | ||||
| 2026-01-08 | 13F | Versant Capital Management, Inc | 938 | 3,19 | 50 | 13,95 | ||||
| 2026-01-23 | 13F | Assetmark, Inc | 5 | 400,00 | 0 | |||||
| 2026-02-06 | 13F | Larson Financial Group LLC | 18 | -35,71 | 1 | -100,00 | ||||
| 2026-02-13 | 13F | Gen-Wealth Partners Inc | 301 | 0,00 | 16 | 14,29 | ||||
| 2025-11-12 | 13F | Simplex Trading, Llc | 0 | -100,00 | 0 | -100,00 | ||||
| 2026-02-11 | 13F | Franklin Resources Inc | 82.516 | 5,17 | 4.399 | 18,35 | ||||
| 2025-11-14 | 13F | Summit Street Capital Management, LLC | 0 | -100,00 | 0 | |||||
| 2026-02-02 | 13F | Cornerstone Planning Group LLC | 7 | 0,00 | 0 | |||||
| 2026-02-12 | 13F | Skandinaviska Enskilda Banken AB (publ) | 1.076.820 | 106,50 | 57.395 | 132,30 | ||||
| 2026-02-17 | 13F | Advisor Group Holdings, Inc. | 19.477 | -12,89 | 1.038 | 0,48 | ||||
| 2026-01-29 | 13F | Argyle Capital Management Inc. | 12.600 | 0,00 | 672 | 12,58 | ||||
| 2026-02-05 | 13F | ACR Alpine Capital Research, LLC | 6.006.268 | -1,15 | 320.134 | 11,20 | ||||
| 2026-02-11 | 13F | Ing Groep Nv | 9.790 | 524 | ||||||
| 2026-02-13 | 13F | Mariner, LLC | 215.754 | 0,34 | 11.500 | 12,89 | ||||
| 2026-01-23 | 13F | Farther Finance Advisors, LLC | 7.182 | 152,98 | 383 | 185,07 | ||||
| 2025-10-31 | 13F | Y-Intercept (Hong Kong) Ltd | 0 | -100,00 | 0 | -100,00 | ||||
| 2025-11-07 | 13F | Ontario Teachers Pension Plan Board | 0 | -100,00 | 0 | -100,00 | ||||
| 2026-02-17 | 13F | Nomura Holdings Inc | 72.881 | -16,10 | 3.885 | -5,61 | ||||
| 2026-02-11 | 13F | Capital Analysts, Inc. | 137 | -41,45 | 0 | |||||
| 2026-02-17 | 13F | Nomura Holdings Inc | Call | 171.500 | 14,33 | 9.141 | 28,61 | |||
| 2026-02-17 | 13F | SIG North Trading, ULC | Put | 108.200 | 85,27 | 5.767 | 108,50 | |||
| 2026-03-06 | 13F | Hsbc Holdings Plc | 0 | -100,00 | 0 | |||||
| 2026-02-17 | 13F | SIG North Trading, ULC | Call | 215.400 | -11,43 | 11.481 | -0,36 | |||
| 2026-01-29 | 13F | UBS Group AG | 885.200 | 38,40 | 47.181 | 55,70 | ||||
| 2026-01-20 | 13F | Ascent Group, LLC | 4.741 | 253 | ||||||
| 2026-02-02 | 13F | Triasima Portfolio Management inc. | 102.740 | 38,74 | 5.484 | 56,28 | ||||
| 2026-02-17 | 13F | SIG North Trading, ULC | 7.696 | 410 | ||||||
| 2026-02-17 | 13F | Fmr Llc | 481.900 | -1,09 | 25.690 | 11,28 | ||||
| 2025-11-14 | 13F | Gluskin Sheff & Assoc Inc | 0 | -100,00 | 0 | -100,00 | ||||
| 2026-01-26 | 13F | Ckw Financial Group | 1.496 | 0,40 | 0 | |||||
| 2026-02-13 | 13F | National Bank Of Canada /fi/ | 2.727.814 | 7,68 | 145.139 | 21,43 | ||||
| 2026-02-13 | 13F | Aviso Financial Inc. | 0 | -100,00 | 0 | |||||
| 2026-01-07 | 13F | CWA Asset Management Group, LLC | 131.814 | 8,47 | 7.026 | 22,03 | ||||
| 2026-02-17 | 13F | Wiley Bros.-aintree Capital, Llc | 46.489 | 74,42 | 2.478 | 96,28 | ||||
| 2026-02-13 | 13F | State Street Corp | 45.012 | -20,02 | 2.399 | -10,02 | ||||
| 2026-02-10 | 13F | Nomura Asset Management Co Ltd | 0 | 0 | ||||||
| 2026-02-17 | 13F | Bank Of America Corp /de/ | 2.228.302 | 22,09 | 118.769 | 37,35 | ||||
| 2026-02-05 | 13F | RiverFront Investment Group, LLC | 5.508 | 0,00 | 294 | 12,69 | ||||
| 2026-01-14 | 13F | ORG Wealth Partners, LLC | 20 | 1 | ||||||
| 2026-02-10 | 13F | Connor, Clark & Lunn Investment Management Ltd. | 1.918.616 | -6,02 | 102.283 | 5,76 | ||||
| 2026-02-17 | 13F | Wellington Management Group Llp | 321.499 | -5,96 | 17.161 | 5,93 | ||||
| 2026-02-06 | 13F | Gsa Capital Partners Llp | 0 | -100,00 | 0 | |||||
| 2026-02-13 | 13F | Aigen Investment Management, Lp | 0 | -100,00 | 0 | -100,00 | ||||
| 2026-01-08 | 13F | True Wealth Design, LLC | 121 | 218,42 | 6 | 500,00 | ||||
| 2026-02-13 | 13F | Sei Investments Co | 122.606 | 159,89 | 6.536 | 192,52 | ||||
| 2025-11-14 | 13F | Mount Yale Investment Advisors, LLC | 0 | -100,00 | 0 | |||||
| 2026-02-17 | 13F | State Of Wisconsin Investment Board | 93.812 | 5.008 | ||||||
| 2026-01-23 | 13F | Ritholtz Wealth Management | 55.574 | 43,41 | 2.962 | 61,33 | ||||
| 2026-01-27 | 13F | WealthCollab, LLC | 535 | 0,00 | 29 | 12,00 | ||||
| 2026-02-09 | 13F | Integrity Alliance, Llc. | 6.432 | 21,52 | 343 | 36,80 | ||||
| 2026-02-17 | 13F | Northern Trust Corp | 267.775 | -0,62 | 14.272 | 11,80 | ||||
| 2025-12-16 | 13F | Emergent Wealth Advisors, LLC | 0 | -100,00 | 0 | -100,00 | ||||
| 2026-02-04 | 13F | Asahi Life Asset Management Co., Ltd. | 4.079 | -49,75 | 218 | -43,49 | ||||
| 2026-02-05 | 13F | Atria Investments Llc | 208.114 | -0,67 | 11.092 | 11,74 | ||||
| 2026-02-13 | 13F | Barclays Plc | 288.602 | 26,82 | 15.382 | 64,71 | ||||
| 2026-02-10 | 13F | KERR FINANCIAL PLANNING Corp | 200 | 10 | ||||||
| 2026-01-29 | 13F | Camelot Portfolios, LLC | 3.210 | 171 | ||||||
| 2026-03-02 | 13F | Tobam | 0 | -100,00 | 0 | |||||
| 2026-01-20 | 13F | Signaturefd, Llc | 11.039 | 5,59 | 588 | 18,79 | ||||
| 2026-02-13 | 13F | Palisade Asset Management, LLC | 0 | -100,00 | 0 | |||||
| 2026-01-20 | 13F | Cromwell Holdings LLC | 771 | 0,00 | 41 | 13,89 | ||||
| 2026-01-27 | 13F | Jackson, Grant Investment Advisers, Inc. | 167 | 0,00 | 9 | 14,29 | ||||
| 2026-02-12 | 13F | Commonwealth Equity Services, Llc | 9.020 | -10,45 | 481 | |||||
| 2026-02-17 | 13F | Lighthouse Investment Partners, LLC | 17.882 | 953 | ||||||
| 2026-02-17 | 13F | Schonfeld Strategic Advisors LLC | 66.838 | 384,33 | 3.562 | 445,48 | ||||
| 2026-02-17 | 13F | Fairscale Capital, LLC | 146 | 8 | ||||||
| 2025-10-31 | 13F | Lorne Steinberg Wealth Management Inc. | 0 | -100,00 | 0 | |||||
| 2026-01-08 | 13F | Grove Bank & Trust | 641 | -3,75 | 34 | 9,68 | ||||
| 2026-02-13 | 13F | Manufacturers Life Insurance Company, The | 0 | -100,00 | 0 | |||||
| 2026-01-27 | 13F | Silphium Asset Management Ltd | 16.700 | 890 | ||||||
| 2025-12-09 | 13F/A | Tudor Investment Corp Et Al | Put | 5.400 | -56,80 | 256 | -47,10 | |||
| 2026-02-10 | 13F | Holderness Investments Co | 3.754 | 200 | ||||||
| 2025-12-09 | 13F/A | Tudor Investment Corp Et Al | Call | 8.500 | -77,33 | 403 | -72,22 | |||
| 2026-01-30 | 13F | Mitsubishi UFJ Trust & Banking Corp | 57.500 | -77,62 | 3.029 | -75,12 | ||||
| 2026-02-03 | 13F | Gateway Investment Advisers Llc | 9.900 | -27,82 | 528 | -18,80 | ||||
| 2026-02-13 | 13F | Pinnacle Wealth Planning Services, Inc. | 74 | 4 | ||||||
| 2026-02-10 | 13F | Td Asset Management Inc | 4.753.403 | -7,33 | 253.734 | 4,38 | ||||
| 2026-01-09 | 13F | 180 Wealth Advisors, Llc | 0 | -100,00 | 0 | |||||
| 2026-02-06 | 13F | Harvest Portfolios Group Inc. | 58.414 | -6,86 | 3.114 | 4,81 | ||||
| 2026-01-28 | 13F | Turtle Creek Wealth Advisors, LLC | 9.528 | 0,00 | 508 | 12,42 | ||||
| 2026-02-13 | 13F | Prudential Financial Inc | 23.025 | 1.229 | ||||||
| 2025-11-14 | 13F | Price T Rowe Associates Inc /md/ | 0 | -100,00 | 0 | -100,00 | ||||
| 2026-02-02 | 13F | Oppenheimer & Co Inc | 7.838 | -46,64 | 418 | -40,00 | ||||
| 2026-01-27 | 13F | Zurcher Kantonalbank (Zurich Cantonalbank) | 65.830 | -38,01 | 3.514 | -30,19 | ||||
| 2025-11-21 | 13F | Nebula Research & Development LLC | 0 | -100,00 | 0 | |||||
| 2026-02-17 | 13F/A | Northwest & Ethical Investments L.P. | 433.643 | -2,79 | 23.124 | 9,39 | ||||
| 2026-02-12 | 13F | Renaissance Technologies Llc | 300.284 | -61,03 | 16.005 | -56,16 | ||||
| 2025-10-01 | 13F | Caldwell Trust Co | 0 | -100,00 | 0 | -100,00 | ||||
| 2026-02-04 | 13F | Community Bank, N.A. | 602 | 0,00 | 32 | 14,29 | ||||
| 2026-02-17 | 13F | Susquehanna International Group, Llp | 0 | -100,00 | 0 | |||||
| 2026-01-21 | 13F | Edmp, Inc. | 21.243 | 1,62 | 1.132 | 14,34 | ||||
| 2026-01-22 | 13F | Addenda Capital Inc. | 163.585 | -9,78 | 11.970 | 0,11 | ||||
| 2026-02-17 | 13F | Point72 Asset Management, L.P. | 109.413 | -94,09 | 5.832 | -93,35 | ||||
| 2025-10-30 | 13F | Traub Capital Management LLC | 0 | -100,00 | 0 | -100,00 | ||||
| 2026-02-11 | 13F | Brandywine Global Investment Management, LLC | 982.886 | -0,70 | 52.398 | 11,76 | ||||
| 2026-02-17 | 13F | Aqr Capital Management Llc | 1.662.407 | 9.533,79 | 88.624 | 10.747,37 | ||||
| 2026-02-02 | 13F | Chung Wu Investment Group, LLC | 40 | 0,00 | 2 | 100,00 | ||||
| 2026-02-12 | 13F | Swiss National Bank | 709.600 | -7,88 | 37.906 | 3,81 | ||||
| 2026-01-28 | 13F | DekaBank Deutsche Girozentrale | 98.577 | 0,00 | 5 | 25,00 | ||||
| 2026-02-02 | 13F | Fifth Third Bancorp | 301 | 4,51 | 16 | 23,08 | ||||
| 2026-02-11 | 13F | Twin Tree Management, LP | 35.377 | -72,50 | 1.886 | -69,07 | ||||
| 2026-01-07 | 13F | Massmutual Trust Co Fsb/adv | 847 | 17,31 | 45 | 32,35 | ||||
| 2026-01-15 | 13F | Nisa Investment Advisors, Llc | 14 | 1 | ||||||
| 2025-11-06 | 13F | Versor Investments LP | 0 | -100,00 | 0 | -100,00 | ||||
| 2026-01-29 | 13F | Nbc Securities, Inc. | 493 | -1,00 | 26 | 13,04 | ||||
| 2026-02-11 | 13F | Twin Tree Management, LP | Call | 17.700 | 555,56 | 943 | 642,52 | |||
| 2026-02-11 | 13F | Twin Tree Management, LP | Put | 71.700 | -26,23 | 3.822 | -17,02 | |||
| 2025-10-29 | 13F | JCIC Asset Management Inc. | 0 | -100,00 | 0 | |||||
| 2026-02-13 | 13F | Ieq Capital, Llc | 21.116 | 2,80 | 1.125 | 15,62 | ||||
| 2026-02-17 | 13F | Advisory Services Network, LLC | 0 | -100,00 | 0 | |||||
| 2026-01-22 | 13F | Kennebec Savings Bank | 547 | -3,70 | 29 | 11,54 | ||||
| 2026-02-09 | 13F | Systematic Financial Management Lp | 68.300 | 39,64 | 3.640 | 57,10 | ||||
| 2026-01-06 | 13F | Investors Research Corp | 92 | 0,00 | 5 | 0,00 | ||||
| 2026-01-20 | 13F | Thurston, Springer, Miller, Herd & Titak, Inc. | 192 | 125,88 | 10 | 150,00 | ||||
| 2026-02-18 | 13F | Beacon Pointe Advisors, LLC | 4.499 | 240 | ||||||
| 2026-01-20 | 13F | AdvisorNet Financial, Inc | 6 | 0 | ||||||
| 2026-01-07 | 13F | Hilltop National Bank | 13 | -50,00 | 1 | -100,00 | ||||
| 2026-01-22 | 13F | Massachusetts Financial Services Co /ma/ | 10.818 | -1,92 | 577 | 10,34 | ||||
| 2026-02-13 | 13F | 1832 Asset Management L.P. | 47.208 | 65,13 | 2.516 | 85,82 | ||||
| 2026-02-13 | 13F | Verition Fund Management LLC | 0 | -100,00 | 0 | |||||
| 2026-02-13 | 13F | Icon Advisers Inc/co | 50.403 | -2,05 | 2.686 | 10,17 | ||||
| 2026-02-17 | 13F | Maryland State Retirement & Pension System | 85.879 | 4,25 | 4.580 | 17,38 | ||||
| 2026-02-10 | 13F | Envestnet Asset Management Inc | 995.040 | -29,78 | 53.036 | -21,01 | ||||
| 2026-02-17 | 13F | Evolve Private Wealth, Llc | 5.482 | 292 | ||||||
| 2026-01-27 | 13F | Bayforest Capital Ltd | 3.275 | -68,46 | 175 | -64,56 | ||||
| 2026-02-06 | 13F | Bare Financial Services, Inc | 9 | 0,00 | 0 | |||||
| 2026-02-13 | 13F | JustInvest LLC | 29.850 | 6,34 | 1.591 | 19,62 | ||||
| 2026-03-26 | 13F | Leonteq Securities AG | Call | 0 | -100,00 | 0 | ||||
| 2026-02-06 | 13F | Cullen/frost Bankers, Inc. | 59 | 3 | ||||||
| 2026-02-17 | 13F | Edmond De Rothschild Holding S.a. | 360 | 0,00 | 19 | 11,76 | ||||
| 2026-02-17 | 13F | Scientech Research LLC | 4.871 | 260 | ||||||
| 2026-02-10 | 13F | CIBC World Markets Inc. | 6.061.910 | 18,29 | 323.221 | 33,14 | ||||
| 2026-01-30 | 13F | ARGA Investment Management, LP | 4.193.129 | 1,08 | 223.512 | 13,71 | ||||
| 2026-02-10 | 13F | Basepoint Wealth LLC | 224 | 12 | ||||||
| 2026-02-12 | 13F | Portland Investment Counsel Inc. | 0 | -100,00 | 0 | |||||
| 2026-02-13 | 13F | First Trust Advisors Lp | 166.967 | 18,27 | 8.900 | 33,07 | ||||
| 2026-02-17 | 13F | Worldquant Millennium Advisors Llc | 16.728 | 16,96 | 892 | 31,76 | ||||
| 2026-02-09 | 13F | Todd Asset Management Llc | 9.307 | 7,92 | 496 | 21,57 | ||||
| 2026-02-17 | 13F | Lazard Asset Management Llc | 1.183.042 | 128,76 | 63.069 | 157,45 | ||||
| 2026-02-17 | 13F | Quantinno Capital Management LP | 88.250 | 32,06 | 4.704 | 48,55 | ||||
| 2026-02-18 | 13F | State of Tennessee, Treasury Department | 157.482 | 0,60 | 8.095 | 9,13 | ||||
| 2025-11-10 | 13F | Legacy Financial Advisors, Inc. | 0 | -100,00 | 0 | |||||
| 2026-02-13 | 13F | Atlas Capital Advisors Llc | 1.262 | 67 | ||||||
| 2026-02-12 | 13F | Jane Street Group, Llc | Call | 116.500 | 2,19 | 6.209 | 14,96 | |||
| 2026-02-12 | 13F | Jane Street Group, Llc | 36.212 | -96,99 | 1.930 | -96,61 | ||||
| 2026-01-30 | 13F/A | M&t Bank Corp | 4.681 | 1,06 | 249 | 13,70 | ||||
| 2026-02-12 | 13F | Bank Of Montreal /can/ | 5.305.724 | -13,11 | 282.851 | -2,22 | ||||
| 2026-02-12 | 13F | Jane Street Group, Llc | Put | 4.000 | -84,19 | 213 | -82,22 | |||
| 2025-11-13 | 13F | Entropy Technologies, LP | 0 | -100,00 | 0 | |||||
| 2026-02-10 | 13F | SBI Okasan Asset Management Co.Ltd. | 34.500 | 1.855 | ||||||
| 2026-02-17 | 13F | Alliancebernstein L.p. | 192.017 | 74,85 | 10.235 | 96,69 | ||||
| 2026-02-10 | 13F | Norges Bank | 3.707.113 | 197.628 | ||||||
| 2026-02-11 | 13F | Deutsche Bank Ag\ | 570.293 | 14,38 | 30.397 | 28,68 | ||||
| 2025-11-06 | 13F | Whipplewood Advisors, LLC | 0 | -100,00 | 0 | |||||
| 2026-01-28 | 13F | Hoey Investments, Inc | 125 | 0,00 | 7 | 20,00 | ||||
| 2026-02-10 | 13F | Natixis Advisors, L.p. | 0 | -100,00 | 0 | -100,00 | ||||
| 2026-01-29 | 13F | Sanctuary Advisors, LLC | 4.631 | 8,13 | 247 | 21,78 | ||||
| 2026-02-17 | 13F | Portolan Capital Management, LLC | 255.481 | 13.617 | ||||||
| 2026-02-17 | 13F | Engineers Gate Manager LP | 26.958 | 1.437 | ||||||
| 2026-02-17 | 13F | Private Advisor Group, LLC | 10.966 | 5,24 | 584 | 18,46 | ||||
| 2026-02-06 | 13F | IFP Advisors, Inc | 841 | 199,29 | 45 | 238,46 | ||||
| 2026-02-09 | 13F | Frazier Financial Advisors, LLC | 0 | -100,00 | 0 | |||||
| 2026-02-13 | 13F | SRS Capital Advisors, Inc. | 131 | 13.000,00 | 7 | |||||
| 2026-02-11 | 13F | Picton Mahoney Asset Management | 745.714 | 1.949,23 | 39.810 | 3.980.800,00 | ||||
| 2026-02-13 | 13F | Great West Life Assurance Co /can/ | 369.754 | 8,23 | 20 | 26,67 | ||||
| 2026-02-17 | 13F | Russell Investments Group, Ltd. | 2.090.887 | 7,83 | 111.549 | 21,44 | ||||
| 2026-02-18 | 13F | Guardian Capital Lp | 71.945 | 8,28 | 3.837 | 21,89 | ||||
| 2026-01-27 | 13F | Evergreen Capital Management Llc | 4.678 | -1,89 | 249 | 10,67 | ||||
| 2026-02-12 | 13F | Nuveen, LLC | 187.041 | 0,00 | 9.984 | 12,64 | ||||
| 2026-02-12 | 13F | BlackRock, Inc. | 702.331 | 11,75 | 37.434 | 25,71 | ||||
| 2026-02-17 | 13F | Hotchkis & Wiley Capital Management Llc | 9.854.052 | -9,00 | 525.221 | 2,37 | ||||
| 2025-11-14 | 13F | Knightsbridge Asset Management, Llc | 135.163 | -5,33 | 6.404 | 16,18 | ||||
| 2026-01-29 | 13F | IMC-Chicago, LLC | 40.855 | 24,26 | 2.178 | 39,82 | ||||
| 2026-02-06 | 13F | Shakespeare Wealth Management, Inc. | 4.140 | 221 | ||||||
| 2026-01-29 | 13F | IMC-Chicago, LLC | Put | 36.300 | -15,78 | 1.935 | -5,29 | |||
| 2026-02-02 | 13F | Danske Bank A/s | 1.736 | -27,67 | 93 | -17,86 | ||||
| 2026-01-29 | 13F | IMC-Chicago, LLC | Call | 42.300 | -34,82 | 2.255 | -26,68 | |||
| 2026-01-23 | 13F | Twelve Points Wealth Management LLC | 17.398 | -32,97 | 978 | -20,50 | ||||
| 2026-02-12 | 13F | Dimensional Fund Advisors Lp | 3.760.683 | 14,06 | 200.459 | 28,34 | ||||
| 2026-02-13 | 13F | Quarry LP | 118 | 6 | ||||||
| 2025-11-14 | 13F | Point72 Italy, S.r.l. | 225.633 | 10.690 | ||||||
| 2026-02-13 | 13F | Beutel, Goodman & Co Ltd. | 800 | 0,00 | 0 | |||||
| 2026-02-13 | 13F | Umb Bank N A/mo | 178 | 134,21 | 9 | 200,00 | ||||
| 2026-02-13 | 13F | Cornerstone Financial Management LLC | 31 | 2 | ||||||
| 2026-02-11 | 13F | Metis Global Partners, LLC | 6.163 | -27,37 | 329 | -18,41 | ||||
| 2026-01-05 | 13F | GAMMA Investing LLC | 122 | 7 | ||||||
| 2026-02-13 | 13F | Ubs Asset Management Americas Inc | 516 | 28 | ||||||
| 2026-02-12 | 13F | Skopos Labs, Inc. | 27.721 | 0,84 | 1.491 | 41,10 | ||||
| 2026-02-12 | 13F | BRYN MAWR TRUST Co | 1.300 | 0,00 | 69 | 13,11 | ||||
| 2026-01-08 | 13F | NorthCrest Asset Manangement, LLC | 17.985 | -1,32 | 990 | 16,63 | ||||
| 2025-11-14 | 13F | Atom Investors LP | 0 | -100,00 | 0 | |||||
| 2026-02-13 | 13F | Shepherd Kaplan Krochuk, Llc | 17.288 | -9,47 | 921 | 1,88 | ||||
| 2026-02-03 | 13F | Strengthening Families & Communities, LLC | 0 | -100,00 | 0 | |||||
| 2026-02-10 | 13F | State of Wyoming | 21.381 | 92,97 | 1.140 | 117,14 | ||||
| 2026-02-13 | 13F | National Bank Of Canada /fi/ | Call | 296 | 57,45 | 1.578 | 77,19 | |||
| 2026-02-11 | 13F | Letko, Brosseau & Associates Inc | 4.067.800 | -1,36 | 217.137 | 11,10 | ||||
| 2026-01-12 | 13F | Avanza Fonder AB | 337 | -96,22 | 25 | -95,92 | ||||
| 2026-02-13 | 13F | National Bank Of Canada /fi/ | Put | 82 | 1,23 | 437 | 14,10 | |||
| 2026-02-06 | 13F | Leonteq Securities AG | 5.296 | -60,68 | 282 | -55,80 | ||||
| 2026-02-12 | 13F | Hrt Financial Lp | 22.677 | 1 | ||||||
| 2026-01-30 | 13F | Us Bancorp \de\ | 131.966 | -8,45 | 7.034 | 2,99 | ||||
| 2026-02-17 | 13F | Toronto Dominion Bank | 1.648.230 | 31,32 | 87.869 | 47,84 | ||||
| 2026-02-17 | 13F | Toronto Dominion Bank | Put | 4.000 | -57,45 | 213 | -52,13 | |||
| 2026-01-14 | 13F | Baron Wealth Management LLC | 6.572 | 350 | ||||||
| 2026-02-17 | 13F | Toronto Dominion Bank | Call | 32.200 | -73,63 | 1.717 | -70,33 | |||
| 2026-02-02 | 13F | Tevis Investment Management | 30.364 | 0,00 | 1.439 | 0,00 | ||||
| 2026-02-02 | 13F | Truist Financial Corp | 6.687 | 0,71 | 356 | 13,38 | ||||
| 2026-02-11 | 13F | Nemes Rush Group LLC | 27 | 1 | ||||||
| 2026-02-10 | 13F | CIBC Asset Management Inc | 1.293.727 | 165,23 | 69.501 | 200,96 | ||||
| 2026-02-17 | 13F | Investment Management Corp of Ontario | 32.510 | 231,43 | 1.733 | 273,28 | ||||
| 2026-02-03 | 13F | Sequoia Financial Advisors, LLC | 26.165 | 31,01 | 1.395 | 47,36 | ||||
| 2026-01-15 | 13F | Royal Fund Management, LLC | 51.082 | 32,43 | 2.723 | 48,99 | ||||
| 2026-01-08 | 13F | Armstrong Advisory Group, Inc | 588 | 0,00 | 31 | 14,81 | ||||
| 2026-01-27 | 13F | TD Waterhouse Canada Inc. | 689.923 | -24,96 | 36.671 | -13,56 | ||||
| 2025-11-14 | 13F | Capstone Investment Advisors, Llc | 7.257 | -17,21 | 344 | 1,48 | ||||
| 2026-02-09 | 13F | Employees Retirement System of Texas | 2.713 | 0,00 | 0 | |||||
| 2026-02-17 | 13F | Canada Pension Plan Investment Board | 2.034.587 | 52,59 | 108.465 | 71,72 | ||||
| 2026-02-20 | 13F | Sunbelt Securities, Inc. | 185 | 10 | ||||||
| 2026-02-17 | 13F | Raymond James Financial Inc | 184.910 | 2,00 | 9.856 | 14,74 | ||||
| 2026-02-11 | 13F | Empowered Funds, LLC | 42.686 | -9,60 | 2.275 | 1,70 | ||||
| 2026-02-03 | 13F | Crossmark Global Holdings, Inc. | 16.907 | 16,18 | 901 | 30,77 | ||||
| 2026-02-13 | 13F | Stifel Financial Corp | 73.175 | -2,89 | 3.900 | 9,24 | ||||
| 2026-02-02 | 13F | Mutual Advisors, LLC | 26.177 | -0,13 | 1.395 | 15,58 | ||||
| 2026-01-28 | 13F | Geneos Wealth Management Inc. | 150 | 0,00 | 8 | 0,00 | ||||
| 2026-02-11 | 13F | LPL Financial LLC | 51.716 | 24,74 | 2.756 | 40,33 | ||||
| 2026-02-13 | 13F | Citigroup Inc | 668.960 | 29,46 | 35.709 | 45,82 | ||||
| 2026-02-17 | 13F | Jones Financial Companies Lllp | 141.072 | 5,90 | 7.519 | 21,08 | ||||
| 2026-02-12 | 13F | Wasatch Advisors Inc | 7.996 | 6,02 | 426 | 19,33 | ||||
| 2026-02-13 | 13F | Caitong International Asset Management Co., Ltd | 0 | -100,00 | 0 | |||||
| 2026-02-12 | 13F | Principal Securities, Inc. | 0 | -100,00 | 0 | |||||
| 2026-02-10 | 13F | Intech Investment Management Llc | 6.058 | -97,83 | 323 | -97,56 | ||||
| 2026-01-14 | 13F | Eastern Bank | 10 | 1 | ||||||
| 2026-02-13 | 13F | Becker Capital Management Inc | 9.869 | -10,60 | 526 | 0,57 | ||||
| 2026-02-04 | 13F | Swiss Life Asset Management Ltd | 18.053 | -0,39 | 962 | 11,99 | ||||
| 2026-02-05 | 13F | Td Private Client Wealth Llc | 7 | 0 | ||||||
| 2026-02-04 | 13F | Midwest Trust Co | 196.606 | -1,31 | 10.479 | 11,02 | ||||
| 2026-02-13 | 13F | Nfj Investment Group, Llc | 150.869 | -9,04 | 8.041 | 2,33 | ||||
| 2026-02-17 | 13F | Guardian Partners Inc. | 0 | -100,00 | 0 | |||||
| 2026-02-10 | 13F | Goldman Sachs Group Inc | 2.568.080 | -16,57 | 136.879 | -6,14 | ||||
| 2026-02-17 | 13F | Numerai GP LLC | 3.999 | -90,26 | 213 | -89,05 | ||||
| 2026-02-17 | 13F | Gotham Asset Management, LLC | 62.381 | 321,41 | 3.325 | 374,18 | ||||
| 2026-02-09 | 13F | Legal & General Group Plc | 3.677.657 | 9,45 | 196.311 | 23,28 | ||||
| 2026-02-17 | 13F | National Asset Management, Inc. | 5.668 | -0,28 | 302 | 12,27 | ||||
| 2026-01-30 | 13F | Valued Wealth Advisors LLC | 3 | 0,00 | 0 | |||||
| 2026-02-04 | 13F | Marco Investment Management Llc | 59.220 | -1,66 | 3.156 | 10,62 | ||||
| 2026-02-05 | 13F | Cambridge Investment Research Advisors, Inc. | 6.773 | 0,44 | 0 | |||||
| 2026-02-12 | 13F | Marex Group plc | 17.276 | 921 | ||||||
| 2026-02-13 | 13F | Bank Of Nova Scotia | 2.285.095 | 4,30 | 121.813 | 17,34 | ||||
| 2026-02-17 | 13F | Parallax Volatility Advisers, L.P. | 34.212 | 1.824 | ||||||
| 2026-02-17 | 13F | Janus Henderson Group Plc | 16.491 | 0,00 | 879 | 12,98 | ||||
| 2026-02-17 | 13F | Balyasny Asset Management Llc | 3.791 | -62,39 | 202 | -57,65 | ||||
| 2026-02-04 | 13F | Plato Investment Management Ltd | 69.752 | 74,52 | 3.741 | 99,10 | ||||
| 2025-11-14 | 13F | Voloridge Investment Management, Llc | 0 | -100,00 | 0 | -100,00 | ||||
| 2026-02-10 | 13F | Scheer, Rowlett & Associates Investment Management Ltd. | 410.369 | -48,43 | 21.877 | -41,96 | ||||
| 2026-02-12 | 13F | M&G Plc | 62.165 | -14,15 | 3.295 | -3,20 | ||||
| 2026-02-13 | 13F | Johnson Investment Counsel Inc | 0 | -100,00 | 0 | |||||
| 2026-02-24 | 13F | Bell Investment Advisors, Inc | 290 | 161,26 | 15 | 200,00 | ||||
| 2026-01-09 | 13F | SG Americas Securities, LLC | 2.328 | -86,55 | 0 | |||||
| 2026-02-05 | 13F | Qsemble Capital Management, LP | 72.252 | 496,78 | 3.851 | 572,08 | ||||
| 2026-02-05 | 13F | Heathbridge Capital Management Ltd. | 0 | -100,00 | 0 | |||||
| 2026-02-17 | 13F | Two Sigma Advisers, Lp | 28.200 | 45,36 | 1.503 | 63,55 | ||||
| 2026-02-10 | 13F | Bnp Paribas Arbitrage, Sa | 994 | 241,58 | 53 | 300,00 | ||||
| 2026-02-12 | 13F | Aviva Plc | 201.012 | 6,07 | 10.724 | 19,55 | ||||
| 2026-02-02 | 13F | Nkcfo Llc | 8.000 | 0 | ||||||
| 2026-02-24 | 13F | SG Trading Solutions, LLC | 27.025 | 1 | ||||||
| 2026-02-12 | 13F | Brinker Capital Investments, LLC | 32.079 | 32,32 | 1.710 | 48,87 | ||||
| 2026-01-12 | 13F | Horizon Financial Services, Llc | 0 | -100,00 | 0 | |||||
| 2025-11-14 | 13F | Axa S.a. | 0 | -100,00 | 0 | -100,00 | ||||
| 2026-02-12 | 13F | APG Asset Management N.V. | 139.890 | -6,62 | 6.358 | 5,25 | ||||
| 2026-02-06 | 13F | GPS Wealth Strategies Group, LLC | 0 | -100,00 | 0 | |||||
| 2026-02-13 | 13F | Neuberger Berman Group LLC | 139.230 | 67,50 | 7.432 | 88,68 | ||||
| 2026-02-17 | 13F | Capital Fund Management S.a. | Call | 0 | -100,00 | 0 | ||||
| 2026-02-17 | 13F | Capital Fund Management S.a. | 0 | -100,00 | 0 | |||||
| 2026-01-30 | 13F | Lincluden Management Ltd | 642.618 | -3,97 | 47 | 51,61 | ||||
| 2026-02-17 | 13F | BCV Asset Management Inc. | 970.305 | 76.042 | ||||||
| 2026-02-11 | 13F | Westerkirk Capital Inc. | 800 | -92,79 | 43 | -92,00 | ||||
| 2025-11-14 | 13F | Zimmer Partners, LP | 0 | -100,00 | 0 | -100,00 | ||||
| 2026-02-11 | 13F | Tacita Capital Inc | 9.986 | 136,30 | 533 | 166,00 | ||||
| 2026-02-11 | 13F | Manchester Capital Management LLC | 641 | 34 | ||||||
| 2026-02-17 | 13F | SageView Advisory Group, LLC | 94 | 5 | ||||||
| 2025-10-21 | 13F | McElhenny Sheffield Capital Management, LLC | 0 | -100,00 | 0 | -100,00 | ||||
| 2026-02-11 | 13F | Cerity Partners LLC | 36.824 | -1,55 | 1.963 | 10,72 | ||||
| 2026-01-14 | 13F | Net Worth Advisory Group | 8.831 | 17,45 | 471 | 32,02 | ||||
| 2026-02-17 | 13F | Ameriprise Financial Inc | 28.100 | 18,00 | 1.569 | 38,36 | ||||
| 2026-02-18 | 13F | Vident Advisory, LLC | 67.007 | -15,40 | 3.575 | -4,77 | ||||
| 2025-10-17 | 13F | Valley Forge Investment Consultants Inc Adv | 0 | -100,00 | 0 | -100,00 | ||||
| 2026-02-13 | 13F | BRITISH COLUMBIA INVESTMENT MANAGEMENT Corp | 138.848 | -8,92 | 7.402 | 2,51 | ||||
| 2026-01-26 | 13F | Private Trust Co Na | 241 | 0,00 | 13 | 9,09 | ||||
| 2026-02-17 | 13F | Banco Bilbao Vizcaya Argentaria, S.a. | 0 | -100,00 | 0 | |||||
| 2026-02-13 | 13F | Arrowstreet Capital, Limited Partnership | 4.487.583 | -7,98 | 239.204 | 3,53 | ||||
| 2026-02-18 | 13F | Achmea Investment Management B.V. | 0 | -100,00 | 0 | |||||
| 2026-01-28 | 13F | CAPROCK Group, Inc. | 27.436 | 19,14 | 1.462 | 38,32 | ||||
| 2026-02-05 | 13F | AlphaCore Capital LLC | 5.738 | -3,35 | 306 | 8,54 | ||||
| 2026-02-09 | 13F | Morningstar Investment Management LLC | 25.922 | 1 | ||||||
| 2025-11-07 | 13F | Sierra Ocean, Llc | 0 | -100,00 | 0 | |||||
| 2026-02-10 | 13F/A | Northwestern Mutual Wealth Management Co | 1.218 | 41,63 | 65 | 60,00 | ||||
| 2025-10-14 | 13F | S.A. Mason LLC | 0 | -100,00 | 0 | -100,00 | ||||
| 2026-01-13 | 13F | Matrix Trust Co | 0 | -100,00 | 0 | |||||
| 2026-01-29 | 13F | Pictet Asset Management Holding SA | 104.353 | -9,69 | 5.570 | 1,74 | ||||
| 2026-02-06 | 13F | Pzena Investment Management Llc | 29.113.582 | 0,16 | 2.130.241 | 11,14 | ||||
| 2026-02-12 | 13F | Bank Of Nova Scotia Trust Co | 10.847 | 578 | ||||||
| 2026-02-11 | 13F | Zions Bancorporation, National Association /ut/ | 80 | 0,00 | 4 | 33,33 | ||||
| 2026-02-12 | 13F | Groupe la Francaise | 5.141 | 1,28 | 274 | 14,17 | ||||
| 2026-02-10 | 13F | Hillsdale Investment Management Inc. | 725.425 | 2,29 | 38.741 | 15,33 | ||||
| 2026-02-13 | 13F | Kilter Group LLC | 62 | 210,00 | 3 | |||||
| 2026-02-24 | 13F | DGS Capital Management, LLC | 44.101 | 18,50 | 2.351 | 33,30 | ||||
| 2026-02-13 | 13F | Bridgewater Associates, LP | 47.351 | -4,56 | 2.528 | 7,49 | ||||
| 2026-02-13 | 13F | Peak6 Llc | Call | 435.600 | -27,25 | 23.217 | -18,17 | |||
| 2026-01-28 | 13F | Gold Investment Management Ltd. | 989 | 0,82 | 53 | 13,04 | ||||
| 2026-02-13 | 13F | Peak6 Llc | Put | 3.100 | -64,77 | 165 | -60,34 | |||
| 2026-02-02 | 13F | Oppenheimer Asset Management Inc. | 1.274.066 | -6,41 | 67.908 | 5,28 | ||||
| 2026-02-11 | 13F | Simplex Trading, Llc | Call | 69.000 | -42,79 | 3.678 | 73.440,00 | |||
| 2026-01-09 | 13F | Pacifica Partners Inc. | 375 | 66,67 | 20 | 100,00 | ||||
| 2026-02-17 | 13F | Aquatic Capital Management LLC | 0 | -100,00 | 0 | |||||
| 2026-02-11 | 13F | Simplex Trading, Llc | Put | 9.400 | -91,40 | 501 | 9.920,00 | |||
| 2026-02-17 | 13F | Man Group plc | 591.178 | 21,34 | 31.555 | 36,67 | ||||
| 2026-01-28 | 13F | City State Bank | 50 | 0,00 | 3 | 0,00 | ||||
| 2026-02-13 | 13F | Turtle Creek Asset Management Inc. | 1.058.852 | -45,70 | 56.437 | -38,91 | ||||
| 2026-02-17 | 13F | Steadfast Capital Management Lp | 165.952 | 8.845 | ||||||
| 2025-11-05 | 13F | Fullcircle Wealth Llc | 21.789 | 4,84 | 1.066 | 23,95 | ||||
| 2025-11-07 | 13F/A | Abn Amro Investment Solutions | 6.739 | -26,48 | 361 | -30,17 | ||||
| 2026-02-09 | 13F | Harbour Investments, Inc. | 641 | 0,00 | 34 | 13,33 | ||||
| 2026-01-26 | 13F | Merit Financial Group, LLC | 4.600 | 8,31 | 245 | 21,89 | ||||
| 2026-02-17 | 13F | Qube Research & Technologies Ltd | 26.174 | -25,80 | 1.395 | -16,47 | ||||
| 2026-02-09 | 13F | Hantz Financial Services, Inc. | 30.566 | -0,15 | 2 | 0,00 | ||||
| 2025-11-12 | 13F | Transce3nd, LLC | 0 | -100,00 | 0 | -100,00 | ||||
| 2026-02-12 | 13F | UniSuper Management Pty Ltd | 4.600 | 0,00 | 337 | 10,89 | ||||
| 2026-02-11 | 13F | Syon Capital Llc | 5.939 | 317 | ||||||
| 2026-02-13 | 13F | Walleye Trading LLC | Call | 14.800 | -51,48 | 789 | -45,47 | |||
| 2026-02-13 | 13F | Walleye Trading LLC | 18.713 | -39,43 | 997 | -31,85 | ||||
| 2026-02-13 | 13F | Walleye Trading LLC | Put | 62.700 | -29,71 | 3.342 | -20,94 | |||
| 2026-02-13 | 13F | Toroso Investments, LLC | 17.935 | 37,53 | 956 | 54,78 | ||||
| 2026-02-06 | 13F | HighTower Advisors, LLC | 8.527 | 4,51 | 454 | 17,62 | ||||
| 2026-02-12 | 13F | IFC & Insurance Marketing, Inc. | 914 | 0 | ||||||
| 2026-02-13 | 13F | Eventide Asset Management, Llc | 21.379 | 6,23 | 1.147 | 21,40 | ||||
| 2026-02-13 | 13F | C M Bidwell & Associates Ltd | 5.640 | 301 | ||||||
| 2026-02-13 | 13F | Dixon Mitchell Investment Counsel Inc. | 80 | 4 | ||||||
| 2026-01-12 | 13F | CVA Family Office, LLC | 4.055 | 0,00 | 216 | 12,50 | ||||
| 2026-01-20 | 13F | YANKCOM Partnership | 267 | 0,00 | 14 | 16,67 | ||||
| 2026-02-12 | 13F | Towle & Co | 202.374 | -7,20 | 10.787 | 4,39 | ||||
| 2026-02-13 | 13F | Arkadios Wealth Advisors | 4.767 | 7,29 | 254 | 20,95 | ||||
| 2026-02-17 | 13F | Trexquant Investment LP | 109.832 | 5.854 | ||||||
| 2026-02-09 | 13F | Huntington National Bank | 242 | 0,00 | 13 | 9,09 | ||||
| 2026-02-17 | 13F | Cetera Investment Advisers | 138.191 | 8,73 | 7.366 | 22,30 | ||||
| 2026-02-11 | 13F | Group One Trading, L.p. | Put | 2.400 | -91,08 | 128 | -90,03 | |||
| 2026-02-11 | 13F | Group One Trading, L.p. | Call | 14.800 | -22,11 | 789 | -12,44 | |||
| 2026-02-11 | 13F | Group One Trading, L.p. | 22.408 | 2,24 | 1.194 | 15,03 | ||||
| 2026-01-16 | 13F | Perigon Wealth Management, LLC | 10.332 | -2,12 | 551 | 10,00 | ||||
| 2026-01-26 | 13F | Cwm, Llc | 2.220 | 6,42 | 0 | |||||
| 2026-02-17 | 13F | Signature Equity Partners, LLC | 74 | 4 | ||||||
| 2025-11-14 | 13F | Sagard Holdings Management Inc. | 423 | 0,00 | 20 | 25,00 | ||||
| 2026-02-13 | 13F | Virtus ETF Advisers LLC | 6.824 | -45,41 | 420 | -45,74 | ||||
| 2025-10-14 | 13F | Highline Wealth Partners Llc | 0 | -100,00 | 0 | |||||
| 2026-01-26 | 13F | AE Wealth Management LLC | 5.192 | 17,44 | 277 | 32,06 | ||||
| 2026-02-11 | 13F | Fox Run Management, L.l.c. | 19.297 | 1.029 | ||||||
| 2026-02-13 | 13F | Chou Associates Management Inc. | 10.000 | 0,00 | 533 | 12,68 | ||||
| 2026-02-06 | 13F | EverSource Wealth Advisors, LLC | 779 | 35,71 | 42 | 51,85 | ||||
| 2026-01-15 | 13F | Frank, Rimerman Advisors LLC | 6.415 | 0,55 | 342 | 12,91 | ||||
| 2026-01-15 | 13F | Mn Services Vermogensbeheer B.V. | 101.121 | 1,52 | 5 | 25,00 | ||||
| 2026-02-18 | 13F | Mackenzie Financial Corp | 1.574.518 | 70,38 | 84.302 | 92,58 | ||||
| 2026-02-17 | 13F | Graham Capital Management, L.P. | 43.724 | 30,66 | 2.330 | 47,00 | ||||
| 2026-02-11 | 13F | Vise Technologies, Inc. | 9.674 | 36,68 | 516 | 53,73 | ||||
| 2026-02-03 | 13F | K.J. Harrison & Partners Inc | 5.913 | 21,44 | 316 | 33,47 | ||||
| 2026-03-24 | 13F/A | Barclays Plc | Call | 0 | -100,00 | 0 | -100,00 | |||
| 2026-02-06 | 13F | Creative Financial Designs Inc /adv | 0 | -100,00 | 0 | |||||
| 2026-02-06 | 13F | Harmony Asset Management Llc | 4.079 | 217 | ||||||
| 2026-02-13 | 13F | Parkside Financial Bank & Trust | 1.544 | 0,00 | 82 | 12,33 | ||||
| 2026-02-17 | 13F | Amundi | 1.462.468 | 160,14 | 77.950 | 181,82 | ||||
| 2025-11-14 | 13F | Cubist Systematic Strategies, LLC | 0 | -100,00 | 0 | -100,00 | ||||
| 2026-02-13 | 13F | BNP Paribas Asset Management Holding S.A. | 207.815 | 15 | ||||||
| 2026-02-19 | 13F | CI Private Wealth, LLC | 34.649 | 10,57 | 1.844 | 24,19 | ||||
| 2026-02-05 | 13F | Leuthold Group, Llc | 147.172 | 26,57 | 7.844 | 42,39 | ||||
| 2026-02-12 | 13F | CIBC Private Wealth Group, LLC | 229 | 0,00 | 12 | 20,00 | ||||
| 2026-02-12 | 13F | Steward Partners Investment Advisory, Llc | 2.587 | 0,00 | 138 | 12,30 | ||||
| 2026-01-30 | 13F | Bogart Wealth, LLC | 221 | 0,00 | 12 | 10,00 | ||||
| 2026-02-12 | 13F | Advisors Asset Management, Inc. | 32.200 | -11,87 | 1.716 | -0,87 | ||||
| 2026-02-11 | 13F | West Family Investments, Inc. | 0 | -100,00 | 0 | -100,00 | ||||
| 2026-02-11 | 13F | O'shaughnessy Asset Management, Llc | 253.521 | 26,50 | 13.513 | 42,32 | ||||
| 2026-02-13 | 13F | Rhumbline Advisers | 2.480 | -10,76 | 132 | 0,76 | ||||
| 2025-11-07 | 13F | Shell Asset Management Co | 6.509 | -83,91 | 0 | -100,00 | ||||
| 2026-02-13 | 13F | American Century Companies Inc | 625.046 | 3,91 | 33.320 | 16,92 | ||||
| 2026-02-10 | 13F | Forsta Ap-fonden | 62.000 | -57,27 | 3.310 | -51,88 | ||||
| 2026-02-13 | 13F | Morgan Stanley | 2.635.095 | -16,66 | 140.451 | -6,25 | ||||
| 2026-02-11 | 13F | Commonwealth Retirement Investments LLC | 200 | 11 | ||||||
| 2026-02-13 | 13F | Public Sector Pension Investment Board | 0 | -100,00 | 0 | |||||
| 2025-10-10 | 13F | Sound Income Strategies, LLC | 0 | -100,00 | 0 | |||||
| 2026-01-13 | 13F | CoreCap Advisors, LLC | 0 | -100,00 | 0 | |||||
| 2026-02-13 | 13F | Smartleaf Asset Management LLC | 76 | 7,04 | 4 | 33,33 | ||||
| 2026-02-06 | 13F | Pnc Financial Services Group, Inc. | 15.101 | -2,99 | 805 | 9,09 | ||||
| 2026-02-12 | 13F | Earnest Partners Llc | 17.216 | -7,99 | 918 | 3,50 | ||||
| 2026-02-19 | 13F | Mcguire Capital Advisors Inc | 24 | 1 | ||||||
| 2026-02-06 | 13F | Aviance Capital Partners, LLC | 31.414 | -4,80 | 1.674 | 7,10 | ||||
| 2026-02-13 | 13F | Osmosis Investment Management UK Ltd | 6.354 | 339 | ||||||
| 2026-02-11 | 13F | PBU - The Pension Fund of Early Childhood & Youth Educators | 206.054 | 10.999 | ||||||
| 2026-01-29 | 13F | Vanguard Group Inc | 12.322.391 | 2,23 | 656.907 | 15,02 | ||||
| 2025-11-06 | 13F | Ameritas Advisory Services, LLC | 0 | -100,00 | 0 | -100,00 | ||||
| 2026-02-17 | 13F | Ancora Advisors, LLC | 13 | 1 | ||||||
| 2025-11-10 | 13F | New Millennium Group LLC | 0 | -100,00 | 0 | |||||
| 2026-01-14 | 13F | Accurate Wealth Management, LLC | 22.089 | 0,57 | 1.242 | 25,73 | ||||
| 2026-01-30 | 13F | AMG National Trust Bank | 68.191 | -0,43 | 3.635 | 12,02 | ||||
| 2025-11-14 | 13F | Wolverine Trading, Llc | 11.449 | -66,61 | 537 | -59,26 | ||||
| 2026-02-03 | 13F | Manske Wealth Management | 4.766 | -0,89 | 254 | 11,89 | ||||
| 2025-10-21 | 13F | Jarislowsky, Fraser Ltd | 20.686 | 21,04 | 980 | 48,71 | ||||
| 2025-11-14 | 13F | Wolverine Trading, Llc | Call | 61.700 | 24,40 | 2.896 | 51,86 | |||
| 2025-11-14 | 13F | Wolverine Trading, Llc | Put | 60.000 | 83,49 | 2.816 | 124,03 | |||
| 2026-01-20 | 13F | QV Investors Inc. | 598.556 | -7,26 | 32 | 3,33 | ||||
| 2026-02-11 | 13F | Parallel Advisors, LLC | 3.024 | 22,73 | 161 | 38,79 | ||||
| 2026-02-17 | 13F | Clear Street Markets Llc | 2.000 | 42,86 | 107 | 60,61 | ||||
| 2026-02-17 | 13F | Mercer Global Advisors Inc /adv | 9.479 | 11,69 | 505 | 25,62 | ||||
| 2026-02-02 | 13F | CENTRAL TRUST Co | 6.403 | 0,05 | 341 | 12,54 | ||||
| 2026-02-12 | 13F | Ensign Peak Advisors, Inc | 13.391 | 0,00 | 715 | 12,62 | ||||
| 2026-02-10 | 13F | Gulf International Bank (UK) Ltd | 15.730 | 0,00 | 1 | -100,00 | ||||
| 2026-02-13 | 13F | Walleye Capital LLC | Put | 17.300 | -29,96 | 922 | -21,20 | |||
| 2026-02-13 | 13F | Walleye Capital LLC | 172 | -99,25 | 9 | -99,17 | ||||
| 2026-01-16 | 13F | Ronald Blue Trust, Inc. | 5.390 | -10,23 | 287 | 1,06 | ||||
| 2026-02-13 | 13F | Walleye Capital LLC | Call | 8.700 | 464 | |||||
| 2026-02-12 | 13F | Grey Fox Wealth Advisors, LLC | 0 | -100,00 | 0 | |||||
| 2026-01-30 | 13F | Turning Point Benefit Group, Inc. | 5 | 0,00 | 0 | |||||
| 2026-02-13 | 13F | Golden State Wealth Management, LLC | 65 | 0,00 | 3 | 0,00 | ||||
| 2026-02-17 | 13F | Two Sigma Investments, Lp | 18.287 | 975 | ||||||
| 2026-02-12 | 13F | Quadrant Capital Group Llc | 1.022 | 0,00 | 54 | 12,50 | ||||
| 2026-02-02 | 13F | Millstone Evans Group, LLC | 800 | 0,00 | 43 | 13,51 | ||||
| 2026-02-13 | 13F | Korea Investment CORP | 159.768 | -15,63 | 8.528 | -4,97 | ||||
| 2026-01-08 | 13F | Wealth Enhancement Advisory Services, Llc | 41.057 | 1,93 | 2.359 | 25,76 | ||||
| 2026-01-23 | 13F | Cambiar Investors Llc | 8.475 | 90,45 | 452 | 114,76 | ||||
| 2026-02-04 | 13F | D'Orazio & Associates, Inc. | 4.400 | 235 | ||||||
| 2026-01-13 | 13F | Kathmere Capital Management, LLC | 9.262 | 53,02 | 494 | 72,38 | ||||
| 2026-02-04 | 13F | Pacer Advisors, Inc. | 386.996 | 116,46 | 17.132 | 102,27 | ||||
| 2026-02-17 | 13F | Public Employees Retirement System Of Ohio | 138.926 | -0,52 | 7.416 | 12,03 | ||||
| 2026-02-23 | 13F | Beaird Harris Wealth Management, LLC | 12 | 0,00 | 1 | |||||
| 2026-01-07 | 13F | Central Pacific Bank - Trust Division | 2.240 | 119 | ||||||
| 2026-02-13 | 13F | Wexford Capital Lp | 0 | -100,00 | 0 | |||||
| 2026-02-12 | 13F | Federation des caisses Desjardins du Quebec | 2.678.488 | 1,48 | 142.460 | 14,90 | ||||
| 2026-02-17 | 13F | Optiver Holding B.V. | 84 | 4 | ||||||
| 2026-02-10 | 13F | Root Financial Partners, LLC | 10 | 1 | ||||||
| 2026-02-11 | 13F | Erste Asset Management GmbH | 0 | 0 | ||||||
| 2026-01-22 | 13F | Venturi Wealth Management, LLC | 3.758 | 200 | ||||||
| 2026-01-14 | 13F | Jfs Wealth Advisors, Llc | 98 | 36,11 | 5 | 66,67 | ||||
| 2026-02-17 | 13F | Harris Associates L P | 206.680 | -90,43 | 11.016 | -89,24 | ||||
| 2026-02-02 | 13F | Montag A & Associates Inc | 248 | 0,00 | 13 | 18,18 | ||||
| 2025-10-31 | 13F | Whittier Trust Co Of Nevada Inc | 0 | -100,00 | 0 | -100,00 | ||||
| 2025-11-14 | 13F | AXA Investment Managers S.A. | 10.328 | 489 | ||||||
| 2026-02-13 | 13F | Alberta Investment Management Corp | 52.000 | 2.772 | ||||||
| 2025-11-10 | 13F | Rossby Financial, LCC | 0 | -100,00 | 0 | -100,00 | ||||
| 2026-02-12 | 13F | Brown Brothers Harriman & Co | 76 | 4 | ||||||
| 2026-02-17 | 13F | D. E. Shaw & Co., Inc. | Call | 29.400 | 0,00 | 1.567 | 12,57 | |||
| 2026-02-09 | 13F | Mediolanum International Funds Ltd | 73.585 | 93,77 | 3.952 | 121,72 | ||||
| 2026-02-09 | 13F | IPG Investment Advisors LLC | 82.950 | -54,94 | 4.421 | -49,31 | ||||
| 2026-02-17 | 13F | D. E. Shaw & Co., Inc. | 10.416 | -65,71 | 555 | -61,40 | ||||
| 2026-02-13 | 13F | Royal London Asset Management Ltd | 11.875 | 0,00 | 633 | 12,46 | ||||
| 2026-02-17 | 13F | D. E. Shaw & Co., Inc. | Put | 63.800 | -59,31 | 3.402 | -54,21 | |||
| 2026-02-18 | 13F | GWM Advisors LLC | 289 | 54,55 | 15 | 87,50 | ||||
| 2025-10-30 | 13F | Ridgewood Investments LLC | 0 | -100,00 | 0 | |||||
| 2026-02-10 | 13F | Rothschild Investment Llc | 400 | 0,00 | 21 | 16,67 | ||||
| 2026-02-17 | 13F | Laird Norton Trust Company, Llc | 13.797 | 735 | ||||||
| 2026-02-04 | 13F | LRI Investments, LLC | 0 | -100,00 | 0 | |||||
| 2026-01-23 | 13F | Stephenson National Bank & Trust | 6.732 | 2,34 | 359 | 15,11 | ||||
| 2026-02-13 | 13F | Natixis | 223.272 | 13,87 | 11.900 | 28,09 | ||||
| 2026-02-09 | 13F | Waratah Capital Advisors Ltd. | 220.000 | 214,29 | 11.726 | 253,62 | ||||
| 2026-02-03 | 13F | Buck Wealth Strategies, LLC | 271.462 | -4,84 | 14.469 | 7,05 | ||||
| 2026-02-10 | 13F | Acadian Asset Management Llc | 113.747 | 365,83 | 6 | 500,00 | ||||
| 2026-02-13 | 13F | Integrated Wealth Concepts LLC | 9.893 | -30,53 | 527 | -21,81 | ||||
| 2026-02-17 | 13F | SummitTX Capital, L.P. | 0 | -100,00 | 0 | |||||
| 2026-02-10 | 13F | Viawealth, Llc | 6.479 | -23,68 | 345 | -14,18 | ||||
| 2026-01-20 | 13F | Cigna Investments Inc /new | 4.597 | 0,00 | 0 | |||||
| 2026-02-11 | 13F | Jpmorgan Chase & Co | 1.535.121 | -12,59 | 81.822 | -1,66 | ||||
| 2026-02-17 | 13F | New Vernon Capital Holdings II LLC | 1.397 | 0,00 | 102 | 54,55 | ||||
| 2025-11-07 | 13F | CenterBook Partners LP | 8.932 | -65,16 | 423 | -57,23 | ||||
| 2026-01-12 | 13F | Legacy Wealth Asset Management, LLC | 10.919 | 3,49 | 582 | 16,43 | ||||
| 2026-02-17 | 13F | Royal Bank Of Canada | 11.929.452 | -6,99 | 635.839 | 4,63 | ||||
| 2025-11-05 | 13F | Plante Moran Financial Advisors, LLC | 0 | -100,00 | 0 | -100,00 | ||||
| 2026-02-17 | 13F | Creative Planning | 174.254 | 82,57 | 9.288 | 105,37 | ||||
| 2026-02-13 | 13F | Van Eck Associates Corp | 9.114 | 2,65 | 0 | |||||
| 2026-01-23 | 13F | Bridgewater Advisors Inc. | 5.519 | 9,63 | 298 | 19,28 | ||||
| 2026-02-13 | 13F | Kestra Advisory Services, LLC | 0 | -100,00 | 0 | |||||
| 2026-02-05 | 13F | Allworth Financial LP | 888 | 42,08 | 47 | 62,07 | ||||
| 2026-02-17 | 13F | Adage Capital Partners Gp, L.l.c. | 0 | -100,00 | 0 | |||||
| 2026-02-17 | 13F | Capital Fund Management S.a. | Put | 10.800 | -26,03 | 576 | -16,79 | |||
| 2026-02-13 | 13F | Charles Schwab Investment Management Inc | 1.620.675 | 1,05 | 86.511 | 13,82 | ||||
| 2026-02-13 | 13F | Wells Fargo & Company/mn | 159.192 | 0,34 | 8.485 | 12,88 | ||||
| 2026-02-05 | 13F | 1620 Investment Advisors, Inc. | 8.232 | 2,68 | 439 | 15,57 | ||||
| 2026-02-17 | 13F | Lombard Odier Asset Management (Switzerland) SA | 40.039 | 2.135 | ||||||
| 2026-02-17 | 13F | Tower Research Capital LLC (TRC) | 469 | -64,14 | 25 | -60,66 | ||||
| 2026-01-30 | 13F | North Star Investment Management Corp. | 272 | 36,00 | 14 | 55,56 | ||||
| 2026-02-03 | 13F | McIlrath & Eck, LLC | 210 | 0,00 | 11 | 22,22 | ||||
| 2026-01-26 | 13F | Mirae Asset Global Investments Co., Ltd. | 62.032 | 3.306 | ||||||
| 2026-03-04 | 13F | SHP Wealth Management | 100 | 5 | ||||||
| 2026-01-28 | 13F | HB Wealth Management, LLC | 3.786 | 202 | ||||||
| 2026-02-17 | 13F | Utah Retirement Systems | 30.000 | 0,00 | 1.601 | 12,67 | ||||
| 2026-02-11 | 13F | Janney Montgomery Scott LLC | 43.052 | -82,90 | 2 | -81,82 | ||||
| 2026-02-17 | 13F | Occudo Quantitative Strategies Lp | 101.108 | 80,18 | 5.389 | 102,75 | ||||
| 2026-01-27 | 13F | Meritage Portfolio Management | 74.204 | -0,98 | 3.955 | 11,41 | ||||
| 2026-02-02 | 13F | CX Institutional | 29 | 0 | ||||||
| 2026-02-17 | 13F | FIL Ltd | 7.755.088 | 140,89 | 413.420 | 171,03 | ||||
| 2025-11-12 | 13F | 111 Capital | 15.458 | 732 | ||||||
| 2025-11-03 | 13F | Annis Gardner Whiting Capital Advisors, LLC | 0 | -100,00 | 0 | |||||
| 2026-02-19 | 13F | Invesco Ltd. | 1.259.325 | 4,97 | 67.122 | 18,09 | ||||
| 2026-02-03 | 13F | SBI Securities Co., Ltd. | 6.387 | 22,40 | 340 | 37,65 | ||||
| 2026-02-13 | 13F | Mufg Securities (canada), Ltd. | 403.351 | -7,97 | 21.507 | 3,58 | ||||
| 2026-02-10 | 13F | Bank of New York Mellon Corp | 474.194 | -0,80 | 25.275 | 11,59 | ||||
| 2026-01-13 | 13F | Mather Group, Llc. | 0 | -100,00 | 0 | |||||
| 2026-02-11 | 13F | Allianz Asset Management GmbH | 604.995 | 296,92 | 32.294 | 347,09 | ||||
| 2026-01-08 | 13F | Value Partners Investments Inc. | 1.084.639 | 0,16 | 57.904 | 12,88 | ||||
| 2026-01-21 | 13F | SJS Investment Consulting Inc. | 81 | 4 | ||||||
| 2026-02-17 | 13F | Millennium Management Llc | 357.908 | 126,43 | 19.081 | 154,81 | ||||
| 2025-11-14 | 13F | DZ BANK AG Deutsche Zentral Genossenschafts Bank, Frankfurt am Main | 0 | -100,00 | 0 | -100,00 | ||||
| 2026-02-17 | 13F | Grantham, Mayo, Van Otterloo & Co. LLC | 1.117.408 | 35,55 | 59.568 | 52,51 | ||||
| 2026-02-13 | 13F | Vontobel Holding Ltd. | 4.988 | 17,20 | 266 | 31,84 | ||||
| 2026-02-23 | 13F | Mv Capital Management, Inc. | 4 | 0 | ||||||
| 2026-01-12 | 13F | Salem Investment Counselors Inc | 0 | -100,00 | 0 | |||||
| 2026-02-09 | 13F | Waratah Capital Advisors Ltd. | Call | 0 | -100,00 | 0 | -100,00 | |||
| 2026-02-17 | 13F | Credit Agricole S A | 17.270 | 57,31 | 920 | 76,92 | ||||
| 2026-02-10 | 13F | Savant Capital, LLC | 4.281 | 228 | ||||||
| 2026-02-14 | 13F | Copley Financial Group, Inc. | 5.383 | 26,90 | 287 | 43,00 | ||||
| 2026-02-10 | 13F | Bruce G. Allen Investments, LLC | 201 | 0,00 | 11 | 11,11 | ||||
| 2026-02-13 | 13F | MAI Capital Management | 700 | 118,07 | 37 | 146,67 | ||||
| 2026-02-02 | 13F | Intact Investment Management Inc. | 1.574.620 | 0,70 | 83.939 | 13,28 | ||||
| 2026-02-03 | 13F | Generali Asset Management SPA SGR | 28.748 | 5,33 | 2.103 | 16,90 | ||||
| 2026-02-12 | 13F | Scotia Capital Inc. | 353.344 | -14,43 | 18.779 | -3,12 | ||||
| 2026-02-03 | 13F | Ethic Inc. | 4.683 | -2,21 | 250 | 10,18 | ||||
| 2026-02-03 | 13F | Mitsubishi UFJ Kokusai Asset Management Co., Ltd. | 6.325 | -23,42 | 346 | -11,76 | ||||
| 2025-11-13 | 13F | Macquarie Group Ltd | 0 | -100,00 | 0 | -100,00 | ||||
| 2026-02-13 | 13F | Victory Capital Management Inc | 0 | -100,00 | 0 | |||||
| 2026-02-05 | 13F | Western Wealth Management, LLC | 6.459 | 0,54 | 344 | 13,16 | ||||
| 2026-02-17 | 13F | Citadel Advisors Llc | Put | 69.600 | -74,72 | 3.710 | -71,56 | |||
| 2026-02-17 | 13F | Citadel Advisors Llc | Call | 128.400 | -35,77 | 6.844 | -27,75 | |||
| 2026-02-17 | 13F | Mork Capital Management, LLC | 54.000 | 0,00 | 2.878 | 12,51 | ||||
| 2025-10-16 | 13F | Signature Resources Capital Management, LLC | 0 | -100,00 | 0 | |||||
| 2026-01-21 | 13F | Stone House Investment Management, LLC | 96 | 5 | ||||||
| 2026-02-13 | 13F | Colony Group, LLC | 7.551 | 74,31 | 403 | 96,10 | ||||
| 2026-02-17 | 13F | Citadel Advisors Llc | 57.475 | 3.063 | ||||||
| 2026-02-09 | 13F | Geode Capital Management, Llc | 2.426.843 | 6,81 | 128.774 | 20,36 | ||||
| 2026-02-10 | 13F | Quantbot Technologies LP | 44.199 | -77,89 | 2.356 | -75,13 | ||||
| 2026-02-03 | 13F | ASR Vermogensbeheer N.V. | 9.249 | 0,00 | 494 | 12,56 | ||||
| 2026-02-14 | 13F | Rockefeller Capital Management L.P. | 350.502 | 32,73 | 18.634 | 48,93 | ||||
| 2026-02-17 | 13F | PDT Partners, LLC | 14.000 | 746 |