Grundlæggende statistik
| Institutionelle aktier (lange) | 250.686.295 - 65,93% (ex 13D/G) - change of -89,54MM shares -26,32% MRQ |
| Institutionel værdi (lang) | $ 2.202.275 USD ($1000) |
Institutionelt ejerskab og aktionærer
MARA Holdings, Inc. (US:MARA) har 434 institutionelle ejere og aktionærer, der har indsendt 13D/G- eller 13F-formularer til Securities Exchange Commission (SEC). Disse institutioner har i alt 250,686,295 aktier. Største aktionærer omfatter BlackRock, Inc., Vanguard Group Inc, Susquehanna International Group, Llp, State Street Corp, Wolverine Asset Management Llc, LMR Partners LLP, Marex Group plc, Geode Capital Management, Llc, Citadel Advisors Llc, and UBS Group AG .
MARA Holdings, Inc. (NasdaqCM:MARA) institutionel ejerskabsstruktur viser aktuelle positioner i virksomheden efter institutioner og fonde, samt seneste ændringer i positionsstørrelse. Større aktionærer kan omfatte individuelle investorer, investeringsforeninger, hedgefonde eller institutioner. Skema 13D angiver, at investoren besidder (eller besidder) mere end 5 % af virksomheden og har til hensigt (eller har til hensigt at) aktivt at forfølge en ændring i forretningsstrategi. Skema 13G indikerer en passiv investering på over 5%.
The share price as of April 10, 2026 is 9,54 / share. Previously, on April 11, 2025, the share price was 12,51 / share. This represents a decline of 23,74% over that period.

Fondens stemningsscore
Fund Sentiment Score (fka Ownership Accumulation Score) finder de aktier, der bliver mest købt af fonde. Det er resultatet af en sofistikeret, multi-faktor kvantitativ model, der identificerer virksomheder med de højeste niveauer af institutionel akkumulering. Scoringsmodellen bruger en kombination af den samlede stigning i oplyste ejere, ændringerne i porteføljeallokeringer i disse ejere og andre målinger. Tallet går fra 0 til 100, hvor højere tal indikerer et højere niveau af akkumulering for sine jævnaldrende, og 50 er gennemsnittet.
Opdateringsfrekvens: Dagligt
Se Ownership Explorer, som giver en liste over højest rangerende virksomheder.
AI+ Ask Fintel’s AI assistant about MARA Holdings, Inc..
Select a question to share a public post with an AI-crafted answer.
Thinking of good questions…
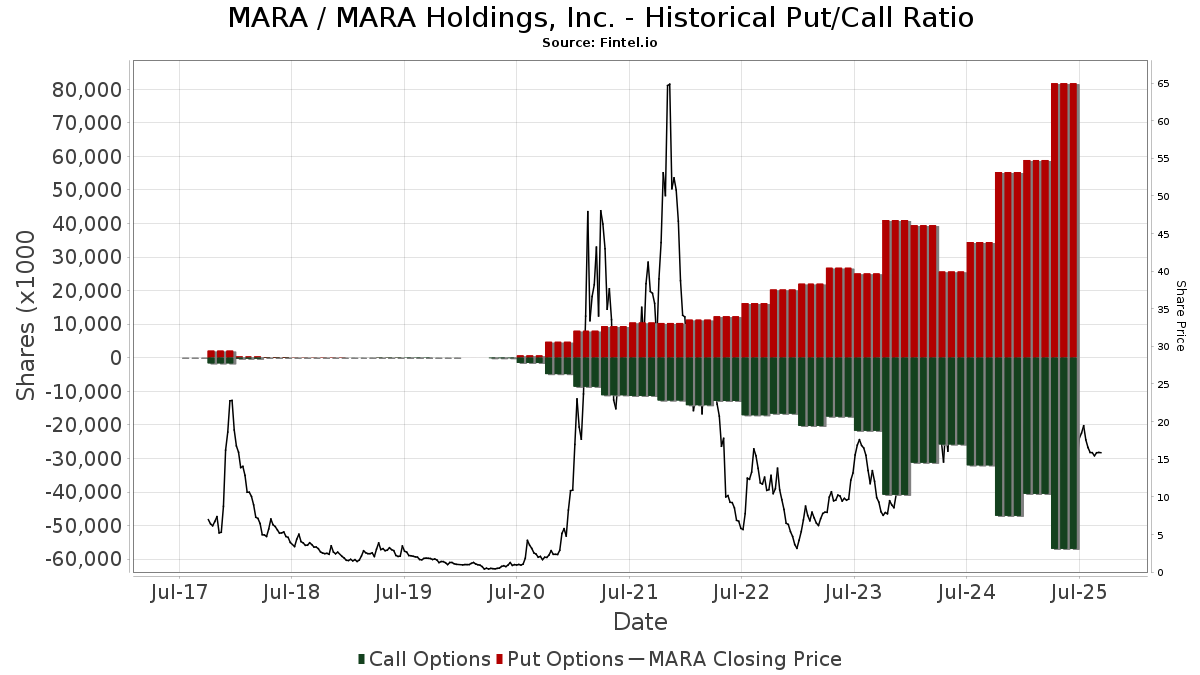
Institutionel Put/Call-forhold
Ud over at indberette standardaktie- og gældsudstedelser skal institutter med mere end 100 mill. aktiver under forvaltning også oplyse deres put- og call-optionsbeholdninger. Da salgsoptioner generelt indikerer negativ stemning, og købsoptioner indikerer positiv stemning, kan vi få en fornemmelse af den overordnede institutionelle stemning ved at plotte forholdet mellem put og kald. Diagrammet til højre viser det historiske put/call-forhold for dette instrument.
Brug af Put/Call Ratio som en indikator for investorernes stemning overvinder en af de vigtigste mangler ved at bruge totalt institutionelt ejerskab, som er, at en betydelig mængde af aktiver under forvaltning investeres passivt for at spore indekser. Passivt forvaltede fonde køber typisk ikke optioner, så indikatoren for put/call-forholdet følger mere nøje følelsen af aktivt forvaltede fonde.
13D/G-arkivering
Vi præsenterer 13D/G ansøgninger separat fra 13F ansøgninger på grund af den forskellige behandling af SEC. 13D/G-ansøgninger kan indgives af grupper af investorer (med én ledende), hvorimod 13F-ansøgninger ikke kan. Dette resulterer i situationer, hvor en investor kan indsende en 13D/G, der rapporterer én værdi for de samlede aktier (der repræsenterer alle de aktier, der ejes af investorgruppen), men derefter indsender en 13F, der rapporterer en anden værdi for de samlede aktier (der udelukkende repræsenterer deres egne) ejendomsret). Det betyder, at aktieejerskab af 13D/G-arkiver og 13F-arkiveringer ofte ikke er direkte sammenlignelige, så vi præsenterer dem separat.
Bemærk: Fra den 16. maj 2021 viser vi ikke længere ejere, der ikke har indsendt en 13D/G inden for det seneste år. Tidligere viste vi den fulde historie af 13D/G-arkiver. Generelt skal enheder, der er forpligtet til at indgive 13D/G-ansøgninger, indgive mindst årligt, før de indsender en afsluttende ansøgning. Dog forlader fonde nogle gange positioner uden at indsende en afsluttende ansøgning (dvs. de afvikler), så visning af den fulde historie resulterede nogle gange i forvirring om det nuværende ejerskab. For at undgå forvirring viser vi nu kun 'aktuelle' ejere - det vil sige - ejere, der har anmeldt inden for det seneste år.
Upgrade to unlock premium data.
| Fil dato | Form | Investor | Forrige Aktier |
Seneste Aktier |
Δ Aktier (Procent) |
Ejendomsret (Procent) |
Δ Ejerskab (Procent) |
|
|---|---|---|---|---|---|---|---|---|
| 2026-03-27 | VANGUARD GROUP INC | 36,076,670 | 0 | -100.00 | 0.00 | -100.00 | ||
| 2025-11-13 | SUSQUEHANNA SECURITIES, LLC | 19,297,219 | 18,825,520 | -2.44 | 4.90 | -7.55 |
13F og NPORT arkivering
Detaljer om 13F-arkivering er gratis. Detaljer om NP-ansøgninger kræver et premium-medlemskab. Grønne rækker angiver nye positioner. Røde rækker angiver lukkede positioner. Klik på linket ikon for at se den fulde transaktionshistorik.
Opgrader
for at låse premium-data op og eksportere til Excel ![]() .
.
| Fil dato | Kilde | Investor | Type | Gennemsnitlig pris (Øst) |
Aktier | Δ Aktier (%) |
Rapporteret Værdi ($1000) |
Δ Værdi (%) |
Port Alloc (%) |
|
|---|---|---|---|---|---|---|---|---|---|---|
| 2026-02-17 | 13F | Old Mission Capital Llc | 1.151.218 | 10.335 | ||||||
| 2026-02-17 | 13F | Old Mission Capital Llc | Put | 1.175.400 | 439,42 | 9.886 | 18.207,41 | |||
| 2026-01-22 | 13F | Bartlett & Co. Wealth Management Llc | 260 | 2 | ||||||
| 2026-02-05 | 13F | Bessemer Group Inc | 770 | -57,67 | 0 | |||||
| 2026-02-17 | 13F | Whitebox Advisors Llc | Put | 3.869.200 | 34,85 | 34.745 | -33,68 | |||
| 2026-02-12 | 13F | Brown Brothers Harriman & Co | 45 | 0 | ||||||
| 2026-02-17 | 13F | State Of Wisconsin Investment Board | 97.907 | -19,58 | 879 | -60,46 | ||||
| 2025-11-06 | 13F | Advisors Asset Management, Inc. | 0 | -100,00 | 0 | |||||
| 2026-02-17 | 13F | Point72 Asset Management, L.P. | 0 | -100,00 | 0 | -100,00 | ||||
| 2026-03-16 | 13F/A | Rockefeller Capital Management L.P. | 7.318 | -69,24 | 66 | -85,02 | ||||
| 2026-01-28 | 13F | Klp Kapitalforvaltning As | 75.200 | 0,00 | 675 | -50,84 | ||||
| 2026-02-03 | 13F | Farmers & Merchants Investments Inc | 190 | 0,00 | 2 | -66,67 | ||||
| 2026-02-11 | 13F | Cedar Mountain Advisors, LLC | 0 | -100,00 | 0 | |||||
| 2026-02-27 | 13F | Strategic Investment Solutions, Inc. /IL | 0 | -100,00 | 0 | -100,00 | ||||
| 2026-02-17 | 13F | Advisor Group Holdings, Inc. | 3.783 | -31,06 | 34 | -66,33 | ||||
| 2026-02-13 | 13F | Rafferty Asset Management, LLC | 27.660 | 10,63 | 248 | -45,61 | ||||
| 2026-02-13 | 13F | Itau Unibanco Holding S.A. | 4.733 | -97,34 | 43 | -98,71 | ||||
| 2026-02-13 | 13F | State Street Corp | 14.764.985 | 5,72 | 132.590 | -48,01 | ||||
| 2026-02-17 | 13F | ExodusPoint Capital Management, LP | 0 | -100,00 | 0 | -100,00 | ||||
| 2025-11-21 | 13F/A | CIBC Bancorp USA Inc. | 39.642 | 724 | ||||||
| 2026-02-24 | 13F/A | Pacer Advisors, Inc. | 0 | -100,00 | 0 | -100,00 | ||||
| 2026-01-23 | 13F | Assetmark, Inc | 33 | -76,76 | 0 | -100,00 | ||||
| 2026-02-13 | 13F | Barclays Plc | 1.730.400 | 50,42 | 15.539 | -26,03 | ||||
| 2026-02-17 | 13F | Parallax Volatility Advisers, L.P. | 0 | -100,00 | 0 | |||||
| 2026-02-17 | 13F | Twinbeech Capital Lp | 12.000 | 108 | ||||||
| 2026-02-17 | 13F | Northern Trust Corp | 3.121.689 | -10,02 | 28.033 | -55,75 | ||||
| 2026-02-17 | 13F | Old Mission Capital Llc | Call | 105.900 | -93,47 | 2 | -99,89 | |||
| 2026-02-17 | 13F | Alight Capital Management LP | 0 | -100,00 | 0 | -100,00 | ||||
| 2026-02-12 | 13F | Triumph Capital Management | 20 | 0 | ||||||
| 2026-02-17 | 13F | Bank Of America Corp /de/ | 3.407.521 | 320,58 | 30.600 | 106,83 | ||||
| 2026-02-10 | 13F | Eurizon Capital SGR S.p.A. | 3.898 | 36 | ||||||
| 2026-02-13 | 13F | Barclays Plc | Call | 1.361.100 | 109,66 | 12.223 | 3,10 | |||
| 2026-02-13 | 13F | Barclays Plc | Put | 421.900 | -67,92 | 3.789 | -84,22 | |||
| 2026-02-13 | 13F | Squarepoint Ops LLC | 69.538 | -97,78 | 624 | -98,91 | ||||
| 2026-01-15 | 13F | Nisa Investment Advisors, Llc | 29.545 | -66,51 | 265 | -83,55 | ||||
| 2026-02-12 | 13F | Cibc World Markets Corp | Put | 540.900 | 779,51 | 4.857 | 403,84 | |||
| 2025-10-16 | 13F | Ronald Blue Trust, Inc. | 0 | -100,00 | 0 | -100,00 | ||||
| 2026-01-21 | 13F | Signature Resources Capital Management, LLC | 1.000 | 9 | ||||||
| 2026-01-23 | 13F | Westside Investment Management, Inc. | 342 | 0,00 | 3 | -50,00 | ||||
| 2026-02-17 | 13F | Mercer Global Advisors Inc /adv | 0 | -100,00 | 0 | |||||
| 2026-02-13 | 13F | Squarepoint Ops LLC | Call | 539.600 | -5,12 | 4.846 | -53,34 | |||
| 2026-02-26 | 13F/A | Alpine Global Management, LLC | Call | 0 | -100,00 | 0 | -100,00 | |||
| 2026-02-13 | 13F | Squarepoint Ops LLC | Put | 1.255.900 | -69,42 | 11.278 | -84,96 | |||
| 2026-02-17 | 13F | Fmr Llc | 26.909 | -39,01 | 242 | -70,06 | ||||
| 2026-02-26 | 13F/A | Alpine Global Management, LLC | Put | 0 | -100,00 | 0 | -100,00 | |||
| 2026-02-17 | 13F | Nomura Holdings Inc | 524.290 | -41,18 | 4.708 | -71,07 | ||||
| 2026-02-17 | 13F | Nomura Holdings Inc | Call | 1.631.500 | 215,39 | 14.651 | 55,11 | |||
| 2026-02-17 | 13F | Nomura Holdings Inc | Put | 50.000 | 449 | |||||
| 2026-02-12 | 13F | Groupe la Francaise | 0 | -100,00 | 0 | -100,00 | ||||
| 2026-02-17 | 13F | Delaware Management Holdings, Inc. | 1.080.085 | 9.699 | ||||||
| 2026-01-30 | 13F | Richardson Capital Management LLC | 6.718 | 0,00 | 60 | -50,82 | ||||
| 2026-01-29 | 13F | UBS Group AG | 9.591.069 | -20,73 | 86.128 | -61,01 | ||||
| 2026-02-12 | 13F | Hohimer Wealth Management, Llc | 0 | -100,00 | 0 | -100,00 | ||||
| 2026-02-17 | 13F | Quantessence Capital LLC | 0 | -100,00 | 0 | |||||
| 2025-11-13 | 13F | UBS Group AG | Put | 0 | -100,00 | 0 | -100,00 | |||
| 2025-11-07 | 13F | Shell Asset Management Co | 1.920 | -59,20 | 0 | |||||
| 2025-11-13 | 13F | UBS Group AG | Call | 0 | -100,00 | 0 | -100,00 | |||
| 2026-01-21 | 13F | Capital Advisors, Ltd. LLC | 0 | -100,00 | 0 | |||||
| 2026-01-14 | 13F | Tradewinds Capital Management, LLC | 1.439 | 49,12 | 13 | -29,41 | ||||
| 2026-02-13 | 13F | Sei Investments Co | 40.925 | -0,39 | 368 | -51,07 | ||||
| 2026-02-17 | 13F | Dv Equities, Llc | 485 | 4 | ||||||
| 2026-02-11 | 13F | Capital Research Global Investors | 3.699.024 | -0,80 | 33.217 | -51,22 | ||||
| 2026-02-12 | 13F | Hohimer Wealth Management, Llc | Put | 0 | -100,00 | 0 | -100,00 | |||
| 2026-02-06 | 13F | Mizuho Markets Americas Llc | 330.578 | 11,00 | 2.969 | -45,42 | ||||
| 2026-02-17 | 13F | Brevan Howard Capital Management LP | 0 | -100,00 | 0 | -100,00 | ||||
| 2026-02-09 | 13F | MTM Investment Management, LLC | 125 | 0,00 | 1 | -50,00 | ||||
| 2026-02-17 | 13F | Wellington Management Group Llp | 353.081 | 3.171 | ||||||
| 2026-02-11 | 13F | United Financial Planning Group LLC | 100 | 1 | ||||||
| 2026-03-09 | 13F/A | CI Private Wealth, LLC | 0 | -100,00 | 0 | -100,00 | ||||
| 2026-02-17 | 13F | Farringdon Capital, Ltd. | 10.662 | 96 | ||||||
| 2025-11-12 | 13F | NewSquare Capital LLC | 0 | -100,00 | 0 | |||||
| 2026-01-16 | 13F | Evexia Wealth Llc | 11.847 | 5,61 | 132 | -42,29 | ||||
| 2026-02-13 | 13F | Prudential Financial Inc | 353.600 | -18,78 | 3.175 | -60,06 | ||||
| 2026-02-13 | 13F | Clear Street Group Inc. | 1.289.600 | -31,41 | 11.581 | -66,27 | ||||
| 2026-04-06 | 13F | Versant Capital Management, Inc | 1.390 | 10,14 | 11 | 0,00 | ||||
| 2026-02-13 | 13F | Intrepid Financial Planning Group LLC | 14.465 | -17,20 | 130 | -59,56 | ||||
| 2026-02-12 | 13F | MetLife Investment Management, LLC | 200.619 | -7,21 | 1.802 | -54,37 | ||||
| 2026-02-17 | 13F | Schonfeld Strategic Advisors LLC | Call | 50.000 | 0,00 | 449 | -50,82 | |||
| 2026-02-17 | 13F | Lighthouse Investment Partners, LLC | 24.340 | -45,91 | 219 | -73,45 | ||||
| 2026-02-13 | 13F | Morgan Stanley | 6.338.225 | 7,82 | 56.917 | -46,97 | ||||
| 2026-01-14 | 13F | Generali Investments CEE, investicni spolecnost, a.s. | 177.234 | 31,35 | 1.592 | -35,40 | ||||
| 2026-02-17 | 13F | Price T Rowe Associates Inc /md/ | 318.521 | -79,00 | 3 | -92,59 | ||||
| 2026-01-14 | 13F | Hennion & Walsh Asset Management, Inc. | 28.983 | 260 | ||||||
| 2026-02-12 | 13F | Swiss National Bank | 693.900 | 1,69 | 6.231 | -49,99 | ||||
| 2026-02-12 | 13F | Commonwealth Equity Services, Llc | 89.974 | 13,41 | 808 | 80.600,00 | ||||
| 2026-02-09 | 13F | Advent Capital Management /de/ | Call | 100.000 | 898 | |||||
| 2026-02-10 | 13F | Foundations Investment Advisors, LLC | 108.899 | 19,00 | 978 | -41,50 | ||||
| 2025-11-07 | 13F | Gsa Capital Partners Llp | 0 | -100,00 | 0 | |||||
| 2026-01-13 | 13F | Synergy Financial Management, LLC | 14.707 | 132 | ||||||
| 2026-02-12 | 13F | Renaissance Technologies Llc | 1.858.838 | -35,46 | 16.692 | -68,26 | ||||
| 2026-02-10 | 13F | Envestnet Asset Management Inc | 0 | -100,00 | 0 | -100,00 | ||||
| 2026-02-06 | 13F | Harvest Portfolios Group Inc. | 216.306 | -13,26 | 1.942 | -57,35 | ||||
| 2026-02-12 | 13F | Quadrant Capital Group Llc | 4.796 | -89,02 | 43 | -94,60 | ||||
| 2026-02-12 | 13F | California Public Employees Retirement System | 527.619 | 3,55 | 4.738 | -49,08 | ||||
| 2026-02-09 | 13F | New Age Alpha Advisors, LLC | 12.312 | -33,95 | 111 | -67,65 | ||||
| 2026-02-12 | 13F | Wedbush Securities Inc | 15.669 | 4,68 | 0 | |||||
| 2026-02-17 | 13F | Point72 Asset Management, L.P. | Put | 901.600 | 23,02 | 8.096 | -39,50 | |||
| 2026-01-23 | 13F | Clear Creek Financial Management, LLC | 33.978 | 22,27 | 305 | -39,84 | ||||
| 2026-02-17 | 13F | Point72 Asset Management, L.P. | Call | 190.500 | -29,00 | 1.711 | -65,09 | |||
| 2026-01-27 | 13F/A | Capital Performance Advisors Llp | 19.582 | 176 | ||||||
| 2026-02-06 | 13F | Profund Advisors Llc | 43.777 | 38,10 | 393 | -32,01 | ||||
| 2026-02-11 | 13F | Capital World Investors | 2.954.764 | 0,65 | 26.534 | -50,50 | ||||
| 2026-02-17 | 13F | Oxford Asset Management Llp | 96.949 | 871 | ||||||
| 2026-02-09 | 13F | Atlantic Trust, LLC | 0 | -100,00 | 0 | -100,00 | ||||
| 2026-02-17 | 13F/A | United Capital Management of KS, Inc. | 40.872 | 2,04 | 367 | -49,79 | ||||
| 2026-02-17 | 13F | Massar Capital Management, LP | Call | 1.831.100 | -17,10 | 16.443 | -59,23 | |||
| 2026-02-17 | 13F | Massar Capital Management, LP | 1.632.806 | 14.663 | ||||||
| 2026-02-17 | 13F | Massar Capital Management, LP | Put | 1.831.100 | -17,10 | 16.443 | -59,23 | |||
| 2025-11-21 | 13F/A | CIBC Bancorp USA Inc. | Put | 198.000 | 3.615 | |||||
| 2025-11-14 | 13F | Strategic Wealth Partners, Ltd. | 1.837 | 0,00 | 34 | 17,86 | ||||
| 2026-02-13 | 13F | Pinnacle Wealth Planning Services, Inc. | 6.930 | -45,17 | 62 | -73,04 | ||||
| 2026-02-12 | 13F | Wealthspire Advisors, LLC | 0 | -100,00 | 0 | -100,00 | ||||
| 2026-02-02 | 13F | Oppenheimer & Co Inc | 30.538 | -52,61 | 274 | -76,70 | ||||
| 2026-02-17 | 13F | Tudor Investment Corp Et Al | Put | 358.800 | 471,34 | 3.222 | 181,15 | |||
| 2026-02-17 | 13F | Tudor Investment Corp Et Al | Call | 155.500 | 118,71 | 1.396 | 7,55 | |||
| 2026-02-17 | 13F | Balyasny Asset Management Llc | 0 | -100,00 | 0 | -100,00 | ||||
| 2026-02-17 | 13F | Tudor Investment Corp Et Al | 304.889 | -47,85 | 2.738 | -74,36 | ||||
| 2025-11-14 | 13F | Sassicaia Capital Advisers Llc | 0 | -100,00 | 0 | |||||
| 2026-01-28 | 13F | Geneos Wealth Management Inc. | 2.805 | 39,90 | 25 | -30,56 | ||||
| 2026-02-06 | 13F | Covestor Ltd | 815 | 0,00 | 0 | |||||
| 2026-02-09 | 13F | Keating Financial Advisory Services, Inc. | 1 | 0 | ||||||
| 2026-02-17 | 13F | Pine Valley Investments Ltd Liability Co | Call | 68 | -64,17 | |||||
| 2026-02-17 | 13F | Aqr Capital Management Llc | 21.360 | 66,12 | 192 | -18,38 | ||||
| 2026-02-05 | 13F | Pacitti Group Inc. | 0 | -100,00 | 0 | |||||
| 2026-02-03 | 13F | International Assets Investment Management, Llc | 2.386 | 21 | ||||||
| 2026-01-27 | 13F | Zurcher Kantonalbank (Zurich Cantonalbank) | 78.754 | 2,83 | 707 | -49,43 | ||||
| 2026-02-17 | 13F | Cresset Asset Management, LLC | 100.569 | 238,66 | 903 | 66,61 | ||||
| 2026-02-11 | 13F | Strategic Advocates LLC | 6.284 | -61,94 | 59 | -80,73 | ||||
| 2026-02-11 | 13F | Twin Tree Management, LP | 186.795 | 49,25 | 1.677 | -26,61 | ||||
| 2026-02-13 | 13F | Golden State Wealth Management, LLC | 768 | -89,43 | 7 | -95,45 | ||||
| 2025-11-12 | 13F | 111 Capital | 0 | -100,00 | 0 | -100,00 | ||||
| 2026-01-14 | 13F | Spire Wealth Management | 2.130 | 0,00 | 19 | -50,00 | ||||
| 2026-02-17 | 13F | Two Sigma Investments, Lp | Put | 4.372.600 | -4,64 | 39.266 | -53,10 | |||
| 2026-02-13 | 13F | Police & Firemen's Retirement System of New Jersey | 98.505 | -4,62 | 885 | -53,10 | ||||
| 2026-02-11 | 13F | Twin Tree Management, LP | Put | 188.200 | 0,00 | 1.690 | -50,81 | |||
| 2026-02-13 | 13F | Capula Management Ltd | Call | 30.000 | -62,50 | 269 | -81,58 | |||
| 2026-02-13 | 13F | Capula Management Ltd | 18.450 | 166 | ||||||
| 2026-02-02 | 13F | Fifth Third Bancorp | 1.032 | -46,83 | 9 | -74,29 | ||||
| 2026-02-13 | 13F | Capula Management Ltd | Put | 30.000 | -62,50 | 269 | -81,58 | |||
| 2026-02-02 | 13F | Wolverine Asset Management Llc | Put | 12.575.100 | 53,82 | 112.924 | -24,35 | |||
| 2026-02-17 | 13F | Quantitative Investment Management, LLC | 0 | -100,00 | 0 | |||||
| 2026-02-05 | 13F | Elyxium Wealth, LLC | 2.700 | 24 | ||||||
| 2026-01-07 | 13F | Massmutual Trust Co Fsb/adv | 1.132 | -11,15 | 10 | -56,52 | ||||
| 2026-02-02 | 13F | Wolverine Asset Management Llc | Call | 135.000 | 16.775,00 | 1.212 | 8.557,14 | |||
| 2026-02-05 | 13F | Td Private Client Wealth Llc | 0 | -100,00 | 0 | |||||
| 2026-02-13 | 13F | Centiva Capital, LP | 17.764 | -87,94 | 160 | -94,09 | ||||
| 2026-02-13 | 13F | Centiva Capital, LP | Call | 614.800 | 145,92 | 5.521 | 20,92 | |||
| 2025-11-05 | 13F | Anthracite Investment Company, Inc. | 0 | -100,00 | 0 | |||||
| 2026-02-13 | 13F | Centiva Capital, LP | Put | 100.000 | 898 | |||||
| 2026-02-17 | 13F | J. Goldman & Co LP | 36.058 | 324 | ||||||
| 2026-02-17 | 13F | J. Goldman & Co LP | Call | 300.000 | 2.694 | |||||
| 2026-02-13 | 13F | Verition Fund Management LLC | Call | 100.000 | 898 | |||||
| 2026-02-13 | 13F | Marathon Trading Investment Management LLC | Call | 3.200 | -92,94 | 29 | -96,61 | |||
| 2026-02-13 | 13F | Verition Fund Management LLC | 10.874 | -70,33 | 98 | -85,50 | ||||
| 2026-02-13 | 13F | Marathon Trading Investment Management LLC | Put | 47.100 | 4,67 | 423 | -48,60 | |||
| 2026-01-28 | 13F | DekaBank Deutsche Girozentrale | 4.607 | 0,00 | 0 | |||||
| 2026-02-13 | 13F | 1832 Asset Management L.P. | 29.374 | 86,44 | 264 | -8,36 | ||||
| 2025-10-27 | 13F | Kiker Wealth Management, LLC | 0 | -100,00 | 0 | -100,00 | ||||
| 2026-01-22 | 13F | Massachusetts Financial Services Co /ma/ | 1.135.956 | 10.201 | ||||||
| 2026-02-11 | 13F | Cerity Partners LLC | 0 | -100,00 | 0 | |||||
| 2026-02-12 | 13F | BRYN MAWR TRUST Co | 0 | -100,00 | 0 | -100,00 | ||||
| 2026-02-13 | 13F | Wiregrass Investment Management Llc | 10.000 | 90 | ||||||
| 2026-02-13 | 13F | Marathon Trading Investment Management LLC | 216.866 | 1.809,37 | 1.947 | 840,58 | ||||
| 2026-02-17 | 13F | Alliancebernstein L.p. | 460.283 | 5,15 | 4.133 | -48,29 | ||||
| 2026-02-10 | 13F | Evolution Wealth Management Inc. | 750 | 0,00 | 7 | -53,85 | ||||
| 2026-02-17 | 13F | Edmond De Rothschild Holding S.a. | 844 | 8 | ||||||
| 2026-02-11 | 13F | Ameritas Investment Partners, Inc. | 31.069 | 0,00 | 279 | -50,79 | ||||
| 2025-11-04 | 13F | Guerra Advisors Inc | 555 | 10 | ||||||
| 2026-01-16 | 13F | Louisiana State Employees Retirement System | 173.200 | 1,70 | 1.555 | -49,98 | ||||
| 2026-02-17 | 13F | Engineers Gate Manager LP | 40.614 | 365 | ||||||
| 2026-02-17 | 13F | Alphadyne Asset Management, LLC | 0 | -100,00 | 0 | -100,00 | ||||
| 2026-04-08 | 13F | Wealth Enhancement Advisory Services, Llc | 30.964 | 7,61 | 270 | -9,12 | ||||
| 2026-02-13 | 13F | Mml Investors Services, Llc | 12.295 | 110 | ||||||
| 2026-02-17 | 13F | Lazard Asset Management Llc | 8.329 | 75 | ||||||
| 2026-02-10 | 13F | CIBC World Markets Inc. | 31.958 | -44,84 | 287 | -72,94 | ||||
| 2026-02-12 | 13F | Jane Street Group, Llc | Put | 6.350.700 | -22,70 | 57.029 | -61,99 | |||
| 2026-02-12 | 13F | Jane Street Group, Llc | Call | 6.123.000 | -16,81 | 54.985 | -59,09 | |||
| 2026-02-17 | 13F | Quantinno Capital Management LP | 40.089 | 118,64 | 360 | 7,78 | ||||
| 2026-02-10 | 13F | Skaana Management L.P. | Put | 40.900 | 367 | |||||
| 2026-02-10 | 13F | Skaana Management L.P. | Call | 10.000 | -66,67 | 90 | -83,73 | |||
| 2026-02-12 | 13F | Jane Street Group, Llc | 1.467.650 | 20,62 | 13.179 | -40,68 | ||||
| 2026-03-23 | 13F | Galaxy Digital Capital Management GP LLC | Put | 67.000 | -58,39 | 602 | -67,53 | |||
| 2026-02-17 | 13F | Alphadyne Asset Management, LLC | Call | 0 | -100,00 | 0 | -100,00 | |||
| 2026-02-17 | 13F | Maryland State Retirement & Pension System | 55.502 | 4,21 | 498 | -48,77 | ||||
| 2026-02-18 | 13F | State of Tennessee, Treasury Department | 148.988 | -4,83 | 1.415 | -50,49 | ||||
| 2026-02-13 | 13F | JustInvest LLC | 34.947 | 18,91 | 314 | -41,60 | ||||
| 2026-02-11 | 13F | Group One Trading, L.p. | 0 | -100,00 | 0 | -100,00 | ||||
| 2026-01-20 | 13F | AdvisorNet Financial, Inc | 6.215 | 3.666,67 | 56 | 1.733,33 | ||||
| 2026-02-13 | 13F | Quarry LP | 299 | 2.200,00 | 3 | |||||
| 2026-02-13 | 13F | Umb Bank N A/mo | 1.063 | -23,96 | 10 | -64,00 | ||||
| 2026-02-10 | 13F | Norges Bank | 4.397.792 | 39.492 | ||||||
| 2026-02-11 | 13F | Los Angeles Capital Management Llc | 43.748 | 14,15 | 777 | 11,02 | ||||
| 2025-11-14 | 13F | Two Sigma Securities, Llc | 0 | -100,00 | 0 | -100,00 | ||||
| 2026-02-11 | 13F | Deutsche Bank Ag\ | 389.738 | 3,22 | 3.500 | -49,25 | ||||
| 2026-01-30 | 13F/A | M&t Bank Corp | 52.650 | 25,01 | 473 | -38,62 | ||||
| 2026-02-05 | 13F | Phoenix Holdings Ltd. | 15.473 | -22,11 | 139 | -61,88 | ||||
| 2025-11-13 | 13F | Magnetar Financial LLC | 0 | -100,00 | 0 | -100,00 | ||||
| 2026-02-10 | 13F | Rothschild Investment Llc | 75 | -81,53 | 1 | -100,00 | ||||
| 2026-02-17 | 13F | Private Advisor Group, LLC | 68.291 | -63,27 | 613 | -81,94 | ||||
| 2026-01-30 | 13F | Archer Investment Corp | 8.260 | 7,97 | 74 | -46,76 | ||||
| 2026-01-16 | 13F | Marquette Asset Management, LLC | 42 | 0 | ||||||
| 2026-02-06 | 13F | Handelsbanken Fonder AB | 92.500 | 1 | ||||||
| 2026-02-11 | 13F | BIT Capital GmbH | Call | 0 | -100,00 | 0 | -100,00 | |||
| 2026-01-14 | 13F | Exchange Traded Concepts, Llc | 1.539.210 | 47,29 | 13.822 | -27,57 | ||||
| 2026-01-29 | 13F | Sava Infond d.o.o. | 28.000 | 40,00 | 251 | -31,23 | ||||
| 2026-01-30 | 13F | Simplicity Wealth,LLC | 0 | -100,00 | 0 | |||||
| 2025-11-13 | 13F | Total Investment Management Inc | 0 | -100,00 | 0 | -100,00 | ||||
| 2026-02-04 | 13F | Virginia Retirement Systems Et Al | 28.600 | 1,78 | 257 | -50,10 | ||||
| 2026-02-17 | 13F | Caption Management, LLC | Put | 325.000 | 225,00 | 2.918 | 59,80 | |||
| 2026-04-07 | 13F | Cooper Financial Group | 48.933 | 399 | ||||||
| 2026-02-17 | 13F | Caption Management, LLC | Call | 89.500 | -70,17 | 804 | -85,34 | |||
| 2026-04-03 | 13F | Adirondack Trust Co | 200 | -71,47 | 2 | -83,33 | ||||
| 2026-01-26 | 13F | KBC Group NV | 9.418 | 0,00 | 0 | |||||
| 2026-01-29 | 13F | Verdence Capital Advisors LLC | 0 | -100,00 | 0 | -100,00 | ||||
| 2026-02-12 | 13F | State Board Of Administration Of Florida Retirement System | 70.054 | 0,00 | 629 | -50,82 | ||||
| 2026-02-17 | 13F | Elequin Capital Lp | 1.011 | 9 | ||||||
| 2026-01-28 | 13F | Teacher Retirement System Of Texas | 11.605 | -74,80 | 104 | -87,62 | ||||
| 2026-02-03 | 13F | Crossmark Global Holdings, Inc. | 19.284 | 0,16 | 173 | -50,71 | ||||
| 2026-02-17 | 13F | Cantor Fitzgerald, L. P. | 280.300 | -42,21 | 2.517 | -71,58 | ||||
| 2026-02-23 | 13F | Virtu Financial LLC | 0 | -100,00 | 0 | -100,00 | ||||
| 2026-02-17 | 13F | Russell Investments Group, Ltd. | 39.847 | -14,77 | 358 | -58,15 | ||||
| 2026-02-13 | 13F | Pathstone Holdings, LLC | 0 | -100,00 | 0 | -100,00 | ||||
| 2026-02-13 | 13F | FORA Capital, LLC | 0 | -100,00 | 0 | -100,00 | ||||
| 2025-11-12 | 13F | Park Square Financial Group, LLC | 0 | -100,00 | 0 | |||||
| 2026-01-29 | 13F | IMC-Chicago, LLC | 764.611 | -16,57 | 6.866 | -58,97 | ||||
| 2026-01-29 | 13F | Teachers Retirement System Of The State Of Kentucky | 92.352 | -6,85 | 1 | -100,00 | ||||
| 2026-01-29 | 13F | IMC-Chicago, LLC | Put | 4.363.000 | -7,32 | 39.180 | -54,42 | |||
| 2025-11-06 | 13F | Center for Financial Planning, Inc. | 0 | -100,00 | 0 | |||||
| 2026-01-29 | 13F | IMC-Chicago, LLC | Call | 5.331.400 | -0,12 | 47.876 | -50,88 | |||
| 2026-02-09 | 13F | Prospera Financial Services Inc | 0 | -100,00 | 0 | |||||
| 2026-02-13 | 13F | Neo Ivy Capital Management | 0 | -100,00 | 0 | -100,00 | ||||
| 2026-02-17 | 13F | Prelude Capital Management, Llc | 20.029 | 180 | ||||||
| 2026-02-17 | 13F | Advisory Services Network, LLC | 0 | -100,00 | 0 | -100,00 | ||||
| 2026-02-17 | 13F | IHT Wealth Management, LLC | 25.898 | -6,10 | 233 | -53,88 | ||||
| 2026-02-06 | 13F | IFP Advisors, Inc | 193 | -90,44 | 2 | -97,22 | ||||
| 2026-02-13 | 13F | Bridgefront Capital, LLC | 72.408 | 650 | ||||||
| 2026-02-13 | 13F | Entropy Technologies, LP | 0 | -100,00 | 0 | -100,00 | ||||
| 2026-02-13 | 13F | Greenline Wealth Management LLC | 190 | 2 | ||||||
| 2026-02-13 | 13F | Ubs Asset Management Americas Inc | 600.641 | 7,67 | 5.394 | -47,05 | ||||
| 2026-02-12 | 13F | BlackRock, Inc. | 58.557.697 | 1,91 | 525.848 | -49,88 | ||||
| 2026-02-11 | 13F | Vermillion Wealth Management, Inc. | 787 | 53,71 | 7 | -22,22 | ||||
| 2026-01-16 | 13F | FNY Investment Advisers, LLC | 1.700 | -55,66 | 0 | |||||
| 2026-02-02 | 13F | Principal Financial Group Inc | 1.802.171 | -18,86 | 16.183 | -60,10 | ||||
| 2026-02-12 | 13F | Nuveen, LLC | 880.754 | -0,47 | 7.909 | -51,05 | ||||
| 2026-02-10 | 13F | Root Financial Partners, LLC | 346 | 668,89 | 3 | |||||
| 2026-01-22 | 13F | Advantage Alpha Capital Partners LP | 0 | -100,00 | 0 | -100,00 | ||||
| 2026-02-17 | 13F | XTX Topco Ltd | 69.801 | 156,15 | 627 | 25,96 | ||||
| 2025-11-14 | 13F | Sig Brokerage, Lp | 0 | -100,00 | 0 | -100,00 | ||||
| 2026-01-22 | 13F | HHM Wealth Advisors, LLC | 33 | 0,00 | 0 | |||||
| 2026-01-09 | 13F | SG Americas Securities, LLC | Put | 440.100 | -60,71 | 2 | ||||
| 2026-02-13 | 13F | Cynosure Management, Llc | 46.338 | 416 | ||||||
| 2026-01-12 | 13F | Thrive Wealth Management, LLC | 0 | -100,00 | 0 | -100,00 | ||||
| 2026-02-06 | 13F | Leonteq Securities AG | 78.140 | 432,87 | 702 | 162,55 | ||||
| 2026-02-10 | 13F | CIBC Asset Management Inc | 22.872 | 205 | ||||||
| 2026-02-06 | 13F | Leonteq Securities AG | Call | 300.000 | 2.694 | |||||
| 2026-02-13 | 13F | Citigroup Inc | 611.487 | -20,12 | 5.491 | -60,72 | ||||
| 2026-04-07 | 13F | Farther Finance Advisors, LLC | 9.179 | 18,38 | 74 | 5,80 | ||||
| 2026-02-13 | 13F | Citigroup Inc | Call | 291.400 | -20,47 | 2.617 | -60,90 | |||
| 2026-02-17 | 13F | MIRAE ASSET GLOBAL ETFS HOLDINGS Ltd. | 1.908.214 | -14,39 | 17.137 | -57,90 | ||||
| 2026-01-28 | 13F | Arizona State Retirement System | 98.472 | -5,44 | 884 | -53,50 | ||||
| 2026-02-13 | 13F | Citigroup Inc | Put | 91.800 | -44,96 | 824 | -72,94 | |||
| 2026-02-13 | 13F | Gts Securities Llc | 0 | -100,00 | 0 | -100,00 | ||||
| 2026-02-09 | 13F | Legal & General Group Plc | 907.065 | -3,83 | 8.145 | -52,71 | ||||
| 2025-11-14 | 13F | Capstone Investment Advisors, Llc | Put | 710.500 | -4,66 | 12.974 | 11,03 | |||
| 2025-11-21 | 13F/A | Royal Bank Of Canada | Put | 0 | -100,00 | 0 | -100,00 | |||
| 2026-01-28 | 13F | Salomon & Ludwin, LLC | 1.715 | -31,45 | 18 | -61,70 | ||||
| 2026-02-05 | 13F | Thrivent Financial For Lutherans | 259.855 | -2,77 | 2 | -50,00 | ||||
| 2026-02-17 | 13F | Toronto Dominion Bank | 934 | -99,10 | 8 | -99,58 | ||||
| 2026-02-11 | 13F | LPL Financial LLC | 982.568 | 61,64 | 8.823 | -20,51 | ||||
| 2026-02-11 | 13F | LPL Financial LLC | Put | 584.300 | 5.247 | |||||
| 2026-02-12 | 13F | SWAN Capital LLC | 160 | 471,43 | 1 | |||||
| 2026-01-21 | 13F | Flagship Harbor Advisors, Llc | 585 | 5 | ||||||
| 2026-02-17 | 13F | Banco Bilbao Vizcaya Argentaria, S.a. | 0 | -100,00 | 0 | |||||
| 2026-02-11 | 13F | Empowered Funds, LLC | 11.459 | 1,02 | 103 | -50,72 | ||||
| 2026-02-11 | 13F | Modus Advisors, LLC | 287 | 3 | ||||||
| 2025-10-31 | 13F | PFG Investments, LLC | 0 | -100,00 | 0 | -100,00 | ||||
| 2026-01-30 | 13F | Us Bancorp \de\ | 11.637 | -13,54 | 105 | -57,55 | ||||
| 2026-02-04 | 13F | Atlantic Union Bankshares Corp | 0 | -100,00 | 0 | |||||
| 2025-11-13 | 13F | Visionary Wealth Advisors | 0 | -100,00 | 0 | -100,00 | ||||
| 2025-11-06 | 13F | Abich Financial Wealth Management LLC | 0 | -100,00 | 0 | |||||
| 2025-11-10 | 13F | One River Asset Management, LLC | Call | 0 | -100,00 | 0 | -100,00 | |||
| 2026-02-13 | 13F | Stifel Financial Corp | 87.096 | -19,02 | 782 | -60,16 | ||||
| 2025-10-28 | 13F/A | Kingstone Capital Partners Texas, LLC | 0 | -100,00 | 0 | |||||
| 2026-02-02 | 13F | Mutual Advisors, LLC | 86.106 | -6,56 | 773 | -56,35 | ||||
| 2026-02-05 | 13F | Tucker Asset Management Llc | 428 | 4 | ||||||
| 2026-01-30 | 13F | Sigma Planning Corp | 11.924 | 12,45 | 107 | -44,56 | ||||
| 2026-02-17 | 13F | Bank Of America Corp /de/ | Put | 0 | -100,00 | 0 | -100,00 | |||
| 2026-02-17 | 13F | Capital Fund Management S.a. | 2.029.994 | -2,22 | 18.229 | -51,91 | ||||
| 2026-02-11 | 13F | Illinois Municipal Retirement Fund | 198.965 | 1.787 | ||||||
| 2026-02-17 | 13F | Greenland Capital Management LP | Put | 25.000 | 0,00 | 224 | -50,88 | |||
| 2026-02-17 | 13F | Raymond James Financial Inc | 77.871 | 3,76 | 699 | -48,98 | ||||
| 2026-02-13 | 13F | Delos Wealth Advisors, LLC | 1.000 | 9 | ||||||
| 2026-02-17 | 13F | Shelton Capital Management | 11.494 | 0,00 | 103 | -50,72 | ||||
| 2026-02-10 | 13F | Goldman Sachs Group Inc | 3.740.715 | -17,83 | 33.592 | -59,59 | ||||
| 2026-02-17 | 13F | Balyasny Asset Management Llc | Call | 285.500 | -26,98 | 2.564 | -64,10 | |||
| 2026-02-12 | 13F | Federation des caisses Desjardins du Quebec | 34.773 | -3,66 | 312 | -52,66 | ||||
| 2026-02-17 | 13F | Balyasny Asset Management Llc | Put | 4.031.100 | -25,33 | 36.199 | -63,28 | |||
| 2026-02-17 | 13F | Susquehanna International Group, Llp | Call | 15.645.400 | -8,66 | 140.496 | -55,08 | |||
| 2026-02-17 | 13F | Susquehanna International Group, Llp | 427.469 | -71,57 | 3.839 | -86,02 | ||||
| 2026-02-17 | 13F | Two Sigma Advisers, Lp | 26.047 | -99,65 | 234 | -99,83 | ||||
| 2026-02-17 | 13F | Susquehanna International Group, Llp | Put | 9.337.900 | -21,93 | 83.854 | -61,61 | |||
| 2026-02-02 | 13F | Cornerstone Planning Group LLC | 20 | 0,00 | 0 | |||||
| 2025-11-14 | 13F | WealthTrak Capital Management LLC | 0 | -100,00 | 0 | |||||
| 2026-02-11 | 13F | Franklin Resources Inc | 77.446 | 233,68 | 695 | 64,30 | ||||
| 2025-11-14 | 13F | Saba Capital Management, L.P. | Put | 0 | -100,00 | 0 | -100,00 | |||
| 2026-02-17 | 13F | Second Line Capital, LLC | 248.887 | -0,04 | 2.235 | -50,84 | ||||
| 2026-02-04 | 13F | Swiss Life Asset Management Ltd | 16.125 | 0,00 | 145 | -51,02 | ||||
| 2025-11-12 | 13F | Transce3nd, LLC | 0 | -100,00 | 0 | |||||
| 2026-02-10 | 13F | REAP Financial Group, LLC | 0 | -100,00 | 0 | |||||
| 2026-02-10 | 13F | Bnp Paribas Arbitrage, Sa | 97.949 | -44,70 | 880 | -72,82 | ||||
| 2026-02-17 | 13F | Captrust Financial Advisors | 20.462 | 184 | ||||||
| 2026-02-13 | 13F | Pine Valley Investments Ltd Liability Co | 0 | -100,00 | 0 | |||||
| 2026-01-29 | 13F | Vanguard Group Inc | 46.706.277 | 3,08 | 419.422 | -49,31 | ||||
| 2026-02-17 | 13F | Liontrust Investment Partners LLP | 0 | -100,00 | 0 | -100,00 | ||||
| 2025-11-14 | 13F | Cubist Systematic Strategies, LLC | Call | 376.300 | -77,67 | 6.871 | -73,99 | |||
| 2026-02-03 | 13F | Legacy Wealth Managment, LLC/ID | 150 | 1 | ||||||
| 2026-02-24 | 13F | Bell Investment Advisors, Inc | 84 | -71,43 | 1 | -100,00 | ||||
| 2025-11-14 | 13F | Cubist Systematic Strategies, LLC | Put | 40.300 | -88,74 | 736 | -86,90 | |||
| 2026-01-16 | 13F | Louisbourg Investments Inc. | 115 | 0,00 | 1 | -50,00 | ||||
| 2026-02-17 | 13F | Parallax Volatility Advisers, L.P. | Call | 2.826.800 | -14,58 | 25.385 | -57,99 | |||
| 2026-02-17 | 13F | Janus Henderson Group Plc | 150.209 | 0,00 | 1.350 | -50,80 | ||||
| 2025-11-14 | 13F | Cubist Systematic Strategies, LLC | 927.705 | 315,08 | 16.940 | 383,42 | ||||
| 2026-01-23 | 13F | Inlight Wealth Management, LLC | 100 | 100,00 | 1 | |||||
| 2026-02-17 | 13F | Parallax Volatility Advisers, L.P. | Put | 2.388.900 | -0,87 | 21.452 | -51,25 | |||
| 2026-02-17 | 13F | Sig Brokerage, Lp | Call | 20.000 | -89,61 | 180 | -94,91 | |||
| 2026-01-30 | 13F | R Squared Ltd | 18.319 | -54,82 | 165 | -77,84 | ||||
| 2026-01-09 | 13F | SG Americas Securities, LLC | 1.419.077 | 1.490,91 | 13 | 1.100,00 | ||||
| 2026-02-12 | 13F | Colonial Trust Advisors | 500 | 0,00 | 4 | -55,56 | ||||
| 2026-02-05 | 13F | Cambridge Investment Research Advisors, Inc. | 106.878 | 6,53 | 1 | -100,00 | ||||
| 2026-01-09 | 13F | SG Americas Securities, LLC | Call | 139.300 | 0,00 | 0 | ||||
| 2026-02-06 | 13F | EverSource Wealth Advisors, LLC | 710 | -4,18 | 6 | -53,85 | ||||
| 2026-02-10 | 13F | Goldman Sachs Group Inc | Call | 60.500 | 0,00 | 543 | -50,82 | |||
| 2026-02-10 | 13F | Intech Investment Management Llc | 213.066 | 56,21 | 1.913 | -23,17 | ||||
| 2026-02-10 | 13F | Goldman Sachs Group Inc | Put | 98.600 | -92,93 | 885 | -96,53 | |||
| 2026-02-06 | 13F | Global Retirement Partners, LLC | 20.941 | 28,46 | 188 | -36,70 | ||||
| 2026-02-20 | 13F | Sunbelt Securities, Inc. | 756 | -29,87 | 7 | -68,42 | ||||
| 2026-02-13 | 13F | Kilter Group LLC | 25 | -91,53 | 0 | -100,00 | ||||
| 2026-01-26 | 13F | United Advisor Group, LLC | Call | 2.800 | 25 | |||||
| 2026-01-26 | 13F | United Advisor Group, LLC | 14.365 | -81,67 | 129 | -91,05 | ||||
| 2026-01-06 | 13F | E Six Thirteen, Llc | 12.750 | -76,64 | 114 | -88,55 | ||||
| 2026-02-09 | 13F | SLT Holdings LLC | 0 | -100,00 | 0 | |||||
| 2026-04-02 | 13F | Aspect Partners, LLC | 306 | 37,84 | 2 | 100,00 | ||||
| 2026-02-17 | 13F | SIH Partners, LLLP | 0 | -100,00 | 0 | -100,00 | ||||
| 2026-02-11 | 13F | Prestige Wealth Management Group LLC | 212 | 2 | ||||||
| 2026-02-12 | 13F | Ankerstar Wealth, LLC | 22 | 0 | ||||||
| 2026-02-06 | 13F | Bare Financial Services, Inc | 864 | 62,71 | 8 | -22,22 | ||||
| 2026-02-18 | 13F | Vident Advisory, LLC | 1.693.604 | 71,01 | 15.209 | -15,90 | ||||
| 2025-11-12 | 13F | CMT Capital Markets Trading GmbH | Call | 0 | -100,00 | 0 | ||||
| 2026-02-06 | 13F | HighTower Advisors, LLC | 64.885 | -20,04 | 583 | -60,70 | ||||
| 2026-02-13 | 13F | Neuberger Berman Group LLC | 20.100 | -52,69 | 180 | -76,77 | ||||
| 2026-02-13 | 13F | Banco Santander, S.A. | 0 | -100,00 | 0 | -100,00 | ||||
| 2026-02-17 | 13F | Farallon Capital Management Llc | 0 | -100,00 | 0 | -100,00 | ||||
| 2026-02-12 | 13F | denkapparat Operations GmbH | 41.302 | 24,02 | 371 | -39,14 | ||||
| 2026-02-09 | 13F | Huntington National Bank | 796 | -3,63 | 7 | -53,33 | ||||
| 2026-01-29 | 13F | DecisionPoint Financial, LLC | 56 | 0,00 | 1 | -100,00 | ||||
| 2026-01-28 | 13F | CAPROCK Group, Inc. | 13.013 | 117 | ||||||
| 2026-02-13 | 13F | Toroso Investments, LLC | Call | 9.350.500 | -11,55 | 83.967 | -56,50 | |||
| 2026-02-18 | 13F | Caitlin John, LLC | 0 | -100,00 | 0 | -100,00 | ||||
| 2026-02-06 | 13F | ProShare Advisors LLC | 73.509 | 3,66 | 660 | -49,00 | ||||
| 2026-02-13 | 13F | Toroso Investments, LLC | 1.016.062 | -41,74 | 9.124 | -71,35 | ||||
| 2026-02-17 | 13F | Ionic Capital Management LLC | Call | 100.000 | 898 | |||||
| 2026-01-29 | 13F | Pictet Asset Management Holding SA | 127.719 | 132,56 | 1.147 | 14,37 | ||||
| 2026-02-12 | 13F | Great Valley Advisor Group, Inc. | 43.282 | 51,79 | 389 | -25,38 | ||||
| 2026-02-13 | 13F | Toroso Investments, LLC | Put | 789.200 | 281,07 | 7.087 | 87,44 | |||
| 2026-02-17 | 13F | Qube Research & Technologies Ltd | 604.700 | -59,09 | 5.430 | -79,88 | ||||
| 2026-02-17 | 13F | Qube Research & Technologies Ltd | Put | 149.800 | -34,76 | 1.345 | -67,92 | |||
| 2026-02-17 | 13F | Qube Research & Technologies Ltd | Call | 390.900 | -27,58 | 3.510 | -64,39 | |||
| 2026-02-10 | 13F | Belvedere Trading LLC | 21.355 | 192 | ||||||
| 2026-02-03 | 13F | Pilgrim Partners Asia Pte Ltd | 2.000 | 18 | ||||||
| 2026-02-10 | 13F | Belvedere Trading LLC | Put | 61.500 | -25,00 | 552 | -63,13 | |||
| 2026-02-13 | 13F | Walleye Trading LLC | Call | 1.166.500 | -22,14 | 10.475 | -61,71 | |||
| 2026-02-03 | 13F | Milestone Asset Management Group, LLC | 29.158 | 18,57 | 262 | -41,87 | ||||
| 2026-02-10 | 13F | Belvedere Trading LLC | Call | 106.300 | -33,40 | 955 | -67,26 | |||
| 2026-02-13 | 13F | Walleye Trading LLC | Put | 771.900 | -9,05 | 6.932 | -55,28 | |||
| 2026-02-17 | 13F | Mirabella Financial Services Llp | 24.159 | 217 | ||||||
| 2026-01-14 | 13F | Northwest Wealth Management, Llc | Call | 0 | -100,00 | 0 | ||||
| 2026-04-02 | 13F | Ares Financial Consulting, LLC | 10 | 0,00 | 0 | |||||
| 2026-02-17 | 13F | Cetera Investment Advisers | 183.311 | -2,01 | 1.646 | -51,81 | ||||
| 2026-02-09 | 13F | Harbour Investments, Inc. | 1.200 | -7,69 | 11 | -56,52 | ||||
| 2026-03-06 | 13F | Hsbc Holdings Plc | 568.952 | 5.220 | ||||||
| 2026-03-12 | 13F/A | Peak6 Llc | Call | 641.800 | -31,72 | 5.763 | -66,42 | |||
| 2026-03-12 | 13F/A | Peak6 Llc | 61.559 | 717,63 | 553 | 302,92 | ||||
| 2025-11-14 | 13F | Point72 (DIFC) Ltd | 6.217 | 114 | ||||||
| 2026-03-12 | 13F/A | Peak6 Llc | Put | 284.800 | -38,05 | 2.558 | -69,54 | |||
| 2026-02-13 | 13F | National Bank Of Canada /fi/ | Put | 0 | -100,00 | 0 | ||||
| 2026-04-07 | 13F | CoreCap Advisors, LLC | 1.601 | -28,88 | 13 | -35,00 | ||||
| 2026-01-21 | 13F | Stone House Investment Management, LLC | 0 | -100,00 | 0 | -100,00 | ||||
| 2026-01-21 | 13F | Sound Income Strategies, LLC | 1.044 | 18,23 | 12 | -35,29 | ||||
| 2026-02-17 | 13F | Fred Alger Management, Llc | 0 | -100,00 | 0 | -100,00 | ||||
| 2026-02-13 | 13F | National Bank Of Canada /fi/ | Call | 0 | -100,00 | 0 | ||||
| 2026-01-23 | 13F | Rsm Us Wealth Management Llc | 0 | -100,00 | 0 | -100,00 | ||||
| 2026-02-10 | 13F | Natixis Advisors, L.p. | 0 | -100,00 | 0 | |||||
| 2026-01-14 | 13F | Northwest Wealth Management, Llc | 10.704 | 0,00 | 96 | -50,77 | ||||
| 2026-02-12 | 13F | Skopos Labs, Inc. | 22.201 | 211 | ||||||
| 2026-02-09 | 13F | Hantz Financial Services, Inc. | 5.022 | 344,82 | 0 | |||||
| 2026-02-13 | 13F | DeepCurrents Investment Group LLC | 14.811 | 133 | ||||||
| 2026-01-15 | 13F | Capital Advisors Inc/ok | 42.218 | 1,60 | 379 | -50,00 | ||||
| 2026-02-13 | 13F | Hurley Capital, LLC | Call | 0 | -100,00 | 0 | -100,00 | |||
| 2026-02-13 | 13F | Glen Eagle Advisors, LLC | 95 | 0,00 | 1 | -100,00 | ||||
| 2026-02-09 | 13F | Jefferies Financial Group Inc. | Put | 1.087.500 | 295,45 | 9.766 | 94,48 | |||
| 2026-02-12 | 13F | IFC & Insurance Marketing, Inc. | 43 | 0 | ||||||
| 2026-02-09 | 13F | Jefferies Financial Group Inc. | Call | 375.000 | 0,00 | 3.368 | -50,83 | |||
| 2026-01-15 | 13F | Fortitude Family Office, LLC | 97 | 0,00 | 1 | -100,00 | ||||
| 2026-02-09 | 13F | Jefferies Financial Group Inc. | 69.069 | 620 | ||||||
| 2026-01-16 | 13F | FNY Investment Advisers, LLC | Call | 0 | -100,00 | 0 | ||||
| 2026-02-04 | 13F | Tsfg, Llc | 904 | 65,87 | 0 | |||||
| 2026-01-26 | 13F | Merit Financial Group, LLC | Call | 89.000 | 0,00 | 24 | -85,19 | |||
| 2026-02-13 | 13F | Hurley Capital, LLC | 247 | 2 | ||||||
| 2026-02-02 | 13F | Danske Bank A/s | 5.800 | 93,33 | 52 | -3,70 | ||||
| 2026-01-07 | 13F | Procyon Private Wealth Partners, LLC | 18.225 | 164 | ||||||
| 2026-02-09 | 13F | Hartland & Co., LLC | 1.463 | 13,15 | 13 | -43,48 | ||||
| 2026-02-13 | 13F | Landscape Capital Management, L.l.c. | 119.820 | 0,00 | 1.076 | -50,85 | ||||
| 2026-02-13 | 13F | SRS Capital Advisors, Inc. | 501 | 4 | ||||||
| 2026-01-30 | 13F | Wealthfront Advisers Llc | 85.794 | 58,13 | 770 | -22,22 | ||||
| 2026-02-20 | 13F | Kovitz Investment Group Partners, LLC | 16.100 | -21,19 | 145 | -61,39 | ||||
| 2026-02-12 | 13F | Voya Investment Management Llc | 653.591 | 85,61 | 5.869 | -8,71 | ||||
| 2026-01-05 | 13F | Catherine Avery Investment Management LLC | 65 | 1 | ||||||
| 2026-01-08 | 13F | Maridea Wealth Management LLC | 11.328 | -39,09 | 102 | -73,77 | ||||
| 2026-02-12 | 13F | Rossby Financial, LCC | 1.834 | 16 | ||||||
| 2026-02-13 | 13F | Y-Intercept (Hong Kong) Ltd | 0 | -100,00 | 0 | -100,00 | ||||
| 2026-01-26 | 13F | AE Wealth Management LLC | 15.600 | 140 | ||||||
| 2026-02-17 | 13F | California State Teachers Retirement System | 333.210 | -0,28 | 2.992 | -50,96 | ||||
| 2026-04-08 | 13F | E Fund Management (Hong Kong) Co., Ltd. | 970 | 8 | ||||||
| 2025-10-30 | 13F | Emerald Mutual Fund Advisers Trust | 0 | -100,00 | 0 | -100,00 | ||||
| 2026-02-17 | 13F | LMR Partners LLP | Put | 10.761.600 | 1,93 | 96.639 | -49,87 | |||
| 2025-11-12 | 13F | Creekmur Asset Management LLC | 52 | 0,00 | 1 | |||||
| 2026-02-10 | 13F | Quantbot Technologies LP | 81.558 | 732 | ||||||
| 2026-02-11 | 13F | Parallel Advisors, LLC | 709 | -29,94 | 6 | -66,67 | ||||
| 2026-01-30 | 13F | Bogart Wealth, LLC | 91 | 1 | ||||||
| 2026-01-14 | 13F | ORG Partners LLC | 0 | -100,00 | 0 | |||||
| 2026-02-05 | 13F | Amalgamated Bank | 109.717 | 3,11 | 1 | -100,00 | ||||
| 2026-02-13 | 13F | Smartleaf Asset Management LLC | 5.695 | -2,01 | 53 | -50,93 | ||||
| 2026-02-06 | 13F | Creative Financial Designs Inc /adv | 939 | 215,10 | 8 | 60,00 | ||||
| 2026-02-13 | 13F | K2 Principal Fund, L.p. | Call | 0 | -100,00 | 0 | -100,00 | |||
| 2026-02-13 | 13F | Public Employees Retirement Association Of Colorado | 28.093 | 0,00 | 0 | |||||
| 2026-02-03 | 13F | Stevens Capital Management Lp | 0 | -100,00 | 0 | -100,00 | ||||
| 2026-02-12 | 13F | CIBC Private Wealth Group, LLC | 3.228 | 27,49 | 29 | -39,13 | ||||
| 2026-02-13 | 13F | Aptus Capital Advisors, LLC | Call | 0 | -100,00 | 0 | -100,00 | |||
| 2026-02-12 | 13F | Steward Partners Investment Advisory, Llc | 2.545 | -85,60 | 23 | -93,17 | ||||
| 2026-02-11 | 13F | BI Asset Management Fondsmaeglerselskab A/S | 45.191 | -84,75 | 0 | -100,00 | ||||
| 2026-02-17 | 13F | Amundi | 23.830 | 45,01 | 214 | -36,98 | ||||
| 2026-02-18 | 13F | Mackenzie Financial Corp | 45.045 | 29,25 | 419 | -34,12 | ||||
| 2026-03-05 | 13F | Bayban | 200 | 2 | ||||||
| 2026-02-17 | 13F | Guggenheim Capital Llc | 22.082 | -15,55 | 198 | -58,49 | ||||
| 2026-02-17 | 13F | Graham Capital Management, L.P. | Call | 50.000 | 0,00 | 449 | -50,82 | |||
| 2026-01-23 | 13F | State of Alaska, Department of Revenue | 192.372 | 3,20 | 2 | -66,67 | ||||
| 2026-02-09 | 13F | Annis Gardner Whiting Capital Advisors, LLC | 0 | -100,00 | 0 | |||||
| 2026-02-12 | 13F | Principal Securities, Inc. | 0 | -100,00 | 0 | -100,00 | ||||
| 2026-01-26 | 13F | Cwm, Llc | 17.165 | 47,85 | 0 | |||||
| 2026-02-13 | 13F | Marshall Wace, Llp | Call | 91.500 | -26,33 | 822 | -63,78 | |||
| 2026-02-13 | 13F | Marshall Wace, Llp | Put | 5.500 | -65,62 | 49 | -83,22 | |||
| 2026-01-21 | 13F | Newbridge Financial Services Group, Inc. | 64.900 | 54,71 | 583 | -24,02 | ||||
| 2026-01-23 | 13F | Avion Wealth | 100 | -41,52 | 0 | |||||
| 2026-02-05 | 13F | Am Investment Strategies Llc | 34.354 | 0,00 | 0 | |||||
| 2026-02-13 | 13F | Parkside Financial Bank & Trust | 206 | -60,15 | 2 | -88,89 | ||||
| 2026-02-05 | 13F | Central Asset Investments & Management Holdings (HK) Ltd | 0 | -100,00 | 0 | |||||
| 2026-02-12 | 13F | Ensign Peak Advisors, Inc | 21.963 | -64,73 | 197 | -82,66 | ||||
| 2026-04-07 | 13F | Signaturefd, Llc | 6.172 | 187,60 | 50 | 163,16 | ||||
| 2026-01-30 | 13F | New York State Teachers Retirement System | 427.726 | 28,93 | 4 | -50,00 | ||||
| 2026-02-11 | 13F | Simplex Trading, Llc | 27.666 | 248 | ||||||
| 2026-02-11 | 13F | Simplex Trading, Llc | Call | 5.626.900 | 2,72 | 50.530 | 50.429,00 | |||
| 2026-03-23 | 13F | Galaxy Group Investments LLC | 0 | -100,00 | 0 | -100,00 | ||||
| 2026-02-17 | 13F | Alphadyne Asset Management, LLC | Put | 0 | -100,00 | 0 | -100,00 | |||
| 2026-02-11 | 13F | Simplex Trading, Llc | Put | 5.896.900 | -25,81 | 52.954 | 36.420,00 | |||
| 2026-02-06 | 13F | Pnc Financial Services Group, Inc. | 11.685 | -45,77 | 105 | -73,54 | ||||
| 2026-02-13 | 13F | Journey Strategic Wealth Llc | 0 | -100,00 | 0 | -100,00 | ||||
| 2026-02-06 | 13F | Larson Financial Group LLC | 115 | -74,39 | 1 | -87,50 | ||||
| 2026-01-26 | 13F | Phraction Management LLC | 25.000 | 0,00 | 224 | -50,88 | ||||
| 2026-02-10 | 13F | Thoroughbred Financial Services, Llc | 54.900 | -10,66 | 0 | -100,00 | ||||
| 2026-02-13 | 13F | Rhumbline Advisers | 1.087.111 | 2,93 | 9.762 | -49,38 | ||||
| 2026-02-13 | 13F | Walleye Capital LLC | Put | 236.500 | 105,47 | 2.124 | 1,05 | |||
| 2026-02-13 | 13F | Walleye Capital LLC | 2.115 | -98,57 | 19 | -99,33 | ||||
| 2026-01-28 | 13F | Universal- Beteiligungs- und Servicegesellschaft mbH | 75.567 | -70,84 | 679 | -85,67 | ||||
| 2026-02-13 | 13F | Walleye Capital LLC | Call | 540.300 | 202,18 | 4.852 | 48,62 | |||
| 2026-02-10 | 13F | Peapack Gladstone Financial Corp | 22.500 | 0 | ||||||
| 2026-02-12 | 13F | Bank Of Montreal /can/ | Put | 580.800 | -18,89 | 5.216 | -60,11 | |||
| 2026-02-13 | 13F | American Century Companies Inc | 247.087 | -94,65 | 2.219 | -97,37 | ||||
| 2026-02-12 | 13F | Bank Of Montreal /can/ | 106.461 | 128,09 | 956 | 12,21 | ||||
| 2025-11-14 | 13F | Bayesian Capital Management, LP | 0 | -100,00 | 0 | -100,00 | ||||
| 2026-02-13 | 13F | First Trust Advisors Lp | 1.406.011 | 5,66 | 12.626 | -48,04 | ||||
| 2025-11-14 | 13F | Wolverine Trading, Llc | Put | 934.900 | 27,63 | 17.445 | 58,46 | |||
| 2026-01-29 | 13F | Comerica Bank | 81.714 | -22,02 | 734 | -61,68 | ||||
| 2026-02-13 | 13F | Kestra Advisory Services, LLC | 0 | -100,00 | 0 | |||||
| 2026-02-13 | 13F | Estabrook Capital Management | 2.000 | 0,00 | 18 | -52,78 | ||||
| 2025-11-06 | 13F | Ameritas Advisory Services, LLC | 0 | -100,00 | 0 | |||||
| 2026-01-30 | 13F | Jennison Associates Llc | 58.055 | 31,16 | 521 | -35,52 | ||||
| 2026-03-03 | 13F/A | Caitong International Asset Management Co., Ltd | 0 | -100,00 | 0 | -100,00 | ||||
| 2025-11-14 | 13F | Wolverine Trading, Llc | 27.168 | -60,48 | 507 | -51,02 | ||||
| 2025-11-14 | 13F | Wolverine Trading, Llc | Call | 2.166.700 | 13,50 | 40.431 | 40,91 | |||
| 2026-02-17 | 13F | Clear Street Markets Llc | Call | 130.000 | -43,48 | 1.167 | -72,21 | |||
| 2026-01-15 | 13F | Brookstone Capital Management | 64.904 | -3,03 | 583 | -52,37 | ||||
| 2025-10-21 | 13F | GAM Holding AG | 0 | -100,00 | 0 | -100,00 | ||||
| 2026-01-27 | 13F | First Horizon Corp | 379 | 52,82 | 3 | -25,00 | ||||
| 2026-02-11 | 13F | O'shaughnessy Asset Management, Llc | 0 | -100,00 | 0 | -100,00 | ||||
| 2026-02-17 | 13F | Clear Street Markets Llc | 5 | 0 | ||||||
| 2026-02-26 | 13F | Anchor Investment Management, LLC | 100 | 1 | ||||||
| 2026-02-13 | 13F | Healthcare Of Ontario Pension Plan Trust Fund | 0 | -100,00 | 0 | -100,00 | ||||
| 2026-02-17 | 13F | Ancora Advisors, LLC | 225 | -70,12 | 2 | -84,62 | ||||
| 2026-02-02 | 13F | CENTRAL TRUST Co | 655 | 0,00 | 6 | -54,55 | ||||
| 2026-02-17 | 13F | D. E. Shaw & Co., Inc. | Put | 3.193.700 | 209,83 | 28.679 | 52,37 | |||
| 2026-02-17 | 13F | D. E. Shaw & Co., Inc. | Call | 1.283.700 | -70,66 | 11.528 | -85,57 | |||
| 2026-02-23 | 13F | Beaird Harris Wealth Management, LLC | 274 | 0,00 | 2 | -60,00 | ||||
| 2026-02-11 | 13F | Winton Capital Group Ltd | 0 | -100,00 | 0 | |||||
| 2026-02-12 | 13F | JPL Wealth Management, LLC | 0 | -100,00 | 0 | |||||
| 2026-02-17 | 13F | D. E. Shaw & Co., Inc. | 1.504.180 | -74,62 | 13.508 | -87,52 | ||||
| 2026-01-21 | 13F | Yousif Capital Management, Llc | 101.952 | -11,27 | 1.057 | -49,62 | ||||
| 2026-02-12 | 13F | Dimensional Fund Advisors Lp | 0 | -100,00 | 0 | |||||
| 2026-02-11 | 13F | J.w. Cole Advisors, Inc. | 15.451 | 137 | ||||||
| 2026-02-11 | 13F | Jpmorgan Chase & Co | Put | 266.600 | 38,78 | 2.394 | -31,74 | |||
| 2025-11-14 | 13F | Point72 Europe (London) LLP | 6.351 | 116 | ||||||
| 2026-03-02 | 13F | Tobam | 58.338 | 3,63 | 1 | -100,00 | ||||
| 2026-02-05 | 13F | Plancorp, LLC | 0 | -100,00 | 0 | -100,00 | ||||
| 2026-02-17 | 13F | Sherbrooke Park Advisers Llc | 16.103 | 3,00 | 145 | -49,47 | ||||
| 2026-02-11 | 13F | Jpmorgan Chase & Co | 1.722.485 | -44,00 | 15.468 | -72,46 | ||||
| 2026-02-17 | 13F | Teza Capital Management LLC | 12.460 | 112 | ||||||
| 2026-02-05 | 13F | HighMark Wealth Management LLC | 50 | 0,00 | 0 | |||||
| 2026-02-17 | 13F | Voloridge Investment Management, Llc | 1.613.399 | -68,34 | 14.488 | -84,43 | ||||
| 2026-02-17 | 13F | Atom Investors LP | 95.328 | 401,07 | 856 | 146,69 | ||||
| 2026-02-13 | 13F | Vienna Asset Management LLC | 0 | -100,00 | 0 | -100,00 | ||||
| 2026-02-17 | 13F | Graham Capital Management, L.P. | Put | 0 | -100,00 | 0 | -100,00 | |||
| 2026-02-18 | 13F | Galaxy Group Investments LLC | Put | 67.000 | 602 | |||||
| 2026-02-17 | 13F | Royal Bank Of Canada | 108.720 | -91,41 | 976 | -95,78 | ||||
| 2026-01-27 | 13F | BankPlus Trust Department | 100 | 1 | ||||||
| 2026-02-02 | 13F | WT Wealth Management | 19.805 | 58,97 | 178 | -22,03 | ||||
| 2026-02-12 | 13F | StoneX Group Inc. | 0 | -100,00 | 0 | |||||
| 2026-02-12 | 13F | Hollencrest Capital Management | 69 | -94,90 | 1 | -100,00 | ||||
| 2026-01-16 | 13F | Matauro, Llc | 0 | -100,00 | 0 | |||||
| 2026-04-06 | 13F | GAMMA Investing LLC | 21.260 | 419,42 | 173 | 380,56 | ||||
| 2025-11-14 | 13F | Sig Brokerage, Lp | Put | 0 | -100,00 | 0 | -100,00 | |||
| 2026-02-13 | 13F | Aptus Capital Advisors, LLC | 249.671 | 0,22 | 2.242 | -50,71 | ||||
| 2026-02-17 | 13F | Crawford Fund Management, LLC | Put | 147.000 | 75,00 | 1.320 | -13,89 | |||
| 2026-01-13 | 13F | Capital Investment Advisors, LLC | Call | 0 | -100,00 | 0 | -100,00 | |||
| 2026-02-10 | 13F | Main Management ETF Advisors, LLC | 94.743 | 1,03 | 1 | -100,00 | ||||
| 2026-01-27 | 13F | Evergreen Capital Management Llc | 0 | -100,00 | 0 | -100,00 | ||||
| 2026-02-17 | 13F | Schonfeld Strategic Advisors LLC | 0 | -100,00 | 0 | |||||
| 2026-02-10 | 13F | Commonwealth Of Pennsylvania Public School Empls Retrmt Sys | 93.626 | -0,76 | 841 | -51,22 | ||||
| 2026-02-17 | 13F | CastleKnight Management LP | 0 | -100,00 | 0 | |||||
| 2026-02-03 | 13F | Strengthening Families & Communities, LLC | 0 | -100,00 | 0 | -100,00 | ||||
| 2026-02-13 | 13F | Victory Capital Management Inc | 70.266 | 5,02 | 631 | -48,40 | ||||
| 2026-02-11 | 13F | Janney Montgomery Scott LLC | 0 | -100,00 | 0 | |||||
| 2026-02-13 | 13F | Centerpoint Advisors, LLC | 25 | 0,00 | 0 | |||||
| 2026-01-20 | 13F | Sara-Bay Financial | 27.130 | -79,81 | 253 | -89,69 | ||||
| 2026-02-03 | 13F | Horrell Capital Management, Inc. | 0 | -100,00 | 0 | -100,00 | ||||
| 2026-02-17 | 13F | Susquehanna Advisors Group, Inc. | Put | 3.200.000 | 0,00 | 28.736 | -50,82 | |||
| 2026-02-13 | 13F | DLD Asset Management, LP | Put | 1.646.000 | 24,60 | 14.789 | -38,67 | |||
| 2025-11-17 | 13F | Meteora Capital, LLC | 0 | -100,00 | 0 | -100,00 | ||||
| 2026-02-26 | 13F/A | Alpine Global Management, LLC | 18.768 | 169 | ||||||
| 2026-02-04 | 13F | Independent Advisor Alliance | 0 | -100,00 | 0 | -100,00 | ||||
| 2026-02-17 | 13F | Jain Global LLC | Put | 0 | -100,00 | 0 | -100,00 | |||
| 2026-02-17 | 13F | Tower Research Capital LLC (TRC) | 26.499 | -2,97 | 238 | -52,41 | ||||
| 2026-02-13 | 13F | Natixis | 55.239 | 322,19 | 496 | 108,40 | ||||
| 2026-02-13 | 13F | Flow Traders U.s. Llc | 11.324 | 0 | ||||||
| 2026-02-09 | 13F | Quest Partners LLC | 50.365 | 113,66 | 452 | 5,12 | ||||
| 2025-10-20 | 13F | Rooted Wealth Advisors, Inc. | 0 | -100,00 | 0 | -100,00 | ||||
| 2026-02-17 | 13F | Boothbay Fund Management, Llc | 117.306 | 116,71 | 1.053 | 6,58 | ||||
| 2026-02-13 | 13F | Wells Fargo & Company/mn | 1.765.555 | 214,66 | 15.855 | 54,75 | ||||
| 2026-01-29 | 13F | Concord Wealth Partners | 37 | 0,00 | 0 | |||||
| 2026-02-13 | 13F | Motiv8 Investments LLC | 75 | 0 | ||||||
| 2026-02-13 | 13F | Transamerica Financial Advisors, Inc. | 34 | 61,90 | 0 | |||||
| 2026-02-17 | 13F | Fortress Investment Group LLC | 14.056 | 0,00 | 126 | -50,78 | ||||
| 2026-02-17 | 13F | DZ BANK AG Deutsche Zentral Genossenschafts Bank, Frankfurt am Main | 0 | -100,00 | 0 | |||||
| 2026-01-13 | 13F | Stonehage Fleming Financial Services Holdings Ltd | 1.377 | 12 | ||||||
| 2026-02-17 | 13F | ClearAlpha Technologies LP | 47.227 | 307,83 | 424 | 100,95 | ||||
| 2026-02-18 | 13F | GWM Advisors LLC | 11.053 | 19,60 | 99 | -41,07 | ||||
| 2025-11-14 | 13F | Ionic Capital Management LLC | 0 | -100,00 | 0 | |||||
| 2026-02-11 | 13F | Rise Advisors, LLC | 0 | -100,00 | 0 | |||||
| 2025-11-12 | 13F | Wealthstar Advisors, Llc | 0 | -100,00 | 0 | |||||
| 2026-01-22 | 13F | Fiduciary Alliance LLC | 0 | -100,00 | 0 | -100,00 | ||||
| 2026-02-12 | 13F | Xponance, Inc. | 29.446 | 0,48 | 264 | -50,65 | ||||
| 2026-02-10 | 13F | Bank of New York Mellon Corp | 2.510.217 | 4,80 | 22.542 | -48,46 | ||||
| 2026-01-29 | 13F | Dunhill Financial, LLC | 12 | 0 | ||||||
| 2026-02-13 | 13F | Mariner, LLC | 17.793 | -66,23 | 160 | -83,47 | ||||
| 2026-02-13 | 13F | Morgan Dempsey Capital Management Llc | 700 | 0,00 | 6 | -50,00 | ||||
| 2026-02-05 | 13F | Allworth Financial LP | 727 | -51,82 | 7 | -77,78 | ||||
| 2026-02-17 | 13F | Algert Global Llc | 375.367 | 0,74 | 3 | -50,00 | ||||
| 2026-02-13 | 13F | Public Sector Pension Investment Board | 1.308.906 | -9,42 | 11.754 | -55,46 | ||||
| 2026-02-17 | 13F | Creative Planning | 72.394 | -51,52 | 650 | -76,16 | ||||
| 2026-01-27 | 13F | GHP Investment Advisors, Inc. | 20 | 0,00 | 0 | |||||
| 2025-10-14 | 13F | Sloy Dahl & Holst, LLC | 0 | -100,00 | 0 | |||||
| 2026-02-13 | 13F | Integrated Wealth Concepts LLC | 0 | -100,00 | 0 | -100,00 | ||||
| 2026-02-13 | 13F | Sculptor Capital LP | Put | 869.300 | 0,00 | 7.806 | -50,82 | |||
| 2026-02-13 | 13F | Van Eck Associates Corp | 2.727.069 | 125,35 | 24 | 9,09 | ||||
| 2026-02-12 | 13F | Campbell & CO Investment Adviser LLC | 98.320 | 221,60 | 883 | 58,06 | ||||
| 2026-02-17 | 13F | Capital Fund Management S.a. | Put | 580.400 | 13,63 | 5.212 | -44,13 | |||
| 2026-02-17 | 13F | Capital Fund Management S.a. | Call | 1.676.900 | 115,60 | 15.059 | 6,03 | |||
| 2026-02-13 | 13F | E6 Portfolios, LLC | 19.225 | 173 | ||||||
| 2026-02-10 | 13F | Mutual Of America Capital Management Llc | 43.224 | 4,16 | 388 | -48,75 | ||||
| 2026-02-17 | 13F | Strive Financial Group ,LLC | 1.784 | 16 | ||||||
| 2025-11-07 | 13F | Beacon Capital Management, LLC | 0 | -100,00 | 0 | -100,00 | ||||
| 2026-02-11 | 13F | Twin Tree Management, LP | Call | 0 | -100,00 | 0 | -100,00 | |||
| 2026-02-13 | 13F | Arkadios Wealth Advisors | Call | 5.000 | -10,71 | 45 | -56,86 | |||
| 2026-02-13 | 13F | Arkadios Wealth Advisors | 19.022 | 16,02 | 171 | -43,14 | ||||
| 2026-01-26 | 13F | Mirae Asset Global Investments Co., Ltd. | 1.261 | 20,21 | 11 | -42,11 | ||||
| 2026-02-13 | 13F | Vontobel Holding Ltd. | Call | 128.500 | 2.236,36 | 1.154 | 1.053,00 | |||
| 2026-02-13 | 13F | Vontobel Holding Ltd. | 229.195 | 101,93 | 2.058 | -0,68 | ||||
| 2026-02-02 | 13F | Strs Ohio | 16.900 | -62,78 | 152 | -81,79 | ||||
| 2026-02-17 | 13F | Gladstone Institutional Advisory LLC | 20.870 | -61,18 | 187 | -80,94 | ||||
| 2026-02-17 | 13F | Aquatic Capital Management LLC | 0 | -100,00 | 0 | |||||
| 2026-02-17 | 13F | Man Group plc | 0 | -100,00 | 0 | |||||
| 2026-02-04 | 13F | WealthTrust Asset Management, LLC | 13.600 | 26,69 | 122 | -37,76 | ||||
| 2026-02-03 | 13F | Morse Asset Management, Inc | 625 | 6 | ||||||
| 2026-02-17 | 13F | Quadrature Capital Ltd | 58.850 | 528 | ||||||
| 2026-02-03 | 13F | Mitsubishi UFJ Kokusai Asset Management Co., Ltd. | 27.118 | 64,76 | 269 | -10,67 | ||||
| 2026-02-13 | 13F | PCM Encore, LLC | 13.214 | 119 | ||||||
| 2026-02-04 | 13F | Oregon Public Employees Retirement Fund | 86.513 | 3,61 | 777 | -49,08 | ||||
| 2026-02-17 | 13F | Millennium Management Llc | 865.041 | 341,81 | 7.768 | 117,29 | ||||
| 2026-02-17 | 13F | Jain Global LLC | 40.250 | 361 | ||||||
| 2026-02-17 | 13F | Millennium Management Llc | Call | 39.900 | -33,28 | 358 | -67,19 | |||
| 2026-04-09 | 13F | Tompkins Financial Corp | 1.000 | 0,00 | 8 | 0,00 | ||||
| 2026-02-17 | 13F | Millennium Management Llc | Put | 1.223.600 | -52,10 | 10.988 | -76,45 | |||
| 2026-02-09 | 13F | Geode Capital Management, Llc | 9.957.766 | 2,59 | 89.434 | -49,55 | ||||
| 2026-02-13 | 13F | Sterling Capital Management LLC | 21.428 | -17,08 | 192 | -59,24 | ||||
| 2026-02-17 | 13F | Kemnay Advisory Services Inc. | 1.063 | 10 | ||||||
| 2026-02-13 | 13F | K2 Principal Fund, L.p. | Put | 225.000 | 2.020 | |||||
| 2026-02-04 | 13F | Meridian Wealth Management, LLC | 11.000 | 99 | ||||||
| 2026-02-13 | 13F | Verition Fund Management LLC | Put | 0 | -100,00 | 0 | -100,00 | |||
| 2026-02-13 | 13F | MAI Capital Management | 162 | 0,00 | 1 | -50,00 | ||||
| 2026-02-12 | 13F | Marex Group plc | 10.137.713 | 2,62 | 91.037 | -49,53 | ||||
| 2026-02-12 | 13F | New York State Common Retirement Fund | 111.419 | -2,54 | 1.001 | -52,08 | ||||
| 2026-02-19 | 13F | Invesco Ltd. | 1.514.790 | 48,49 | 13.603 | -26,98 | ||||
| 2026-01-27 | 13F | Financial Management Professionals, Inc. | 35 | 0,00 | 0 | |||||
| 2026-02-12 | 13F | Cibc World Markets Corp | 172.103 | 302,35 | 1.545 | 130,60 | ||||
| 2026-02-13 | 13F | Macquarie Group Ltd | 0 | -100,00 | 0 | -100,00 | ||||
| 2026-02-12 | 13F | Ci Investments Inc. | 12.563 | 17,05 | 113 | |||||
| 2026-02-17 | 13F | Citadel Advisors Llc | Call | 9.868.400 | -30,75 | 88.618 | -65,95 | |||
| 2025-11-13 | 13F | Elevatus Welath Management | 0 | -100,00 | 0 | -100,00 | ||||
| 2026-02-02 | 13F | Bellecapital International Ltd. | 0 | -100,00 | 0 | -100,00 | ||||
| 2026-02-13 | 13F | Charles Schwab Investment Management Inc | 4.390.797 | 8,33 | 39.429 | -46,72 | ||||
| 2026-02-17 | 13F | Citadel Advisors Llc | Put | 6.912.300 | -24,62 | 62.072 | -62,93 | |||
| 2026-02-17 | 13F | Citadel Advisors Llc | 1.392.303 | -45,98 | 12.503 | -73,44 | ||||
| 2026-02-03 | 13F | Generali Asset Management SPA SGR | 250.000 | 0,00 | 2.245 | -50,82 | ||||
| 2025-11-05 | 13F | Fortitude Advisory Group L.L.C. | Call | 0 | -100,00 | 0 | -100,00 | |||
| 2026-01-30 | 13F | State of New Jersey Common Pension Fund D | 181.554 | 32,38 | 1.630 | -34,90 | ||||
| 2026-04-06 | 13F | Rosenberg Matthew Hamilton | 260 | 0,00 | 2 | 0,00 | ||||
| 2026-02-13 | 13F | Walleye Trading LLC | 0 | -100,00 | 0 | -100,00 | ||||
| 2025-11-12 | 13F | HAP Trading, LLC | Put | 57.900 | 95 | |||||
| 2025-12-01 | 13F | Groupama Asset Managment | 401 | 13,64 | ||||||
| 2025-10-30 | 13F | Emerald Advisers, Llc | 0 | -100,00 | 0 | -100,00 | ||||
| 2025-11-12 | 13F | HAP Trading, LLC | Call | 159.300 | 331 | |||||
| 2026-02-04 | 13F | LRI Investments, LLC | 93 | 1 | ||||||
| 2026-02-17 | 13F | Two Sigma Investments, Lp | 0 | -100,00 | 0 | -100,00 | ||||
| 2026-02-11 | 13F | Group One Trading, L.p. | Put | 984.500 | -30,97 | 8.841 | -66,05 | |||
| 2026-02-11 | 13F | Group One Trading, L.p. | Call | 3.032.800 | -18,39 | 27.235 | -59,86 | |||
| 2026-02-03 | 13F | SBI Securities Co., Ltd. | 100.506 | -21,76 | 903 | -61,54 | ||||
| 2026-02-11 | 13F | Barrow Hanley Mewhinney & Strauss Llc | 66 | 1 | ||||||
| 2026-02-13 | 13F | Manufacturers Life Insurance Company, The | 0 | -100,00 | 0 | |||||
| 2026-02-10 | 13F/A | Northwestern Mutual Wealth Management Co | 2.099 | -2,14 | 19 | -53,85 | ||||
| 2026-02-17 | 13F | Credit Agricole S A | 86.480 | 361,40 | 777 | 126,90 | ||||
| 2026-02-17 | 13F | Jump Financial, LLC | 89.755 | -93,41 | 806 | -96,76 | ||||
| 2026-02-17 | 13F | Credit Agricole S A | Put | 125.000 | 1.122 | |||||
| 2026-01-20 | 13F | Stratos Wealth Partners, LTD. | 16.573 | 149 | ||||||
| 2026-02-17 | 13F | SageView Advisory Group, LLC | 185 | 2 | ||||||
| 2026-02-10 | 13F | Parametrica Management Ltd | 10.735 | 96 | ||||||
| 2026-02-05 | 13F | Western Wealth Management, LLC | 21.530 | -7,25 | 193 | -54,37 | ||||
| 2026-02-06 | 13F | Global Retirement Partners, LLC | Call | 0 | -100,00 | 0 | ||||
| 2026-02-13 | 13F | DeepCurrents Investment Group LLC | Call | 0 | -100,00 | 0 | -100,00 | |||
| 2026-02-13 | 13F | BNP Paribas Asset Management Holding S.A. | 4.744 | 0 | ||||||
| 2025-10-30 | 13F | Twin Peaks Wealth Advisors, LLC | 0 | -100,00 | 0 | -100,00 | ||||
| 2026-04-10 | 13F | Abound Wealth Management | 15 | 0,00 | 0 | |||||
| 2026-02-17 | 13F | Ameriprise Financial Inc | 752.208 | -9,58 | 6.755 | -55,54 | ||||
| 2026-02-12 | 13F | Hrt Financial Lp | 0 | -100,00 | 0 | -100,00 | ||||
| 2026-02-13 | 13F | Colony Group, LLC | 335.636 | 3.014 | ||||||
| 2026-02-13 | 13F | Gmt Capital Corp | 83.800 | 0,00 | 753 | -50,85 | ||||
| 2026-01-29 | 13F | UMA Financial Services, Inc. | 91 | -61,44 | 1 | -100,00 | ||||
| 2026-04-06 | 13F | CX Institutional | 21.514 | 106,07 | 0 | |||||
| 2025-11-07 | 13F | Sierra Ocean, Llc | 0 | -100,00 | 0 | |||||
| 2026-02-17 | 13F | Css Llc/il | Put | 337.800 | -3,21 | 3.033 | -52,40 | |||
| 2026-02-17 | 13F | Creative Planning | Call | 0 | -100,00 | 0 |