Grundlæggende statistik
| Institutionelle aktier (lange) | 141.010.762 - 42,44% (ex 13D/G) - change of 2,63MM shares 1,90% MRQ |
| Institutionel værdi (lang) | $ 5.258.065 USD ($1000) |
Institutionelt ejerskab og aktionærer
IREN Limited (US:IREN) har 443 institutionelle ejere og aktionærer, der har indsendt 13D/G- eller 13F-formularer til Securities Exchange Commission (SEC). Disse institutioner har i alt 141,010,762 aktier. Største aktionærer omfatter Jane Street Group, Llc, Susquehanna International Group, Llp, Susquehanna International Group, Llp, D. E. Shaw & Co., Inc., Citadel Advisors Llc, Citadel Advisors Llc, Citigroup Inc, Jane Street Group, Llc, Situational Awareness LP, and Jefferies Financial Group Inc. .
IREN Limited (NasdaqGS:IREN) institutionel ejerskabsstruktur viser aktuelle positioner i virksomheden efter institutioner og fonde, samt seneste ændringer i positionsstørrelse. Større aktionærer kan omfatte individuelle investorer, investeringsforeninger, hedgefonde eller institutioner. Skema 13D angiver, at investoren besidder (eller besidder) mere end 5 % af virksomheden og har til hensigt (eller har til hensigt at) aktivt at forfølge en ændring i forretningsstrategi. Skema 13G indikerer en passiv investering på over 5%.
The share price as of April 24, 2026 is 50,64 / share. Previously, on April 28, 2025, the share price was 6,39 / share. This represents an increase of 692,49% over that period.

Fondens stemningsscore
Fund Sentiment Score (fka Ownership Accumulation Score) finder de aktier, der bliver mest købt af fonde. Det er resultatet af en sofistikeret, multi-faktor kvantitativ model, der identificerer virksomheder med de højeste niveauer af institutionel akkumulering. Scoringsmodellen bruger en kombination af den samlede stigning i oplyste ejere, ændringerne i porteføljeallokeringer i disse ejere og andre målinger. Tallet går fra 0 til 100, hvor højere tal indikerer et højere niveau af akkumulering for sine jævnaldrende, og 50 er gennemsnittet.
Opdateringsfrekvens: Dagligt
Se Ownership Explorer, som giver en liste over højest rangerende virksomheder.
AI+ Ask Fintel’s AI assistant about IREN Limited.
Select a question to share a public post with an AI-crafted answer.
Thinking of good questions…
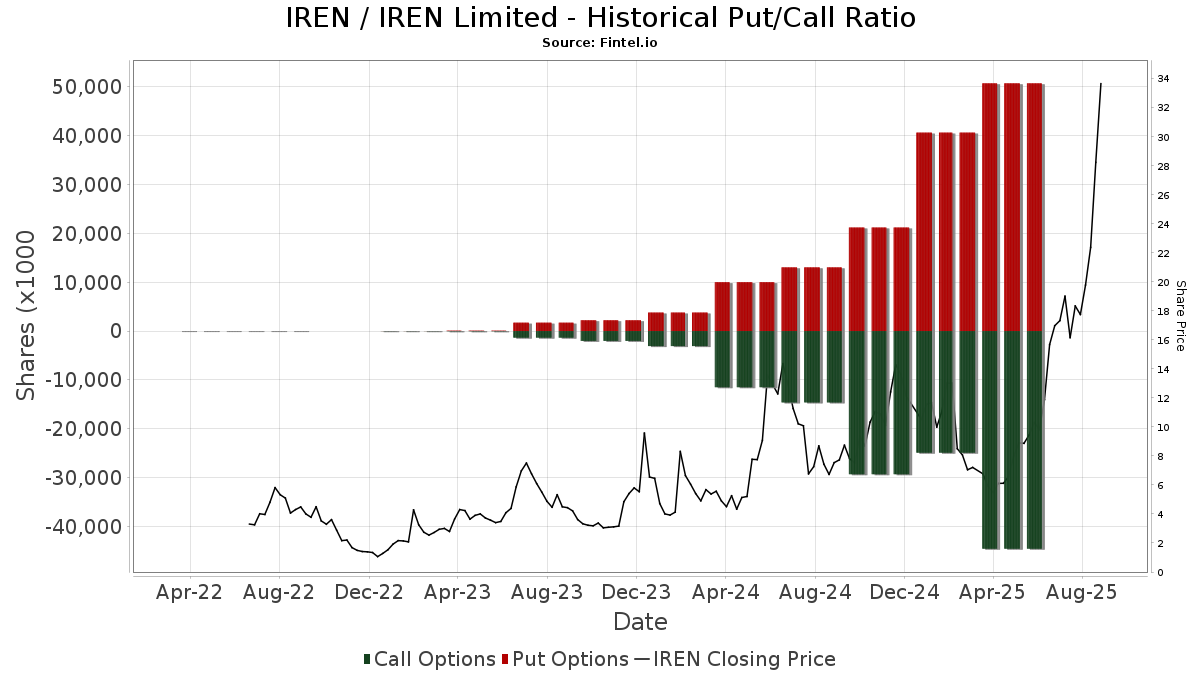
Institutionel Put/Call-forhold
Ud over at indberette standardaktie- og gældsudstedelser skal institutter med mere end 100 mill. aktiver under forvaltning også oplyse deres put- og call-optionsbeholdninger. Da salgsoptioner generelt indikerer negativ stemning, og købsoptioner indikerer positiv stemning, kan vi få en fornemmelse af den overordnede institutionelle stemning ved at plotte forholdet mellem put og kald. Diagrammet til højre viser det historiske put/call-forhold for dette instrument.
Brug af Put/Call Ratio som en indikator for investorernes stemning overvinder en af de vigtigste mangler ved at bruge totalt institutionelt ejerskab, som er, at en betydelig mængde af aktiver under forvaltning investeres passivt for at spore indekser. Passivt forvaltede fonde køber typisk ikke optioner, så indikatoren for put/call-forholdet følger mere nøje følelsen af aktivt forvaltede fonde.
13D/G-arkivering
Vi præsenterer 13D/G ansøgninger separat fra 13F ansøgninger på grund af den forskellige behandling af SEC. 13D/G-ansøgninger kan indgives af grupper af investorer (med én ledende), hvorimod 13F-ansøgninger ikke kan. Dette resulterer i situationer, hvor en investor kan indsende en 13D/G, der rapporterer én værdi for de samlede aktier (der repræsenterer alle de aktier, der ejes af investorgruppen), men derefter indsender en 13F, der rapporterer en anden værdi for de samlede aktier (der udelukkende repræsenterer deres egne) ejendomsret). Det betyder, at aktieejerskab af 13D/G-arkiver og 13F-arkiveringer ofte ikke er direkte sammenlignelige, så vi præsenterer dem separat.
Bemærk: Fra den 16. maj 2021 viser vi ikke længere ejere, der ikke har indsendt en 13D/G inden for det seneste år. Tidligere viste vi den fulde historie af 13D/G-arkiver. Generelt skal enheder, der er forpligtet til at indgive 13D/G-ansøgninger, indgive mindst årligt, før de indsender en afsluttende ansøgning. Dog forlader fonde nogle gange positioner uden at indsende en afsluttende ansøgning (dvs. de afvikler), så visning af den fulde historie resulterede nogle gange i forvirring om det nuværende ejerskab. For at undgå forvirring viser vi nu kun 'aktuelle' ejere - det vil sige - ejere, der har anmeldt inden for det seneste år.
Upgrade to unlock premium data.
| Fil dato | Form | Investor | Forrige Aktier |
Seneste Aktier |
Δ Aktier (Procent) |
Ejendomsret (Procent) |
Δ Ejerskab (Procent) |
|
|---|---|---|---|---|---|---|---|---|
| 2026-02-13 | SUSQUEHANNA SECURITIES, LLC | 20,078,286 | 13,954,021 | -30.50 | 4.20 | -40.00 | ||
| 2026-02-02 | JANE STREET GROUP, LLC | 17,465,660 | 15,447,088 | -11.56 | 4.70 | -26.56 | ||
| 2025-08-14 | Citadel Securities GP LLC | 12,126,363 | 5.00 | |||||
| 2025-07-23 | HANSAINVEST Hanseatische Investment-Limited Co | 11,030,092 | 11,396,168 | 3.32 | 4.70 | -16.07 | ||
| 2025-07-03 | Roberts William Gregory | 5,000,000 | 6,251,247 | 25.02 | 2.41 | -59.83 | ||
| 2025-07-03 | Roberts Daniel John | 5,000,000 | 6,251,247 | 25.02 | 2.41 | -59.83 |
13F og NPORT arkivering
Detaljer om 13F-arkivering er gratis. Detaljer om NP-ansøgninger kræver et premium-medlemskab. Grønne rækker angiver nye positioner. Røde rækker angiver lukkede positioner. Klik på linket ikon for at se den fulde transaktionshistorik.
Opgrader
for at låse premium-data op og eksportere til Excel ![]() .
.
| Fil dato | Kilde | Investor | Type | Gennemsnitlig pris (Øst) |
Aktier | Δ Aktier (%) |
Rapporteret Værdi ($1000) |
Δ Værdi (%) |
Port Alloc (%) |
|
|---|---|---|---|---|---|---|---|---|---|---|
| 2026-02-17 | 13F | CastleKnight Management LP | 595.875 | 26,95 | 22.506 | 2,17 | ||||
| 2026-02-06 | 13F | HighTower Advisors, LLC | 88.838 | 64,48 | 3.355 | 32,40 | ||||
| 2026-02-10 | 13F | JTC Employer Solutions Trusteee Ltd | 4.710 | 0,00 | 0 | |||||
| 2026-02-13 | 13F | Truvestments Capital Llc | 100 | -23,08 | 4 | -50,00 | ||||
| 2026-02-11 | 13F | Tradition Wealth Management, LLC | 13.837 | 10,46 | 523 | -11,07 | ||||
| 2026-04-24 | 13F | Raiffeisen Bank International AG | 241 | 8 | ||||||
| 2026-02-13 | 13F | Delos Wealth Advisors, LLC | 100 | 4 | ||||||
| 2026-04-16 | 13F | Brookstone Capital Management | 15.790 | 541 | ||||||
| 2026-02-06 | 13F | Mizuho Markets Americas Llc | Put | 1.313.595 | 60,59 | 9.341 | -18,45 | |||
| 2026-02-06 | 13F | Mizuho Markets Americas Llc | Call | 1.313.595 | 113 | |||||
| 2026-02-12 | 13F | CIBC Private Wealth Group, LLC | 800 | -50,00 | 30 | -60,00 | ||||
| 2025-11-12 | 13F | Fox Run Management, L.l.c. | 0 | -100,00 | 0 | -100,00 | ||||
| 2026-02-10 | 13F/A | Northwestern Mutual Wealth Management Co | 16 | 1 | ||||||
| 2025-11-14 | 13F | Main Management ETF Advisors, LLC | 0 | -100,00 | 0 | -100,00 | ||||
| 2026-02-13 | 13F | Islay Capital Management, Llc | 0 | -100,00 | 0 | |||||
| 2026-02-02 | 13F | Wolverine Asset Management Llc | Put | 6.564.000 | 24,54 | 247.922 | 0,23 | |||
| 2026-02-10 | 13F | CIBC World Markets Inc. | 17.397 | -8,49 | 657 | -26,35 | ||||
| 2026-02-09 | 13F | Atlantic Trust, LLC | 726 | 27 | ||||||
| 2026-02-17 | 13F | Voleon Capital Management Lp | 282.203 | 21,75 | 10.659 | -2,01 | ||||
| 2026-02-17 | 13F | Quadrature Capital Ltd | 2.870.637 | 1.022,21 | 108.424 | 803,60 | ||||
| 2026-01-30 | 13F | Pekin Hardy Strauss, Inc. | 6.175 | 233 | ||||||
| 2026-02-13 | 13F | Walleye Capital LLC | 151.892 | 29,44 | 5.737 | 4,18 | ||||
| 2026-02-13 | 13F | Walleye Capital LLC | Call | 115.400 | -74,63 | 4.359 | -79,59 | |||
| 2026-02-06 | 13F | Harvest Portfolios Group Inc. | 127.197 | -17,99 | 4.804 | -33,99 | ||||
| 2026-02-17 | 13F | Alpine Woods Capital Investors, Llc | 15.743 | 595 | ||||||
| 2026-02-12 | 13F | Moneta Group Investment Advisors Llc | 117.455 | 11,68 | 4.436 | -10,11 | ||||
| 2026-04-20 | 13F | Banque Cantonale Vaudoise | 1.434 | 0,00 | 49 | -9,26 | ||||
| 2026-02-12 | 13F | Moneta Group Investment Advisors Llc | Call | 13.480 | -34,38 | 509 | -47,20 | |||
| 2026-01-15 | 13F | Fifth Third Wealth Advisors LLC | 0 | -100,00 | 0 | |||||
| 2026-02-06 | 13F | Leonteq Securities AG | 31.232 | 1.180 | ||||||
| 2026-02-11 | 13F | Cedar Mountain Advisors, LLC | 0 | -100,00 | 0 | -100,00 | ||||
| 2026-02-13 | 13F | Walleye Capital LLC | Put | 163.000 | -71,73 | 6.157 | -77,25 | |||
| 2025-11-13 | 13F | Capital Fund Management S.a. | 0 | -100,00 | 0 | -100,00 | ||||
| 2026-01-30 | 13F | Sigma Planning Corp | 37.172 | -18,19 | 1.404 | -34,19 | ||||
| 2026-02-13 | 13F | Dockside LLC | 29.231 | 1.104 | ||||||
| 2025-11-14 | 13F | Aquatic Capital Management LLC | 0 | -100,00 | 0 | -100,00 | ||||
| 2026-02-10 | 13F | Weaver Consulting Group | 12.500 | -1,66 | 472 | -20,81 | ||||
| 2026-02-11 | 13F | Picton Mahoney Asset Management | 0 | -100,00 | 0 | |||||
| 2026-03-27 | 13F | Prosperity Wealth Management, Inc. | 0 | -100,00 | 0 | |||||
| 2026-02-13 | 13F | Caitong International Asset Management Co., Ltd | 0 | -100,00 | 0 | |||||
| 2026-04-20 | 13F | Friedenthal Financial | 85 | 3 | ||||||
| 2026-02-06 | 13F | Mizuho Markets Americas Llc | 1.313.595 | 60,59 | 49.614 | 29,25 | ||||
| 2026-02-12 | 13F | Colonial Trust Advisors | 500 | 19 | ||||||
| 2026-02-17 | 13F | Jones Financial Companies Lllp | 150 | 6 | ||||||
| 2026-03-12 | 13F/A | Peak6 Llc | 0 | -100,00 | 0 | -100,00 | ||||
| 2026-04-07 | 13F | Signaturefd, Llc | 438 | 338,00 | 15 | 400,00 | ||||
| 2026-04-22 | 13F | Truefg, Llc | 9.473 | 5,26 | 325 | -4,42 | ||||
| 2026-02-13 | 13F | Resources Investment Advisors, LLC. | 0 | -100,00 | 0 | |||||
| 2026-02-17 | 13F | Sig Brokerage, Lp | Call | 154.900 | 1,84 | 5.851 | -18,04 | |||
| 2026-02-17 | 13F | Sig Brokerage, Lp | 87.485 | 40,13 | 3.304 | 12,80 | ||||
| 2026-02-17 | 13F | Sig Brokerage, Lp | Put | 289.400 | 93,97 | 10.931 | 56,12 | |||
| 2026-04-21 | 13F | Wedbush Securities Inc | 24.545 | 5,64 | 1 | |||||
| 2026-01-12 | 13F | Castleview Partners, Llc | 6.905 | -4,76 | 261 | -23,53 | ||||
| 2026-04-15 | 13F | FNY Investment Advisers, LLC | 900 | 620,00 | 0 | |||||
| 2026-04-22 | 13F | Abundance Wealth Counselors | 7.000 | 0,00 | 240 | -9,47 | ||||
| 2026-04-15 | 13F | FNY Investment Advisers, LLC | Call | 40 | 0 | |||||
| 2026-02-13 | 13F | Keystone Investors Pte Ltd | 16.020 | 225,61 | 605 | 163,04 | ||||
| 2026-01-30 | 13F | R Squared Ltd | 6.795 | -52,25 | 257 | -61,62 | ||||
| 2026-04-21 | 13F | Vise Technologies, Inc. | 5.780 | 0,00 | 218 | 0,00 | ||||
| 2026-02-11 | 13F | Group One Trading, L.p. | 1.181.644 | -61,42 | 44.631 | -68,95 | ||||
| 2026-02-13 | 13F | Allianz Se | 50.550 | 4.043,44 | 1.909 | 3.249,12 | ||||
| 2026-02-17 | 13F | Sender Co & Partners, Inc. | 0 | -100,00 | 0 | |||||
| 2026-04-21 | 13F | SLT Holdings LLC | 15.325 | 31,83 | 525 | 19,59 | ||||
| 2026-02-24 | 13F | Tru Independence Asset Management 2, Llc | 0 | -100,00 | 0 | -100,00 | ||||
| 2025-11-14 | 13F | Interval Partners, LP | Call | 0 | -100,00 | 0 | ||||
| 2026-02-12 | 13F | Intrinsic Edge Capital Management LLC | 0 | -100,00 | 0 | -100,00 | ||||
| 2026-04-23 | 13F | Intrua Financial, LLC | 9.491 | 49,00 | 325 | 35,42 | ||||
| 2026-02-11 | 13F | X-Square Capital, LLC | 240.000 | 9 | ||||||
| 2025-11-14 | 13F | Interval Partners, LP | 0 | -100,00 | 0 | |||||
| 2026-02-17 | 13F | Murchinson Ltd. | Put | 0 | -100,00 | 0 | ||||
| 2026-02-10 | 13F | Meramec Financial Planners, LLC | 3.807 | 159 | ||||||
| 2025-11-13 | 13F | Sei Investments Co | 0 | -100,00 | 0 | |||||
| 2026-02-17 | 13F | Alight Capital Management LP | 90.000 | -35,71 | 3.399 | -48,26 | ||||
| 2026-04-01 | 13F | Bangor Savings Bank | 476 | 16 | ||||||
| 2026-02-17 | 13F | Cetera Investment Advisers | 234.106 | 569,77 | 8.842 | 439,15 | ||||
| 2026-02-17 | 13F | Cetera Investment Advisers | Call | 600 | 1 | |||||
| 2025-11-14 | 13F | Cubist Systematic Strategies, LLC | Put | 289.300 | -49,49 | 13.577 | 62,68 | |||
| 2026-01-30 | 13F | Us Bancorp \de\ | 24.352 | 4,89 | 920 | -15,61 | ||||
| 2025-11-14 | 13F | Cubist Systematic Strategies, LLC | Call | 826.900 | 125,74 | 38.806 | 627,25 | |||
| 2026-02-13 | 13F | Wells Fargo & Company/mn | Call | 4.810.000 | 181.674 | |||||
| 2026-02-17 | 13F | Twinbeech Capital Lp | 83.255 | 3.145 | ||||||
| 2026-02-17 | 13F | MIRAE ASSET GLOBAL ETFS HOLDINGS Ltd. | 1.256.860 | 33,51 | 47.472 | 7,45 | ||||
| 2026-04-10 | 13F | Henry James International Management Inc. | 0 | -100,00 | 0 | -100,00 | ||||
| 2026-02-13 | 13F | Wells Fargo & Company/mn | 437.742 | -94,45 | 16.534 | -95,53 | ||||
| 2026-02-13 | 13F | Cladis Investment Advisory, LLC | 6.600 | 249 | ||||||
| 2026-02-13 | 13F | Wells Fargo & Company/mn | Put | 2.500.000 | -67,02 | 94.425 | -73,46 | |||
| 2026-02-13 | 13F | FORA Capital, LLC | 221.998 | 8.385 | ||||||
| 2026-02-17 | 13F | Miura Global Management, LLC | 0 | -100,00 | 0 | |||||
| 2026-02-17 | 13F | Parallax Volatility Advisers, L.P. | Call | 1.663.700 | 7,96 | 62.838 | -13,11 | |||
| 2026-02-17 | 13F | National Asset Management, Inc. | 5.643 | 213 | ||||||
| 2026-04-08 | 13F | Dynamic Advisor Solutions LLC | 8.310 | 1,55 | 285 | -8,09 | ||||
| 2026-02-17 | 13F | National Asset Management, Inc. | Call | 1.000 | 38 | |||||
| 2026-01-30 | 13F | W.G. Shaheen & Associates DBA Whitney & Co | 18.180 | 687 | ||||||
| 2026-02-04 | 13F | Proem Advisors LLC | Put | 0 | -100,00 | 0 | -100,00 | |||
| 2026-01-27 | 13F | TD Waterhouse Canada Inc. | 1.700 | 64 | ||||||
| 2026-04-23 | 13F | Dupree Financial Group, LLC | 0 | -100,00 | 0 | -100,00 | ||||
| 2026-01-29 | 13F | IMC-Chicago, LLC | 772.063 | 23,27 | 29.161 | -0,80 | ||||
| 2026-02-17 | 13F | Parallax Volatility Advisers, L.P. | Put | 561.300 | -40,79 | 21.200 | -52,35 | |||
| 2026-02-27 | 13F | Strategic Investment Solutions, Inc. /IL | 317 | 12 | ||||||
| 2026-01-26 | 13F | Cwm, Llc | 4.340 | 23,16 | 0 | |||||
| 2026-02-11 | 13F | Deutsche Bank Ag\ | 9.847 | -16,12 | 372 | -32,55 | ||||
| 2026-02-13 | 13F | Acumen Wealth Advisors, LLC | 383 | 14 | ||||||
| 2026-02-13 | 13F | Mml Investors Services, Llc | 46.240 | 109,80 | 1.746 | 68,86 | ||||
| 2026-02-10 | 13F | KERR FINANCIAL PLANNING Corp | 116 | 43,21 | 5 | 33,33 | ||||
| 2026-02-17 | 13F | Janus Henderson Group Plc | 6.395 | 242 | ||||||
| 2026-04-16 | 13F | SG Americas Securities, LLC | 165.402 | 34,86 | 6 | 25,00 | ||||
| 2026-02-09 | 13F | Harbour Investments, Inc. | 3.831 | 145 | ||||||
| 2026-02-11 | 13F | Jpmorgan Chase & Co | 1.358.173 | 102,67 | 51.298 | 63,11 | ||||
| 2026-02-17 | 13F | DZ BANK AG Deutsche Zentral Genossenschafts Bank, Frankfurt am Main | 0 | -100,00 | 0 | |||||
| 2026-02-23 | 13F | Kera Capital Partners, Inc. | 4.426 | 238 | ||||||
| 2026-01-29 | 13F | UBS Group AG | Call | 2.299.960 | 86.869 | |||||
| 2026-01-29 | 13F | Sanctuary Advisors, LLC | 46.224 | 282,17 | 1.746 | 207,76 | ||||
| 2026-01-29 | 13F | UBS Group AG | 3.170.287 | 14,56 | 119.742 | -7,80 | ||||
| 2026-02-06 | 13F | Pnc Financial Services Group, Inc. | 200 | -6,98 | 8 | -30,00 | ||||
| 2026-02-13 | 13F | Morgan Stanley | 7.351.083 | 63,01 | 277.650 | 31,19 | ||||
| 2026-02-17 | 13F | EFG International AG | 7.615 | 288 | ||||||
| 2026-02-17 | 13F | Shaolin Capital Management LLC | Put | 750.000 | 28.328 | |||||
| 2026-02-17 | 13F | Private Advisor Group, LLC | 961.986 | 23,07 | 36.334 | -0,95 | ||||
| 2026-02-17 | 13F | Philadelphia Financial Management of San Francisco, LLC | Put | 300.000 | 11.331 | |||||
| 2026-02-19 | 13F/A | Axxcess Wealth Management, Llc | 16.462 | 622 | ||||||
| 2026-02-17 | 13F | SummitTX Capital, L.P. | 0 | -100,00 | 0 | |||||
| 2025-11-14 | 13F | Lighthouse Investment Partners, LLC | 0 | -100,00 | 0 | -100,00 | ||||
| 2026-04-06 | 13F | GAMMA Investing LLC | 249 | 0,00 | 9 | -11,11 | ||||
| 2026-02-03 | 13F | SBI Securities Co., Ltd. | 72.072 | 3,31 | 2.722 | -16,83 | ||||
| 2026-02-13 | 13F | Timelo Investment Management Inc. | 44.000 | -65,35 | 1.662 | -72,13 | ||||
| 2026-02-10 | 13F | Nomura Asset Management Co Ltd | 0 | 0 | ||||||
| 2026-02-17 | 13F | Balyasny Asset Management Llc | Put | 97.200 | -82,33 | 3.671 | -85,78 | |||
| 2026-02-17 | 13F | Balyasny Asset Management Llc | 492.644 | 6.691,34 | 18.607 | 5.372,65 | ||||
| 2026-02-17 | 13F | Prelude Capital Management, Llc | 0 | -100,00 | 0 | |||||
| 2026-02-17 | 13F | Balyasny Asset Management Llc | Call | 1.361.400 | -3,82 | 51.420 | -22,59 | |||
| 2026-02-11 | 13F | Mirae Asset Securities (usa) Inc. | Put | 4.284.564 | 272,57 | 59.167 | 9,63 | |||
| 2026-02-12 | 13F | Principal Securities, Inc. | 0 | -100,00 | 0 | |||||
| 2026-02-13 | 13F | Citigroup Inc | 9.878.625 | 53,69 | 373.116 | 23,69 | ||||
| 2026-02-17 | 13F | Susquehanna International Group, Llp | Call | 16.286.300 | 3,62 | 615.134 | -16,61 | |||
| 2026-02-13 | 13F | Stifel Financial Corp | 36.302 | 78,93 | 1.371 | 44,01 | ||||
| 2026-02-13 | 13F | Citigroup Inc | Call | 376.800 | 423,33 | 14.232 | 321,28 | |||
| 2026-02-17 | 13F | Susquehanna International Group, Llp | 825.420 | -55,57 | 31.176 | -64,24 | ||||
| 2026-02-17 | 13F | Susquehanna International Group, Llp | Put | 16.248.400 | -3,39 | 613.702 | -22,24 | |||
| 2026-03-24 | 13F | Armis Advisers, LLC | 100.075 | 4.132 | ||||||
| 2026-02-12 | 13F | Bank Of Montreal /can/ | Put | 660.700 | 2.017,63 | 24.955 | 1.604,51 | |||
| 2026-04-08 | 13F | Wealth Enhancement Advisory Services, Llc | 125.985 | 11,61 | 4.381 | -15,48 | ||||
| 2026-01-21 | 13F | Sound Income Strategies, LLC | 257 | 15 | ||||||
| 2026-02-12 | 13F | Bank Of Montreal /can/ | Call | 24.000 | 906 | |||||
| 2026-02-12 | 13F | Bank Of Montreal /can/ | 1.154.529 | 777,05 | 43.607 | 605,94 | ||||
| 2026-02-10 | 13F | Td Asset Management Inc | 56.531 | 2.135 | ||||||
| 2026-04-20 | 13F | Kercheville Advisors, LLC | 0 | -100,00 | 0 | -100,00 | ||||
| 2026-04-09 | 13F | Secure Asset Management, LLC | 73.667 | 106,77 | 2.525 | 87,73 | ||||
| 2026-04-09 | 13F | Secure Asset Management, LLC | Call | 300 | -70,00 | 5 | -86,49 | |||
| 2026-01-23 | 13F | Portman Square Capital LLP | Put | 0 | -100,00 | 0 | ||||
| 2026-02-17 | 13F | Vennlight Capital Management, LP | Call | 16.000 | 604 | |||||
| 2025-11-12 | 13F | Napa Wealth Management | 17.870 | 839 | ||||||
| 2026-02-13 | 13F | Pathstone Holdings, LLC | 13.528 | 50,31 | 511 | 20,85 | ||||
| 2026-02-17 | 13F/A | BlueCrest Capital Management Ltd | 20.000 | 939 | ||||||
| 2026-02-17 | 13F | Vennlight Capital Management, LP | 52.749 | 1.992 | ||||||
| 2026-02-17 | 13F | Diker Management Llc | 40.000 | 1.511 | ||||||
| 2026-02-17 | 13F | Russell Investments Group, Ltd. | 68 | 3 | ||||||
| 2026-04-10 | 13F | Benin Management CORP | 0 | -100,00 | 0 | |||||
| 2025-11-14 | 13F | Manatuck Hill Partners, LLC | 0 | -100,00 | 0 | |||||
| 2026-02-06 | 13F | JW Asset Management, LLC | 164.650 | 6.219 | ||||||
| 2026-04-06 | 13F | Highline Wealth Partners Llc | 29 | 1 | ||||||
| 2026-01-21 | 13F | Flagship Harbor Advisors, Llc | 15 | 1 | ||||||
| 2026-02-09 | 13F | Legal & General Group Plc | 493.776 | 18.650 | ||||||
| 2026-02-17 | 13F | Nomura Holdings Inc | 161.504 | 140,63 | 6.100 | 93,71 | ||||
| 2026-02-17 | 13F | Nomura Holdings Inc | Call | 206.700 | 726,80 | 7.807 | 565,56 | |||
| 2026-02-17 | 13F | Nomura Holdings Inc | Put | 990.200 | 890,20 | 37.400 | 696,91 | |||
| 2026-01-07 | 13F | Sandbox Financial Partners, LLC | 0 | -100,00 | 0 | -100,00 | ||||
| 2026-02-12 | 13F | StoneX Group Inc. | 26.319 | 245,17 | 1.060 | 196,92 | ||||
| 2026-02-13 | 13F | Banco Santander, S.A. | 45.495 | 1.718 | ||||||
| 2026-02-17 | 13F | LMR Partners LLP | 100.213 | 0,06 | 3.785 | -19,47 | ||||
| 2026-02-12 | 13F | Marex Group plc | 4.471.263 | 36.456,81 | 168.880 | 29.321,43 | ||||
| 2026-02-17 | 13F | LMR Partners LLP | Call | 100.000 | 3.777 | |||||
| 2025-10-31 | 13F | Investment House Llc | 0 | -100,00 | 0 | |||||
| 2026-02-17 | 13F | Mercer Global Advisors Inc /adv | 17.926 | 52,07 | 681 | 22,97 | ||||
| 2026-04-06 | 13F | Versant Capital Management, Inc | 2.192 | 75 | ||||||
| 2025-11-14 | 13F | Wolverine Trading, Llc | 158.642 | 95,42 | 7.286 | 541,37 | ||||
| 2026-04-17 | 13F | Roxbury Financial LLC | 22 | 0,00 | 1 | |||||
| 2025-11-14 | 13F | Wolverine Trading, Llc | Call | 3.665.400 | 137,75 | 168.352 | 680,02 | |||
| 2026-01-23 | 13F | Avion Wealth | 585 | 0 | ||||||
| 2026-02-19 | 13F | Invesco Ltd. | 2.049.095 | -23,82 | 77.394 | -38,69 | ||||
| 2026-02-17 | 13F | Sphera Management Technology Funds Ltd | 0 | -100,00 | 0 | |||||
| 2026-02-17 | 13F | Raymond James Financial Inc | 0 | -100,00 | 0 | |||||
| 2026-01-20 | 13F | Stratos Wealth Advisors, LLC | 43.377 | 63,07 | 1.638 | 31,25 | ||||
| 2026-02-02 | 13F | Wolverine Asset Management Llc | 3.075.552 | 116.164 | ||||||
| 2026-03-12 | 13F/A | Peak6 Llc | Put | 574.300 | -55,11 | 21.691 | -63,87 | |||
| 2026-02-17 | 13F | Gillson Capital LP | 0 | -100,00 | 0 | |||||
| 2026-04-15 | 13F | Valley National Advisers Inc | 100 | 0,00 | 0 | |||||
| 2025-10-28 | 13F | Pinnacle Financial Partners Inc | 4.549 | 213 | ||||||
| 2026-04-17 | 13F | AdvisorNet Financial, Inc | 123 | 4 | ||||||
| 2026-02-17 | 13F | Man Group plc | Call | 102.500 | 3.871 | |||||
| 2026-01-26 | 13F | Roman Butler Fullerton & Co | 0 | -100,00 | 0 | |||||
| 2026-02-17 | 13F | Man Group plc | 370.278 | -38,58 | 13.985 | -50,57 | ||||
| 2026-01-30 | 13F | Levin Capital Strategies, L.p. | Call | 0 | -100,00 | 0 | ||||
| 2026-02-12 | 13F | Federation des caisses Desjardins du Quebec | 18.636 | 442,53 | 704 | 336,65 | ||||
| 2026-02-17 | 13F | Artia Global Partners LP | 0 | -100,00 | 0 | |||||
| 2026-04-16 | 13F | Trium Capital LLP | 600 | 21 | ||||||
| 2026-01-27 | 13F | Belpointe Asset Management LLC | 20.490 | -20,87 | 774 | -36,38 | ||||
| 2026-04-21 | 13F | Encompass Wealth Advisors, Llc | 7.191 | -9,44 | 247 | -17,73 | ||||
| 2026-04-24 | 13F | IFM Investors Pty Ltd | 68.583 | 2.351 | ||||||
| 2026-02-09 | 13F | Hartline Investment Corp/ | 0 | -100,00 | 0 | |||||
| 2026-03-20 | 13F | Purpose Unlimited Inc. | 900 | 34 | ||||||
| 2026-02-17 | 13F | Snowden Capital Advisors LLC | 17.000 | 642 | ||||||
| 2026-03-12 | 13F/A | Peak6 Llc | Call | 553.500 | 86,55 | 20.906 | 50,14 | |||
| 2026-01-20 | 13F/A | Miller Wealth Advisors, Llc | 680 | 240,00 | 26 | 177,78 | ||||
| 2026-01-29 | 13F | Calamos Advisors LLC | 0 | -100,00 | 0 | |||||
| 2026-04-22 | 13F | Smallwood Wealth Investment Management, LLC | 28 | 0,00 | 1 | -100,00 | ||||
| 2026-02-09 | 13F | Geode Capital Management, Llc | 514.701 | -5,97 | 19.440 | -24,32 | ||||
| 2026-02-09 | 13F | Jefferies Financial Group Inc. | Put | 7.548.900 | -28,33 | 285.122 | -42,32 | |||
| 2025-10-28 | 13F | CarsonAllaria Wealth Management, Ltd. | 0 | -100,00 | 0 | |||||
| 2026-02-09 | 13F | Jefferies Financial Group Inc. | Call | 8.012.100 | 11,44 | 302.617 | -10,31 | |||
| 2026-02-09 | 13F | Jefferies Financial Group Inc. | 704.415 | -78,73 | 26.606 | -82,88 | ||||
| 2026-04-02 | 13F | Ares Financial Consulting, LLC | 120 | 4 | ||||||
| 2026-04-13 | 13F | Creative Financial Designs Inc /adv | 1.647 | 6,46 | 56 | -3,45 | ||||
| 2026-04-13 | 13F | Artemis Investment Management LLP | 0 | -100,00 | 0 | -100,00 | ||||
| 2026-01-29 | 13F | Sava Infond d.o.o. | 5.000 | -47,37 | 189 | -57,75 | ||||
| 2026-02-17 | 13F | Cantor Fitzgerald, L. P. | Put | 5.025.000 | 189.794 | |||||
| 2026-02-10 | 13F | Peapack Gladstone Financial Corp | 27.900 | 15,29 | 1 | 0,00 | ||||
| 2026-02-17 | 13F | Cresset Asset Management, LLC | Call | 0 | -100,00 | 0 | -100,00 | |||
| 2026-02-10 | 13F | Bank of New York Mellon Corp | 21.035 | 113,81 | 794 | 72,23 | ||||
| 2026-02-10 | 13F | Meitav Dash Investments Ltd | 328.600 | 2,69 | 12.416 | -17,10 | ||||
| 2026-02-17 | 13F | SageView Advisory Group, LLC | 4.420 | -76,20 | 167 | -80,94 | ||||
| 2026-04-23 | 13F | Game Plan Financial Advisors, LLC | 68 | 2 | ||||||
| 2025-11-14 | 13F | Beryl Capital Management LLC | 0 | -100,00 | 0 | -100,00 | ||||
| 2026-01-14 | 13F | ORG Wealth Partners, LLC | 319 | 12 | ||||||
| 2026-02-10 | 13F | Skaana Management L.P. | Call | 0 | -100,00 | 0 | -100,00 | |||
| 2026-02-12 | 13F | Richmond Investment Services, LLC | 23.713 | -33,80 | 896 | -46,76 | ||||
| 2026-02-02 | 13F | Pittenger & Anderson Inc | 100 | 0,00 | 4 | -25,00 | ||||
| 2026-02-11 | 13F | Situational Awareness LP | 8.700.621 | 20,50 | 328.622 | -3,02 | ||||
| 2026-02-09 | 13F | Darden Wealth Group Inc | 7.776 | 294 | ||||||
| 2026-04-10 | 13F | DKM Wealth Management, Inc. | 7.297 | 0,83 | 250 | -8,42 | ||||
| 2026-04-22 | 13F | Atlantic Edge Private Wealth Management, LLC | 100 | 3 | ||||||
| 2026-02-17 | 13F | Arrington Capital Management, LLC | Call | 17.500 | 661 | |||||
| 2026-02-17 | 13F | Altshuler Shaham Ltd | 260 | 4.638 | -16,31 | |||||
| 2026-04-22 | 13F | Motco | 0 | -100,00 | 0 | |||||
| 2026-02-05 | 13F | Sherman Asset Management, Inc. | 1.248 | 0,00 | 47 | -18,97 | ||||
| 2026-01-21 | 13F | Albion Financial Group /ut | 1.000 | 38 | ||||||
| 2026-02-17 | 13F | Cantor Fitzgerald, L. P. | 3.469.904 | 2.442,41 | 131.058 | 1.946,18 | ||||
| 2026-02-17 | 13F | No Street GP LP | Put | 0 | -100,00 | 0 | ||||
| 2026-02-12 | 13F | Penserra Capital Management LLC | 0 | -100,00 | 0 | -100,00 | ||||
| 2026-04-16 | 13F | Toth Financial Advisory Corp | 50 | 2 | ||||||
| 2026-02-05 | 13F | Phoenix Holdings Ltd. | 10.861 | -0,89 | 410 | -20,43 | ||||
| 2026-02-13 | 13F | Kilter Group LLC | 51 | -12,07 | 2 | -50,00 | ||||
| 2025-11-14 | 13F | Thomist Capital Management, LP | 0 | -100,00 | 0 | |||||
| 2026-02-10 | 13F | Skaana Management L.P. | Put | 21.000 | 40,00 | 793 | 12,80 | |||
| 2026-02-17 | 13F | Kultura Capital Management LP | Call | 5.800 | 219 | |||||
| 2026-01-06 | 13F | Arlington Capital Management, Inc. | 6.167 | -91,90 | 233 | -93,51 | ||||
| 2026-02-17 | 13F | Scientech Research LLC | 0 | -100,00 | 0 | |||||
| 2026-02-17 | 13F | Two Sigma Advisers, Lp | 0 | -100,00 | 0 | -100,00 | ||||
| 2026-02-17 | 13F | Fred Alger Management, Llc | 12.937 | 489 | ||||||
| 2026-02-17 | 13F | Ardmore Road Asset Management LP | 25.000 | 944 | ||||||
| 2026-02-11 | 13F | BIT Capital GmbH | 6.941.992 | 19,81 | 262.199 | -3,58 | ||||
| 2026-04-21 | 13F | Maridea Wealth Management LLC | 288.209 | 3,28 | 9.880 | -6,26 | ||||
| 2026-02-13 | 13F | Colony Group, LLC | 27.979 | 1.057 | ||||||
| 2026-04-17 | 13F | Vermillion Wealth Management, Inc. | 2.049 | 19,06 | 70 | 7,69 | ||||
| 2026-01-22 | 13F | Westbourne Investments, Inc. | 0 | -100,00 | 0 | |||||
| 2026-02-11 | 13F | BIT Capital GmbH | Call | 137.500 | -11,29 | 5.193 | -28,61 | |||
| 2026-02-17 | 13F | Amundi | 21.310 | 805 | ||||||
| 2026-02-12 | 13F | Jane Street Group, Llc | Put | 9.644.100 | 11,80 | 364.258 | -10,02 | |||
| 2025-11-14 | 13F | Wolverine Trading, Llc | Put | 1.916.600 | 113,62 | 88.029 | 600,87 | |||
| 2026-02-12 | 13F | Jane Street Group, Llc | Call | 17.330.300 | 43,76 | 654.565 | 15,70 | |||
| 2026-02-12 | 13F | Ensign Peak Advisors, Inc | 46.730 | 1.765 | ||||||
| 2026-02-12 | 13F | Jane Street Group, Llc | 5.593.971 | -52,23 | 211.284 | -61,55 | ||||
| 2025-11-14 | 13F | ExodusPoint Capital Management, LP | 14.254 | -67,15 | 669 | |||||
| 2026-02-10 | 13F | Skaana Management L.P. | 0 | -100,00 | 0 | -100,00 | ||||
| 2025-11-14 | 13F | Disciplined Investors, L.L.C. | 0 | -100,00 | 0 | |||||
| 2026-04-17 | 13F | Wealth Management Partners, LLC | 12.515 | -1,14 | 429 | -10,25 | ||||
| 2026-04-17 | 13F | United Advisor Group, LLC | Call | 80.000 | 2.742 | |||||
| 2026-04-24 | 13F | Vision Financial Markets Llc | 225 | 12,50 | 8 | 0,00 | ||||
| 2026-02-13 | 13F | Greenline Wealth Management LLC | 410 | 15 | ||||||
| 2026-02-09 | 13F | Hartland & Co., LLC | 1.803 | -34,44 | 68 | -47,29 | ||||
| 2025-11-14 | 13F | Polymer Capital Management (HK) LTD | Call | 0 | -100,00 | 0 | -100,00 | |||
| 2026-01-07 | 13F | Massmutual Trust Co Fsb/adv | 0 | -100,00 | 0 | -100,00 | ||||
| 2026-02-06 | 13F | Fortis Group Advisors, LLC | 13.690 | 736 | ||||||
| 2026-04-23 | 13F | North Star Investment Management Corp. | 500 | -28,57 | 17 | -34,62 | ||||
| 2026-02-17 | 13F | Millennium Management Llc | Put | 210.100 | -58,06 | 7.935 | -66,25 | |||
| 2026-01-22 | 13F | Advantage Alpha Capital Partners LP | 0 | -100,00 | 0 | |||||
| 2026-02-17 | 13F | Millennium Management Llc | 1.021.721 | 19,33 | 38.590 | -3,96 | ||||
| 2026-01-27 | 13F | Cushing Asset Management, Lp | 153.000 | 5.779 | ||||||
| 2026-01-23 | 13F | Legacy Bridge, LLC | 1.350 | 51 | ||||||
| 2026-02-13 | 13F | Alpine Fox Capital LLC | 750.461 | 0,00 | 28.345 | -19,52 | ||||
| 2026-02-17 | 13F | Elequin Capital Lp | 2.030 | 77 | ||||||
| 2026-02-17 | 13F | Susquehanna Portfolio Strategies, LLC | 318.123 | 0,00 | 12.016 | -19,52 | ||||
| 2025-11-12 | 13F | Accredited Wealth Management, LLC | 0 | -100,00 | 0 | |||||
| 2026-02-06 | 13F | Global Retirement Partners, LLC | 4.680 | 768,27 | 177 | 604,00 | ||||
| 2026-04-10 | 13F | Armstrong Advisory Group, Inc | 247 | -54,84 | 8 | -60,00 | ||||
| 2026-02-09 | 13F | Annis Gardner Whiting Capital Advisors, LLC | 500 | 42,86 | 19 | 12,50 | ||||
| 2026-02-17 | 13F | Bank Of America Corp /de/ | Call | 0 | -100,00 | 0 | -100,00 | |||
| 2026-02-13 | 13F | Diametric Capital, LP | 20.119 | 760 | ||||||
| 2026-02-13 | 13F | JustInvest LLC | 24.048 | 7,39 | 908 | -13,52 | ||||
| 2026-02-13 | 13F | FirstWave Capital Management LLC | 160.884 | 6.077 | ||||||
| 2026-01-21 | 13F | Raleigh Capital Management Inc. | 100 | 4 | ||||||
| 2026-02-13 | 13F | Absolute Gestao de Investimentos Ltda. | 8.165 | 308 | ||||||
| 2026-02-17 | 13F | Qube Research & Technologies Ltd | 1.490.237 | 56.286 | ||||||
| 2026-01-06 | 13F | Penbrook Management LLC | 0 | -100,00 | 0 | -100,00 | ||||
| 2026-02-05 | 13F | Allworth Financial LP | 10.595 | -23,58 | 400 | -38,46 | ||||
| 2026-02-17 | 13F | Tricadia Capital Management, LLC | 0 | -100,00 | 0 | |||||
| 2026-02-13 | 13F | Walleye Trading LLC | Call | 2.788.700 | 22,90 | 105.329 | -1,09 | |||
| 2026-04-17 | 13F | RFG Advisory, LLC | 5.946 | 204 | ||||||
| 2026-04-10 | 13F | Perigon Wealth Management, LLC | 9.419 | 323 | ||||||
| 2026-02-13 | 13F | Walleye Trading LLC | Put | 5.928.500 | -3,08 | 223.919 | -22,00 | |||
| 2026-02-17 | 13F | Palogic Value Management, L.P. | Call | 0 | -100,00 | 0 | ||||
| 2026-02-13 | 13F | Polymer Capital Management (HK) LTD | 14.020 | -88,15 | 530 | -90,48 | ||||
| 2026-02-12 | 13F | Grey Fox Wealth Advisors, LLC | 0 | -100,00 | 0 | -100,00 | ||||
| 2026-04-21 | 13F | Venturi Wealth Management, LLC | 6.439 | 221 | ||||||
| 2026-02-17 | 13F | Bank Of America Corp /de/ | 1.350.072 | 387,68 | 50.992 | 292,49 | ||||
| 2026-02-17 | 13F | Saba Capital Management, L.P. | 70.000 | 16,67 | 2.644 | -6,11 | ||||
| 2026-02-17 | 13F | Shaolin Capital Management LLC | 0 | -100,00 | 0 | |||||
| 2026-04-20 | 13F | Ronald Blue Trust, Inc. | 219 | 8 | ||||||
| 2026-02-12 | 13F | Cloud Capital Management, LLC | 0 | -100,00 | 0 | |||||
| 2026-01-22 | 13F | BOCHK Asset Management Ltd | 2.000 | 185,71 | 76 | 134,38 | ||||
| 2026-02-11 | 13F | Modus Advisors, LLC | 5.000 | 189 | ||||||
| 2026-02-06 | 13F | EverSource Wealth Advisors, LLC | 83 | 196,43 | 3 | 200,00 | ||||
| 2026-01-13 | 13F | Synergy Financial Management, LLC | 0 | -100,00 | 0 | |||||
| 2026-02-26 | 13F | Oak Grove Capital LLC | 59.250 | -8,64 | 2.238 | -26,49 | ||||
| 2025-11-13 | 13F | VSM Wealth Advisory, LLC | 0 | -100,00 | 0 | |||||
| 2026-04-07 | 13F | CoreCap Advisors, LLC | 35 | -82,50 | 1 | -85,71 | ||||
| 2026-04-15 | 13F | Activest Wealth Management | 7.495 | -25,92 | 257 | -32,98 | ||||
| 2026-02-12 | 13F | EAM Investors, LLC | 0 | -100,00 | 0 | -100,00 | ||||
| 2026-02-17 | 13F | Engineers Gate Manager LP | 10.653 | 402 | ||||||
| 2026-02-18 | 13F | Galaxy Group Investments LLC | Put | 0 | -100,00 | 0 | ||||
| 2026-02-17 | 13F | Caption Management, LLC | Put | 1.270.700 | -6,91 | 47.994 | -25,08 | |||
| 2026-02-12 | 13F | Sprott Inc. | 6.010 | 0,00 | 227 | -19,86 | ||||
| 2026-02-17 | 13F | Caption Management, LLC | Call | 1.462.200 | 56,42 | 55.227 | 25,89 | |||
| 2026-02-13 | 13F | Marshall Wace, Llp | Put | 861.500 | 32.539 | |||||
| 2026-02-13 | 13F | Partners Capital Investment Group, Llp | 11.000 | -31,25 | 415 | -44,67 | ||||
| 2026-02-13 | 13F | Marshall Wace, Llp | 1.308.065 | 49.406 | ||||||
| 2026-02-13 | 13F | Van Eck Associates Corp | 968.335 | 44,79 | 37 | 16,13 | ||||
| 2026-02-17 | 13F | Caption Management, LLC | 277.860 | -36,55 | 10.495 | -48,94 | ||||
| 2026-02-17 | 13F | Lazard Asset Management Llc | Put | 104.000 | 3.928 | |||||
| 2026-02-05 | 13F | Qsemble Capital Management, LP | 17.890 | 676 | ||||||
| 2026-02-10 | 13F | Clear Harbor Asset Management, LLC | 11.130 | -25,80 | 420 | -40,26 | ||||
| 2026-02-17 | 13F | Lazard Asset Management Llc | 5.258 | 199 | ||||||
| 2026-02-17 | 13F | Lazard Asset Management Llc | Call | 150.000 | 5.666 | |||||
| 2025-11-14 | 13F | Two Seas Capital LP | 0 | -100,00 | 0 | |||||
| 2026-04-23 | 13F | Asset Planning,Inc | 0 | -100,00 | 0 | -100,00 | ||||
| 2026-02-12 | 13F | Ci Investments Inc. | 0 | -100,00 | 0 | |||||
| 2026-01-29 | 13F | MWA Asset Management | 0 | -100,00 | 0 | -100,00 | ||||
| 2026-02-13 | 13F | MAI Capital Management | 220 | 10,00 | 8 | -11,11 | ||||
| 2026-02-17 | 13F | Palogic Value Management, L.P. | Put | 7.000 | 264 | |||||
| 2026-04-15 | 13F | Financial Management Professionals, Inc. | 200 | 0,00 | 7 | -14,29 | ||||
| 2026-02-12 | 13F | Steward Partners Investment Advisory, Llc | 21.613 | 11,12 | 816 | -10,53 | ||||
| 2026-02-17 | 13F | Numerai GP LLC | 9.716 | -52,57 | 367 | -61,91 | ||||
| 2026-02-12 | 13F | Mark Sheptoff Financial Planning, Llc | 1.600 | -15,79 | 60 | -32,58 | ||||
| 2026-02-11 | 13F | Strategy Asset Managers Llc | 0 | -100,00 | 0 | |||||
| 2025-11-14 | 13F | Walleye Trading LLC | 0 | -100,00 | 0 | -100,00 | ||||
| 2026-02-17 | 13F | Bulltick Wealth Management, LLC | 20.000 | 755 | ||||||
| 2026-02-17 | 13F | Boothbay Fund Management, Llc | Put | 0 | -100,00 | 0 | ||||
| 2026-02-17 | 13F | BlueCrest Capital Management Ltd | Put | 23.000 | 869 | |||||
| 2026-04-20 | 13F | Kestra Private Wealth Services, Llc | 23.437 | 104,69 | 803 | 85,88 | ||||
| 2026-02-09 | 13F | William Blair Investment Management, Llc | 12.751 | 482 | ||||||
| 2026-02-12 | 13F | New York State Common Retirement Fund | 0 | -100,00 | 0 | -100,00 | ||||
| 2026-02-13 | 13F | Siren, L.L.C. | 43.100 | 115,50 | 1.628 | 73,45 | ||||
| 2026-02-17 | 13F | Boothbay Fund Management, Llc | 0 | -100,00 | 0 | |||||
| 2026-02-12 | 13F | Hrt Financial Lp | 0 | -100,00 | 0 | |||||
| 2026-04-22 | 13F | Continuum Advisory, LLC | 29.965 | -33,11 | 1.027 | -39,27 | ||||
| 2026-02-13 | 13F | Cornerstone Financial Management LLC | 331 | 13 | ||||||
| 2026-02-17 | 13F | Ninepoint Partners LP | 11.306 | 427 | ||||||
| 2026-02-04 | 13F | Meridian Wealth Management, LLC | 95.182 | 49,15 | 3.595 | 20,07 | ||||
| 2026-02-17 | 13F | Ameriprise Financial Inc | 155.621 | 63,40 | 5.878 | 30,28 | ||||
| 2026-02-17 | 13F | Tudor Investment Corp Et Al | Put | 511.500 | -6,18 | 19.319 | -24,49 | |||
| 2026-02-13 | 13F | Golden State Wealth Management, LLC | 781 | 11,57 | 29 | -9,37 | ||||
| 2026-02-17 | 13F | Creative Planning | 20.599 | 41,24 | 778 | 13,74 | ||||
| 2026-02-17 | 13F | Tudor Investment Corp Et Al | Call | 615.200 | 9,35 | 23.236 | -11,99 | |||
| 2026-02-05 | 13F | Mount Lucas Management LP | Call | 100.000 | 3.777 | |||||
| 2026-02-12 | 13F | Peterson Wealth Services | 17.417 | 9.417,49 | 658 | 4.280,00 | ||||
| 2026-02-17 | 13F | Gladstone Institutional Advisory LLC | 30.484 | -9,32 | 1.151 | -27,01 | ||||
| 2026-02-11 | 13F | LPL Financial LLC | 393.867 | 39,59 | 14.876 | 12,34 | ||||
| 2026-02-12 | 13F | BlackRock, Inc. | 632.268 | -28,80 | 23.881 | -42,70 | ||||
| 2026-02-17 | 13F | XTX Topco Ltd | 39.586 | 792,98 | 1.495 | 618,75 | ||||
| 2026-02-13 | 13F | Verition Fund Management LLC | 8.079 | 61,58 | 305 | 30,34 | ||||
| 2026-02-02 | 13F | Truist Financial Corp | 53.819 | 3,97 | 2.033 | -16,34 | ||||
| 2026-02-17 | 13F | TCG Advisory Services, LLC | Call | 0 | -100,00 | 0 | ||||
| 2026-02-17 | 13F | TCG Advisory Services, LLC | 0 | -100,00 | 0 | |||||
| 2026-02-17 | 13F | Advisory Services Network, LLC | 28.694 | 10,91 | 1.084 | -10,79 | ||||
| 2026-02-13 | 13F | Headlands Technologies LLC | 0 | -100,00 | 0 | |||||
| 2025-10-28 | 13F | Wolverine Asset Management Llc | Call | 0 | -100,00 | 0 | -100,00 | |||
| 2026-02-13 | 13F | Brown Advisory Inc | 0 | -100,00 | 0 | |||||
| 2026-02-05 | 13F | Soltis Investment Advisors LLC | 0 | -100,00 | 0 | |||||
| 2026-02-10 | 13F | Bnp Paribas Arbitrage, Sa | 4.201.138 | 158.677 | ||||||
| 2026-02-10 | 13F | Acadian Asset Management Llc | 2.743 | 0 | ||||||
| 2026-02-11 | 13F | Allianz Asset Management GmbH | 22.600 | -27,80 | 854 | -41,89 | ||||
| 2026-02-17 | 13F | Credit Agricole S A | 19.200 | 725 | ||||||
| 2026-04-22 | 13F | Spire Wealth Management | 9.523 | 10,03 | 326 | 0,00 | ||||
| 2026-02-03 | 13F | Morse Asset Management, Inc | 78.877 | 7,11 | 2.979 | -13,80 | ||||
| 2026-02-13 | 13F | Barclays Plc | Put | 97.600 | -73,88 | 3.686 | -78,98 | |||
| 2026-02-17 | 13F | Torno Capital, Llc | Call | 77.900 | 0,00 | 2.942 | -19,51 | |||
| 2026-02-13 | 13F | Neuberger Berman Group LLC | 1.964.922 | 2.050,77 | 74.215 | 1.631,16 | ||||
| 2026-02-17 | 13F | Torno Capital, Llc | Put | 80.000 | 0,00 | 3.022 | -19,53 | |||
| 2026-02-17 | 13F | Torno Capital, Llc | 16.600 | 18,57 | 627 | -4,72 | ||||
| 2025-11-14 | 13F | Strategic Wealth Partners, Ltd. | 10 | 0 | ||||||
| 2026-04-16 | 13F | Diversified Trust Co | 16.806 | 0,04 | 576 | -9,15 | ||||
| 2026-02-17 | 13F | Strive Financial Group ,LLC | 175 | 7 | ||||||
| 2026-04-14 | 13F | Tradewinds Capital Management, LLC | 25 | 1 | ||||||
| 2026-02-13 | 13F | Arrowstreet Capital, Limited Partnership | 0 | -100,00 | 0 | |||||
| 2026-04-14 | 13F | Kozak & Associates, Inc. | 450 | 200,00 | 19 | 216,67 | ||||
| 2026-04-22 | 13F | Pictet Asset Management Holding SA | 127.835 | 349,32 | 4.379 | 307,73 | ||||
| 2026-01-29 | 13F | Concord Wealth Partners | 4 | 0 | ||||||
| 2026-02-17 | 13F | Summit Partners Public Asset Management, Llc | Put | 0 | -100,00 | 0 | ||||
| 2026-04-07 | 13F | Farther Finance Advisors, LLC | 65.115 | -1,29 | 2.220 | -10,92 | ||||
| 2026-02-17 | 13F | Point72 Asset Management, L.P. | Call | 674.800 | 587,17 | 25.487 | 453,10 | |||
| 2026-04-17 | 13F | CENTRAL TRUST Co | 1.485 | 19,76 | 51 | 8,70 | ||||
| 2026-02-17 | 13F | Point72 Asset Management, L.P. | Put | 822.400 | -4,54 | 31.062 | -23,17 | |||
| 2026-02-17 | 13F | Lakewood Capital Management, Lp | Put | 20.000 | 0,00 | 755 | -19,51 | |||
| 2026-01-23 | 13F | Optima Capital Llc | 40 | 2 | ||||||
| 2026-02-03 | 13F | International Assets Investment Management, Llc | 24.864 | 939 | ||||||
| 2026-02-17 | 13F | Two Sigma Investments, Lp | 262.556 | -94,90 | 9.917 | -95,89 | ||||
| 2026-02-17 | 13F | Fwl Investment Management, Llc | 237.859 | -0,87 | 8.984 | -20,22 | ||||
| 2025-11-12 | 13F | DnB Asset Management AS | 0 | -100,00 | 0 | |||||
| 2026-01-14 | 13F | ORG Partners LLC | 0 | -100,00 | 0 | |||||
| 2026-02-05 | 13F | Western Wealth Management, LLC | 5.519 | 208 | ||||||
| 2026-02-10 | 13F | Rothschild Investment Llc | 20 | 0,00 | 1 | |||||
| 2026-04-14 | 13F | Opal Wealth Advisors, LLC | 7.795 | 267 | ||||||
| 2026-02-17 | 13F | TENOR CAPITAL MANAGEMENT Co., L.P. | 0 | -100,00 | 0 | |||||
| 2026-02-03 | 13F | Strengthening Families & Communities, LLC | 2.247 | 85 | ||||||
| 2026-02-17 | 13F | Css Llc/il | Put | 20.000 | 33,33 | 755 | 7,40 | |||
| 2026-02-13 | 13F | Pine Valley Investments Ltd Liability Co | 26.747 | 1.010 | ||||||
| 2026-02-17 | 13F | Tower Research Capital LLC (TRC) | 4.758 | -59,67 | 180 | -67,63 | ||||
| 2026-02-13 | 13F | LM Advisors LLC | 393 | -93,50 | 10 | |||||
| 2026-02-13 | 13F | Vontobel Holding Ltd. | Call | 15.500 | 585 | |||||
| 2026-04-24 | 13F | Sumitomo Mitsui DS Asset Management Company, Ltd | 38.860 | 1.332 | ||||||
| 2026-01-20 | 13F | Steel Peak Wealth Management LLC | 11.522 | 435 | ||||||
| 2026-02-13 | 13F | Vontobel Holding Ltd. | 22.418 | 77,92 | 847 | 43,15 | ||||
| 2026-02-13 | 13F | Barclays Plc | 465.337 | 1.441,62 | 17.576 | 1.141,17 | ||||
| 2026-02-13 | 13F | Barclays Plc | Call | 751.900 | 67,20 | 28.399 | 34,57 | |||
| 2026-02-13 | 13F | Vontobel Holding Ltd. | Put | 14.000 | 529 | |||||
| 2026-02-12 | 13F | Intrinsic Edge Capital Management LLC | Put | 100.000 | 3.777 | |||||
| 2026-02-18 | 13F | VGI Partners Ltd | 141.457 | -0,70 | 5.343 | -20,09 | ||||
| 2026-02-17 | 13F | Two Sigma Investments, Lp | Put | 30.000 | 0,00 | 1.133 | -19,47 | |||
| 2026-02-17 | 13F | Shay Capital LLC | Call | 0 | -100,00 | 0 | ||||
| 2026-01-16 | 13F | Crewe Advisors LLC | 6.350 | 0,00 | 240 | -19,80 | ||||
| 2026-02-13 | 13F | Bridgewater Associates, LP | 276.688 | 254,81 | 10.451 | 185,60 | ||||
| 2026-04-17 | 13F | HHM Wealth Advisors, LLC | 2.665 | 91 | ||||||
| 2026-02-12 | 13F | Wealthspire Advisors, LLC | 0 | -100,00 | 0 | |||||
| 2026-02-17 | 13F | BTG Pactual Asset Management US LLC | Call | 0 | -100,00 | 0 | ||||
| 2026-02-17 | 13F | BTG Pactual Asset Management US LLC | 0 | -100,00 | 0 | |||||
| 2026-02-12 | 13F | Advisors Asset Management, Inc. | 4.512 | -0,90 | 170 | -20,19 | ||||
| 2026-02-12 | 13F | Hollencrest Capital Management | 600 | -75,00 | 23 | -80,36 | ||||
| 2026-02-17 | 13F | Mirabella Financial Services Llp | 5.433 | 205 | ||||||
| 2026-02-12 | 13F | Hollencrest Capital Management | Call | 100 | -98,63 | 4 | -99,12 | |||
| 2026-02-13 | 13F | First Trust Advisors Lp | 80.158 | 22,50 | 3.028 | -1,40 | ||||
| 2026-01-12 | 13F | VisionPoint Advisory Group, LLC | 36.433 | -44,22 | 1.376 | -55,09 | ||||
| 2026-02-17 | 13F | Symmetry Peak Management Llc | Put | 0 | -100,00 | 0 | ||||
| 2026-02-13 | 13F | Sculptor Capital LP | 0 | -100,00 | 0 | -100,00 | ||||
| 2026-02-17 | 13F | Symmetry Peak Management Llc | Call | 0 | -100,00 | 0 | ||||
| 2026-02-12 | 13F | Scotia Capital Inc. | 76.931 | 18,56 | 2.906 | -4,60 | ||||
| 2026-02-17 | 13F | Quantitative Investment Management, LLC | 195.574 | 7 | ||||||
| 2026-02-17 | 13F | Jump Financial, LLC | 178.500 | 888,15 | 6.742 | 695,87 | ||||
| 2026-02-12 | 13F | Insigneo Advisory Services, Llc | 7.077 | 29,05 | 267 | 3,89 | ||||
| 2026-02-17 | 13F | D. E. Shaw & Co., Inc. | Call | 5.758.100 | 277,58 | 217.483 | 203,88 | |||
| 2026-02-03 | 13F | Chesapeake Capital Corp /il/ | 15.434 | 0,00 | 583 | -19,61 | ||||
| 2026-02-17 | 13F | D. E. Shaw & Co., Inc. | Put | 2.390.300 | 0,00 | 90.282 | -19,52 | |||
| 2026-04-06 | 13F | Washington Trust Advisors, Inc. | 8 | 0 | ||||||
| 2026-02-17 | 13F | D. E. Shaw & Co., Inc. | 11.684.671 | 9,03 | 441.330 | -12,25 | ||||
| 2026-02-10 | 13F | Goldman Sachs Group Inc | Call | 420.000 | 30,43 | 15.863 | 4,98 | |||
| 2026-02-10 | 13F | Goldman Sachs Group Inc | Put | 6.042.500 | 2.058,04 | 228.225 | 1.636,87 | |||
| 2026-04-17 | 13F | Bell Investment Advisors, Inc | 10 | 0 | ||||||
| 2026-02-10 | 13F | Goldman Sachs Group Inc | 7.362.595 | 233,11 | 278.085 | 168,09 | ||||
| 2026-04-13 | 13F | Mather Group, Llc. | 3.838 | 132 | ||||||
| 2026-02-05 | 13F | Atria Investments Llc | 0 | -100,00 | 0 | |||||
| 2026-02-17 | 13F | SIH Partners, LLLP | 57.884 | 22,56 | 2.186 | -1,35 | ||||
| 2025-11-17 | 13F | Alyeska Investment Group, L.P. | 0 | -100,00 | 0 | -100,00 | ||||
| 2026-02-18 | 13F | GWM Advisors LLC | 27.873 | 8,95 | 1.053 | -12,33 | ||||
| 2026-02-04 | 13F | Atlantic Union Bankshares Corp | 554 | 89,73 | 21 | 53,85 | ||||
| 2026-02-03 | 13F | Mitsubishi UFJ Kokusai Asset Management Co., Ltd. | 31.769 | 27,03 | 1.357 | 15,60 | ||||
| 2026-04-23 | 13F | SJS Investment Consulting Inc. | 90 | 3 | ||||||
| 2026-04-10 | 13F | Abound Wealth Management | 201 | 0,00 | 7 | -14,29 | ||||
| 2026-02-12 | 13F | Commonwealth Equity Services, Llc | 115.553 | 39,32 | 4.364 | 145.366,67 | ||||
| 2026-04-22 | 13F | Stone House Investment Management, LLC | 40 | 0,00 | 1 | 0,00 | ||||
| 2026-03-23 | 13F | Galaxy Digital Capital Management GP LLC | Put | 0 | -100,00 | 0 | -100,00 | |||
| 2026-02-20 | 13F | Sunbelt Securities, Inc. | 32.852 | 13.040,80 | 1.241 | 11.172,73 | ||||
| 2026-04-22 | 13F | Apollon Wealth Management, LLC | 26.621 | 65,10 | 913 | 49,75 | ||||
| 2026-04-15 | 13F | Compagnie Lombard Odier SCmA | 550 | 19 | ||||||
| 2026-04-09 | 13F | Teamwork Financial Advisors, LLC | 16.988 | 582 | ||||||
| 2026-01-22 | 13F | Fiduciary Planning LLC | 0 | -100,00 | 0 | |||||
| 2025-11-14 | 13F | Verity Asset Management, Inc. | 0 | -100,00 | 0 | -100,00 | ||||
| 2026-04-02 | 13F | Aspect Partners, LLC | 103 | 17,05 | 4 | 0,00 | ||||
| 2026-02-14 | 13F | Rockefeller Capital Management L.P. | 9.362 | -79,08 | 354 | -83,19 | ||||
| 2026-02-12 | 13F | EAM Global Investors LLC | 0 | -100,00 | 0 | -100,00 | ||||
| 2026-02-13 | 13F | Alkeon Capital Management Llc | 800.000 | -46,67 | 30.216 | -57,08 | ||||
| 2026-01-29 | 13F | Concurrent Investment Advisors, LLC | 17.743 | 103,83 | 670 | 64,22 | ||||
| 2026-02-05 | 13F | High Note Wealth, LLC | Call | 100 | 4 | |||||
| 2026-02-05 | 13F | High Note Wealth, LLC | 10 | 0 | ||||||
| 2026-01-07 | 13F | Aventura Private Wealth, LLC | 730 | 28 | ||||||
| 2025-11-14 | 13F | Shay Capital LLC | 0 | -100,00 | 0 | -100,00 | ||||
| 2026-02-09 | 13F | Avalon Trust Co | 3.950 | 61,22 | 149 | 30,70 | ||||
| 2026-02-13 | 13F | Mariner, LLC | 83.105 | 47,72 | 3.139 | 18,90 | ||||
| 2026-02-18 | 13F | Vident Advisory, LLC | 1.375.743 | 11,61 | 51.962 | -10,18 | ||||
| 2025-11-13 | 13F | K2 Principal Fund, L.p. | Call | 0 | -100,00 | 0 | ||||
| 2026-02-17 | 13F | Millennium Management Llc | Call | 0 | -100,00 | 0 | ||||
| 2026-01-26 | 13F | Mirae Asset Global Investments Co., Ltd. | 114.921 | 190,87 | 4.341 | 134,09 | ||||
| 2026-02-13 | 13F | Kestra Advisory Services, LLC | 0 | -100,00 | 0 | |||||
| 2025-11-14 | 13F | Quarry LP | 0 | -100,00 | 0 | |||||
| 2026-01-08 | 13F | Chesapeake Asset Management Llc | 255 | 0,00 | 10 | -18,18 | ||||
| 2026-02-17 | 13F | Eddie Patel Inc | 15.032 | 568 | ||||||
| 2026-01-21 | 13F | Newbridge Financial Services Group, Inc. | 200 | 0,00 | 8 | -22,22 | ||||
| 2026-02-13 | 13F | SRS Capital Advisors, Inc. | 979 | 306,22 | 37 | 227,27 | ||||
| 2026-04-22 | 13F | BluePath Capital Management, LLC | 42.332 | -0,74 | 1.451 | -9,88 | ||||
| 2026-02-11 | 13F | Capital Research Global Investors | 1.025.430 | 38.730 | ||||||
| 2026-02-17 | 13F | Citadel Advisors Llc | Put | 10.429.700 | -18,06 | 393.930 | -34,05 | |||
| 2026-04-21 | 13F | Avaii Wealth Management, Llc | 142.563 | -2,20 | 4.887 | -11,23 | ||||
| 2026-02-02 | 13F | Chung Wu Investment Group, LLC | 0 | -100,00 | 0 | -100,00 | ||||
| 2026-02-17 | 13F | Citadel Advisors Llc | 840.032 | -75,76 | 31.728 | -80,49 | ||||
| 2026-02-17 | 13F | Citadel Advisors Llc | Call | 11.360.400 | 25,89 | 429.082 | 1,32 | |||
| 2026-02-17 | 13F | Fmr Llc | 56 | -100,00 | 2 | -100,00 | ||||
| 2026-01-28 | 13F | Old National Bancorp /in/ | 0 | -100,00 | 0 | |||||
| 2026-02-06 | 13F | Bare Financial Services, Inc | 0 | -100,00 | 0 | |||||
| 2026-02-17 | 13F | Two Sigma Securities, Llc | 0 | -100,00 | 0 | |||||
| 2026-02-13 | 13F | PYA Waltman Capital, LLC | 0 | -100,00 | 0 | |||||
| 2026-01-12 | 13F | Evolution Wealth Advisors, LLC | 29.835 | 20,33 | 1.127 | -3,18 | ||||
| 2026-02-17 | 13F | Hood River Capital Management LLC | 58.634 | 105,73 | 2.215 | 65,59 | ||||
| 2026-02-05 | 13F | Central Asset Investments & Management Holdings (HK) Ltd | 0 | -100,00 | 0 | |||||
| 2026-02-17 | 13F | Capital Fund Management S.a. | Put | 1.074.600 | 29,00 | 40.588 | 3,82 | |||
| 2026-03-09 | 13F/A | CI Private Wealth, LLC | 5.830 | 220 | ||||||
| 2026-01-29 | 13F | Vanguard Group Inc | 10.182 | 385 | ||||||
| 2026-02-17 | 13F | Keebeck Wealth Management, LLC | 36.035 | 321,46 | 1.361 | 239,40 | ||||
| 2026-02-17 | 13F | Capital Fund Management S.a. | Call | 1.686.300 | 1,41 | 63.692 | -18,38 | |||
| 2025-11-14 | 13F | Merewether Investment Management, LP | 0 | -100,00 | 0 | -100,00 | ||||
| 2026-01-26 | 13F | PFG Investments, LLC | 7.096 | 268 | ||||||
| 2026-04-24 | 13F | FRG Family Wealth Advisors LLC | 8.532 | 49,11 | 292 | 35,19 | ||||
| 2026-02-18 | 13F | Mackenzie Financial Corp | 12.456 | 476 | ||||||
| 2026-02-13 | 13F | Sweeney & Michel, Llc | 0 | -100,00 | 0 | |||||
| 2026-02-17 | 13F | Feynman Point Asset Management LLC | 16.643 | 629 | ||||||
| 2026-02-03 | 13F | Privium Fund Management B.V. | 280.000 | 115,38 | 10.576 | 73,36 | ||||
| 2026-02-13 | 13F | Toroso Investments, LLC | Call | 97.600 | 3.686 | |||||
| 2026-02-13 | 13F | Centaurus Financial, Inc. | 6.714 | -78,67 | 0 | -100,00 | ||||
| 2026-02-13 | 13F | Toroso Investments, LLC | 1.667.419 | 1.126,57 | 62.978 | 887,27 | ||||
| 2026-04-13 | 13F | Gateway Investment Advisers Llc | 34.686 | 1.189 | ||||||
| 2026-02-03 | 13F | Wesbanco Bank Inc | 0 | -100,00 | 0 | -100,00 | ||||
| 2026-02-13 | 13F | Toroso Investments, LLC | Put | 1.257.800 | 1.123,54 | 47.507 | 884,81 | |||
| 2026-04-20 | 13F | Yorktown Management & Research Co Inc | 9.450 | 0,00 | 324 | -9,27 | ||||
| 2026-01-29 | 13F | Rakuten Securities, Inc. | 45.799 | 1.730 | ||||||
| 2026-02-12 | 13F | Marex Group plc | Call | 0 | -100,00 | 0 | -100,00 | |||
| 2026-03-23 | 13F | Galaxy Digital Capital Management GP LLC | 0 | 0 | ||||||
| 2026-01-07 | 13F | Procyon Private Wealth Partners, LLC | 6.757 | 255 | ||||||
| 2026-02-17 | 13F | Hidden Lake Asset Management LP | 0 | -100,00 | 0 | |||||
| 2026-01-20 | 13F | Stratos Wealth Partners, LTD. | 52.184 | 1.971 | ||||||
| 2026-02-17 | 13F | Trexquant Investment LP | 265.414 | 282,52 | 10.025 | 207,86 | ||||
| 2026-02-13 | 13F/A | Abound Financial, Llc | 155 | 6 | ||||||
| 2026-02-13 | 13F | OMERS ADMINISTRATION Corp | 6.300 | -81,95 | 238 | -85,52 | ||||
| 2026-04-17 | 13F | United Advisor Group, LLC | 40.189 | 1.378 | ||||||
| 2026-02-17 | 13F | Arosa Capital Management LP | Call | 850.000 | 104,82 | 32.104 | 64,85 | |||
| 2026-02-17 | 13F | Arosa Capital Management LP | 90.912 | 910,13 | 3.434 | 713,51 | ||||
| 2026-02-10 | 13F | Verus Capital Partners, Llc | 0 | -100,00 | 0 | |||||
| 2026-02-11 | 13F | Capital Analysts, Inc. | 1.200 | 0,00 | 0 | |||||
| 2026-02-17 | 13F | Royal Bank Of Canada | Call | 9.200 | 0,00 | 347 | -19,68 | |||
| 2026-02-13 | 13F | Verition Fund Management LLC | Put | 0 | -100,00 | 0 | -100,00 | |||
| 2026-02-17 | 13F | Royal Bank Of Canada | 361.562 | -6,59 | 13.657 | -24,82 | ||||
| 2026-02-11 | 13F | Empowered Funds, LLC | 39.140 | 1.478 | ||||||
| 2026-04-22 | 13F | Janney Montgomery Scott LLC | 16.872 | -26,41 | 1 | |||||
| 2026-02-09 | 13F | Texas Capital Bank Wealth Management Services Inc | 17.657 | 667 | ||||||
| 2026-02-17 | 13F | Bayesian Capital Management, LP | 6.100 | 230 | ||||||
| 2026-02-06 | 13F | CloudAlpha Capital Management Limited/Hong Kong | 133.500 | 101,45 | 5.042 | 62,17 | ||||
| 2026-01-20 | 13F | SOA Wealth Advisors, LLC. | 0 | -100,00 | 0 | |||||
| 2026-02-13 | 13F | Rafferty Asset Management, LLC | 5.026 | -40,04 | 190 | -51,91 | ||||
| 2026-02-17 | 13F | Nishkama Capital, LLC | 0 | -100,00 | 0 | |||||
| 2026-02-04 | 13F | Timonier Family Office, LTD. | 0 | -100,00 | 0 | |||||
| 2026-02-17 | 13F | Alphadyne Asset Management, LLC | 1.568 | 59 | ||||||
| 2026-04-10 | 13F | Quaker Wealth Management, LLC | 100 | 0,00 | 3 | 0,00 | ||||
| 2026-02-17 | 13F | Alphadyne Asset Management, LLC | Put | 19.000 | -31,41 | 718 | -44,80 | |||
| 2026-02-17 | 13F | Alphadyne Asset Management, LLC | Call | 22.400 | 846 | |||||
| 2026-01-23 | 13F | Diversify Advisory Services, LLC | 0 | -100,00 | 0 | |||||
| 2026-02-13 | 13F | Marathon Trading Investment Management LLC | 454.140 | 1.938,33 | 17.153 | 1.541,34 | ||||
| 2026-02-17 | 13F | Scoggin Management Lp | Put | 0 | -100,00 | 0 | ||||
| 2026-02-13 | 13F | Sassicaia Capital Advisers Llc | 0 | -100,00 | 0 | |||||
| 2026-02-06 | 13F/A | Rathbone Brothers plc | 19.988 | 73,25 | 755 | 39,37 | ||||
| 2026-01-26 | 13F | Lionsbridge Wealth Management LLC | 9.794 | -29,92 | 370 | -43,66 | ||||
| 2026-02-13 | 13F | Capula Management Ltd | 6.174 | 233 | ||||||
| 2026-02-17 | 13F | Graham Capital Management, L.P. | 242.729 | 9.168 | ||||||
| 2026-02-06 | 13F | Addison Advisors LLC | 28 | 1 | ||||||
| 2026-01-16 | 13F | Matauro, Llc | 0 | -100,00 | 0 | -100,00 | ||||
| 2026-02-17 | 13F | CastleKnight Management LP | Call | 0 | -100,00 | 0 | ||||
| 2026-02-17 | 13F | Weiss Asset Management LP | 88.196 | 3.331 | ||||||
| 2026-02-06 | 13F | Aviance Capital Partners, LLC | 0 | -100,00 | 0 | |||||
| 2026-02-17 | 13F | Clear Street Markets Llc | 11.500 | 434 | ||||||
| 2026-04-13 | 13F | True Wealth Design, LLC | 5 | 0 | ||||||
| 2026-02-17 | 13F | Schonfeld Strategic Advisors LLC | 205.099 | 12,00 | 7.747 | -9,86 | ||||
| 2026-02-17 | 13F | Jain Global LLC | 0 | -100,00 | 0 | |||||
| 2026-02-05 | 13F | Mission Wealth Management, Lp | 0 | -100,00 | 0 | |||||
| 2026-01-23 | 13F | Baillie Gifford & Co | 527.686 | -6,27 | 19.931 | -24,57 | ||||
| 2026-01-15 | 13F | Lodestone Wealth Management LLC | 1.517 | 57 | ||||||
| 2026-04-21 | 13F | Paradigm Financial Partners, Llc | 41.751 | -70,36 | 1.431 | -73,10 | ||||
| 2026-02-12 | 13F | Voya Investment Management Llc | 258.785 | 91,19 | 9.774 | 53,87 | ||||
| 2026-01-27 | 13F | Ring Mountain Capital, LLC | 32.148 | 301,85 | 2 | |||||
| 2026-02-09 | 13F | Global Assets Advisory, LLC | 10.870 | 411 | ||||||
| 2026-04-13 | 13F | IFP Advisors, Inc | 953 | -49,60 | 33 | -54,93 | ||||
| 2026-04-14 | 13F | Prospera Financial Services Inc | 13.994 | 5,88 | 480 | -4,01 | ||||
| 2026-02-13 | 13F | Centiva Capital, LP | Put | 752.100 | 0,28 | 28.407 | -19,29 | |||
| 2026-02-13 | 13F | Centiva Capital, LP | Call | 422.900 | 338,69 | 15.973 | 253,05 | |||
| 2026-02-13 | 13F | Centiva Capital, LP | 2.299 | -86,31 | 87 | -89,09 | ||||
| 2026-02-05 | 13F | Baader Bank INC | 0 | -100,00 | 0 | |||||
| 2026-01-20 | 13F | Blue Square Asset Management, Llc | 0 | -100,00 | 0 | |||||
| 2026-02-13 | 13F | GM Advisory Group, Inc. | 49.912 | 24,21 | 1.885 | 0,00 | ||||
| 2026-02-17 | 13F | Captrust Financial Advisors | 7.380 | 18,23 | 279 | -4,79 | ||||
| 2026-02-17 | 13F | Limestone Investment Advisors LP | 0 | -100,00 | 0 | |||||
| 2026-02-17 | 13F | Voloridge Investment Management, Llc | 2.283.757 | 38,19 | 86.258 | 11,22 | ||||
| 2026-02-11 | 13F | Simplex Trading, Llc | 191.894 | -86,70 | 7.248 | 10.716,42 | ||||
| 2026-01-28 | 13F | Chicago Partners Investment Group LLC | 76.182 | 11,47 | 4.318 | 1,24 | ||||
| 2026-02-13 | 13F | Lord, Abbett & Co. Llc | 20.000 | 1 | ||||||
| 2026-02-20 | 13F | Kovitz Investment Group Partners, LLC | 0 | -100,00 | 0 | -100,00 | ||||
| 2026-02-10 | 13F | Envestnet Asset Management Inc | 138.030 | 213,56 | 5.213 | 152,45 | ||||
| 2026-02-11 | 13F | Parallel Advisors, LLC | 493 | 614,49 | 19 | 500,00 | ||||
| 2026-02-11 | 13F | Mirae Asset Securities (usa) Inc. | 1.428.188 | 22,92 | 53.943 | -1,08 | ||||
| 2026-01-27 | 13F | Bosman Wealth Management, LLC | 25.256 | 954 | ||||||
| 2026-01-29 | 13F | D.a. Davidson & Co. | 0 | -100,00 | 0 | -100,00 | ||||
| 2026-04-23 | 13F | Sippican Capital Advisors | 49.045 | 8,20 | 1.681 | -1,81 | ||||
| 2026-02-12 | 13F | Triumph Capital Management | 22.084 | 834 | ||||||
| 2026-04-08 | 13F | Afg Fiduciary Services Limited Partnership | 0 | -100,00 | 0 | |||||
| 2026-02-10 | 13F | Foundations Investment Advisors, LLC | 151.832 | 31,17 | 5.735 | 5,56 | ||||
| 2026-02-10 | 13F | IAG Wealth Partners, LLC | 84 | 3 | ||||||
| 2025-11-14 | 13F | DeepCurrents Investment Group LLC | Call | 0 | -100,00 | 0 | -100,00 | |||
| 2026-02-11 | 13F | Franklin Resources Inc | 13.244 | 36,59 | 500 | 9,89 | ||||
| 2026-01-12 | 13F | Thompson Davis & Co., Inc. | 0 | -100,00 | 0 | |||||
| 2026-02-13 | 13F | State Street Corp | 590.316 | -21,33 | 22.296 | -36,69 | ||||
| 2026-02-17 | 13F | Scarborough Advisors, LLC | 5.000 | 189 | ||||||
| 2025-12-09 | 13F/A | Tudor Investment Corp Et Al | 138.650 | -90,55 | 6.507 | -69,55 | ||||
| 2026-02-13 | 13F | SPX Equities Gestao de Recursos Ltda | 17.500 | -75,90 | 661 | -80,63 | ||||
| 2026-02-06 | 13F | Larson Financial Group LLC | 2.258 | 42,01 | 85 | 14,86 | ||||
| 2026-04-23 | 13F | Harbor Investment Advisory, Llc | 167 | 0,00 | 6 | -16,67 | ||||
| 2026-02-06 | 13F | Gsa Capital Partners Llp | 14.400 | 9,49 | 1 | |||||
| 2025-11-13 | 13F | Macquarie Group Ltd | 0 | -100,00 | 0 | |||||
| 2026-04-24 | 13F | Root Financial Partners, LLC | 4 | 0,00 | 0 | |||||
| 2026-02-10 | 13F | Thames Capital Management Llc | 0 | -100,00 | 0 | |||||
| 2026-02-13 | 13F | Healthcare Of Ontario Pension Plan Trust Fund | 675.000 | 25.495 | ||||||
| 2026-02-04 | 13F | Proem Advisors LLC | 55.000 | -86,08 | 2.077 | -88,80 | ||||
| 2026-02-17 | 13F | Value Aligned Research Advisors, LLC | 3.515.247 | -9,24 | 132.771 | -26,96 | ||||
| 2025-11-12 | 13F | HAP Trading, LLC | Call | 333.200 | 10.560 | |||||
| 2026-04-22 | 13F | Formidable Asset Management, LLC | 0 | -100,00 | 0 | |||||
| 2025-11-12 | 13F | HAP Trading, LLC | Put | 255.700 | 160 | |||||
| 2026-04-23 | 13F | Global Trust Asset Management, LLC | 0 | -100,00 | 0 | |||||
| 2026-04-08 | 13F | Wealth Enhancement Trust Services, Inc. | 47 | 2 | ||||||
| 2026-02-17 | 13F | Discovery Capital Management, Llc / Ct | 2.583.458 | -23,24 | 97.577 | -38,22 | ||||
| 2025-11-14 | 13F | Moore Capital Management, Lp | 0 | -100,00 | 0 | |||||
| 2026-02-13 | 13F | Sculptor Capital LP | Put | 360.000 | 3.500,00 | 13.597 | 2.799,15 | |||
| 2026-02-13 | 13F | Clear Street Group Inc. | 3.629.194 | 137.075 | ||||||
| 2026-02-04 | 13F | Proem Advisors LLC | Call | 365.500 | 13.805 | |||||
| 2026-02-17 | 13F | Cresset Asset Management, LLC | 6.770 | -8,67 | 256 | -26,51 | ||||
| 2026-04-14 | 13F | Thurston, Springer, Miller, Herd & Titak, Inc. | 230 | -54,00 | 8 | -61,11 | ||||
| 2026-04-14 | 13F | Drive Wealth Management, Llc | 8.529 | 0,34 | 292 | -9,03 | ||||
| 2026-02-17 | 13F | Corsair Capital Management, L.p. | 142.615 | -3,38 | 5.387 | -22,25 | ||||
| 2026-02-11 | 13F | Gordian Capital Singapore Pte Ltd | 0 | -100,00 | 0 | -100,00 | ||||
| 2026-04-23 | 13F | J.w. Cole Advisors, Inc. | 37.443 | -12,10 | 1.284 | 136,28 | ||||
| 2026-04-15 | 13F | Steadtrust LLC | 8.620 | 0,00 | 295 | -9,23 | ||||
| 2026-02-05 | 13F | HighMark Wealth Management LLC | 75 | 3 | ||||||
| 2026-02-13 | 13F | Hudson Bay Capital Management LP | 31.500 | 35,78 | 1.190 | 9,28 | ||||
| 2026-02-11 | 13F | Mandatum Life Insurance Co Ltd | 0 | -100,00 | 0 | -100,00 | ||||
| 2026-04-08 | 13F | E Fund Management (Hong Kong) Co., Ltd. | 848 | 29 | ||||||
| 2026-01-27 | 13F | Prakash Investment Advisors Llc | 16.459 | 622 | ||||||
| 2026-02-13 | 13F | Public Sector Pension Investment Board | 150.000 | 5.666 | ||||||
| 2026-04-24 | 13F | UMA Financial Services, Inc. | 77 | 0,00 | 3 | 0,00 | ||||
| 2026-02-13 | 13F | Evernest Financial Advisors, LLC | 0 | -100,00 | 0 | |||||
| 2026-02-13 | 13F | Squarepoint Ops LLC | 571.284 | -9,97 | 21.577 | -27,54 | ||||
| 2026-02-17 | 13F | Ameriprise Financial Inc | Put | 0 | -100,00 | 0 | ||||
| 2025-11-12 | 13F | Amitell Capital Pte Ltd | 0 | -100,00 | 0 | -100,00 | ||||
| 2025-11-12 | 13F | Amitell Capital Pte Ltd | Call | 0 | -100,00 | 0 | -100,00 | |||
| 2025-11-14 | 13F | Point72 Asset Management, L.P. | 0 | -100,00 | 0 | -100,00 | ||||
| 2026-02-02 | 13F | Ascent Wealth Partners, LLC | 0 | -100,00 | 0 | |||||
| 2026-02-13 | 13F | Squarepoint Ops LLC | Call | 134.300 | -78,86 | 5.073 | -82,99 | |||
| 2026-04-13 | 13F | Salem Investment Counselors Inc | 400 | 14 | ||||||
| 2026-02-13 | 13F | Squarepoint Ops LLC | Put | 630.600 | -39,28 | 23.818 | -51,14 | |||
| 2025-11-14 | 13F | Paloma Partners Management Co | Call | 0 | -100,00 | 0 | ||||
| 2026-04-23 | 13F | Oppenheimer & Co Inc | 40.012 | 48,42 | 1.372 | 34,68 | ||||
| 2026-02-05 | 13F | Cambridge Investment Research Advisors, Inc. | 67.095 | 1,35 | 3 | -33,33 | ||||
| 2026-02-13 | 13F | Y-Intercept (Hong Kong) Ltd | 47.551 | -66,23 | 1.796 | -72,82 | ||||
| 2026-02-13 | 13F | Ieq Capital, Llc | 320.400 | -1,45 | 12.102 | -20,68 | ||||
| 2026-02-17 | 13F | Park West Asset Management LLC | 184.850 | -72,86 | 6.982 | -78,16 | ||||
| 2026-04-16 | 13F | Polianta Ltd | 35.300 | 1 | ||||||
| 2026-02-17 | 13F | Advisor Group Holdings, Inc. | 13.229 | -19,60 | 500 | -35,28 | ||||
| 2025-11-14 | 13F | Paloma Partners Management Co | 0 | -100,00 | 0 | |||||
| 2025-11-14 | 13F | Parallax Volatility Advisers, L.P. | 0 | -100,00 | 0 | -100,00 | ||||
| 2026-02-09 | 13F | GatePass Capital, LLC | 0 | -100,00 | 0 | |||||
| 2026-02-17 | 13F | Concentric Capital Strategies, LP | 0 | -100,00 | 0 | |||||
| 2026-04-13 | 13F | Wolff Wiese Magana Llc | 100 | 0,00 | 3 | 0,00 | ||||
| 2026-04-15 | 13F | Exchange Traded Concepts, Llc | 966.219 | 106,49 | 33.122 | 87,41 | ||||
| 2026-02-13 | 13F | Charles Schwab Investment Management Inc | 297.125 | -25,58 | 11.222 | -40,11 | ||||
| 2026-04-15 | 13F | Gf Fund Management Co. Ltd. | 0 | -100,00 | 0 | |||||
| 2026-02-23 | 13F | Walser Wealth Management Company, A Ltd Liability Co | 6.503 | 246 | ||||||
| 2026-04-22 | 13F | HMS Capital Management, LLC | 12.092 | 5,51 | 415 | -4,17 | ||||
| 2026-01-28 | 13F | N.E.W. Advisory Services LLC | 140 | 5 | ||||||
| 2026-02-04 | 13F | Ameritas Advisory Services, LLC | 8.600 | 1.749,46 | 325 | 1.442,86 | ||||
| 2026-02-13 | 13F | DeepCurrents Investment Group LLC | Put | 0 | -100,00 | 0 | ||||
| 2026-02-12 | 13F | Skopos Labs, Inc. | 5.766 | 227 |
Other Listings
| DE:F8P | 43,80 € |