Grundlæggende statistik
| Institutionelle ejere | 345 total, 345 long only, 0 short only, 0 long/short - change of 2,37% MRQ |
| Gennemsnitlig porteføljeallokering | 0.2915 % - change of -20,16% MRQ |
| Institutionelle aktier (lange) | 17.081.583 (ex 13D/G) - change of -3,25MM shares -15,99% MRQ |
| Institutionel værdi (lang) | $ 1.682.961 USD ($1000) |
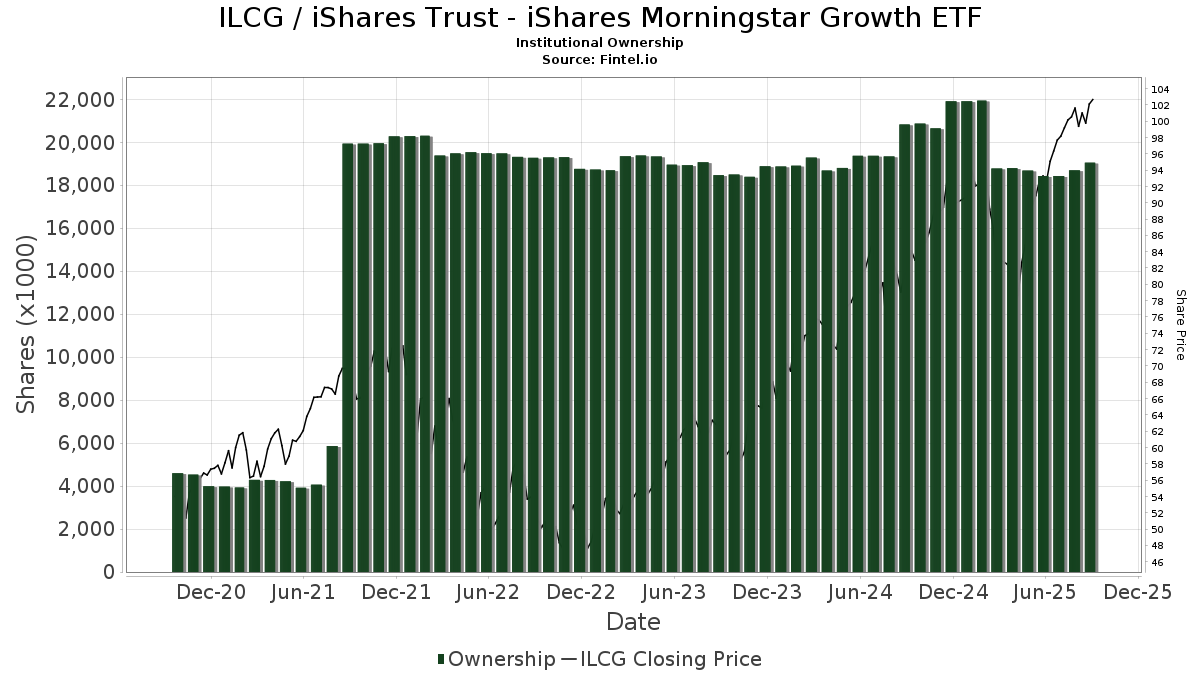
Institutionelt ejerskab og aktionærer
iShares Trust - iShares Morningstar Growth ETF (US:ILCG) har 345 institutionelle ejere og aktionærer, der har indsendt 13D/G- eller 13F-formularer til Securities Exchange Commission (SEC). Disse institutioner har i alt 17,081,583 aktier. Største aktionærer omfatter Equitable Holdings, Inc., LPL Financial LLC, Morgan Stanley, Wells Fargo & Company/mn, Financial Advisory Service, Inc., Cetera Investment Advisers, Bank Of America Corp /de/, Atlantic Trust, LLC, B&D White Capital Company, LLC, and Valpey Financial Services, LLC .
iShares Trust - iShares Morningstar Growth ETF (ARCA:ILCG) institutionel ejerskabsstruktur viser aktuelle positioner i virksomheden efter institutioner og fonde, samt seneste ændringer i positionsstørrelse. Større aktionærer kan omfatte individuelle investorer, investeringsforeninger, hedgefonde eller institutioner. Skema 13D angiver, at investoren besidder (eller besidder) mere end 5 % af virksomheden og har til hensigt (eller har til hensigt at) aktivt at forfølge en ændring i forretningsstrategi. Skema 13G indikerer en passiv investering på over 5%.
The share price as of March 9, 2026 is 101,05 / share. Previously, on March 10, 2025, the share price was 81,26 / share. This represents an increase of 24,35% over that period.
Fondens stemningsscore
Fund Sentiment Score (fka Ownership Accumulation Score) finder de aktier, der bliver mest købt af fonde. Det er resultatet af en sofistikeret, multi-faktor kvantitativ model, der identificerer virksomheder med de højeste niveauer af institutionel akkumulering. Scoringsmodellen bruger en kombination af den samlede stigning i oplyste ejere, ændringerne i porteføljeallokeringer i disse ejere og andre målinger. Tallet går fra 0 til 100, hvor højere tal indikerer et højere niveau af akkumulering for sine jævnaldrende, og 50 er gennemsnittet.
Opdateringsfrekvens: Dagligt
Se Ownership Explorer, som giver en liste over højest rangerende virksomheder.
AI+ Ask Fintel’s AI assistant about iShares Trust - iShares Morningstar Growth ETF.
Select a question to share a public post with an AI-crafted answer.
Thinking of good questions…
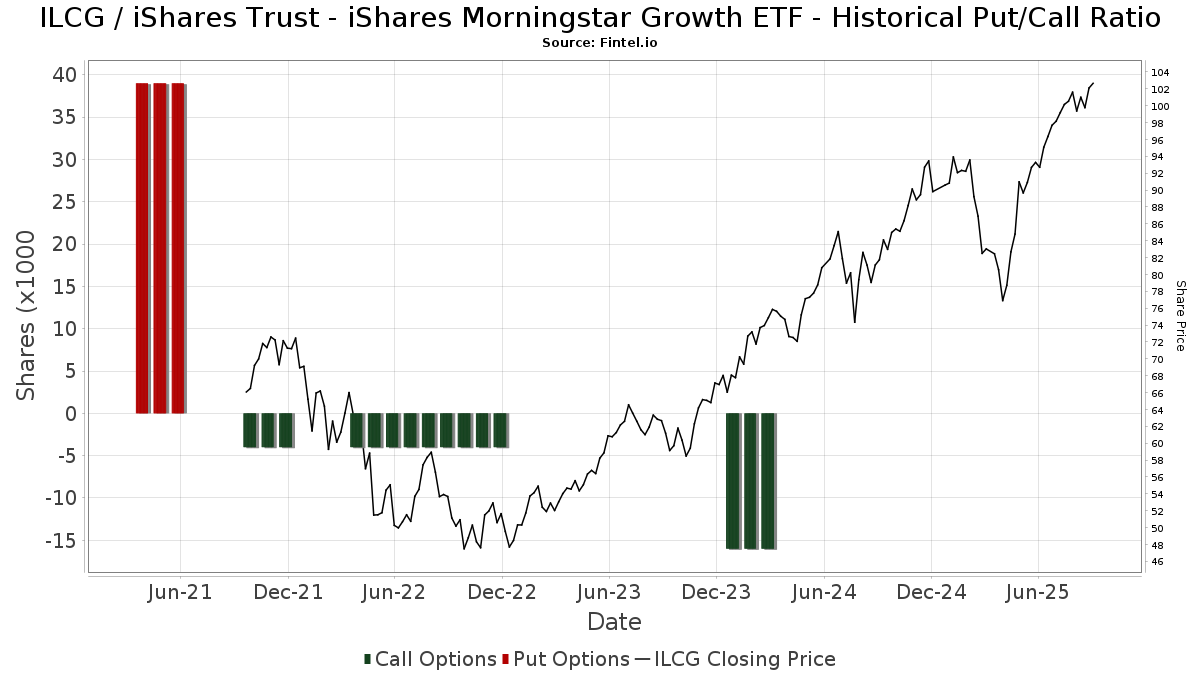
Institutionel Put/Call-forhold
Ud over at indberette standardaktie- og gældsudstedelser skal institutter med mere end 100 mill. aktiver under forvaltning også oplyse deres put- og call-optionsbeholdninger. Da salgsoptioner generelt indikerer negativ stemning, og købsoptioner indikerer positiv stemning, kan vi få en fornemmelse af den overordnede institutionelle stemning ved at plotte forholdet mellem put og kald. Diagrammet til højre viser det historiske put/call-forhold for dette instrument.
Brug af Put/Call Ratio som en indikator for investorernes stemning overvinder en af de vigtigste mangler ved at bruge totalt institutionelt ejerskab, som er, at en betydelig mængde af aktiver under forvaltning investeres passivt for at spore indekser. Passivt forvaltede fonde køber typisk ikke optioner, så indikatoren for put/call-forholdet følger mere nøje følelsen af aktivt forvaltede fonde.
13F og NPORT arkivering
Detaljer om 13F-arkivering er gratis. Detaljer om NP-ansøgninger kræver et premium-medlemskab. Grønne rækker angiver nye positioner. Røde rækker angiver lukkede positioner. Klik på linket ikon for at se den fulde transaktionshistorik.
Opgrader
for at låse premium-data op og eksportere til Excel ![]() .
.
| Fil dato | Kilde | Investor | Type | Gennemsnitlig pris (Øst) |
Aktier | Δ Aktier (%) |
Rapporteret Værdi ($1000) |
Δ Værdi (%) |
Port Alloc (%) |
|
|---|---|---|---|---|---|---|---|---|---|---|
| 2026-02-17 | 13F | Private Advisor Group, LLC | 30.840 | -72,91 | 3.209 | -72,98 | ||||
| 2026-02-06 | 13F | Envestnet Portfolio Solutions, Inc. | 6.959 | 37,42 | 724 | 37,12 | ||||
| 2025-11-07 | 13F | Synovus Financial Corp | 2.145 | -2,90 | 224 | 4,21 | ||||
| 2026-02-03 | 13F | Cheviot Value Management, LLC | 458 | 0,00 | 49 | -2,04 | ||||
| 2025-10-17 | 13F | Legacy Advisory Services, LLC | 81.237 | -5,49 | 7.279 | 0,76 | ||||
| 2026-02-12 | 13F | Chilton Capital Management Llc | 0 | -100,00 | 0 | |||||
| 2025-11-13 | 13F | Marshall Wace, Llp | 0 | -100,00 | 0 | |||||
| 2026-02-18 | 13F | Plotkin Financial Advisors, LLC | 0 | -100,00 | 0 | |||||
| 2026-01-26 | 13F | Roman Butler Fullerton & Co | 14.153 | 11,07 | 1.475 | 6,27 | ||||
| 2026-02-12 | 13F | Rossby Financial, LCC | 372 | 0,00 | 39 | 0,00 | ||||
| 2026-02-11 | 13F | O'shaughnessy Asset Management, Llc | 378 | 1.250,00 | 39 | 1.850,00 | ||||
| 2026-02-11 | 13F | Ipsen Advisor Group LLC | 53.924 | -20,45 | 5.610 | -20,65 | ||||
| 2026-01-21 | 13F | Signature Resources Capital Management, LLC | 7 | 1 | ||||||
| 2026-02-13 | 13F | Morgan Stanley | 1.112.299 | -18,99 | 115.724 | -19,19 | ||||
| 2026-02-10 | 13F | IFG Advisory, LLC | 4.153 | 432 | ||||||
| 2026-01-29 | 13F | Sanctuary Advisors, LLC | 33.894 | 1,06 | 3.526 | 0,80 | ||||
| 2026-02-13 | 13F | Umb Bank N A/mo | 898 | -51,41 | 93 | -51,56 | ||||
| 2026-02-09 | 13F | Huntington National Bank | 0 | |||||||
| 2025-09-26 | NP | BVAL - Bluemonte Large Cap Value ETF | 9 | 1 | ||||||
| 2026-02-12 | 13F | CIBC Private Wealth Group, LLC | 880 | 0,00 | 92 | 0,00 | ||||
| 2026-01-29 | 13F | Comerica Bank | 11.845 | 0,03 | 1.232 | -0,24 | ||||
| 2026-02-02 | 13F | Mutual Advisors, LLC | 4.538 | 0,22 | 472 | -0,63 | ||||
| 2026-02-04 | 13F | Money Concepts Capital Corp | 50.341 | 2,58 | 5.237 | 2,33 | ||||
| 2026-01-30 | 13F | Sigma Planning Corp | 14.872 | -0,45 | 1.547 | -0,71 | ||||
| 2026-01-22 | 13F | HHM Wealth Advisors, LLC | 7.625 | 0,00 | 793 | -0,25 | ||||
| 2026-01-29 | 13F | Dunhill Financial, LLC | 130 | 0,00 | 14 | 0,00 | ||||
| 2026-02-13 | 13F | Cornerstone Financial Management LLC | 25 | 3 | ||||||
| 2026-01-13 | 13F | CoreCap Advisors, LLC | 2.341 | -5,87 | 244 | -6,18 | ||||
| 2026-01-08 | 13F | Cooper Financial Group | 9.646 | 0,01 | 1.004 | -0,20 | ||||
| 2026-02-17 | 13F | Susquehanna International Group, Llp | 18.385 | -11,16 | 1.913 | -11,40 | ||||
| 2026-02-04 | 13F | Brio Consultants, LLC | 8.844 | 2,36 | 920 | 2,11 | ||||
| 2026-02-10 | 13F | Envestnet Asset Management Inc | 455.566 | 27,63 | 47.397 | 27,31 | ||||
| 2026-02-10 | 13F | Ritter Daniher Financial Advisory LLC / DE | 300 | 31 | ||||||
| 2026-01-21 | 13F | Flagship Harbor Advisors, Llc | 23.571 | -5,33 | 2.452 | -5,55 | ||||
| 2026-02-13 | 13F | Smartleaf Asset Management LLC | 3 | 0,00 | 0 | |||||
| 2026-02-17 | 13F | National Asset Management, Inc. | 15.290 | -27,95 | 1.591 | -28,15 | ||||
| 2026-01-28 | 13F | Salomon & Ludwin, LLC | 526 | -0,75 | 55 | 0,00 | ||||
| 2026-02-06 | 13F | Kingdom Financial Group LLC. | 5 | 1 | ||||||
| 2026-01-23 | 13F | Blue Sky Capital Consultants Group, Inc. | 2.380 | -6,48 | 248 | -6,79 | ||||
| 2026-02-18 | 13F | Caitlin John, LLC | 336 | 0,00 | 35 | -2,86 | ||||
| 2026-02-10 | 13F | Blue Barn Wealth, LLC | 0 | -100,00 | 0 | |||||
| 2026-02-11 | 13F | Jpmorgan Chase & Co | 399.429 | 6,08 | 41.557 | 5,82 | ||||
| 2026-02-02 | 13F | Del-Sette Capital Management, LLC | 0 | -100,00 | 0 | |||||
| 2026-02-03 | 13F | Sequoia Financial Advisors, LLC | 3.740 | 0,00 | 389 | -0,26 | ||||
| 2025-11-20 | 13F | Asset Dedication, LLC | 0 | -100,00 | 0 | |||||
| 2026-02-10 | 13F | Spectrum Wealth Advisory Group, LLC | 0 | -100,00 | 0 | |||||
| 2026-02-09 | 13F | Mathes Company, Inc. | 2.500 | 0,00 | 0 | |||||
| 2026-01-07 | 13F | Corsicana & Co. | 43.712 | 0,76 | 4.548 | 0,51 | ||||
| 2026-02-09 | 13F | Kingsview Wealth Management, LLC | 12.191 | -0,93 | 1.268 | -1,17 | ||||
| 2026-02-02 | 13F | KPP Advisory Services LLC | 2.758 | 34,01 | 287 | 33,64 | ||||
| 2026-02-10 | 13F | Essex Financial Services, Inc. | 16.519 | -1,07 | 1.719 | -1,32 | ||||
| 2026-02-17 | 13F | Advisor Group Holdings, Inc. | 252.346 | -10,44 | 26.257 | -9,18 | ||||
| 2026-01-12 | 13F | JGP Wealth Management, LLC | 13.712 | 46,76 | 1.427 | 45,66 | ||||
| 2026-02-02 | 13F | Ashton Thomas Securities, Llc | 0 | -100,00 | 0 | |||||
| 2026-02-10 | 13F | Godfrey Financial Associates, Inc. | 1.520 | 158 | ||||||
| 2025-11-06 | 13F | Wealthstream Advisors, Inc. | 13.565 | 0,00 | 1.415 | 7,61 | ||||
| 2026-02-11 | 13F | Parallel Advisors, LLC | 355 | 0,00 | 37 | -2,70 | ||||
| 2025-12-09 | 13F | Painted Porch Advisors LLC | 1.313 | 137 | ||||||
| 2026-02-13 | 13F | Mml Investors Services, Llc | 284.868 | 3,34 | 29.638 | 3,08 | ||||
| 2026-02-02 | 13F | Cornerstone Planning Group LLC | 494 | -18,08 | 52 | -18,75 | ||||
| 2026-02-18 | 13F | Hershey Financial Advisers, LLC | 9.128 | -17,28 | 950 | -17,48 | ||||
| 2026-01-20 | 13F | Aspiriant, Llc | 3.614 | -2,32 | 376 | -2,34 | ||||
| 2026-01-30 | 13F | SK Wealth Management, LLC | 4.860 | 0,14 | 514 | -0,19 | ||||
| 2026-02-17 | 13F | Blair William & Co/il | 6.157 | 0,07 | 641 | -0,16 | ||||
| 2026-02-12 | 13F | Principal Securities, Inc. | 10.021 | -2,29 | 1.043 | -2,53 | ||||
| 2026-02-06 | 13F | Adell Harriman & Carpenter Inc | 10.495 | -61,51 | 1.092 | -61,64 | ||||
| 2026-01-21 | 13F | Capital Advisors, Ltd. LLC | 21.078 | 17,86 | 2 | 100,00 | ||||
| 2026-02-10 | 13F | Twin Peaks Wealth Advisors, LLC | 10.426 | 58,74 | 1.077 | 57,31 | ||||
| 2026-01-28 | 13F | Edge Financial Advisors LLC | 10.367 | 16,21 | 1.079 | 15,91 | ||||
| 2026-01-15 | 13F/A | Sherman Wealth Management LLC | 2.641 | 275 | ||||||
| 2026-02-17 | 13F | Evolve Private Wealth, Llc | 9.607 | 1.000 | ||||||
| 2025-11-13 | 13F | Summit X, LLC | 0 | -100,00 | 0 | |||||
| 2026-02-12 | 13F | Steward Partners Investment Advisory, Llc | 53.152 | -2,39 | 5.530 | -2,64 | ||||
| 2026-02-17 | 13F | Russell Investments Group, Ltd. | 62 | 0,00 | 6 | 0,00 | ||||
| 2026-01-14 | 13F | Eastern Bank | 2.490 | 0,00 | 259 | 0,00 | ||||
| 2026-01-20 | 13F | Coastal Investment Advisors, Inc. | 580 | 0,00 | 60 | 0,00 | ||||
| 2026-01-26 | 13F | Invested Advisors | 5.585 | 581 | ||||||
| 2026-01-23 | 13F | Creative Capital Management Investments LLC | 1.007 | 0,00 | 105 | -0,95 | ||||
| 2026-01-28 | 13F | Kingswood Wealth Advisors, Llc | 2.071 | 215 | ||||||
| 2026-01-30 | 13F | Strategic Blueprint, LLC | 3.920 | -1,06 | 408 | -1,45 | ||||
| 2026-01-27 | 13F | Horst & Graben Wealth Management LLC | 18.747 | -1,77 | 1.950 | -2,01 | ||||
| 2026-01-28 | 13F | Atwood & Palmer Inc | 1.128 | 0,09 | 117 | 0,00 | ||||
| 2026-01-23 | 13F | McCarthy & Cox | 0 | -100,00 | 0 | |||||
| 2026-02-06 | 13F | Creative Financial Designs Inc /adv | 15.161 | 2,20 | 1.577 | 1,94 | ||||
| 2026-02-12 | 13F | Summit Financial, LLC | 9.183 | 0,19 | 955 | -0,10 | ||||
| 2026-01-22 | 13F | Rodgers & Associates, LTD | 13.450 | -18,97 | 1.399 | -19,18 | ||||
| 2026-02-09 | 13F | Strategic Financial Concepts, LLC | 42.306 | 271,53 | 4.402 | 269,52 | ||||
| 2026-02-02 | 13F | Truist Financial Corp | 14.844 | -18,77 | 1.544 | -18,95 | ||||
| 2026-01-22 | 13F | Red Tortoise LLC | 6.074 | 0,00 | 632 | -0,32 | ||||
| 2026-01-14 | 13F | Nova Wealth Management, Inc. | 175 | 0,00 | 18 | 0,00 | ||||
| 2026-01-14 | 13F | Barnes Dennig Private Wealth Management LLC | 197 | 0,00 | 20 | 0,00 | ||||
| 2026-02-06 | 13F | Global Retirement Partners, LLC | 17.533 | 16,65 | 1.824 | 16,40 | ||||
| 2026-01-28 | 13F | Eagle Global Advisors Llc | 3.315 | -0,60 | 345 | -0,86 | ||||
| 2026-02-17 | 13F | Captrust Financial Advisors | 85.595 | 0,00 | 8.905 | -0,25 | ||||
| 2026-02-12 | 13F | Bank Of Montreal /can/ | 610 | 0,00 | 63 | 0,00 | ||||
| 2026-01-06 | 13F | Investors Research Corp | 81.507 | 8,38 | 8.480 | 8,11 | ||||
| 2026-01-07 | 13F | Platt Investment Counsel, LLC | 3.000 | 0,00 | 312 | 0,00 | ||||
| 2026-02-13 | 13F | Baird Financial Group, Inc. | 10.792 | -1,25 | 1.123 | -1,49 | ||||
| 2026-02-06 | 13F | Pnc Financial Services Group, Inc. | 4.383 | -1,81 | 456 | -1,94 | ||||
| 2026-02-06 | 13F | Addison Advisors LLC | 16 | 0,00 | 2 | 0,00 | ||||
| 2026-02-10 | 13F | Nomura Asset Management Co Ltd | 5.709 | 0,00 | 594 | -0,34 | ||||
| 2026-02-11 | 13F | Milestone Investment Advisors LLC | 5.275 | 549 | ||||||
| 2026-01-08 | 13F | Asempa Wealth Advisors | 24.216 | 2.519 | ||||||
| 2025-11-10 | 13F | Hartland & Co., LLC | 0 | -100,00 | 0 | |||||
| 2026-01-23 | 13F | Diversify Advisory Services, LLC | 2.055 | 0,00 | 216 | -2,71 | ||||
| 2026-02-03 | 13F | Washington Trust Advisors, Inc. | 750 | 0,00 | 78 | 0,00 | ||||
| 2026-01-22 | 13F | Glass Jacobson Investment Advisors llc | 437 | 0,00 | 46 | 0,00 | ||||
| 2026-02-05 | 13F | Elyxium Wealth, LLC | 1.450 | 151 | ||||||
| 2026-02-13 | 13F | Stifel Financial Corp | 27.578 | -39,20 | 2.869 | -39,36 | ||||
| 2026-02-10 | 13F | One Capital Management, LLC | 26.299 | -0,27 | 2.736 | -0,51 | ||||
| 2026-01-07 | 13F | Harbor Investment Advisory, Llc | 2.320 | 0,00 | 241 | 0,00 | ||||
| 2026-02-09 | 13F | Prospera Financial Services Inc | 0 | -100,00 | 0 | |||||
| 2026-02-11 | 13F | Janney Montgomery Scott LLC | 7.625 | 0,00 | 1 | |||||
| 2026-02-06 | 13F | Tanglewood Legacy Advisors, LLC | 44 | 0,00 | 5 | 0,00 | ||||
| 2025-09-26 | NP | BLGR - Bluemonte Large Cap Growth ETF | 15 | 2 | ||||||
| 2026-01-27 | 13F | Vision Capital Management, Inc. | 6.740 | 0,00 | 701 | -0,14 | ||||
| 2026-02-23 | 13F | Drake & Associates, LLC | 8.601 | 39,81 | 895 | 37,54 | ||||
| 2026-02-03 | 13F | Costello Asset Management, INC | 1.367 | 0,15 | 142 | 0,00 | ||||
| 2026-02-06 | 13F | Midwest Financial Partners Investments, Inc. | 5.505 | 573 | ||||||
| 2026-02-09 | 13F | Redstone Wealth Management, Llc | 4.281 | 445 | ||||||
| 2025-11-04 | 13F | Win Advisors, Inc | 0 | -100,00 | 0 | |||||
| 2026-02-13 | 13F | Kane Investment Management, Inc. | 17.735 | -2,26 | 1.845 | -2,48 | ||||
| 2026-02-11 | 13F | Cerity Partners LLC | 2.469 | 0,00 | 257 | -0,39 | ||||
| 2026-02-12 | 13F | Hrt Financial Lp | 0 | -100,00 | 0 | |||||
| 2026-02-17 | 13F | Signature Equity Partners, LLC | 577 | 60 | ||||||
| 2026-02-12 | 13F | Livet Wealth, LLC | 8.529 | 887 | ||||||
| 2026-01-28 | 13F | Marietta Wealth Management, LLC | 69.895 | -2,42 | 7.272 | -2,66 | ||||
| 2026-02-17 | 13F | Optiver Holding B.V. | 0 | -100,00 | 0 | |||||
| 2026-01-20 | 13F | Stratos Wealth Advisors, LLC | 2.797 | 0,14 | 291 | 0,00 | ||||
| 2026-02-10 | 13F | Madison Wealth Partners, Inc | 40.143 | -1,22 | 4.176 | -1,46 | ||||
| 2026-02-10 | 13F | Bank of New York Mellon Corp | 39.329 | 28,12 | 4.092 | 27,80 | ||||
| 2026-02-17 | 13F | VestGen Advisors, LLC | 34.407 | -0,77 | 3.580 | -1,02 | ||||
| 2026-01-23 | 13F | Aspect Partners, LLC | 4.755 | 0,00 | 495 | -0,20 | ||||
| 2025-11-04 | 13F | Pineridge Advisors LLC | 59 | 0,00 | 6 | 20,00 | ||||
| 2026-01-29 | 13F | First Interstate Bank | 2.500 | 0,00 | 260 | 0,00 | ||||
| 2026-01-26 | 13F | Kelman-Lazarov, Inc. | 2.965 | 0,03 | 308 | -0,32 | ||||
| 2026-02-13 | 13F | MAI Capital Management | 12.492 | -8,52 | 1.300 | -8,78 | ||||
| 2026-02-11 | 13F | Cedar Mountain Advisors, LLC | 1.170 | -2,50 | 122 | -3,20 | ||||
| 2026-01-26 | 13F | Merit Financial Group, LLC | 54.639 | -0,08 | 5.685 | -0,33 | ||||
| 2026-02-10 | 13F | SCS Capital Management LLC | 4.575 | 0,00 | 476 | -0,42 | ||||
| 2026-02-02 | 13F | CX Institutional | 465 | 0 | ||||||
| 2026-01-23 | 13F | Bowman & Co S.C. | 6.505 | -1,68 | 677 | -2,03 | ||||
| 2026-01-26 | 13F | Private Trust Co Na | 8.194 | 0,00 | 853 | -0,23 | ||||
| 2026-02-11 | 13F | Paragon Private Wealth Management, LLC | 10.975 | -1,53 | 1.142 | -1,81 | ||||
| 2026-02-18 | 13F | Garton & Associates Financial Advisors LLC | 1.075 | 112 | ||||||
| 2026-01-28 | 13F | Cornerstone Advisory, LLC | 2.520 | 0,12 | 262 | 0,00 | ||||
| 2026-02-18 | 13F | GWM Advisors LLC | 18.368 | 28,56 | 1.911 | 28,19 | ||||
| 2026-02-13 | 13F | Anb Bank | 9.387 | -0,03 | 977 | -0,31 | ||||
| 2026-02-14 | 13F | New Insight Wealth Advisors | 4.428 | -8,00 | 461 | -8,18 | ||||
| 2026-02-06 | 13F | HighTower Advisors, LLC | 19.716 | -0,21 | 2.051 | -0,44 | ||||
| 2026-02-02 | 13F | McHugh Group, LLC | 2.530 | 0,00 | 263 | 0,00 | ||||
| 2026-02-13 | 13F | Wells Fargo & Company/mn | 718.042 | 6,06 | 74.705 | 5,80 | ||||
| 2026-01-26 | 13F | Annex Advisory Services, LLC | 4.178 | 1,28 | 435 | 0,93 | ||||
| 2026-01-30 | 13F | Laurel Wealth Advisors LLC | 2.600 | 271 | ||||||
| 2026-02-17 | 13F | Qube Research & Technologies Ltd | 0 | -100,00 | 0 | |||||
| 2025-11-10 | 13F | Personal Cfo Solutions, Llc | 0 | -100,00 | 0 | |||||
| 2026-01-27 | 13F | Mainstay Capital Management Llc /adv | 2.325 | 0,00 | 242 | -0,41 | ||||
| 2025-11-12 | 13F | Transce3nd, LLC | 0 | -100,00 | 0 | |||||
| 2026-02-17 | 13F | Bank Of America Corp /de/ | 501.801 | -2,41 | 52.207 | -2,65 | ||||
| 2026-02-13 | 13F | Bay Colony Advisory Group, Inc d/b/a Bay Colony Advisors | 0 | -100,00 | 0 | -100,00 | ||||
| 2026-02-13 | 13F | Level Four Advisory Services, Llc | 68.693 | -1,09 | 7.147 | -1,34 | ||||
| 2026-01-30 | 13F | Archer Investment Corp | 160 | 0,00 | 17 | 0,00 | ||||
| 2026-02-09 | 13F | Summit Asset Management, LLC | 8.285 | 0,00 | 862 | -0,35 | ||||
| 2026-02-10 | 13F | Operose Advisors LLC | 0 | -100,00 | 0 | |||||
| 2026-01-14 | 13F | Exchange Traded Concepts, Llc | 51 | -33,77 | 5 | -37,50 | ||||
| 2026-02-05 | 13F | Proactive Wealth Strategies LLC | 9.343 | -2,96 | 972 | -3,19 | ||||
| 2026-01-21 | 13F | Prime Capital Investment Advisors, LLC | 116.897 | 0,44 | 12.162 | 0,19 | ||||
| 2026-02-05 | 13F | Plante Moran Financial Advisors, LLC | 107 | 0,00 | 11 | 0,00 | ||||
| 2026-02-10 | 13F | Hazlett, Burt & Watson, Inc. | 1.200 | 0,00 | 0 | |||||
| 2026-02-10 | 13F/A | Northwestern Mutual Wealth Management Co | 93.693 | 4,47 | 9.748 | 4,20 | ||||
| 2026-01-12 | 13F | Gilman Hill Asset Management, LLC | 3.460 | 0,00 | 360 | -0,28 | ||||
| 2026-02-14 | 13F | Rockefeller Capital Management L.P. | 168.913 | 11,39 | 17.589 | 11,22 | ||||
| 2026-02-06 | 13F | Northwest Wealth Advisors, LLC | 37.051 | 3.855 | ||||||
| 2026-02-09 | 13F | Hantz Financial Services, Inc. | 447 | 9,02 | 0 | |||||
| 2026-02-13 | 13F | Kestra Advisory Services, LLC | 0 | -100,00 | 0 | |||||
| 2026-01-26 | 13F | JNBA Financial Advisors | 256 | 0,00 | 27 | 0,00 | ||||
| 2026-01-29 | 13F | UBS Group AG | 355.130 | -3,15 | 36.948 | -3,39 | ||||
| 2026-01-26 | 13F | AE Wealth Management LLC | 2.572 | -88,61 | 268 | -88,66 | ||||
| 2026-01-12 | 13F | Shira Ridge Wealth Management | 22.245 | -2,10 | 2.314 | -2,36 | ||||
| 2026-02-12 | 13F | Absolute Capital Management, LLC | 0 | -100,00 | 0 | |||||
| 2025-09-26 | NP | BINT - Bluemonte Global Equity ETF | 17 | 2 | ||||||
| 2026-01-22 | 13F | Fiduciary Alliance LLC | 2.692 | 0,00 | 280 | 0,00 | ||||
| 2026-01-23 | 13F | Nbt Bank N A /ny | 104 | 0,00 | 30 | 0,00 | ||||
| 2026-02-11 | 13F | Wharton Business Group, LLC | 7.400 | 0,00 | 770 | -0,26 | ||||
| 2026-02-11 | 13F | Greykasell Wealth Strategies, Inc. | 20.503 | 0,03 | 2.133 | -0,19 | ||||
| 2026-01-12 | 13F | Daymark Wealth Partners, Llc | 20.000 | -1,03 | 2.081 | -1,28 | ||||
| 2026-02-04 | 13F | Opinicus Capital, Inc. | 2.833 | -0,53 | 295 | -1,01 | ||||
| 2026-02-20 | 13F | Sunbelt Securities, Inc. | 6.533 | -1,31 | 680 | -1,59 | ||||
| 2026-02-17 | 13F | Pinnacle Financial Partners, Inc. | 2.145 | 223 | ||||||
| 2026-02-04 | 13F | Catalyst Financial Partners Llc | 7.850 | 0,00 | 817 | -0,24 | ||||
| 2026-02-17 | 13F | Cetera Investment Advisers | 528.445 | 6,87 | 54.979 | 6,60 | ||||
| 2026-02-09 | 13F | Wealthquest Corp | 9.851 | -0,20 | 1.025 | -0,49 | ||||
| 2026-01-23 | 13F | Family Investment Center, Inc. | 2.398 | 0,00 | 250 | -0,40 | ||||
| 2026-01-15 | 13F | SILVER OAK SECURITIES, Inc | 2.195 | -2,79 | 230 | -2,13 | ||||
| 2026-01-28 | 13F | White Pine Investment CO | 68.396 | 0,77 | 7 | 0,00 | ||||
| 2026-01-09 | 13F | Murphy, Middleton, Hinkle & Parker, Inc. | 2.730 | 308 | ||||||
| 2026-01-12 | 13F | Optivise Advisory Services LLC | 5.659 | 20,64 | 589 | 20,25 | ||||
| 2026-01-27 | 13F | Tred Avon Family Wealth, Llc | 0 | -100,00 | 0 | |||||
| 2026-02-11 | 13F | Brand Asset Management Group, Inc. | 33.376 | -4,33 | 3.472 | -4,56 | ||||
| 2025-10-30 | 13F | WFA Asset Management Corp | 52 | 0,00 | 4 | 0,00 | ||||
| 2026-02-19 | 13F | CI Private Wealth, LLC | 125.495 | 2,49 | 3.356 | -73,72 | ||||
| 2026-01-16 | 13F | Bouchey Financial Group Ltd | 5.060 | 0,00 | 526 | -0,19 | ||||
| 2026-02-02 | 13F | B.O.S.S. Retirement Advisors, LLC | 0 | -100,00 | 0 | |||||
| 2026-02-13 | 13F | Gts Securities Llc | 4.033 | 75,35 | 420 | 75,31 | ||||
| 2026-02-17 | 13F | Ameriprise Financial Inc | 331.032 | -0,57 | 34.441 | -0,86 | ||||
| 2026-02-11 | 13F | Outlook Wealth Advisors, LLC | 6.031 | 0,00 | 627 | -0,32 | ||||
| 2026-02-13 | 13F | Arkadios Wealth Advisors | 23.628 | 0,08 | 2.458 | -0,16 | ||||
| 2026-01-28 | 13F | HB Wealth Management, LLC | 8.085 | 0,00 | 841 | -0,24 | ||||
| 2026-02-10 | 13F | Syntegra Private Wealth Group, LLC | 4.244 | 1,82 | 442 | 1,61 | ||||
| 2026-02-03 | 13F | LJI Wealth Management, LLC | 4.360 | 0,00 | 454 | -0,22 | ||||
| 2026-01-26 | 13F | Nations Financial Group Inc, /ia/ /adv | 2.469 | -3,82 | 257 | -4,12 | ||||
| 2026-02-13 | 13F | Integrated Wealth Concepts LLC | 8.624 | -7,70 | 897 | -7,91 | ||||
| 2025-11-14 | 13F | Skopos Labs, Inc. | 0 | -100,00 | 0 | |||||
| 2026-01-29 | 13F | Quest 10 Wealth Builders, Inc. | 0 | -100,00 | 0 | |||||
| 2026-02-17 | 13F | Two Sigma Investments, Lp | 60.200 | 2,56 | 6.263 | 2,30 | ||||
| 2026-02-13 | 13F | Brown Advisory Inc | 3.058 | 0,00 | 318 | 0,00 | ||||
| 2026-01-09 | 13F | First Heartland Consultants, Inc. | 2.947 | 0,17 | 307 | 0,00 | ||||
| 2026-01-16 | 13F | Crewe Advisors LLC | 1.740 | 0,00 | 181 | 0,00 | ||||
| 2026-02-19 | 13F | Mcguire Capital Advisors Inc | 25 | 3 | ||||||
| 2026-02-11 | 13F | XML Financial, LLC | 17.902 | 0,00 | 1.863 | -0,27 | ||||
| 2026-01-12 | 13F | Focus Financial Network, Inc. | 26.329 | -24,04 | 2.739 | -24,21 | ||||
| 2026-01-22 | 13F | Financial Consulate, Inc | 185 | 0,00 | 19 | 0,00 | ||||
| 2026-02-03 | 13F | Arcadia Wealth Management, LLC | 47.779 | 0,54 | 4.971 | 0,28 | ||||
| 2026-02-13 | 13F | Commerce Bank | 4.116 | 0,00 | 428 | -0,23 | ||||
| 2026-02-06 | 13F | Fortis Group Advisors, LLC | 6 | 1 | ||||||
| 2026-02-17 | 13F | Creative Planning | 39.763 | -4,70 | 4.137 | -4,94 | ||||
| 2026-02-12 | 13F | StoneX Group Inc. | 2.805 | 0,00 | 292 | -0,34 | ||||
| 2026-01-14 | 13F | Spire Wealth Management | 630 | 23,77 | 66 | 22,64 | ||||
| 2026-01-20 | 13F | Stratos Wealth Partners, LTD. | 3.032 | 60.540,00 | 315 | |||||
| 2026-02-05 | 13F | Pinnacle Financial Group, LLC / IL | 21.833 | -4,37 | 2.271 | -4,62 | ||||
| 2026-02-11 | 13F | Gwn Securities Inc. | 13.573 | 3,45 | 1.412 | 3,22 | ||||
| 2026-01-13 | 13F | Cadent Capital Advisors, LLC | 2.026 | 0,15 | 211 | 0,00 | ||||
| 2026-02-10 | 13F | Savant Capital, LLC | 26.769 | 0,40 | 2.785 | 0,18 | ||||
| 2026-02-13 | 13F | Aptus Capital Advisors, LLC | 61.513 | -0,45 | 6.400 | -0,70 | ||||
| 2026-01-05 | 13F | Park Avenue Securities Llc | 76.561 | 24,37 | 8 | 16,67 | ||||
| 2026-02-13 | 13F | Destination Wealth Management | 2.407 | 0,00 | 250 | -0,40 | ||||
| 2026-02-11 | 13F | J.w. Cole Advisors, Inc. | 4.765 | -37,85 | 376 | -52,94 | ||||
| 2026-02-13 | 13F | B&D White Capital Company, LLC | 481.278 | -0,97 | 50.072 | -1,22 | ||||
| 2026-01-15 | 13F | Nilsine Partners, LLC | 2.400 | 0,00 | 250 | -0,40 | ||||
| 2026-01-29 | 13F | Jim Saulnier & Associates, Llc | 33.257 | -1,62 | 3.460 | -1,84 | ||||
| 2026-01-08 | 13F | Wealth Enhancement Advisory Services, Llc | 102.335 | -0,33 | 10.799 | 0,49 | ||||
| 2026-02-09 | 13F | Atlantic Trust, LLC | 495.827 | 1,78 | 51.586 | 1,53 | ||||
| 2026-02-17 | 13F | Evergreen Wealth Solutions, LLC | 2.217 | 231 | ||||||
| 2026-02-06 | 13F | Lloyd Advisory Services, LLC. | 843 | -95,43 | 88 | -95,48 | ||||
| 2026-02-11 | 13F | Capital Analysts, Inc. | 88 | 1,15 | 0 | |||||
| 2026-02-04 | 13F | Tsfg, Llc | 1.300 | 0,00 | 0 | |||||
| 2026-02-06 | 13F | Copia Wealth Management | 1 | 0 | ||||||
| 2026-01-29 | 13F | Kestra Private Wealth Services, Llc | 11.000 | 0,04 | 1.144 | -0,17 | ||||
| 2026-02-17 | 13F | MGB Wealth Management, LLC | 1.003 | 0,20 | 104 | 0,00 | ||||
| 2026-02-04 | 13F | Ameritas Advisory Services, LLC | 0 | -100,00 | 0 | |||||
| 2026-02-10 | 13F | Greenspring Advisors, LLC | 13.565 | 1.411 | ||||||
| 2026-01-21 | 13F | Sowell Financial Services LLC | 2.151 | -2,36 | 224 | -2,62 | ||||
| 2026-02-09 | 13F | Key FInancial Inc | 7.740 | 4,88 | 805 | 4,27 | ||||
| 2026-02-17 | 13F | Green Harvest Asset Management LLC | 2.250 | 0,00 | 234 | 0,00 | ||||
| 2026-01-26 | 13F | Cwm, Llc | 67.147 | -0,57 | 7 | -14,29 | ||||
| 2026-02-10 | 13F | Goldman Sachs Group Inc | 0 | -100,00 | 0 | |||||
| 2026-01-23 | 13F | Sage Mountain Advisors LLC | 100 | 0,00 | 10 | 0,00 | ||||
| 2026-01-26 | 13F | Courage Miller Partners, LLC | 5.180 | -0,44 | 539 | -0,74 | ||||
| 2026-02-11 | 13F | Cedar Point Capital Partners, LLC | 7.622 | -11,04 | 793 | -11,20 | ||||
| 2026-02-13 | 13F | SRS Capital Advisors, Inc. | 3.075 | 320 | ||||||
| 2026-02-06 | 13F | Larson Financial Group LLC | 500 | -3,29 | 52 | -1,89 | ||||
| 2026-02-02 | 13F | Woodard & Co Asset Management Group Inc /adv | 61.553 | -9,36 | 6.404 | -9,59 | ||||
| 2026-02-13 | 13F | Colony Group, LLC | 11.599 | 46,84 | 1.207 | 46,54 | ||||
| 2025-09-26 | NP | BLUC - Bluemonte Large Cap Core ETF | 3 | 0 | ||||||
| 2026-02-05 | 13F | Allworth Financial LP | 2.249 | 36,97 | 234 | 36,26 | ||||
| 2026-02-05 | 13F | Pinnacle Associates Ltd | 8.646 | 0,03 | 899 | -0,22 | ||||
| 2026-02-05 | 13F | AlphaCore Capital LLC | 3.800 | 33,33 | 395 | 33,00 | ||||
| 2026-01-12 | 13F | DAVENPORT & Co LLC | 15.036 | -8,52 | 1.564 | -8,75 | ||||
| 2026-02-17 | 13F | Tower Research Capital LLC (TRC) | 1.531 | -30,03 | 159 | -30,26 | ||||
| 2026-01-26 | 13F | Milestones Private Investment Advisors LLC | 8.955 | 0,00 | 932 | -0,21 | ||||
| 2026-01-29 | 13F | Nbc Securities, Inc. | 720 | 0,00 | 75 | -1,33 | ||||
| 2026-02-13 | 13F | Mlp3, Llc | 2.000 | 208 | ||||||
| 2026-01-15 | 13F | Trinity Wealth Management, LLC | 0 | -100,00 | 0 | |||||
| 2026-02-17 | 13F | Fairview Capital Investment Management, Llc | 9.093 | 0,00 | 946 | -0,21 | ||||
| 2026-02-12 | 13F | Kovack Advisors, Inc. | 3.893 | 9,57 | 351 | -5,41 | ||||
| 2026-02-06 | 13F | McKinley Carter Wealth Services, Inc. | 368.249 | -17,14 | 38.313 | -17,35 | ||||
| 2026-02-12 | 13F | Brinker Capital Investments, LLC | 22.850 | 8,46 | 2.377 | 8,19 | ||||
| 2026-02-13 | 13F | Neuberger Berman Group LLC | 15.557 | 0,00 | 1.619 | -0,25 | ||||
| 2026-02-17 | 13F | SageView Advisory Group, LLC | 950 | 99 | ||||||
| 2026-02-17 | 13F | Royal Bank Of Canada | 106.590 | 21,71 | 11.090 | 21,41 | ||||
| 2026-01-13 | 13F | LongView Wealth Management | 147.068 | -4,67 | 15.574 | -3,21 | ||||
| 2026-02-10 | 13F | AdvisorShares Investments LLC | 0 | -100,00 | 0 | |||||
| 2026-01-22 | 13F | Paragon Capital Management Ltd | 3.834 | 0,00 | 399 | -0,25 | ||||
| 2026-02-10 | 13F | Nvest Financial, LLC | 8.504 | 4,79 | 885 | 4,49 | ||||
| 2026-01-06 | 13F | Fulcrum Equity Management | 2.530 | -2,01 | 263 | -2,23 | ||||
| 2026-02-12 | 13F | Financial Engines Advisors L.L.C. | 16.501 | -4,67 | 1.717 | -4,93 | ||||
| 2026-01-21 | 13F | Avantra Family Wealth, Inc. | 5.400 | 0,00 | 562 | -0,36 | ||||
| 2026-02-03 | 13F | Indivisible Partners | 5.708 | 594 | ||||||
| 2026-02-12 | 13F | Elevation Wealth Management LLC | 2.906 | 302 | ||||||
| 2026-02-13 | 13F | Johnson Investment Counsel Inc | 0 | -100,00 | 0 | |||||
| 2025-11-14 | 13F | Full Sail Capital, LLC | 13.157 | -4,08 | 1.372 | 3,24 | ||||
| 2026-01-16 | 13F | BridgePort Financial Solutions, LLC | 2.468 | 0,00 | 257 | -0,39 | ||||
| 2026-01-20 | 13F | FLP Wealth Management, LLC | 0 | -100,00 | 0 | |||||
| 2026-02-03 | 13F | Patten & Patten Inc/tn | 6.222 | 0,00 | 647 | -0,15 | ||||
| 2026-02-13 | 13F | GM Advisory Group, Inc. | 333.245 | 16,49 | 34.671 | 16,19 | ||||
| 2026-02-17 | 13F | Wiley Bros.-aintree Capital, Llc | 57.998 | 3,65 | 6.036 | 3,41 | ||||
| 2026-02-03 | 13F | Retirement Planning Group | 41.838 | -0,23 | 4.353 | -0,48 | ||||
| 2025-11-07 | 13F | Atticus Wealth Management, Llc | 0 | -100,00 | 0 | |||||
| 2026-01-12 | 13F | Evanson Asset Management, LLC | 3.100 | 0,00 | 323 | -0,31 | ||||
| 2026-01-23 | 13F | Halbert Hargrove Global Advisors, Llc | 1.796 | -11,13 | 187 | -11,43 | ||||
| 2026-02-18 | 13F | EP Wealth Advisors, Inc. | 3.211 | -1,44 | 334 | 6,03 | ||||
| 2026-02-12 | 13F | Adviser Investments LLC | 26.186 | 0,00 | 2.724 | -0,26 | ||||
| 2026-02-17 | 13F | Raymond James Financial Inc | 221.438 | -19,84 | 23.038 | -20,05 | ||||
| 2026-01-12 | 13F | Kaydan Wealth Management, Inc. | 2.750 | 0,00 | 286 | 0,00 | ||||
| 2026-02-17 | 13F | Wealth Watch Advisors, INC | 1.026 | 0,00 | 107 | -0,93 | ||||
| 2026-02-23 | 13F | Floyd Financial Group Llc | 2.000 | 0,00 | 204 | -1,92 | ||||
| 2026-02-05 | 13F | Atria Investments Llc | 5.648 | 17,79 | 588 | 17,40 | ||||
| 2026-01-05 | 13F | Holos Integrated Wealth LLC | 36 | 0,00 | 4 | 0,00 | ||||
| 2026-01-20 | 13F | Accel Wealth Management | 4.354 | 0,05 | 453 | 0,00 | ||||
| 2026-01-14 | 13F | Wealthcare Advisory Partners LLC | 8.444 | 19,54 | 879 | 19,29 | ||||
| 2026-01-30 | 13F | American Financial & Tax Strategies Inc | 49.926 | -0,36 | 5.194 | -0,61 | ||||
| 2026-01-20 | 13F | Thurston, Springer, Miller, Herd & Titak, Inc. | 8.000 | 832 | ||||||
| 2026-01-15 | 13F | Towerpoint Wealth, LLC | 16.802 | 5,67 | 1.748 | 5,43 | ||||
| 2026-02-13 | 13F | Financial Freedom, LLC | 44 | 0,00 | 5 | 0,00 | ||||
| 2026-01-22 | 13F | Triad Wealth Partners, LLC | 11.355 | 4,80 | 1.181 | 4,51 | ||||
| 2026-01-26 | 13F | Steinberganna Wealth Management | 31.538 | -2,03 | 3.281 | -2,26 | ||||
| 2026-02-11 | 13F | Cornerstone Financial Group, LLC /NE/ | 5.032 | 0,14 | 524 | -0,19 | ||||
| 2026-02-11 | 13F | LPL Financial LLC | 1.381.151 | 6,70 | 143.695 | 6,43 | ||||
| 2026-02-06 | 13F | Csenge Advisory Group | 13.032 | -2,83 | 1.356 | -3,08 | ||||
| 2026-01-23 | 13F | Assetmark, Inc | 22.995 | 43,47 | 2.392 | 43,15 | ||||
| 2026-02-05 | 13F | Cornerstone Wealth Management, LLC | 110.325 | -0,83 | 11.478 | -1,07 | ||||
| 2026-02-04 | 13F | Pensionmark Financial Group, Llc | 3.740 | 4,32 | 389 | 4,29 | ||||
| 2026-01-26 | 13F | Kiley Juergens Wealth Management, Llc | 143.882 | -2,13 | 14.969 | -2,37 | ||||
| 2026-01-12 | 13F | GenWealth Group, Inc. | 31.383 | -0,09 | 3.312 | 1,07 | ||||
| 2026-01-08 | 13F | MKT Advisors LLC | 5.808 | 0,02 | 609 | 0,16 | ||||
| 2026-01-27 | 13F | 5T Wealth, LLC | 2.051 | -0,39 | 213 | -0,47 | ||||
| 2026-02-13 | 13F | Beacon Financial Advisory LLC | 19.279 | -0,77 | 2.006 | -1,04 | ||||
| 2026-02-17 | 13F | Advisory Services Network, LLC | 28.380 | 6,38 | 2.953 | 6,11 | ||||
| 2026-02-03 | 13F | We Are One Seven, LLC | 1.966 | 205 | ||||||
| 2026-02-10 | 13F | Gw Henssler & Associates Ltd | 7.677 | -0,42 | 799 | -0,75 | ||||
| 2025-11-18 | 13F | Kozak & Associates, Inc. | 0 | -100,00 | 0 | |||||
| 2026-02-13 | 13F | Pinnacle Wealth Planning Services, Inc. | 98 | 10 | ||||||
| 2026-01-27 | 13F | Joel Adams & Associates, Inc. | 2.943 | -2,58 | 306 | -2,86 | ||||
| 2026-01-20 | 13F | SOA Wealth Advisors, LLC. | 2.712 | 0,04 | 282 | 0,00 | ||||
| 2026-01-26 | 13F | Roof Eidam & Maycock/adv | 4.250 | 0,00 | 442 | -0,23 | ||||
| 2026-02-02 | 13F | Oppenheimer & Co Inc | 2.346 | 0,00 | 244 | 0,00 | ||||
| 2025-09-26 | NP | BLUX - Bluemonte Dynamic Total Market ETF | 50 | 5 | ||||||
| 2026-02-10 | 13F | Lido Advisors, LLC | 12.460 | 11,94 | 1.299 | 11,89 | ||||
| 2026-01-22 | 13F | Pinnacle Bancorp, Inc. | 13.505 | 0,00 | 1.405 | -0,21 | ||||
| 2026-01-26 | 13F | Cornerstone Wealth Group, LLC | 4.860 | 0,00 | 506 | -0,20 | ||||
| 2026-02-17 | 13F | Prosperity Consulting Group, LLC | 17.309 | 15,10 | 1.801 | 14,80 | ||||
| 2026-02-10 | 13F | Valpey Financial Services, LLC | 474.901 | 10.289,43 | 5 | -99,16 | ||||
| 2026-02-11 | 13F | Goodman Advisory Group, LLC | 2.477 | -98,66 | 258 | -98,67 | ||||
| 2026-01-14 | 13F | ORG Partners LLC | 2.622 | 30,77 | 273 | 25,93 | ||||
| 2026-02-06 | 13F | IFP Advisors, Inc | 104 | 46,48 | 11 | 42,86 | ||||
| 2026-02-17 | 13F | IHT Wealth Management, LLC | 57.600 | -1,05 | 5.993 | -1,30 | ||||
| 2026-02-17 | 13F | Fortune 45 LLC | 6.935 | 0,14 | 723 | 0,56 | ||||
| 2026-02-10 | 13F | MidAtlantic Capital Management, Inc. | 534 | 56 | ||||||
| 2026-02-17 | 13F | Citadel Advisors Llc | 0 | -100,00 | 0 | |||||
| 2026-02-13 | 13F | Mariner, LLC | 138.358 | 10,60 | 14.397 | 10,34 | ||||
| 2026-02-17 | 13F | Equitable Holdings, Inc. | 2.328.126 | -0,39 | 242.218 | -0,64 | ||||
| 2026-02-03 | 13F | RFG Advisory, LLC | 2.307 | -93,96 | 240 | -93,97 | ||||
| 2026-02-05 | 13F | Cambridge Investment Research Advisors, Inc. | 81.696 | -19,61 | 8 | -20,00 | ||||
| 2026-02-18 | 13F | Financial Advisory Service, Inc. | 586.634 | -2,20 | 61.033 | -2,44 | ||||
| 2026-01-30 | 13F | Us Bancorp \de\ | 6.795 | 133,67 | 707 | 133,00 | ||||
| 2026-02-17 | 13F | Cape Investment Advisory, Inc. | 20.955 | 523.775,00 | 2.180 | |||||
| 2025-10-30 | 13F | Elevation Capital Advisory, LLC | 0 | -100,00 | 0 | |||||
| 2026-02-06 | 13F | Signature Estate & Investment Advisors Llc | 5.546 | -12,27 | 577 | -12,44 | ||||
| 2026-02-17 | 13F | Gladstone Institutional Advisory LLC | 35.065 | 117,46 | 3.648 | 117,01 | ||||
| 2026-01-13 | 13F | Signature Securities Group Corporation | 4.976 | -0,36 | 518 | -0,58 | ||||
| 2026-01-20 | 13F | Signaturefd, Llc | 680 | 0,00 | 71 | 0,00 | ||||
| 2026-01-21 | 13F | Sunburst Financial Group, LLC | 56.130 | -0,49 | 5.840 | -0,75 | ||||
| 2026-02-13 | 13F | Motiv8 Investments LLC | 15 | 0 | ||||||
| 2026-01-28 | 13F | Geneos Wealth Management Inc. | 15.150 | 6,42 | 1.576 | 6,20 | ||||
| 2026-02-12 | 13F | BlackRock, Inc. | 4.211 | 438 | ||||||
| 2026-02-02 | 13F | Fifth Third Bancorp | 1.960 | 5,95 | 204 | 5,73 | ||||
| 2026-01-23 | 13F | Farther Finance Advisors, LLC | 79.438 | 949,66 | 8.265 | 947,40 | ||||
| 2025-10-23 | 13F | Ethos Financial Group, LLC | 0 | -100,00 | 0 | -100,00 | ||||
| 2026-02-12 | 13F | Commonwealth Equity Services, Llc | 349.598 | -3,56 | 36.372 | 98.202,70 | ||||
| 2026-01-28 | 13F | Dentgroup LLC | 49.380 | -1,13 | 5.137 | -1,38 | ||||
| 2026-02-04 | 13F | LRI Investments, LLC | 7.230 | 0,00 | 752 | -0,27 | ||||
| 2026-02-12 | 13F | Wealthspire Advisors, LLC | 4.647 | 0,32 | 483 | 0,00 | ||||
| 2025-10-08 | 13F | Patriot Financial Group Insurance Agency, LLC | 0 | -100,00 | 0 | |||||
| 2026-02-17 | 13F | Twin Focus Capital Partners, Llc | 35.571 | 1,22 | 3.701 | 0,95 | ||||
| 2025-11-14 | 13F | Old Mission Capital Llc | 0 | -100,00 | 0 | |||||
| 2026-01-13 | 13F | Mather Group, Llc. | 5.837 | 0,00 | 607 | -0,16 | ||||
| 2026-02-13 | 13F | Citigroup Inc | 33.317 | -17,42 | 3.466 | -17,61 | ||||
| 2026-02-17 | 13F | Mercer Global Advisors Inc /adv | 15.506 | -42,00 | 1.613 | -42,14 | ||||
| 2026-01-21 | 13F | Paladin Advisory Group, LLC | 4.490 | 0,00 | 467 | -0,21 | ||||
| 2026-02-17 | 13F | Jones Financial Companies Lllp | 20.398 | 51,07 | 2.122 | 52,22 | ||||
| 2026-02-13 | 13F | Transamerica Financial Advisors, Inc. | 46 | -2,13 | 5 | 0,00 | ||||
| 2026-01-30 | 13F | North Star Investment Management Corp. | 24.064 | -2,55 | 2.504 | -2,80 | ||||
| 2026-01-22 | 13F | Mh & Associates Securities Management Corp /adv | 200 | 21 | ||||||
| 2026-02-10 | 13F | Goldstein Advisors, LLC | 9.470 | 0,00 | 985 | -0,20 | ||||
| 2026-02-17 | 13F | Fmr Llc | 31.601 | 4,83 | 3.288 | 4,55 |