Grundlæggende statistik
| Institutionelle ejere | 329 total, 329 long only, 0 short only, 0 long/short - change of 4,06% MRQ |
| Gennemsnitlig porteføljeallokering | 0.5712 % - change of -4,04% MRQ |
| Institutionelle aktier (lange) | 104.511.248 (ex 13D/G) - change of 2,97MM shares 2,93% MRQ |
| Institutionel værdi (lang) | $ 2.390.363 USD ($1000) |
Institutionelt ejerskab og aktionærer
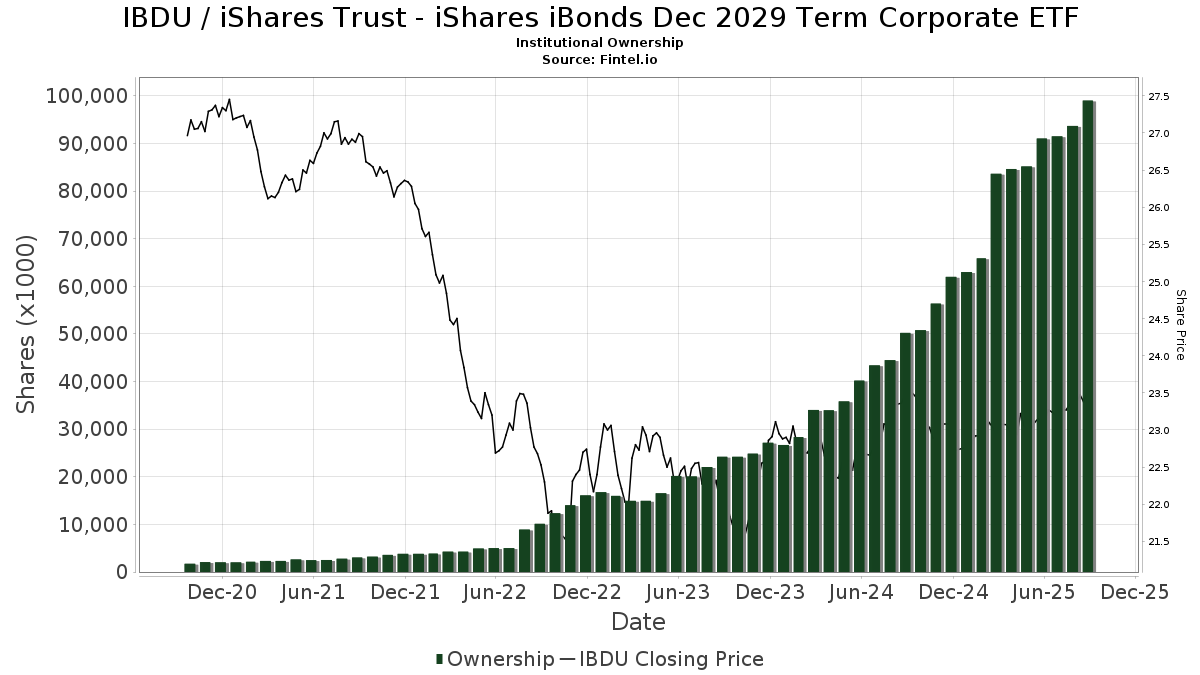
iShares Trust - iShares iBonds Dec 2029 Term Corporate ETF (US:IBDU) har 329 institutionelle ejere og aktionærer, der har indsendt 13D/G- eller 13F-formularer til Securities Exchange Commission (SEC). Disse institutioner har i alt 104,511,248 aktier. Største aktionærer omfatter Bank Of America Corp /de/, Aptus Capital Advisors, LLC, DRSK - Aptus Defined Risk ETF, Morgan Stanley, Capital Advisors Inc/ok, Capital Investment Advisors, LLC, Mercer Global Advisors Inc /adv, Shufro Rose & Co Llc, UBS Group AG, and Raymond James Financial Inc .
iShares Trust - iShares iBonds Dec 2029 Term Corporate ETF (ARCA:IBDU) institutionel ejerskabsstruktur viser aktuelle positioner i virksomheden efter institutioner og fonde, samt seneste ændringer i positionsstørrelse. Større aktionærer kan omfatte individuelle investorer, investeringsforeninger, hedgefonde eller institutioner. Skema 13D angiver, at investoren besidder (eller besidder) mere end 5 % af virksomheden og har til hensigt (eller har til hensigt at) aktivt at forfølge en ændring i forretningsstrategi. Skema 13G indikerer en passiv investering på over 5%.
The share price as of January 22, 2026 is 23,43 / share. Previously, on January 23, 2025, the share price was 22,82 / share. This represents an increase of 2,67% over that period.
Fondens stemningsscore
Fund Sentiment Score (fka Ownership Accumulation Score) finder de aktier, der bliver mest købt af fonde. Det er resultatet af en sofistikeret, multi-faktor kvantitativ model, der identificerer virksomheder med de højeste niveauer af institutionel akkumulering. Scoringsmodellen bruger en kombination af den samlede stigning i oplyste ejere, ændringerne i porteføljeallokeringer i disse ejere og andre målinger. Tallet går fra 0 til 100, hvor højere tal indikerer et højere niveau af akkumulering for sine jævnaldrende, og 50 er gennemsnittet.
Opdateringsfrekvens: Dagligt
Se Ownership Explorer, som giver en liste over højest rangerende virksomheder.
AI+ Ask Fintel’s AI assistant about iShares Trust - iShares iBonds Dec 2029 Term Corporate ETF.
Select a question to share a public post with an AI-crafted answer.
Thinking of good questions…
Institutionel Put/Call-forhold
Ud over at indberette standardaktie- og gældsudstedelser skal institutter med mere end 100 mill. aktiver under forvaltning også oplyse deres put- og call-optionsbeholdninger. Da salgsoptioner generelt indikerer negativ stemning, og købsoptioner indikerer positiv stemning, kan vi få en fornemmelse af den overordnede institutionelle stemning ved at plotte forholdet mellem put og kald. Diagrammet til højre viser det historiske put/call-forhold for dette instrument.
Brug af Put/Call Ratio som en indikator for investorernes stemning overvinder en af de vigtigste mangler ved at bruge totalt institutionelt ejerskab, som er, at en betydelig mængde af aktiver under forvaltning investeres passivt for at spore indekser. Passivt forvaltede fonde køber typisk ikke optioner, så indikatoren for put/call-forholdet følger mere nøje følelsen af aktivt forvaltede fonde.
13F og NPORT arkivering
Detaljer om 13F-arkivering er gratis. Detaljer om NP-ansøgninger kræver et premium-medlemskab. Grønne rækker angiver nye positioner. Røde rækker angiver lukkede positioner. Klik på linket ikon for at se den fulde transaktionshistorik.
Opgrader
for at låse premium-data op og eksportere til Excel ![]() .
.
| Fil dato | Kilde | Investor | Type | Gennemsnitlig pris (Øst) |
Aktier | Δ Aktier (%) |
Rapporteret Værdi ($1000) |
Δ Værdi (%) |
Port Alloc (%) |
|
|---|---|---|---|---|---|---|---|---|---|---|
| 2026-01-08 | 13F | Wealth Enhancement Advisory Services, Llc | 92.427 | 7,53 | 2.166 | 7,55 | ||||
| 2025-11-05 | 13F | Envestnet Asset Management Inc | 353.520 | -86,64 | 8.297 | -86,56 | ||||
| 2025-11-10 | 13F | Hartland & Co., LLC | 23.701 | 17,97 | 556 | 18,80 | ||||
| 2026-01-23 | 13F | Gilbert Capital Group, Inc. | 45.122 | 5,04 | 1.056 | 4,76 | ||||
| 2025-11-06 | 13F | Costello Asset Management, INC | 0 | -100,00 | 0 | -100,00 | ||||
| 2025-11-10 | 13F | Journey Advisory Group, LLC | 47.300 | 0,00 | 1.110 | 0,63 | ||||
| 2026-01-08 | 13F | Adirondack Trust Co | 122.958 | 11,00 | 2.877 | 10,74 | ||||
| 2026-01-20 | 13F | Mendota Financial Group, LLC | 39.295 | 1,56 | 920 | 1,21 | ||||
| 2025-11-07 | 13F | Accretive Wealth Partners, LLC | 8.654 | 0,00 | 203 | 1,00 | ||||
| 2026-01-12 | 13F | RVW Wealth, LLC | 1.059.999 | 12,79 | 24.809 | 12,48 | ||||
| 2025-10-31 | 13F | Cabot Wealth Management Inc | 78.128 | 4,67 | 1.834 | 5,28 | ||||
| 2026-01-14 | 13F | Eastern Bank | 1.275 | 0,00 | 30 | 0,00 | ||||
| 2025-11-19 | 13F/A | Regions Financial Corp | 73.173 | 22,60 | 1.717 | 23,35 | ||||
| 2025-10-21 | 13F | Commonwealth Financial Services, LLC | 416.338 | 2,67 | 9.771 | 3,29 | ||||
| 2026-01-20 | 13F | LifePlan Financial, LLC | 115.595 | 1,70 | 2.706 | 1,42 | ||||
| 2025-10-24 | 13F | We Are One Seven, LLC | 11.400 | -30,81 | 268 | -30,47 | ||||
| 2025-11-07 | 13F/A | Merit Financial Group, LLC | 126.825 | 23,83 | 2.977 | 24,57 | ||||
| 2025-10-27 | 13F | Janney Montgomery Scott LLC | 491.795 | 8,58 | 12 | 10,00 | ||||
| 2026-01-09 | 13F | Montecito Bank & Trust | 39.620 | 25,32 | 927 | 25,10 | ||||
| 2026-01-15 | 13F | Windsor Capital Management, LLC | 524.522 | 1,56 | 12.276 | 1,28 | ||||
| 2025-11-05 | 13F | Key FInancial Inc | 642 | 15 | ||||||
| 2025-11-13 | 13F | Brown Brothers Harriman & Co | 7.000 | 0,00 | 164 | 0,61 | ||||
| 2025-11-14 | 13F | Tower Research Capital LLC (TRC) | 2.654 | -59,17 | 62 | -58,94 | ||||
| 2025-10-02 | 13F | Bank of New Hampshire | 42.040 | 5,52 | 987 | 6,14 | ||||
| 2025-10-23 | 13F | Duncker Streett & Co Inc | 24.754 | -5,62 | 581 | -5,07 | ||||
| 2025-11-13 | 13F | Bank Of Montreal /can/ | 21.277 | 2,69 | 499 | 3,53 | ||||
| 2025-11-14 | 13F | Ameriprise Financial Inc | 965.631 | -31,31 | 22.660 | -30,90 | ||||
| 2026-01-05 | 13F | Park Avenue Securities Llc | 0 | -100,00 | 0 | |||||
| 2025-10-24 | 13F | Madden Advisory Services, Inc. | 44.893 | 23,79 | 1.054 | 24,47 | ||||
| 2025-10-23 | 13F | Foundry Financial Group, Inc. | 47.078 | 36,81 | 1.105 | 37,66 | ||||
| 2025-11-04 | 13F | Keeler THomas Management LLC | 186.102 | 0,38 | 4.368 | 0,97 | ||||
| 2025-10-28 | 13F | Foundation Wealth Management, LLC | 21.874 | 12,15 | 513 | 12,75 | ||||
| 2025-10-15 | 13F | Cwm, Llc | 210.204 | 4,33 | 5 | 0,00 | ||||
| 2025-11-20 | 13F | Asset Dedication, LLC | 325 | 0,00 | 8 | 0,00 | ||||
| 2026-01-21 | 13F | Sowell Financial Services LLC | 187.194 | 7,40 | 4.381 | 7,11 | ||||
| 2025-10-20 | 13F | Great Diamond Partners, LLC | 22.721 | 533 | ||||||
| 2025-10-24 | 13F | Phillips Financial Management, Llc | 9.251 | 0,00 | 217 | 0,93 | ||||
| 2025-10-28 | 13F | Gratus Wealth Advisors, LLC | 1.381.528 | 2,78 | 32.424 | 3,40 | ||||
| 2026-01-23 | 13F | Nbt Bank N A /ny | 0 | -100,00 | 0 | |||||
| 2025-10-29 | 13F | Howland Capital Management Llc | 868.989 | 9,41 | 20.395 | 10,06 | ||||
| 2025-11-03 | 13F | Knights of Columbus Asset Advisors LLC | 1.239 | 0,00 | 29 | 3,57 | ||||
| 2025-11-07 | 13F | Jacobi Capital Management LLC | 0 | -100,00 | 0 | -100,00 | ||||
| 2026-01-22 | 13F | HHM Wealth Advisors, LLC | 3.830 | 90 | ||||||
| 2026-01-15 | 13F | Capital Advisors Inc/ok | 4.798.655 | 2,82 | 112.313 | 2,53 | ||||
| 2025-11-03 | 13F | Hallmark Capital Management Inc | 28.766 | -1,37 | 675 | -0,74 | ||||
| 2026-01-21 | 13F | Flagship Harbor Advisors, Llc | 5.625 | 132 | ||||||
| 2026-01-15 | 13F | PFG Private Wealth Management, LLC | 342.582 | 8.018 | ||||||
| 2026-01-15 | 13F | Ironwood Financial, llc | 537.151 | 7,46 | 12.575 | 7,19 | ||||
| 2026-01-20 | 13F | Stratos Wealth Partners, LTD. | 181.576 | 66,95 | 4.250 | 66,50 | ||||
| 2025-11-03 | 13F | Golden State Wealth Management, LLC | 67 | 2 | ||||||
| 2025-11-03 | 13F | Truist Financial Corp | 91.673 | -0,89 | 2.152 | -0,28 | ||||
| 2025-11-13 | 13F | FourThought Financial Partners, LLC | 66.100 | 134,00 | 1.551 | 135,36 | ||||
| 2026-01-15 | 13F | Rebalance, Llc | 435.397 | 1,55 | 10.190 | 1,27 | ||||
| 2025-10-21 | 13F | Vishria Bird Financial Group, LLC | 826.064 | 19.388 | ||||||
| 2025-11-14 | 13F | Mercer Global Advisors Inc /adv | 3.537.860 | 26,37 | 83.074 | 27,19 | ||||
| 2026-01-14 | 13F | Romano Brothers And Company | 64.341 | 78,29 | 1.506 | 77,90 | ||||
| 2025-11-17 | 13F | Hancock Whitney Corp | 218.234 | 5,44 | 5.122 | 6,07 | ||||
| 2026-01-05 | 13F | Coastline Trust Co | 1.480 | 0,00 | 35 | 0,00 | ||||
| 2025-10-06 | 13F | Venture Visionary Partners LLC | 1.294.318 | -15,04 | 30.378 | -14,53 | ||||
| 2025-10-09 | 13F | Pacifica Partners Inc. | 0 | -100,00 | 0 | -100,00 | ||||
| 2025-11-07 | 13F | Pnc Financial Services Group, Inc. | 689 | 1,03 | 16 | 6,67 | ||||
| 2025-11-10 | 13F | Frisch Financial Group, Inc. | 172.269 | 1,27 | 4.043 | 134.666,67 | ||||
| 2025-11-12 | 13F | First International Bank of Israel Ltd. | 395.000 | 0,00 | 9.271 | 0,60 | ||||
| 2026-01-21 | 13F | Jefferson Bridge Capital, LLC | 68.974 | 1.614 | ||||||
| 2025-11-13 | 13F | Banque Cantonale Vaudoise | 15.187 | 58,63 | 0 | |||||
| 2026-01-21 | 13F | Woodmont Investment Counsel Llc | 1.745.523 | 0,86 | 40.854 | 0,58 | ||||
| 2025-11-13 | 13F | UBS Group AG | 3.067.945 | 56,06 | 72.005 | 57,00 | ||||
| 2026-01-12 | 13F | Kozak & Associates, Inc. | 0 | -100,00 | 0 | |||||
| 2025-11-06 | 13F | CENTRAL TRUST Co | 327.308 | 7,04 | 7.682 | 7,68 | ||||
| 2026-01-14 | 13F | Praetorian Wealth Management, Inc. | 270.419 | 10,45 | 6.329 | 10,15 | ||||
| 2026-01-20 | 13F | SOA Wealth Advisors, LLC. | 162 | 0,00 | 4 | 0,00 | ||||
| 2025-11-13 | 13F | Dorsey & Whitney Trust CO LLC | 26.000 | 0,00 | 610 | 0,66 | ||||
| 2026-01-20 | 13F | Monticello Wealth Management, Llc | 21.682 | 0,00 | 507 | -0,20 | ||||
| 2025-11-17 | 13F | Peloton Wealth Strategists | 342.150 | 0,22 | 8 | 14,29 | ||||
| 2025-11-12 | 13F | Aptus Capital Advisors, LLC | 5.444.286 | 8,23 | 127.777 | 8,88 | ||||
| 2025-11-14 | 13F | Equitable Holdings, Inc. | 15.193 | 65,45 | 357 | 66,36 | ||||
| 2025-11-10 | 13F | Heartland Bank & Trust Co | 18.718 | 16,33 | 439 | 17,07 | ||||
| 2025-11-14 | 13F | Stokes Family Office, LLC | 24.349 | 0,00 | 571 | 0,53 | ||||
| 2025-11-03 | 13F | 4Thought Financial Group Inc. | 181.845 | 4,78 | 4.268 | 5,38 | ||||
| 2025-11-13 | 13F | Parallel Advisors, LLC | 266.511 | 4,38 | 6.255 | 5,00 | ||||
| 2025-11-12 | 13F | Harbour Investments, Inc. | 9.183 | 13,52 | 216 | 14,36 | ||||
| 2025-11-05 | 13F | Fullcircle Wealth Llc | 8.920 | 0,00 | 208 | 0,00 | ||||
| 2025-11-06 | 13F | Ameritas Advisory Services, LLC | 31 | 0,00 | 1 | |||||
| 2026-01-14 | 13F | Conrad Siegel Investment Advisors, Inc. | 25.279 | 146,82 | 592 | 146,25 | ||||
| 2025-10-22 | 13F | Northstar Group, Inc. | 0 | -100,00 | 0 | -100,00 | ||||
| 2025-11-14 | 13F | Envision Financial Planning, LLC | 592.058 | 15,63 | 13.896 | 16,32 | ||||
| 2025-11-14 | 13F | STAR Financial Bank | 40.034 | -68,68 | 940 | -68,51 | ||||
| 2025-11-18 | 13F | Reliant Wealth Planning | 38.575 | 0,00 | 905 | 0,67 | ||||
| 2026-01-21 | 13F | Ledyard National Bank | 16.270 | 2,84 | 381 | 2,43 | ||||
| 2025-11-05 | 13F | MONECO Advisors, LLC | 101.928 | 2,57 | 2.392 | 3,19 | ||||
| 2025-10-28 | 13F | Baron Silver Stevens Financial Advisors, Llc | 0 | -100,00 | 0 | |||||
| 2025-09-24 | NP | LDRC - iShares iBonds 1-5 Year Corporate Ladder ETF | 77.738 | -0,76 | 1.809 | -0,55 | ||||
| 2025-08-14 | 13F | EP Wealth Advisors, Inc. | 25.421 | 47,09 | 593 | 48,62 | ||||
| 2026-01-05 | 13F | GAMMA Investing LLC | 5.284 | 9,35 | 124 | 8,85 | ||||
| 2026-01-13 | 13F | Stephens Consulting, LLC | 1.583 | 37 | ||||||
| 2025-11-14 | 13F | Godshalk Welsh Capital Management, Inc. | 66.450 | 44,77 | 1.560 | 45,70 | ||||
| 2026-01-12 | 13F | Quantum Financial Advisors, LLC | 0 | -100,00 | 0 | |||||
| 2025-10-29 | 13F | Sigma Investment Counselors Inc | 1.485.226 | 2,98 | 34.858 | 3,60 | ||||
| 2025-11-12 | 13F | Freestone Capital Holdings, LLC | 47.685 | 1.119 | ||||||
| 2025-11-10 | 13F | Dearborn Partners Llc | 26.137 | 7,54 | 613 | 8,11 | ||||
| 2025-11-13 | 13F | Members Wealth Llc | 169.932 | 36,30 | 3.985 | 38,19 | ||||
| 2025-11-03 | 13F | Sightline Wealth Advisors, LLC | 37.733 | 18,14 | 886 | 18,79 | ||||
| 2025-11-03 | 13F | Little House Capital Llc | 50.625 | 2,05 | 1.188 | 2,68 | ||||
| 2025-11-04 | 13F | UMA Financial Services, Inc. | 2.300 | 0,00 | 54 | 0,00 | ||||
| 2025-11-12 | 13F | Mosaic Family Wealth Partners, Llc | 11.102 | 5,50 | 261 | 6,12 | ||||
| 2026-01-15 | 13F | McGlone Suttner Wealth Management, Inc. | 59.157 | 42,82 | 1.385 | 42,39 | ||||
| 2025-11-13 | 13F | Meiji Yasuda Life Insurance Co | 688.000 | 54,26 | 16.147 | 55,19 | ||||
| 2025-11-12 | 13F | Shufro Rose & Co Llc | 3.503.960 | -1,02 | 81.047 | -1,02 | ||||
| 2025-11-13 | 13F | Wells Fargo & Company/mn | 2.036.273 | 10,01 | 47.791 | 10,67 | ||||
| 2025-11-14 | 13F | Northwestern Mutual Wealth Management Co | 390.755 | 12,37 | 9.171 | 13,05 | ||||
| 2025-10-28 | 13F | Littlejohn Financial Services, Inc. | 140.594 | 4,40 | 3.300 | 5,03 | ||||
| 2025-11-14 | 13F | Susquehanna International Group, Llp | 0 | -100,00 | 0 | -100,00 | ||||
| 2025-11-14 | 13F | Logan Capital Management Inc | 293 | 8,92 | 7 | 0,00 | ||||
| 2025-10-29 | 13F | Element Wealth, LLC | 13.283 | 9,19 | 312 | 9,89 | ||||
| 2025-11-12 | 13F | Bradley & Co. Private Wealth Management, LLC | 18.385 | 0,00 | 431 | 0,70 | ||||
| 2025-11-14 | 13F | Royal Bank Of Canada | 2.070.602 | 11,62 | 48.596 | 12,28 | ||||
| 2025-11-06 | 13F | Lyell Wealth Management, Lp | 399.233 | 9,16 | 9.370 | 9,81 | ||||
| 2025-11-14 | 13F | United Capital Financial Advisers, Llc | 115.377 | 23,33 | 2.708 | 24,06 | ||||
| 2025-11-14 | 13F | Advisor Group Holdings, Inc. | 113.940 | 64,43 | 2.674 | 65,47 | ||||
| 2026-01-07 | 13F | DecisionMap Wealth Management, LLC | 29.563 | 15,78 | 692 | 15,36 | ||||
| 2026-01-15 | 13F | Archford Capital Strategies, LLC | 52.645 | -0,91 | 1.232 | -1,12 | ||||
| 2026-01-21 | 13F | Sound Income Strategies, LLC | 1.000 | 0,00 | 23 | 0,00 | ||||
| 2025-11-17 | 13F | American Trust | 22.865 | 537 | ||||||
| 2025-10-31 | 13F | Bank of Jackson Hole Trust | 3.682 | -12,38 | 86 | -12,24 | ||||
| 2025-10-31 | 13F | Drive Wealth Management, Llc | 69.125 | -0,40 | 1.622 | 0,19 | ||||
| 2026-01-16 | 13F | Cyr Financial Inc. | 61.613 | 0,75 | 1.442 | 0,49 | ||||
| 2025-11-06 | 13F | BridgePort Financial Solutions, LLC | 0 | -100,00 | 0 | -100,00 | ||||
| 2025-11-14 | 13F | Kestra Advisory Services, LLC | 547.786 | 2,07 | 12.857 | 2,68 | ||||
| 2025-08-14 | 13F | Jane Street Group, Llc | 0 | -100,00 | 0 | -100,00 | ||||
| 2025-11-12 | 13F | Steward Partners Investment Advisory, Llc | 11.449 | 2,29 | 269 | 2,68 | ||||
| 2025-10-30 | 13F | Naples Global Advisors, Llc | 20.245 | 26,37 | 475 | 27,35 | ||||
| 2026-01-06 | 13F | Advance Capital Management, Inc. | 70.735 | 1.656 | ||||||
| 2026-01-22 | 13F | Cliftonlarsonallen Wealth Advisors, Llc | 106.192 | -0,15 | 2.485 | -0,44 | ||||
| 2026-01-15 | 13F | Brookstone Capital Management | 31.896 | -0,60 | 747 | -0,93 | ||||
| 2025-10-17 | 13F | Actinver Wealth Management, Inc. | 34.629 | 0,37 | 813 | 1,00 | ||||
| 2025-12-02 | 13F | Allworth Financial LP | 102.876 | 30,43 | 2.415 | 31,20 | ||||
| 2026-01-08 | 13F | Threadgill Financial, Llc | 15.249 | 882 | ||||||
| 2025-11-18 | 13F | Advisory Services Network, LLC | 14.473 | 16,50 | 340 | 17,30 | ||||
| 2026-01-20 | 13F | Austin Private Wealth, LLC | 23.762 | -3,99 | 556 | -4,14 | ||||
| 2025-11-10 | 13F | Cary Street Partners Financial Llc | 54.341 | 3,85 | 1.275 | 4,51 | ||||
| 2025-11-10 | 13F | Wrapmanager Inc | 99.498 | -33,00 | 2.335 | -32,59 | ||||
| 2025-12-02 | 13F | IFP Advisors, Inc | 220.733 | -4,13 | 5.181 | -3,56 | ||||
| 2025-11-05 | 13F | J.w. Cole Advisors, Inc. | 275.440 | 9,11 | 6.465 | 9,76 | ||||
| 2026-01-20 | 13F | Blue Square Asset Management, Llc | 40.405 | -1,69 | 946 | -1,97 | ||||
| 2025-11-12 | 13F | Hamel Associates, Inc. | 201.685 | -1,83 | 4.734 | -1,23 | ||||
| 2025-11-07 | 13F | Fifth Third Bancorp | 23.391 | 17,74 | 549 | 18,36 | ||||
| 2025-11-26 | 13F/A | Jpmorgan Chase & Co | 160.004 | 201,93 | 3.755 | 203,80 | ||||
| 2025-10-21 | 13F | Arrow Financial Corp | 602.273 | -2,36 | 14.135 | -1,78 | ||||
| 2026-01-15 | 13F | 4J Wealth Management LLC | 92.600 | 551,88 | 2.167 | 550,75 | ||||
| 2025-11-14 | 13F | Mariner, LLC | 144.256 | 30,28 | 3.386 | 31,05 | ||||
| 2025-11-12 | 13F | BlackRock, Inc. | 82.220 | 5,55 | 1.930 | 6,16 | ||||
| 2026-01-14 | 13F | Johnson Bixby & Associates, LLC | 14.027 | 1,56 | 328 | 1,23 | ||||
| 2026-01-20 | 13F | Princeton Global Asset Management LLC | 26.534 | 65,07 | 621 | 64,72 | ||||
| 2025-11-04 | 13F | Hazlett, Burt & Watson, Inc. | 748 | 0 | ||||||
| 2025-10-23 | 13F | Guidance Point Advisors, LLC | 306.378 | 1,76 | 7.191 | 2,36 | ||||
| 2025-11-06 | 13F | Krilogy Financial LLC | 216.565 | 13,30 | 5.055 | 13,34 | ||||
| 2025-08-05 | 13F | Carolinas Wealth Consulting Llc | 0 | -100,00 | 0 | -100,00 | ||||
| 2025-11-10 | 13F | Cowa, Llc | 64.216 | 33,17 | 1.507 | 34,07 | ||||
| 2026-01-07 | 13F | Harbor Investment Advisory, Llc | 65.092 | 164,21 | 1.523 | 163,49 | ||||
| 2026-01-22 | 13F | Newman Dignan & Sheerar, Inc. | 182.489 | 4,31 | 4.271 | 4,04 | ||||
| 2025-11-12 | 13F | RFP Financial Group LLC | 0 | -100,00 | 0 | -100,00 | ||||
| 2025-11-04 | 13F | Droms Strauss Advisors Inc /mo/ /adv | 220.471 | 7,05 | 5.174 | 7,70 | ||||
| 2025-10-28 | 13F | First National Bank & Trust Co Of Newtown | 159.990 | 0,00 | 3.753 | 0,62 | ||||
| 2025-11-17 | 13F | GWM Advisors LLC | 315.488 | -72,17 | 7.501 | -71,61 | ||||
| 2025-11-04 | 13F | Meridian Wealth Management, LLC | 75.413 | 15,70 | 1.770 | 16,38 | ||||
| 2025-11-12 | 13F | Robertson Stephens Wealth Management, LLC | 468.819 | 7,61 | 11.003 | 8,25 | ||||
| 2025-11-13 | 13F | Eight 31 Financial Llc | 162.389 | 21,74 | 3.811 | 22,46 | ||||
| 2026-01-05 | 13F | Burkett Financial Services, Llc | 2.100 | 49 | ||||||
| 2025-08-27 | NP | ACTIX - Advisors Capital Tactical Fixed Income Fund | 490.800 | 16,69 | 11.450 | 17,70 | ||||
| 2026-01-20 | 13F | AdvisorNet Financial, Inc | 868 | 1,52 | 20 | 0,00 | ||||
| 2025-10-23 | 13F | Sarver Vrooman Wealth Advisors | 11.034 | 5,39 | 259 | 5,74 | ||||
| 2025-11-12 | 13F | Principal Securities, Inc. | 12.147 | 2,97 | 285 | 3,64 | ||||
| 2025-10-20 | 13F | Miracle Mile Advisors, LLC | 84.497 | 1.983 | ||||||
| 2025-08-14 | 13F | Old Mission Capital Llc | 0 | -100,00 | 0 | |||||
| 2025-11-14 | 13F | Raymond James Financial Inc | 2.641.661 | 2,66 | 62.000 | 3,28 | ||||
| 2026-01-22 | 13F | Bartlett & Co. Wealth Management Llc | 530 | 0,00 | 12 | 0,00 | ||||
| 2025-08-12 | 13F | PSI Advisors, LLC | 0 | -100,00 | 0 | -100,00 | ||||
| 2025-11-10 | 13F | Woodley Farra Manion Portfolio Management Inc | 9.856 | 231 | ||||||
| 2026-01-22 | 13F | Willis Johnson & Associates, Inc. | 10.860 | 0,00 | 254 | 0,00 | ||||
| 2025-10-27 | 13F | Schmidt P J Investment Management Inc | 13.558 | 0,00 | 318 | 0,63 | ||||
| 2026-01-20 | 13F | Whalen Wealth Management Inc. | 156.998 | -37,99 | 3.675 | -38,17 | ||||
| 2025-11-03 | 13F | Bank of New York Mellon Corp | 12.573 | 34,31 | 295 | 35,32 | ||||
| 2025-11-04 | 13F | Atlantic Union Bankshares Corp | 244.446 | -3,78 | 5.737 | -3,21 | ||||
| 2025-11-14 | 13F | Evergreen Wealth Solutions, LLC | 17.244 | -0,01 | 405 | 0,50 | ||||
| 2025-10-08 | 13F | Beacon Financial Group | 66.899 | 27,49 | 1.570 | 28,27 | ||||
| 2025-11-14 | 13F | Ancora Advisors, LLC | 15.505 | -7,60 | 364 | -7,16 | ||||
| 2026-01-14 | 13F | Spire Wealth Management | 0 | -100,00 | 0 | |||||
| 2025-08-11 | 13F | Estate Counselors, LLC | 0 | -100,00 | 0 | -100,00 | ||||
| 2026-01-22 | 13F | Ritholtz Wealth Management | 0 | -100,00 | 0 | |||||
| 2025-11-04 | 13F | Mutual Advisors, LLC | 17.904 | -28,25 | 421 | -27,41 | ||||
| 2025-10-27 | 13F | Bogart Wealth, LLC | 5.693 | 0,00 | 134 | 0,76 | ||||
| 2025-11-12 | 13F | IFG Advisory, LLC | 65.989 | 1.549 | ||||||
| 2026-01-21 | 13F | Prime Capital Investment Advisors, LLC | 13.979 | 20,45 | 327 | 20,22 | ||||
| 2025-11-14 | 13F | Flow Traders U.s. Llc | 8.802 | 0 | ||||||
| 2025-11-05 | 13F | LFA - Lugano Financial Advisors SA | 157.043 | 0,47 | 3.672 | 1,46 | ||||
| 2025-11-13 | 13F | Van Hulzen Asset Management, LLC | 9.171 | 215 | ||||||
| 2025-11-12 | 13F | Provenance Wealth Advisors, LLC | 21.536 | 0,15 | 505 | 0,80 | ||||
| 2025-10-22 | 13F | McIlrath & Eck, LLC | 2.652 | 1,18 | 62 | 1,64 | ||||
| 2026-01-15 | 13F | Signature Wealth Management Group | 246.077 | -0,34 | 5.759 | -0,62 | ||||
| 2025-10-20 | 13F | Masso Torrence Wealth Management Inc. | 22.485 | 0,00 | 528 | 0,57 | ||||
| 2025-10-28 | 13F | Leavell Investment Management, Inc. | 52.034 | 35,73 | 1.221 | 36,58 | ||||
| 2026-01-15 | 13F | Trust Co | 4.003 | 22,19 | 94 | 22,37 | ||||
| 2025-11-03 | 13F | Belpointe Asset Management LLC | 72.075 | 22,50 | 1.692 | 23,25 | ||||
| 2025-10-31 | 13F | Barrett & Company, Inc. | 7.958 | 60,51 | 187 | 61,74 | ||||
| 2026-01-14 | 13F | Prosperity Planning, Inc. | 486 | 7,54 | ||||||
| 2026-01-21 | 13F | Leo Wealth, LLC | 173.943 | 1,17 | 4.071 | 0,89 | ||||
| 2025-11-06 | 13F | Atria Investments Llc | 98.524 | 231,66 | 2.312 | 233,62 | ||||
| 2025-12-15 | 13F | Farmers National Bank | 43.216 | 6,48 | 1.014 | 7,19 | ||||
| 2025-11-13 | 13F | Private Advisor Group, LLC | 65.593 | 1,09 | 1.539 | 1,72 | ||||
| 2025-10-30 | 13F | CNB Bank | 5.704 | 134 | ||||||
| 2026-01-14 | 13F | Matthew Goff Investment Advisor, LLC | 0 | -100,00 | 0 | |||||
| 2025-11-12 | 13F | Stifel Financial Corp | 337.224 | 32,71 | 7.915 | 33,50 | ||||
| 2025-10-07 | 13F | Lbmc Investment Advisors, Llc | 242.055 | 25,64 | 5.681 | 26,41 | ||||
| 2025-11-06 | 13F | Oppenheimer & Co Inc | 43.471 | 5,57 | 1.020 | 6,25 | ||||
| 2025-11-14 | 13F | Morgan Stanley | 5.098.080 | 13,02 | 119.652 | 13,70 | ||||
| 2025-11-12 | 13F | Cambridge Investment Research Advisors, Inc. | 161.348 | 21,98 | 4 | 0,00 | ||||
| 2025-11-12 | 13F | Harbor Advisory Corp /ma/ | 78.820 | 0,00 | 1.850 | 0,60 | ||||
| 2025-11-17 | 13F | Kestra Private Wealth Services, Llc | 18.964 | 18,67 | 445 | 19,62 | ||||
| 2026-01-12 | 13F | Sax Wealth Advisors, Llc | 89.348 | 1,73 | 2.091 | 1,46 | ||||
| 2025-11-07 | 13F | Summitry Llc | 1.780.926 | 2,49 | 41.798 | 3,11 | ||||
| 2025-11-14 | 13F | Rockefeller Capital Management L.P. | 571.639 | 1,09 | 13.416 | 1,69 | ||||
| 2025-10-24 | 13F | Avion Wealth | 151 | 0,00 | 0 | |||||
| 2025-10-30 | 13F | Probity Advisors, Inc. | 423.003 | 3,90 | 9.928 | 4,52 | ||||
| 2025-11-13 | 13F | O'shaughnessy Asset Management, Llc | 1.719 | 0,00 | 40 | 0,00 | ||||
| 2025-10-22 | 13F | Spreng Capital Management, Inc. | 0 | -100,00 | 0 | -100,00 | ||||
| 2025-11-14 | 13F | Moors & Cabot, Inc. | 14.912 | 25,08 | 350 | 25,54 | ||||
| 2025-11-14 | 13F | Larson Financial Group LLC | 2.721 | 0,04 | 64 | 0,00 | ||||
| 2026-01-20 | 13F | Cornell Pochily Investment Advisors, Inc. | 145.878 | 26,02 | 3.414 | 25,70 | ||||
| 2026-01-13 | 13F | Capital Investment Advisors, LLC | 3.722.161 | 6,67 | 87.117 | 6,37 | ||||
| 2025-11-17 | 13F | Camelot Portfolios, LLC | 68.788 | -4,43 | 1.614 | -3,87 | ||||
| 2025-10-15 | 13F | Private Trust Co Na | 1.485 | -1,07 | 35 | -2,86 | ||||
| 2025-11-14 | 13F | Scotia Capital Inc. | 8.900 | 0,00 | 209 | 0,48 | ||||
| 2025-08-06 | 13F | First Horizon Advisors, Inc. | 3.332 | 0,00 | 78 | 0,00 | ||||
| 2026-01-21 | 13F | Wilkins Miller Wealth Management, LLC | 178.255 | 4,77 | 4.172 | 4,48 | ||||
| 2025-11-14 | 13F | Lido Advisors, LLC | 1.410.432 | 21,34 | 33.103 | 22,06 | ||||
| 2026-01-13 | 13F | Kathmere Capital Management, LLC | 1.036.202 | -0,59 | 24.252 | -0,86 | ||||
| 2025-11-14 | 13F | National Bank Of Canada /fi/ | 2.009 | 7,03 | 47 | 9,30 | ||||
| 2025-11-12 | 13F | Seven Springs Wealth Group, LLC | 975.122 | 13,97 | 22.886 | 14,66 | ||||
| 2025-11-12 | 13F | Huntington National Bank | 16 | 6,67 | ||||||
| 2025-11-14 | 13F | Comerica Bank | 54.329 | 87,54 | 1.275 | 88,89 | ||||
| 2025-10-15 | 13F | First PREMIER Bank | 329 | 0,00 | 0 | |||||
| 2026-01-22 | 13F | Paradigm, Strategies in Wealth Management, LLC | 63.886 | -15,00 | 1.495 | -15,20 | ||||
| 2025-10-24 | 13F | Hemington Wealth Management | 1.455 | 0,00 | 0 | |||||
| 2025-10-22 | 13F | Highland Financial Advisors, LLC | 11.110 | 0,00 | 261 | 0,39 | ||||
| 2025-10-23 | 13F | Benjamin Edwards Inc | 431.585 | 5,63 | 10.129 | 6,25 | ||||
| 2026-01-16 | 13F | Ronald Blue Trust, Inc. | 811 | 1,50 | 19 | 0,00 | ||||
| 2025-11-03 | 13F | Straight Path Wealth Management | 15.445 | 0,00 | 362 | 0,56 | ||||
| 2025-11-14 | 13F | Mml Investors Services, Llc | 9.680 | -40,02 | 227 | |||||
| 2025-10-30 | 13F | Chicago Partners Investment Group LLC | 10.666 | 251 | ||||||
| 2025-08-12 | 13F | Proequities, Inc. | 0 | 0 | ||||||
| 2025-10-22 | 13F | Commonwealth Equity Services, Llc | 1.128.361 | 10,68 | 26 | 13,04 | ||||
| 2025-11-07 | 13F | Advisors Capital Management, LLC | 1.009.606 | 8,04 | 23.695 | 8,68 | ||||
| 2025-11-10 | 13F | Stonebrook Private Inc. | 130.990 | 1,48 | 3.074 | 2,09 | ||||
| 2026-01-05 | 13F | Michael S. Ryan, Inc. | 109.569 | 0,25 | 2.564 | -0,04 | ||||
| 2025-10-16 | 13F | Virginia Wealth Management Group, Inc. | 194.345 | 8,46 | 4.561 | 9,11 | ||||
| 2025-11-10 | 13F | Choate Investment Advisors | 0 | -100,00 | 0 | -100,00 | ||||
| 2026-01-22 | 13F | Robbins Farley Llc | 16.443 | 101,46 | 385 | 101,05 | ||||
| 2025-11-12 | 13F | Sonata Capital Group Inc | 38.889 | 208,64 | 1 | |||||
| 2025-11-12 | 13F | Baltimore-Washington Financial Advisors, Inc. | 133.204 | 60,31 | 3.126 | 61,30 | ||||
| 2025-09-29 | NP | DRSK - Aptus Defined Risk ETF | 5.194.630 | 7,58 | 120.879 | 7,81 | ||||
| 2026-01-07 | 13F | Aventura Private Wealth, LLC | 55 | 0,00 | 1 | 0,00 | ||||
| 2025-10-30 | 13F | BKD Wealth Advisors, LLC | 26.988 | 14,15 | 633 | 14,88 | ||||
| 2026-01-14 | 13F | InvesTrust | 252.484 | -3,28 | 5.909 | -3,54 | ||||
| 2026-01-15 | 13F | Arcadia Investment Advisors Llc | 301.149 | 12,26 | 7.048 | 11,96 | ||||
| 2025-10-24 | 13F | Kesler, Norman & Wride, LLC | 65.316 | 1,15 | 1.489 | -1,13 | ||||
| 2025-11-03 | 13F | AE Wealth Management LLC | 815 | 19 | ||||||
| 2025-11-14 | 13F | Snowden Capital Advisors LLC | 179.154 | 2,16 | 4.205 | 2,76 | ||||
| 2025-11-12 | 13F | Neuberger Berman Group LLC | 35.996 | 22,89 | 845 | 23,57 | ||||
| 2025-11-10 | 13F | Rossby Financial, LCC | 732 | 0,00 | 17 | 0,00 | ||||
| 2025-11-12 | 13F | LPL Financial LLC | 1.828.286 | 14,78 | 42.910 | 15,46 | ||||
| 2026-01-13 | 13F | Dakota Wealth Management | 10.015 | -18,34 | 234 | -18,47 | ||||
| 2026-01-22 | 13F | Venturi Wealth Management, LLC | 717 | 0,00 | 17 | 0,00 | ||||
| 2025-11-10 | 13F | Alliance Wealth Advisors, LLC /UT | 0 | -100,00 | 0 | |||||
| 2025-11-19 | 13F | Captrust Financial Advisors | 511.634 | 26,90 | 12.008 | 27,66 | ||||
| 2025-11-24 | 13F | CIBC Private Wealth Group, LLC | 0 | -100,00 | 0 | -100,00 | ||||
| 2026-01-12 | 13F | CVA Family Office, LLC | 14.955 | 247,79 | 350 | 250,00 | ||||
| 2025-11-14 | 13F | Citadel Advisors Llc | 54.847 | 206,01 | 1.287 | 207,89 | ||||
| 2025-10-30 | 13F | Rossmore Private Capital | 110.216 | 25,01 | 2.587 | 25,78 | ||||
| 2025-11-14 | 13F | Motley Fool Wealth Management, LLC | 695.489 | -5,42 | 16.323 | -4,86 | ||||
| 2026-01-05 | 13F | Garrett Investment Advisors LLC | 41.131 | -0,38 | 963 | -0,72 | ||||
| 2025-10-22 | 13F | Yoder Wealth Management, Inc. | 0 | -100,00 | 0 | -100,00 | ||||
| 2025-11-10 | 13F | Novem Group | 387.240 | 9.089 | ||||||
| 2025-11-14 | 13F | Integrated Wealth Concepts LLC | 40.678 | 6,20 | 955 | 6,83 | ||||
| 2026-01-21 | 13F | Beaumont Asset Management, L.L.C. | 15.601 | 365 | ||||||
| 2025-11-05 | 13F | First Fiduciary Investment Counsel, Inc. | 51.095 | 0,00 | 1 | 0,00 | ||||
| 2025-11-20 | 13F/A | BRYN MAWR TRUST Co | 3.750 | -43,18 | 88 | -42,48 | ||||
| 2025-10-31 | 13F | REDW Wealth LLC | 13.420 | 0,00 | 315 | 0,32 | ||||
| 2025-11-10 | 13F | Fortis Capital Management LLC | 25.802 | 2,10 | 606 | 2,72 | ||||
| 2025-11-04 | 13F | Jones Financial Companies Lllp | 90.047 | 56,63 | 2.111 | 57,58 | ||||
| 2025-08-27 | NP | Mason Capital Fund Trust - Fundamentals First ETF | 2.160 | 0,00 | 50 | 2,04 | ||||
| 2025-10-15 | 13F | Strid Group, LLC | 69.044 | 5,74 | 1.620 | 6,37 | ||||
| 2026-01-20 | 13F | Signaturefd, Llc | 8.542 | 2,55 | 200 | 2,05 | ||||
| 2025-10-20 | 13F | Segment Wealth Management, LLC | 74.890 | 1,13 | 1.758 | 1,74 | ||||
| 2025-10-24 | 13F | Valmark Advisers, Inc. | 91.533 | -5,81 | 2.148 | -5,25 | ||||
| 2025-10-27 | 13F | Kiker Wealth Management, LLC | 0 | -100,00 | 0 | -100,00 | ||||
| 2025-10-24 | 13F | Associated Banc-corp | 85.667 | 7,12 | 2.011 | 7,77 | ||||
| 2026-01-07 | 13F | Precedent Wealth Partners, Llc | 146.292 | 6,58 | 3.424 | 6,27 | ||||
| 2026-01-22 | 13F | Lee Financial Co | 0 | -100,00 | 0 | |||||
| 2026-01-14 | 13F | Chesley Taft & Associates LLC | 101.900 | 7,26 | 2.385 | 6,95 | ||||
| 2025-11-14 | 13F | Bank Of America Corp /de/ | 6.807.477 | 7,05 | 159.771 | 7,70 | ||||
| 2026-01-14 | 13F | Wealthcare Advisory Partners LLC | 1.145.131 | 2,63 | 26.802 | 2,34 | ||||
| 2025-10-17 | 13F | Hm Payson & Co | 121.649 | 929,27 | 2.855 | 938,18 | ||||
| 2025-11-14 | 13F | Cetera Investment Advisers | 169.760 | 20,86 | 3.984 | 21,61 | ||||
| 2025-11-14 | 13F | Beacon Pointe Advisors, LLC | 190.225 | 0,65 | 4.465 | 1,25 | ||||
| 2026-01-21 | 13F | Snider Financial Group | 41.107 | -32,29 | 962 | -32,44 | ||||
| 2025-10-22 | 13F | Autumn Glory Partners, LLC | 24.566 | 2,66 | 577 | 3,23 | ||||
| 2025-11-07 | 13F | Addison Advisors LLC | 11.145 | 0,00 | 262 | 0,38 | ||||
| 2025-11-12 | 13F | Mesirow Financial Investment Management, Inc. | 46.583 | 148,62 | 1.093 | 150,11 | ||||
| 2025-11-03 | 13F | TD Waterhouse Canada Inc. | 37.025 | -0,42 | 868 | 0,58 | ||||
| 2025-11-19 | 13F | Coldstream Capital Management Inc | 72.014 | 1,14 | 1.690 | 1,75 | ||||
| 2025-10-29 | 13F | First Interstate Bank | 32.753 | 0,00 | 769 | 0,52 | ||||
| 2025-11-12 | 13F | 10Elms LLP | 32.370 | 15,40 | 760 | 16,06 | ||||
| 2025-11-24 | 13F | Cherry Tree Wealth Management, LLC | 195.527 | 2,55 | 4.589 | 3,17 | ||||
| 2025-08-08 | 13F | Mv Capital Management, Inc. | 707.197 | 1,38 | 16.499 | 2,25 | ||||
| 2025-11-06 | 13F | First National Trust Co | 367.011 | 20,65 | 8.614 | 21,38 | ||||
| 2025-11-17 | 13F | WJ Wealth Management, LLC | 10.800 | 253 | ||||||
| 2025-10-24 | 13F | Evergreen Private Wealth LLC | 2.661 | 0,00 | 62 | 0,00 | ||||
| 2025-11-12 | 13F | Laurel Wealth Advisors LLC | 115.800 | 8,73 | 2.718 | 9,38 | ||||
| 2025-11-12 | 13F | Smith, Moore & Co. | 28.664 | 26,99 | 673 | 27,76 | ||||
| 2025-11-14 | 13F | Summit Financial, LLC | 1.010.855 | 23.725 | ||||||
| 2025-11-10 | 13F | American Money Management, LLC | 8.542 | 200 | ||||||
| 2026-01-21 | 13F | Fulton Breakefield Broenniman Llc | 0 | -100,00 | 0 | |||||
| 2025-10-27 | 13F | Klingman & Associates, LLC | 1.421.892 | 5,59 | 33.372 | 6,23 | ||||
| 2025-10-27 | 13F | Gradient Capital Advisors, LLC | 21.086 | 0,00 | 495 | 0,61 | ||||
| 2025-11-13 | 13F | Baird Financial Group, Inc. | 11.135 | 261 | ||||||
| 2025-10-21 | 13F | Summit Wealth Partners, LLC | 15.436 | 362 | ||||||
| 2025-10-21 | 13F | Simon Quick Advisors, Llc | 15.604 | 0,00 | 366 | 0,55 | ||||
| 2025-10-28 | 13F | Houlihan Financial Resource Group, Ltd. | 96.330 | -52,52 | 2.261 | 56.400,00 | ||||
| 2025-10-28 | 13F | Nwam Llc | 11.204 | 0,91 | 264 | 1,94 | ||||
| 2026-01-08 | 13F | Sound View Wealth Advisors Group, LLC | 1.613.448 | 55,44 | 37.763 | 55,02 | ||||
| 2025-11-05 | 13F | MCF Advisors LLC | 383.609 | 0,12 | 9.003 | 0,73 | ||||
| 2025-10-21 | 13F | Global Retirement Partners, LLC | 146.023 | 13,69 | 3.427 | 14,39 | ||||
| 2025-10-29 | 13F | Resonant Capital Advisors, LLC | 74.971 | 108,76 | 1.760 | 110,16 | ||||
| 2026-01-21 | 13F | Crews Bank & Trust | 125.550 | 17,82 | 2.938 | 17,52 | ||||
| 2025-10-21 | 13F | Penobscot Investment Management Company, Inc. | 148.850 | 82,82 | 3.494 | 83,94 | ||||
| 2025-11-07 | 13F | HighTower Advisors, LLC | 1.628.787 | 8,82 | 38.228 | 9,47 | ||||
| 2025-11-03 | 13F | Annis Gardner Whiting Capital Advisors, LLC | 0 | -100,00 | 0 | -100,00 | ||||
| 2025-11-10 | 13F | Thoroughbred Financial Services, Llc | 27.175 | 20,26 | 1 | |||||
| 2025-11-10 | 13F | Koshinski Asset Management, Inc. | 12.648 | 2,52 | 297 | 3,14 | ||||
| 2025-10-31 | 13F | James Investment Research Inc | 27.340 | 0,00 | 642 | 0,63 | ||||
| 2025-11-10 | 13F | Tableaux Llc | 17.278 | 2,44 | 406 | 3,05 | ||||
| 2026-01-07 | 13F | Gilbert & Cook, Inc. | 45.516 | 1.065 | ||||||
| 2026-01-22 | 13F | Granite Harbor Advisors, Inc. | 17.970 | -59,79 | 421 | -59,92 | ||||
| 2025-11-13 | 13F | Beese Fulmer Investment Management, Inc. | 108.260 | 11,67 | 2.541 | 12,34 | ||||
| 2025-10-16 | 13F | Syntegra Private Wealth Group, LLC | 158.792 | 37,91 | 3.727 | 38,72 | ||||
| 2025-11-05 | 13F | Spinnaker Trust | 242.880 | 15,83 | 5.700 | 16,54 | ||||
| 2025-11-12 | 13F | Us Bancorp \de\ | 594.551 | -11,55 | 13.954 | -11,02 | ||||
| 2025-10-10 | 13F | Stony Point Wealth Management Inc. | 62.476 | 4,82 | 1.466 | 5,47 | ||||
| 2025-11-05 | 13F | Koesten, Hirschmann & Crabtree, INC. | 8.391 | 0,00 | 197 | 0,51 | ||||
| 2025-10-14 | 13F | Farther Finance Advisors, LLC | 16.367 | 738,47 | 384 | 753,33 | ||||
| 2025-10-29 | 13F | Meitav Dash Investments Ltd | 104.488 | 3,21 | 2.449 | 3,82 | ||||
| 2025-11-07 | 13F | Glenview Trust Co | 331.601 | 19,67 | 7.783 | 20,39 | ||||
| 2025-11-03 | 13F | Robinson Smith Wealth Advisors Llc | 26.563 | 3,37 | 623 | 4,01 | ||||
| 2025-10-22 | 13F | CoreCap Advisors, LLC | 0 | -100,00 | 0 | |||||
| 2025-11-04 | 13F | United Community Bank | 13.200 | 0,00 | 310 | 0,65 | ||||
| 2025-11-12 | 13F | Redwood Financial Network Corp | 23.889 | 26,94 | 561 | 27,56 | ||||
| 2026-01-12 | 13F | Roble, Belko & Company, Inc | 43.439 | 0,00 | 1 | 0,00 | ||||
| 2025-11-10 | 13F | Atomi Financial Group, Inc. | 15.359 | 10,40 | 360 | 11,11 | ||||
| 2025-11-14 | 13F | Creative Planning | 58.123 | -0,76 | 1.364 | -0,15 | ||||
| 2025-10-28 | 13F | Minichmacgregor Wealth Management, Llc | 9.080 | 0,00 | 213 | 0,95 | ||||
| 2025-11-12 | 13F | AlphaCore Capital LLC | 870 | -57,35 | 20 | -57,45 | ||||
| 2025-11-14 | 13F | StoneX Group Inc. | 16.762 | 11,32 | 393 | 11,97 |