Grundlæggende statistik
| Institutionelle ejere | 141 total, 141 long only, 0 short only, 0 long/short - change of 0,71% MRQ |
| Gennemsnitlig porteføljeallokering | 1.1043 % - change of -5,37% MRQ |
| Institutionelle aktier (lange) | 19.417.021 (ex 13D/G) - change of 0,37MM shares 1,95% MRQ |
| Institutionel værdi (lang) | $ 760.854 USD ($1000) |
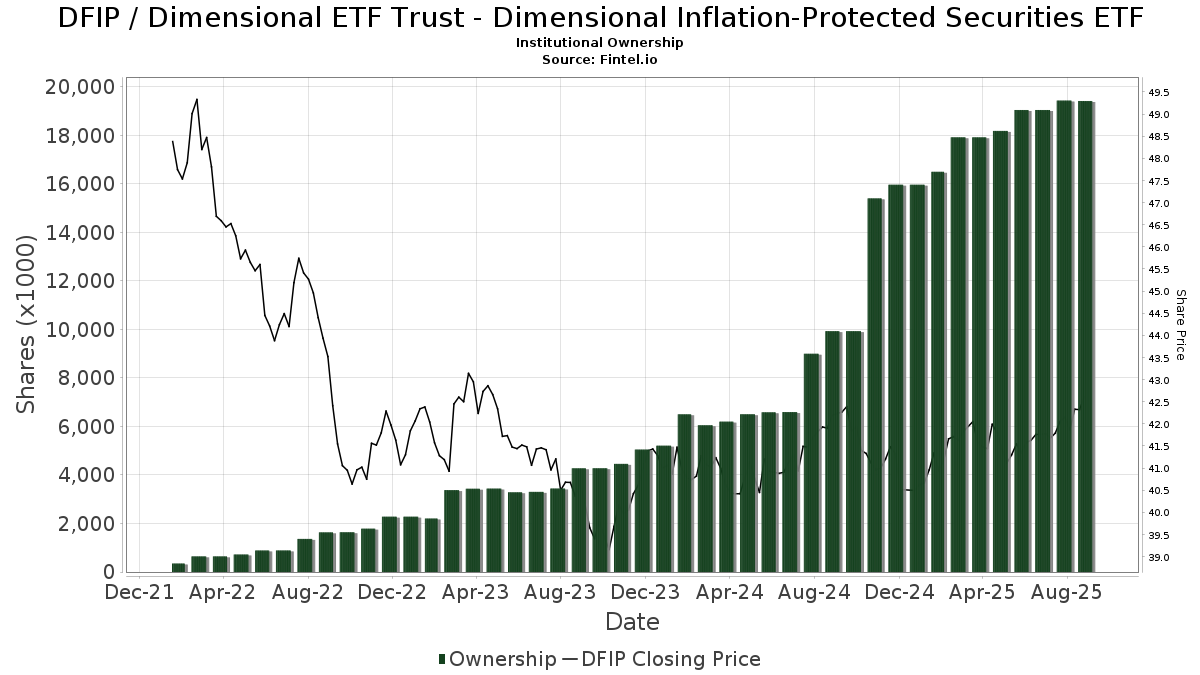
Institutionelt ejerskab og aktionærer
Dimensional ETF Trust - Dimensional Inflation-Protected Securities ETF (US:DFIP) har 141 institutionelle ejere og aktionærer, der har indsendt 13D/G- eller 13F-formularer til Securities Exchange Commission (SEC). Disse institutioner har i alt 19,417,021 aktier. Største aktionærer omfatter Matson Money. Inc., FMFIX - Free Market Fixed Income Fund Institutional Class, Heirloom Wealth Management, Planning Center, Inc., Hill Investment Group Partners, LLC, Hemington Wealth Management, Geometric Wealth Advisors, CPA Asset Management LLC, Rather & Kittrell, Inc., and Pinney & Scofield, Inc. .
Dimensional ETF Trust - Dimensional Inflation-Protected Securities ETF (ARCA:DFIP) institutionel ejerskabsstruktur viser aktuelle positioner i virksomheden efter institutioner og fonde, samt seneste ændringer i positionsstørrelse. Større aktionærer kan omfatte individuelle investorer, investeringsforeninger, hedgefonde eller institutioner. Skema 13D angiver, at investoren besidder (eller besidder) mere end 5 % af virksomheden og har til hensigt (eller har til hensigt at) aktivt at forfølge en ændring i forretningsstrategi. Skema 13G indikerer en passiv investering på over 5%.
The share price as of September 16, 2025 is 42,66 / share. Previously, on September 17, 2024, the share price was 42,40 / share. This represents an increase of 0,61% over that period.
Fondens stemningsscore
Fund Sentiment Score (fka Ownership Accumulation Score) finder de aktier, der bliver mest købt af fonde. Det er resultatet af en sofistikeret, multi-faktor kvantitativ model, der identificerer virksomheder med de højeste niveauer af institutionel akkumulering. Scoringsmodellen bruger en kombination af den samlede stigning i oplyste ejere, ændringerne i porteføljeallokeringer i disse ejere og andre målinger. Tallet går fra 0 til 100, hvor højere tal indikerer et højere niveau af akkumulering for sine jævnaldrende, og 50 er gennemsnittet.
Opdateringsfrekvens: Dagligt
Se Ownership Explorer, som giver en liste over højest rangerende virksomheder.
Institutionel Put/Call-forhold
Ud over at indberette standardaktie- og gældsudstedelser skal institutter med mere end 100 mill. aktiver under forvaltning også oplyse deres put- og call-optionsbeholdninger. Da salgsoptioner generelt indikerer negativ stemning, og købsoptioner indikerer positiv stemning, kan vi få en fornemmelse af den overordnede institutionelle stemning ved at plotte forholdet mellem put og kald. Diagrammet til højre viser det historiske put/call-forhold for dette instrument.
Brug af Put/Call Ratio som en indikator for investorernes stemning overvinder en af de vigtigste mangler ved at bruge totalt institutionelt ejerskab, som er, at en betydelig mængde af aktiver under forvaltning investeres passivt for at spore indekser. Passivt forvaltede fonde køber typisk ikke optioner, så indikatoren for put/call-forholdet følger mere nøje følelsen af aktivt forvaltede fonde.
13F og NPORT arkivering
Detaljer om 13F-arkivering er gratis. Detaljer om NP-ansøgninger kræver et premium-medlemskab. Grønne rækker angiver nye positioner. Røde rækker angiver lukkede positioner. Klik på linket ikon for at se den fulde transaktionshistorik.
Opgrader
for at låse premium-data op og eksportere til Excel ![]() .
.
| Fil dato | Kilde | Investor | Type | Gennemsnitlig pris (Øst) |
Aktier | Δ Aktier (%) |
Rapporteret Værdi ($1000) |
Δ Værdi (%) |
Port Alloc (%) |
|
|---|---|---|---|---|---|---|---|---|---|---|
| 2025-07-16 | 13F | Tru Independence Asset Management 2, Llc | 20.023 | -49,31 | 837 | -49,67 | ||||
| 2025-07-29 | NP | FMVFX - Matson Money Fixed Income VI Portfolio Institutional Class | 29.452 | -3,44 | 1.224 | -4,30 | ||||
| 2025-07-22 | 13F | Awm Capital, Llc | 78.517 | 1,26 | 3.283 | 0,52 | ||||
| 2025-08-13 | 13F | Flow Traders U.s. Llc | 0 | -100,00 | 0 | |||||
| 2025-07-18 | 13F | PBMares Wealth Management LLC | 30.290 | -2,06 | 1.266 | -2,76 | ||||
| 2025-08-05 | 13F | Centennial Bank/AR/ | 22.269 | -2,90 | 931 | -3,52 | ||||
| 2025-07-09 | 13F | Krilogy Financial LLC | 104.458 | 1,64 | 4.367 | 0,92 | ||||
| 2025-07-11 | 13F | Farther Finance Advisors, LLC | 3.107 | 130 | ||||||
| 2025-07-14 | 13F | Shearwater Capital LLC | 39.773 | 1,01 | 1.663 | 0,24 | ||||
| 2025-07-11 | 13F | Physician Wealth Solutions Inc. | 350.435 | -0,28 | 14.652 | -0,99 | ||||
| 2025-07-30 | 13F | Phillips Financial Management, Llc | 2.601 | 0,00 | 109 | -0,92 | ||||
| 2025-07-31 | 13F | Buckingham Strategic Partners | 31.111 | 8,16 | 1.301 | 7,35 | ||||
| 2025-08-06 | 13F | Vestmark Advisory Solutions, Inc. | 19.798 | 146,83 | 828 | 145,40 | ||||
| 2025-07-09 | 13F | HFG Wealth Management, LLC | 10.920 | 2,30 | 460 | 6,25 | ||||
| 2025-07-23 | 13F | First Financial Group Corp | 6.220 | -1,19 | 260 | -1,89 | ||||
| 2025-07-17 | 13F | SC&H Financial Advisors, Inc. | 7.775 | 1,12 | 325 | 0,62 | ||||
| 2025-08-07 | 13F | Allworth Financial LP | 26.199 | 0,88 | 1.095 | 1,20 | ||||
| 2025-08-13 | 13F | SageView Advisory Group, LLC | 37.743 | 0,40 | 1.575 | -0,57 | ||||
| 2025-05-16 | 13F | Coppell Advisory Solutions LLC | 0 | -100,00 | 0 | |||||
| 2025-07-15 | 13F | Vestment Financial LLC | 130.432 | 5,65 | 5.447 | 4,47 | ||||
| 2025-08-14 | 13F | GWM Advisors LLC | 895 | -97,16 | 37 | -97,21 | ||||
| 2025-07-15 | 13F | Level Financial Advisors, Inc. | 199.579 | 6,58 | 8.344 | 5,82 | ||||
| 2025-08-14 | 13F | Goldman Sachs Group Inc | 118.619 | 0,00 | 4.959 | -0,72 | ||||
| 2025-08-13 | 13F | Jones Financial Companies Lllp | 2.550 | 169,84 | 106 | 171,79 | ||||
| 2025-07-08 | 13F | Henrickson Nauta Wealth Advisors, Inc. | 64.038 | 15,11 | 2.677 | 16,90 | ||||
| 2025-08-14 | 13F | Great Valley Advisor Group, Inc. | 7.933 | -59,13 | 332 | -59,49 | ||||
| 2025-07-18 | 13F | BCU Wealth Advisors, LLC | 96.949 | 16,67 | 4.053 | 15,83 | ||||
| 2025-07-29 | 13F | Two West Capital Advisors LLC | 6.491 | -7,05 | 271 | -5,57 | ||||
| 2025-07-17 | 13F | Applied Capital LLC | 15.219 | -0,11 | 636 | -0,78 | ||||
| 2025-07-22 | 13F | Firethorn Wealth Partners, Llc | 14.166 | 1,65 | 592 | 1,02 | ||||
| 2025-08-07 | 13F | Samalin Investment Counsel, LLC | 29.250 | -15,04 | 1.223 | -15,67 | ||||
| 2025-08-12 | 13F | Park Square Financial Group, LLC | 13 | 0,00 | 1 | |||||
| 2025-08-13 | 13F | Legacy Capital Wealth Partners, LLC | 7.102 | 297 | ||||||
| 2025-08-07 | 13F | Nwam Llc | 40.917 | 3,16 | 1.711 | 2,40 | ||||
| 2025-08-11 | 13F | Principal Securities, Inc. | 3.103 | 0,00 | 130 | 3,20 | ||||
| 2025-08-14 | 13F | UBS Group AG | 13.967 | 584 | ||||||
| 2025-08-12 | 13F | Change Path, LLC | 23.043 | 4,65 | 963 | 3,88 | ||||
| 2025-07-28 | 13F | Sterling Financial Planning, Inc. | 132.599 | 6,07 | 5.544 | 5,30 | ||||
| 2025-08-13 | 13F | Northwestern Mutual Wealth Management Co | 0 | -100,00 | 0 | |||||
| 2025-08-15 | 13F | Morgan Stanley | 2.428 | -40,48 | 102 | -40,94 | ||||
| 2025-07-10 | 13F | Wealth Enhancement Advisory Services, Llc | 30.059 | -2,39 | 1.253 | -3,32 | ||||
| 2025-04-16 | 13F | Lam Group, Inc. | 0 | -100,00 | 0 | -100,00 | ||||
| 2025-07-03 | 13F | CPA Asset Management LLC | 432.044 | 2,35 | 18.064 | 1,61 | ||||
| 2025-08-15 | 13F | Binnacle Investments Inc | 54.982 | 4,77 | 2.299 | 4,03 | ||||
| 2025-08-14 | 13F | EP Wealth Advisors, Inc. | 4.428 | -5,63 | 185 | -6,09 | ||||
| 2025-05-08 | 13F | Essential Planning, LLC. | 0 | -100,00 | 0 | |||||
| 2025-08-06 | 13F | Savant Capital, LLC | 7.523 | 315 | ||||||
| 2025-08-08 | 13F | Sensible Financial Planning & Management, LLC. | 170.489 | -8,01 | 7.128 | -8,66 | ||||
| 2025-07-14 | 13F | Kfg Wealth Management, Llc | 194.955 | 2,42 | 8.151 | 1,68 | ||||
| 2025-07-17 | 13F | Porter White Investment Advisors, Inc. | 48.010 | 6,28 | 2.007 | 5,52 | ||||
| 2025-05-02 | 13F | MB Generational Wealth, LLC | 5.369 | 226 | ||||||
| 2025-07-25 | 13F | We Are One Seven, LLC | 0 | -100,00 | 0 | |||||
| 2025-08-06 | 13F | Modera Wealth Management, LLC | 12.833 | 0,00 | 537 | -0,74 | ||||
| 2025-08-11 | 13F | Citigroup Inc | 6.475 | -2,32 | 271 | -3,23 | ||||
| 2025-08-06 | 13F | AE Wealth Management LLC | 97 | 2,11 | 4 | 0,00 | ||||
| 2025-07-22 | 13F | Yardley Wealth Management LLC | 250.286 | 3,68 | 10 | 0,00 | ||||
| 2025-07-17 | 13F | XY Planning Network, Inc. | 19.416 | 8,50 | 812 | 7,70 | ||||
| 2025-07-31 | 13F | Brinker Capital Investments, LLC | 0 | -100,00 | 0 | |||||
| 2025-08-14 | 13F | Jane Street Group, Llc | 21.008 | 138,84 | 878 | 137,30 | ||||
| 2025-07-18 | 13F | Lynx Investment Advisory | 7.774 | 1,07 | 325 | 0,62 | ||||
| 2025-07-22 | 13F | Visionary Horizons, LLC | 14.691 | 16,09 | 614 | 15,41 | ||||
| 2025-08-12 | 13F | LPL Financial LLC | 15.604 | 3,87 | 652 | 3,16 | ||||
| 2025-07-16 | 13F | Vestia Personal Wealth Advisors | 31.286 | 15,05 | 1.308 | 14,15 | ||||
| 2025-08-08 | 13F | Larson Financial Group LLC | 183.032 | -21,94 | 7.653 | -22,50 | ||||
| 2025-07-09 | 13F | Market Street Wealth Management Advisors Llc | 290.171 | 2,17 | 12.132 | 1,45 | ||||
| 2025-07-25 | 13F | Envestnet Portfolio Solutions, Inc. | 9.692 | 405 | ||||||
| 2025-08-14 | 13F | Monograph Wealth Advisors, Llc | 136.427 | 5,04 | 5.704 | 4,30 | ||||
| 2025-07-28 | 13F | Harbour Investments, Inc. | 21 | 0,00 | 1 | |||||
| 2025-07-31 | 13F | Orion Capital Management LLC | 255 | -21,54 | 11 | -23,08 | ||||
| 2025-07-29 | 13F | Fundamentun, Llc | 349.242 | 6,80 | 14.602 | 6,03 | ||||
| 2025-07-31 | 13F | City State Bank | 6.250 | 150,00 | 261 | 148,57 | ||||
| 2025-08-04 | 13F | Saxony Capital Management, LLC | 41.633 | -21,57 | 1.741 | -22,15 | ||||
| 2025-07-16 | 13F | Leading Edge Financial Planning LLC | 382.545 | 7,08 | 15.994 | 6,31 | ||||
| 2025-07-22 | 13F | David Wealth Management LLC | 152.228 | 6,44 | 6.365 | 5,68 | ||||
| 2025-08-08 | 13F | SageOak Financial, LLC | 5.436 | -43,88 | 227 | -44,23 | ||||
| 2025-08-11 | 13F | CFS Investment Advisory Services, LLC | 49.050 | 0,40 | 2 | 0,00 | ||||
| 2025-08-01 | 13F | Envestnet Asset Management Inc | 84.242 | 354,04 | 3.522 | 350,96 | ||||
| 2025-07-30 | 13F | Crewe Advisors LLC | 945 | 0,00 | 40 | 0,00 | ||||
| 2025-07-15 | 13F | Fortitude Family Office, LLC | 243.967 | 67,13 | 10.200 | 65,93 | ||||
| 2025-07-22 | 13F | Aspire Private Capital, LLC | 12.155 | 10,81 | 508 | 10,20 | ||||
| 2025-08-12 | 13F | Rather & Kittrell, Inc. | 417.381 | -0,55 | 17.451 | -1,27 | ||||
| 2025-08-15 | 13F | Equitable Holdings, Inc. | 34.488 | 1,95 | 1.442 | 1,19 | ||||
| 2025-07-16 | 13F | Spinnaker Investment Group, LLC | 0 | -100,00 | 0 | |||||
| 2025-08-18 | 13F | Geneos Wealth Management Inc. | 5.820 | 35,29 | 243 | 34,25 | ||||
| 2025-07-17 | 13F | Northwest Wealth Management, Llc | 16.991 | 1,84 | 710 | 1,14 | ||||
| 2025-08-13 | 13F | Plan Group Financial, LLC | 98.375 | -28,06 | 4.113 | -28,57 | ||||
| 2025-07-15 | 13F | Maseco Llp | 1.866 | 78 | ||||||
| 2025-08-12 | 13F | TCP Asset Management, LLC | 37.197 | 8,45 | 1.555 | 7,69 | ||||
| 2025-08-05 | 13F | C2P Capital Advisory Group, LLC d.b.a. Prosperity Capital Advisors | 0 | -100,00 | 0 | |||||
| 2025-08-12 | 13F | Burk Holdings LLC | 15.619 | 16,98 | 653 | 16,19 | ||||
| 2025-08-14 | 13F | Betterment LLC | 7.972 | -6,92 | 0 | |||||
| 2025-07-30 | 13F | Drive Wealth Management, Llc | 6.351 | -24,87 | 266 | -25,35 | ||||
| 2025-07-31 | 13F | Core Wealth Management, Inc. | 222.731 | 6,36 | 9.312 | 5,60 | ||||
| 2025-08-11 | 13F | Aptus Capital Advisors, LLC | 0 | -100,00 | 0 | |||||
| 2025-08-14 | 13F | Smartleaf Asset Management LLC | 428 | 0,00 | 18 | 0,00 | ||||
| 2025-08-14 | 13F | Wells Fargo & Company/mn | 1.626 | 68 | ||||||
| 2025-07-25 | 13F | Hemington Wealth Management | 765.886 | 6,47 | 32 | 6,67 | ||||
| 2025-08-11 | 13F | Root Financial Partners, LLC | 10.989 | -60,29 | 459 | -60,60 | ||||
| 2025-08-06 | 13F | Entrewealth, Llc | 61.488 | 27,90 | 2.571 | 26,98 | ||||
| 2025-07-21 | 13F | Onyx Financial Advisors, LLC | 38.116 | 49,09 | 1.594 | 48,05 | ||||
| 2025-07-31 | 13F | Glass Jacobson Investment Advisors llc | 9.408 | 2,60 | 393 | 5,93 | ||||
| 2025-08-13 | 13F | Townsquare Capital Llc | 0 | -100,00 | 0 | |||||
| 2025-07-18 | 13F | Fmb Wealth Management | 29.242 | -2,12 | 1.223 | -2,86 | ||||
| 2025-08-12 | 13F | Coston, McIsaac & Partners | 6.268 | 603,48 | 0 | |||||
| 2025-07-09 | 13F | Dynamic Advisor Solutions LLC | 18.951 | 23,19 | 792 | 22,41 | ||||
| 2025-07-18 | 13F | Truist Financial Corp | 6.991 | 1,54 | 292 | 1,04 | ||||
| 2025-07-25 | 13F | Cwm, Llc | 493 | 0,00 | 0 | |||||
| 2025-07-31 | 13F | Heirloom Wealth Management | 983.348 | -4,14 | 41.114 | -4,83 | ||||
| 2025-08-06 | 13F | Commonwealth Equity Services, Llc | 46.095 | -14,20 | 2 | -50,00 | ||||
| 2025-07-08 | 13F | Apella Capital, LLC | 167.513 | 0,88 | 6.979 | 1,07 | ||||
| 2025-07-14 | 13F | Foster Group, Inc. | 18.094 | 0,00 | 757 | -0,66 | ||||
| 2025-07-25 | 13F | Concord Wealth Partners | 3.595 | 202,10 | 150 | 200,00 | ||||
| 2025-07-24 | 13F | Jfs Wealth Advisors, Llc | 3.881 | -0,51 | 162 | -1,22 | ||||
| 2025-08-14 | 13F | Royal Bank Of Canada | 33.891 | 115,29 | 1.417 | 113,73 | ||||
| 2025-07-30 | 13F | Klingman & Associates, LLC | 31.534 | -3,98 | 1.318 | -4,63 | ||||
| 2025-08-04 | 13F | Assetmark, Inc | 73.475 | 3.072 | ||||||
| 2025-07-30 | 13F | Forum Financial Management, LP | 83.158 | -3,08 | 3.477 | -3,79 | ||||
| 2025-08-12 | 13F | Jpmorgan Chase & Co | 5.000 | 0,20 | 209 | -0,48 | ||||
| 2025-07-23 | 13F | Sax Wealth Advisors, Llc | 8.243 | 52,85 | 345 | 51,54 | ||||
| 2025-07-17 | 13F | Willow Creek Wealth Management Inc. | 35.279 | -1,88 | 1.475 | -2,58 | ||||
| 2025-07-31 | 13F | Curio Wealth, Llc | 17.610 | 31.346,43 | 736 | -61,26 | ||||
| 2025-07-30 | 13F | Matson Money. Inc. | 3.573.335 | 0,01 | 149.401 | -0,77 | ||||
| 2025-07-14 | 13F | Park Avenue Securities Llc | 68.750 | 3 | ||||||
| 2025-08-14 | 13F | Note Advisors, LLC | 10.250 | -3,38 | 429 | -4,04 | ||||
| 2025-08-12 | 13F | Nemes Rush Group LLC | 3.273 | 33,43 | 137 | 32,04 | ||||
| 2025-07-24 | 13F | IFP Advisors, Inc | 3 | -100,00 | 0 | -100,00 | ||||
| 2025-08-14 | 13F | Qube Research & Technologies Ltd | 188 | 0,00 | 8 | 0,00 | ||||
| 2025-07-22 | 13F | Berger Financial Group, Inc | 4.898 | 0,00 | 205 | -0,97 | ||||
| 2025-07-18 | 13F | Meritas Wealth Management, LLC | 4.788 | 200 | ||||||
| 2025-08-08 | 13F | Tortoise Investment Management, LLC | 26.908 | 28,82 | 1.125 | 27,99 | ||||
| 2025-07-16 | 13F | Five Oceans Advisors | 254.918 | 3,55 | 10.658 | 2,82 | ||||
| 2025-07-18 | 13F | Bridge Generations Wealth Management Llc | 3.609 | 0,00 | 151 | -0,66 | ||||
| 2025-08-12 | 13F | Proequities, Inc. | 0 | 0 | ||||||
| 2025-08-13 | 13F | Grove Street Fiduciary, LLC | 91.644 | -2,75 | 3.832 | -3,45 | ||||
| 2025-07-17 | 13F | Global Trust Asset Management, LLC | 2.900 | 2.800,00 | 121 | 2.925,00 | ||||
| 2025-07-30 | 13F | Exencial Wealth Advisors, Llc | 43.643 | -6,71 | 1.825 | -7,36 | ||||
| 2025-08-12 | 13F | Hill Investment Group Partners, LLC | 798.105 | 1,07 | 33.369 | 0,34 | ||||
| 2025-07-15 | 13F | Total Wealth Planning, Llc | 21.509 | -27,31 | 899 | -27,85 | ||||
| 2025-07-23 | 13F | Elevate Wealth Advisory, Inc | 1.953 | 0,00 | 82 | -1,22 | ||||
| 2025-07-10 | 13F | Stewardship Advisors, LLC | 9.608 | -2,46 | 402 | -3,14 | ||||
| 2025-08-14 | 13F | Balanced Rock Investment Advisor | 51.707 | 2.162 | ||||||
| 2025-07-17 | 13F | Blossom Wealth Management | 7.753 | 12,59 | 324 | 12,11 | ||||
| 2025-08-14 | 13F | Citadel Advisors Llc | 0 | -100,00 | 0 | |||||
| 2025-07-16 | 13F | Midwest Heritage Bank, FSB | 0 | -100,00 | 0 | |||||
| 2025-08-06 | 13F | Geometric Wealth Advisors | 498.824 | 0,17 | 20.856 | -0,55 | ||||
| 2025-08-08 | 13F | Pinney & Scofield, Inc. | 400.303 | -0,17 | 16.737 | -0,88 | ||||
| 2025-08-08 | 13F | Austin Wealth Management, LLC | 261.287 | 8,21 | 10.902 | 8,31 | ||||
| 2025-07-29 | NP | FMFIX - Free Market Fixed Income Fund Institutional Class | 3.543.397 | 0,00 | 147.228 | -0,86 | ||||
| 2025-08-06 | 13F | New Dimensions Wealth Management, LLC | 202.204 | 2,83 | 8.439 | 1,92 | ||||
| 2025-09-04 | 13F/A | Advisor Group Holdings, Inc. | 4.999 | 10,60 | 209 | 10,00 | ||||
| 2025-07-16 | 13F | Strategic Investment Solutions, Inc. /IL | 5.710 | 602,34 | 239 | 600,00 | ||||
| 2025-07-28 | 13F | Verisail Partners, LLC | 5.118 | 0,71 | 214 | -0,47 | ||||
| 2025-07-14 | 13F | AdvisorNet Financial, Inc | 0 | -100,00 | 0 | |||||
| 2025-07-31 | 13F | Planning Center, Inc. | 868.594 | 2,19 | 36.316 | 1,46 | ||||
| 2025-08-14 | 13F | Bank Of America Corp /de/ | 0 | -100,00 | 0 | |||||
| 2025-07-11 | 13F | Scratch Capital Llc | 234.900 | 25,03 | 9.821 | 24,14 | ||||
| 2025-08-08 | 13F | Altiora Financial Group, LLC | 81.946 | 0,46 | 3.426 | -0,26 |