Grundlæggende statistik
| Institutionelle aktier (lange) | 53.017.392 - 107,45% (ex 13D/G) - change of -5,37MM shares -9,19% MRQ |
| Institutionel værdi (lang) | $ 10.204.033 USD ($1000) |
Institutionelt ejerskab og aktionærer
Charles River Laboratories International, Inc. (US:CRL) har 586 institutionelle ejere og aktionærer, der har indsendt 13D/G- eller 13F-formularer til Securities Exchange Commission (SEC). Disse institutioner har i alt 53,017,392 aktier. Største aktionærer omfatter Vanguard Group Inc, BlackRock, Inc., Invesco Ltd., Allspring Global Investments Holdings, LLC, State Street Corp, Wellington Management Group Llp, Fmr Llc, Harris Associates L P, Dimensional Fund Advisors Lp, and Ariel Investments, Llc .
Charles River Laboratories International, Inc. (NYSE:CRL) institutionel ejerskabsstruktur viser aktuelle positioner i virksomheden efter institutioner og fonde, samt seneste ændringer i positionsstørrelse. Større aktionærer kan omfatte individuelle investorer, investeringsforeninger, hedgefonde eller institutioner. Skema 13D angiver, at investoren besidder (eller besidder) mere end 5 % af virksomheden og har til hensigt (eller har til hensigt at) aktivt at forfølge en ændring i forretningsstrategi. Skema 13G indikerer en passiv investering på over 5%.
The share price as of April 14, 2026 is 179,31 / share. Previously, on April 15, 2025, the share price was 105,92 / share. This represents an increase of 69,29% over that period.

Fondens stemningsscore
Fund Sentiment Score (fka Ownership Accumulation Score) finder de aktier, der bliver mest købt af fonde. Det er resultatet af en sofistikeret, multi-faktor kvantitativ model, der identificerer virksomheder med de højeste niveauer af institutionel akkumulering. Scoringsmodellen bruger en kombination af den samlede stigning i oplyste ejere, ændringerne i porteføljeallokeringer i disse ejere og andre målinger. Tallet går fra 0 til 100, hvor højere tal indikerer et højere niveau af akkumulering for sine jævnaldrende, og 50 er gennemsnittet.
Opdateringsfrekvens: Dagligt
Se Ownership Explorer, som giver en liste over højest rangerende virksomheder.
AI+ Ask Fintel’s AI assistant about Charles River Laboratories International, Inc..
Select a question to share a public post with an AI-crafted answer.
Thinking of good questions…
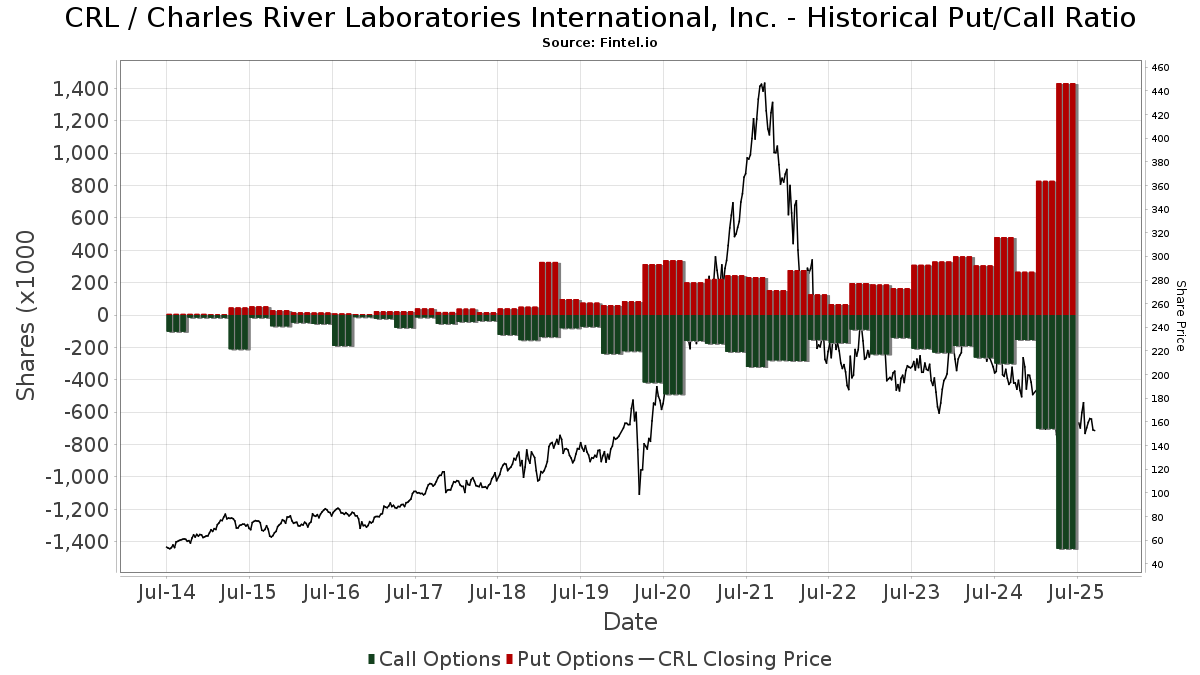
Institutionel Put/Call-forhold
Ud over at indberette standardaktie- og gældsudstedelser skal institutter med mere end 100 mill. aktiver under forvaltning også oplyse deres put- og call-optionsbeholdninger. Da salgsoptioner generelt indikerer negativ stemning, og købsoptioner indikerer positiv stemning, kan vi få en fornemmelse af den overordnede institutionelle stemning ved at plotte forholdet mellem put og kald. Diagrammet til højre viser det historiske put/call-forhold for dette instrument.
Brug af Put/Call Ratio som en indikator for investorernes stemning overvinder en af de vigtigste mangler ved at bruge totalt institutionelt ejerskab, som er, at en betydelig mængde af aktiver under forvaltning investeres passivt for at spore indekser. Passivt forvaltede fonde køber typisk ikke optioner, så indikatoren for put/call-forholdet følger mere nøje følelsen af aktivt forvaltede fonde.
13D/G-arkivering
Vi præsenterer 13D/G ansøgninger separat fra 13F ansøgninger på grund af den forskellige behandling af SEC. 13D/G-ansøgninger kan indgives af grupper af investorer (med én ledende), hvorimod 13F-ansøgninger ikke kan. Dette resulterer i situationer, hvor en investor kan indsende en 13D/G, der rapporterer én værdi for de samlede aktier (der repræsenterer alle de aktier, der ejes af investorgruppen), men derefter indsender en 13F, der rapporterer en anden værdi for de samlede aktier (der udelukkende repræsenterer deres egne) ejendomsret). Det betyder, at aktieejerskab af 13D/G-arkiver og 13F-arkiveringer ofte ikke er direkte sammenlignelige, så vi præsenterer dem separat.
Bemærk: Fra den 16. maj 2021 viser vi ikke længere ejere, der ikke har indsendt en 13D/G inden for det seneste år. Tidligere viste vi den fulde historie af 13D/G-arkiver. Generelt skal enheder, der er forpligtet til at indgive 13D/G-ansøgninger, indgive mindst årligt, før de indsender en afsluttende ansøgning. Dog forlader fonde nogle gange positioner uden at indsende en afsluttende ansøgning (dvs. de afvikler), så visning af den fulde historie resulterede nogle gange i forvirring om det nuværende ejerskab. For at undgå forvirring viser vi nu kun 'aktuelle' ejere - det vil sige - ejere, der har anmeldt inden for det seneste år.
Upgrade to unlock premium data.
| Fil dato | Form | Investor | Forrige Aktier |
Seneste Aktier |
Δ Aktier (Procent) |
Ejendomsret (Procent) |
Δ Ejerskab (Procent) |
|
|---|---|---|---|---|---|---|---|---|
| 2026-03-26 | VANGUARD GROUP INC | 5,980,236 | 0 | -100.00 | 0.00 | -100.00 | ||
| 2026-02-12 | Invesco Ltd. | 2,696,150 | 5.50 | |||||
| 2026-02-10 | WELLINGTON MANAGEMENT GROUP LLP | 3,190,467 | 1,749,213 | -45.17 | 3.60 | -44.62 | ||
| 2025-11-14 | NOMURA HOLDINGS INC | 2,681,669 | 807,923 | -69.87 | 1.60 | -70.37 | ||
| 2025-04-17 | BlackRock, Inc. | 4,238,497 | 3,524,401 | -16.85 | 6.90 | -15.85 |
13F og NPORT arkivering
Detaljer om 13F-arkivering er gratis. Detaljer om NP-ansøgninger kræver et premium-medlemskab. Grønne rækker angiver nye positioner. Røde rækker angiver lukkede positioner. Klik på linket ikon for at se den fulde transaktionshistorik.
Opgrader
for at låse premium-data op og eksportere til Excel ![]() .
.
Important Note
In an effort to reduce load times for our mobile users, we are testing some ways to deliver lighter pages.
In this first test, we will deliver only the most recent 750 transactions (out of 757 for this stock). If you are interested in loading *all* the transactions for this company, click the "load all" button below. This is just a test and if you don't like it, please let us know by submitting some gentle feedback via the link at the bottom of this page.
Load All| Fil dato | Kilde | Investor | Type | Gennemsnitlig pris (Øst) |
Aktier | Δ Aktier (%) |
Rapporteret Værdi ($1000) |
Δ Værdi (%) |
Port Alloc (%) |
|
|---|---|---|---|---|---|---|---|---|---|---|
| 2026-02-12 | 13F | Nuveen, LLC | 126.820 | -16,72 | 25.298 | 6,18 | ||||
| 2026-02-17 | 13F | Creative Planning | 12.990 | 17,77 | 2.591 | 50,20 | ||||
| 2026-02-13 | 13F | Smartleaf Asset Management LLC | 744 | 14,46 | 150 | 57,89 | ||||
| 2026-02-12 | 13F | CIBC Private Wealth Group, LLC | 10.330 | 6,19 | 2.061 | 35,35 | ||||
| 2026-02-11 | 13F | Meeder Advisory Services, Inc. | 1.492 | 298 | ||||||
| 2026-02-17 | 13F | Balyasny Asset Management Llc | 208.559 | 37,79 | 41.603 | 75,68 | ||||
| 2026-02-05 | 13F | Bessemer Group Inc | 23.358 | 363,82 | 5 | |||||
| 2026-02-13 | 13F | OMERS ADMINISTRATION Corp | 58.529 | 15,83 | 11.675 | 47,69 | ||||
| 2026-02-02 | 13F | Oppenheimer Asset Management Inc. | 20.726 | -8,72 | 4.134 | 16,39 | ||||
| 2026-02-04 | 13F | Versor Investments LP | 2.802 | -52,41 | 559 | -39,41 | ||||
| 2025-11-14 | 13F | Perceptive Advisors Llc | 0 | -100,00 | 0 | |||||
| 2026-01-28 | 13F | B. Metzler seel. Sohn & Co. AG | 15.290 | 3.050 | ||||||
| 2026-01-30 | 13F | State of New Jersey Common Pension Fund D | 17.260 | -3,69 | 3.443 | 22,79 | ||||
| 2026-02-17 | 13F | MIRAE ASSET GLOBAL ETFS HOLDINGS Ltd. | 3.113 | -15,04 | 621 | 8,20 | ||||
| 2026-02-17 | 13F | Frontier Capital Management Co Llc | 123.701 | 146,05 | 24.676 | 213,69 | ||||
| 2026-02-12 | 13F | Colonial Trust Co / SC | 7 | 0,00 | 1 | 0,00 | ||||
| 2026-02-13 | 13F | Parkside Financial Bank & Trust | 996 | -15,59 | 199 | 7,61 | ||||
| 2026-01-23 | 13F | TFC Financial Management | 1 | 0,00 | 0 | |||||
| 2026-01-27 | 13F | Bayforest Capital Ltd | 193 | -79,96 | 38 | -74,67 | ||||
| 2026-02-12 | 13F | Quadrant Capital Group Llc | 2.630 | 0,11 | 525 | 27,49 | ||||
| 2026-02-13 | 13F | Bridgefront Capital, LLC | 0 | -100,00 | 0 | |||||
| 2026-02-12 | 13F | SWAN Capital LLC | 47 | 0,00 | 9 | 28,57 | ||||
| 2026-01-23 | 13F | Steigerwald, Gordon & Koch Inc. | 19 | 0,00 | 4 | 50,00 | ||||
| 2026-02-13 | 13F | Bridgewater Associates, LP | 22.054 | 10,78 | 4.399 | 41,27 | ||||
| 2026-02-09 | 13F | Employees Retirement System of Texas | 413 | 0,00 | 0 | |||||
| 2026-02-13 | 13F | Walleye Capital LLC | Call | 0 | -100,00 | 0 | -100,00 | |||
| 2026-02-17 | 13F | Boothbay Fund Management, Llc | Put | 10.300 | 2.055 | |||||
| 2026-02-17 | 13F | Boothbay Fund Management, Llc | 10.300 | 2.055 | ||||||
| 2026-01-16 | 13F | Louisbourg Investments Inc. | 10 | 0,00 | 2 | 0,00 | ||||
| 2026-02-17 | 13F | Vinva Investment Management Ltd | 1.132 | -69,60 | 341 | -59,01 | ||||
| 2025-11-14 | 13F | Cinctive Capital Management LP | 0 | -100,00 | 0 | -100,00 | ||||
| 2026-04-08 | 13F | Canandaigua National Corp | 0 | -100,00 | 0 | |||||
| 2026-02-11 | 13F | SOUTH STATE Corp | 12 | -29,41 | 2 | 0,00 | ||||
| 2026-02-13 | 13F | Cynosure Management, Llc | 2.477 | 494 | ||||||
| 2026-01-28 | 13F | Turtle Creek Wealth Advisors, LLC | 1.189 | 237 | ||||||
| 2026-02-11 | 13F | Prestige Wealth Management Group LLC | 29 | 0,00 | 6 | 25,00 | ||||
| 2025-11-14 | 13F | Texas Permanent School Fund | 0 | -100,00 | 0 | |||||
| 2026-01-23 | 13F | Legacy Bridge, LLC | 24 | 5 | ||||||
| 2026-02-10 | 13F | Amica Mutual Insurance Co | 23.030 | 3,91 | 5 | 33,33 | ||||
| 2026-02-17 | 13F | Advisory Services Network, LLC | 4.052 | 25,60 | 808 | 60,32 | ||||
| 2026-02-12 | 13F | Swiss National Bank | 97.100 | 2,00 | 19.370 | 30,05 | ||||
| 2026-02-09 | 13F | Geode Capital Management, Llc | 1.276.502 | 0,77 | 254.186 | 28,49 | ||||
| 2026-02-13 | 13F | Citigroup Inc | 48.939 | 36,56 | 9.762 | 74,10 | ||||
| 2026-02-17 | 13F | Wealth Watch Advisors, INC | 10 | 0,00 | 2 | 0,00 | ||||
| 2026-02-12 | 13F | BlackRock, Inc. | 3.754.354 | -2,64 | 748.918 | 24,13 | ||||
| 2026-02-12 | 13F | Fuller & Thaler Asset Management, Inc. | 0 | -100,00 | 0 | |||||
| 2026-02-17 | 13F | Wiley Bros.-aintree Capital, Llc | 3.462 | 9,90 | 689 | 41,19 | ||||
| 2026-04-10 | 13F | Abound Wealth Management | 7 | 0,00 | 1 | 0,00 | ||||
| 2026-02-10 | 13F | Bank of New York Mellon Corp | 332.234 | -19,97 | 66.274 | 2,04 | ||||
| 2026-02-09 | 13F | Leavell Investment Management, Inc. | 3.018 | 0,00 | 602 | 27,54 | ||||
| 2026-01-14 | 13F | Jfs Wealth Advisors, Llc | 31 | 121,43 | 6 | 200,00 | ||||
| 2026-04-13 | 13F | True Wealth Design, LLC | 120 | -8,40 | 21 | -23,08 | ||||
| 2026-02-09 | 13F | Key FInancial Inc | 1 | 0,00 | 0 | |||||
| 2026-02-02 | 13F | Danske Bank A/s | 51.016 | 96,13 | 10.177 | 150,09 | ||||
| 2026-02-17 | 13F | Trexquant Investment LP | 0 | -100,00 | 0 | |||||
| 2026-02-17 | 13F | Howard Hughes Medical Institute | 11 | 0,00 | 2 | 100,00 | ||||
| 2025-11-14 | 13F | Nomura Holdings Inc | Call | 0 | -100,00 | 0 | -100,00 | |||
| 2025-11-14 | 13F | Nomura Holdings Inc | Put | 0 | -100,00 | 0 | -100,00 | |||
| 2026-02-04 | 13F | Beverly Hills Private Wealth, LLC | 1.512 | 0,00 | 237 | 0,00 | ||||
| 2026-02-13 | 13F | Soros Fund Management Llc | 6.778 | 1.352 | ||||||
| 2026-02-11 | 13F | WESCAP Management Group, Inc. | 2.085 | -14,65 | 416 | 8,64 | ||||
| 2026-01-15 | 13F | Allspring Global Investments Holdings, LLC | 1.995.596 | -8,37 | 403.949 | 8,79 | ||||
| 2026-04-13 | 13F | Massmutual Trust Co Fsb/adv | 386 | -15,72 | 67 | -27,47 | ||||
| 2026-02-17 | 13F | Empyrean Capital Partners, LP | 121.500 | 24.237 | ||||||
| 2026-01-30 | 13F | Wealthfront Advisers Llc | 1.366 | 272 | ||||||
| 2026-04-07 | 13F | Park Avenue Securities Llc | 1.835 | -10,79 | 0 | |||||
| 2026-02-11 | 13F | CNB Bank | 536 | -31,19 | 107 | -12,40 | ||||
| 2026-02-12 | 13F | Northwest & Ethical Investments L.P. | 3.868 | -9,84 | 781 | 23,97 | ||||
| 2026-02-13 | 13F | Delos Wealth Advisors, LLC | 29 | 6 | ||||||
| 2026-02-17 | 13F | Adage Capital Partners Gp, L.l.c. | 311.657 | 131,65 | 62.169 | 195,35 | ||||
| 2025-11-13 | 13F | Glenmede Investment Management, LP | 2.606 | -12,99 | 408 | -10,35 | ||||
| 2026-02-09 | 13F | Cooke & Bieler Lp | 607.565 | 0,61 | 121.197 | 28,28 | ||||
| 2026-02-13 | 13F | Barclays Plc | 59.134 | -60,93 | 11.796 | -50,19 | ||||
| 2026-01-26 | 13F | Mirae Asset Global Investments Co., Ltd. | 8.277 | 16,82 | 1.651 | 49,01 | ||||
| 2026-02-11 | 13F | Parallel Advisors, LLC | 664 | 5,56 | 133 | 34,69 | ||||
| 2026-02-12 | 13F | Commonwealth Equity Services, Llc | 9.349 | -7,61 | 1.865 | 186.300,00 | ||||
| 2026-02-17 | 13F | Clear Street Markets Llc | 74 | -13,95 | 15 | 7,69 | ||||
| 2026-02-05 | 13F | Qsemble Capital Management, LP | 3.346 | 667 | ||||||
| 2026-02-13 | 13F | Walleye Trading LLC | Call | 2.600 | -40,91 | 519 | -24,71 | |||
| 2026-04-07 | 13F | Signaturefd, Llc | 1.305 | -2,61 | 225 | -15,73 | ||||
| 2026-02-13 | 13F | Walleye Trading LLC | 935 | 187 | ||||||
| 2026-02-03 | 13F | Maxi Investments CY Ltd | 0 | -100,00 | 0 | |||||
| 2026-02-13 | 13F | Walleye Trading LLC | Put | 700 | -88,89 | 140 | -85,89 | |||
| 2026-02-11 | 13F | Manchester Capital Management LLC | 6 | 1 | ||||||
| 2026-02-13 | 13F | Storgate, LLC | 1.315 | 262 | ||||||
| 2026-02-17 | 13F | Integral Health Asset Management, LLC | 0 | -100,00 | 0 | -100,00 | ||||
| 2025-10-28 | 13F | CarsonAllaria Wealth Management, Ltd. | 0 | -100,00 | 0 | -100,00 | ||||
| 2025-11-21 | 13F/A | CIBC Bancorp USA Inc. | 5.025 | 786 | ||||||
| 2026-01-20 | 13F | Lawson Kroeker Investment Management Inc/ne | 31.638 | -36,62 | 6.311 | -19,18 | ||||
| 2026-01-05 | 13F | Chesapeake Asset Management Llc | 0 | -100,00 | 0 | |||||
| 2026-02-17 | 13F | Advisor Group Holdings, Inc. | 2.266 | -19,24 | 452 | 2,49 | ||||
| 2026-02-13 | 13F | Transamerica Financial Advisors, Inc. | 18 | 4 | ||||||
| 2026-04-13 | 13F | Clayton Financial Group LLC | 4 | -55,56 | 1 | -100,00 | ||||
| 2026-01-29 | 13F | IMC-Chicago, LLC | Call | 10.200 | -0,97 | 2.035 | 26,26 | |||
| 2026-02-17 | 13F | Captrust Financial Advisors | 5.278 | -1,09 | 1.053 | 26,14 | ||||
| 2026-02-12 | 13F | Gould Capital, LLC | 6 | -81,82 | 1 | -80,00 | ||||
| 2026-02-13 | 13F | Ubs Asset Management Americas Inc | 208.932 | 0,32 | 41.678 | 27,91 | ||||
| 2026-02-06 | 13F | Cullen/frost Bankers, Inc. | 114 | -7,32 | 23 | 15,79 | ||||
| 2025-10-24 | 13F | ORG Wealth Partners, LLC | 0 | -100,00 | 0 | |||||
| 2026-04-08 | 13F | DiNuzzo Private Wealth, Inc. | 7 | 0,00 | 1 | 0,00 | ||||
| 2026-02-17 | 13F | Longaeva Partners L.P. | 0 | -100,00 | 0 | |||||
| 2026-02-18 | 13F | GWM Advisors LLC | 262 | 0,00 | 52 | 30,00 | ||||
| 2026-02-03 | 13F | Everence Capital Management Inc | 1.279 | 0,00 | 0 | |||||
| 2026-02-05 | 13F | Canada Post Corp Registered Pension Plan | 12.180 | 34,26 | 2.430 | 82,22 | ||||
| 2026-04-02 | 13F | Hilltop National Bank | 442 | 0,00 | 76 | -13,64 | ||||
| 2026-03-20 | 13F | Purpose Unlimited Inc. | 3.501 | 698 | ||||||
| 2025-11-14 | 13F | Capitolis Liquid Global Markets LLC | 0 | -100,00 | 0 | |||||
| 2026-04-06 | 13F | Versant Capital Management, Inc | 2.095 | 17,24 | 361 | 1,40 | ||||
| 2026-01-29 | 13F | RMG Wealth Management LLC | 5 | 1 | ||||||
| 2026-02-17 | 13F | ExodusPoint Capital Management, LP | 0 | -100,00 | 0 | -100,00 | ||||
| 2026-02-09 | 13F | Quest Partners LLC | 2.108 | 4,15 | 421 | 32,91 | ||||
| 2026-02-09 | 13F | Legal & General Group Plc | 106.430 | -1,68 | 21.231 | 25,38 | ||||
| 2026-01-21 | 13F | SJS Investment Consulting Inc. | 256 | -17,15 | 51 | 6,25 | ||||
| 2026-02-13 | 13F | Dynamic Technology Lab Private Ltd | 0 | -100,00 | 0 | |||||
| 2026-02-05 | 13F | AlphaCore Capital LLC | 1.255 | 250 | ||||||
| 2026-02-12 | 13F | BRYN MAWR TRUST Co | 0 | -100,00 | 0 | |||||
| 2026-02-11 | 13F | Metis Global Partners, LLC | 1.068 | 213 | ||||||
| 2026-02-17 | 13F | Polymer Capital Management (US) LLC | 0 | -100,00 | 0 | |||||
| 2026-04-08 | 13F | Cardinal Capital Management | 11.031 | 0,94 | 1.903 | -12,71 | ||||
| 2026-02-02 | 13F | Horizon Investments, LLC | 821 | 1,11 | 164 | 28,35 | ||||
| 2026-04-08 | 13F | Beacon Financial Strategies CORP | 4 | 0,00 | 1 | |||||
| 2026-02-05 | 13F | Elyxium Wealth, LLC | 233 | 46 | ||||||
| 2026-02-13 | 13F | Squarepoint Ops LLC | Put | 0 | -100,00 | 0 | -100,00 | |||
| 2026-02-12 | 13F | Skopos Labs, Inc. | 1.778 | 361 | ||||||
| 2025-11-06 | 13F | CBIZ Investment Advisory Services, LLC | 0 | -100,00 | 0 | |||||
| 2026-02-13 | 13F | Squarepoint Ops LLC | Call | 0 | -100,00 | 0 | -100,00 | |||
| 2026-02-17 | 13F | T. Rowe Price Investment Management, Inc. | 41 | 0,00 | 0 | |||||
| 2026-02-11 | 13F | Picton Mahoney Asset Management | 73.468 | -6,18 | 14.655 | 122.025,00 | ||||
| 2026-04-13 | 13F | Mather Group, Llc. | 51 | 9 | ||||||
| 2026-02-17 | 13F | SummitTX Capital, L.P. | 13.066 | 2.606 | ||||||
| 2026-01-06 | 13F | Ransom Advisory, Ltd | 131 | 0,00 | 26 | 30,00 | ||||
| 2026-02-04 | 13F | Virginia Retirement Systems Et Al | 13.200 | -5,71 | 2.633 | 20,23 | ||||
| 2026-01-30 | 13F | Catalytic Wealth RIA, LLC | 0 | -100,00 | 0 | |||||
| 2026-01-09 | 13F | Assenagon Asset Management S.A. | 65.879 | 104,03 | 13.142 | 160,17 | ||||
| 2026-01-09 | 13F | SG Americas Securities, LLC | 181.778 | 36 | ||||||
| 2026-01-14 | 13F | Mitchell & Pahl Private Wealth, Llc | 5.102 | -0,51 | 1.018 | 26,81 | ||||
| 2026-04-14 | 13F | Bay Harbor Wealth Management, LLC | 6 | 20,00 | 1 | |||||
| 2025-10-27 | 13F | First Horizon Corp | 0 | -100,00 | 0 | |||||
| 2026-01-27 | 13F | Zurcher Kantonalbank (Zurich Cantonalbank) | 14.796 | 5,58 | 2.952 | 34,63 | ||||
| 2025-11-14 | 13F | Strategic Wealth Partners, Ltd. | 32 | 0,00 | 5 | 25,00 | ||||
| 2026-02-05 | 13F | Northwestern Mutual Investment Management Company, Llc | 1.572 | 0,26 | 314 | 27,76 | ||||
| 2026-02-17 | 13F | Woodline Partners LP | 350.667 | 69.951 | ||||||
| 2026-04-03 | 13F | Investors Research Corp | 8 | 1 | ||||||
| 2025-11-14 | 13F | Junto Capital Management LP | 0 | -100,00 | 0 | |||||
| 2026-02-12 | 13F | Johnson Financial Group, Inc. | 7 | 0,00 | 1 | 0,00 | ||||
| 2026-02-12 | 13F | Castleark Management Llc | 32.245 | 3,13 | 6.432 | 31,51 | ||||
| 2026-02-17 | 13F | Humankind Investments LLC | 0 | -100,00 | 0 | |||||
| 2026-04-10 | 13F/A | OP Asset Management Ltd | 2.340 | 404 | ||||||
| 2026-02-17 | 13F | Magnetar Financial LLC | 4.804 | -79,27 | 958 | -73,57 | ||||
| 2026-02-02 | 13F | Truist Financial Corp | 4.374 | -1,44 | 873 | 25,65 | ||||
| 2026-02-04 | 13F | Atlantic Union Bankshares Corp | 200 | 0,00 | 40 | 25,81 | ||||
| 2026-02-11 | 13F | Deutsche Bank Ag\ | 188.096 | -14,54 | 37.521 | 8,96 | ||||
| 2026-01-16 | 13F | Ronald Blue Trust, Inc. | 2.432 | -12,36 | 485 | 11,75 | ||||
| 2026-02-17 | 13F | Rakuten Investment Management, Inc. | 4.389 | -94,30 | 892 | -70,45 | ||||
| 2026-01-12 | 13F | Rialto Wealth Management, LLC | 13 | 18,18 | 3 | 100,00 | ||||
| 2026-02-12 | 13F | MetLife Investment Management, LLC | 11.789 | -3,36 | 2.352 | 23,22 | ||||
| 2026-02-10 | 13F | Core Wealth Advisors, Llc | 3 | 1 | ||||||
| 2026-02-12 | 13F | Voya Investment Management Llc | 9.704 | -7,14 | 1.936 | 18,35 | ||||
| 2026-02-13 | 13F | Pinnacle Wealth Planning Services, Inc. | 196 | 39 | ||||||
| 2026-02-11 | 13F | CLARET ASSET MANAGEMENT Corp | 1.525 | -0,20 | 0 | |||||
| 2026-02-12 | 13F | Cloud Capital Management, LLC | 0 | -100,00 | 0 | |||||
| 2026-01-28 | 13F | Mowery & Schoenfeld Wealth Management, LLC | 6 | 1 | ||||||
| 2025-11-14 | 13F | Cubist Systematic Strategies, LLC | Put | 31.100 | -17,29 | 4.866 | -14,72 | |||
| 2026-02-18 | 13F | Mackenzie Financial Corp | 781.476 | -21,49 | 157.532 | 1,15 | ||||
| 2026-01-23 | 13F | Brown Miller Wealth Management, LLC | 1.194 | 238 | ||||||
| 2026-02-10 | 13F | Meramec Financial Planners, LLC | 34 | 6 | ||||||
| 2025-11-14 | 13F | Cubist Systematic Strategies, LLC | Call | 18.200 | -16,89 | 2.848 | -14,30 | |||
| 2026-02-13 | 13F | Mml Investors Services, Llc | 9.008 | 6,13 | 1.797 | 35,34 | ||||
| 2026-01-07 | 13F | Harbor Investment Advisory, Llc | 26 | -91,39 | 5 | -89,36 | ||||
| 2026-02-17 | 13F | North Capital, Inc. | 0 | -100,00 | 0 | |||||
| 2026-01-23 | 13F | Avion Wealth | 7 | 75,00 | 0 | |||||
| 2026-02-12 | 13F | Bank Of Montreal /can/ | Put | 5.000 | 997 | |||||
| 2026-02-17 | 13F | Caisse De Depot Et Placement Du Quebec | 0 | -100,00 | 0 | |||||
| 2026-02-12 | 13F | Bank Of Montreal /can/ | Call | 1.200 | 239 | |||||
| 2026-01-26 | 13F | Asset Dedication, LLC | 91 | 0,00 | 18 | 28,57 | ||||
| 2026-02-11 | 13F | Empowered Funds, LLC | 5.293 | 7,67 | 1.056 | 37,19 | ||||
| 2026-02-12 | 13F | Bank Of Montreal /can/ | 387.917 | 1.150,22 | 77.382 | 1.494,17 | ||||
| 2026-03-25 | 13F/A | Barclays Plc | Put | 0 | -100,00 | 0 | -100,00 | |||
| 2026-02-17 | 13F | Raymond James Financial Inc | 122.254 | 448,77 | 24.387 | 599,77 | ||||
| 2026-04-13 | 13F | E Fund Management Co., Ltd. | 2.006 | 7,04 | 346 | 21,83 | ||||
| 2026-02-17 | 13F | Bank Of America Corp /de/ | 1.080.527 | -7,12 | 215.544 | 18,42 | ||||
| 2026-02-11 | 13F | Ing Groep Nv | 6.360 | -0,03 | 1.269 | 27,44 | ||||
| 2026-02-17 | 13F | Rock Springs Capital Management LP | 0 | -100,00 | 0 | |||||
| 2026-02-10 | 13F | Moors & Cabot, Inc. | 1.685 | 0,00 | 336 | 27,76 | ||||
| 2026-02-09 | 13F | Keating Financial Advisory Services, Inc. | 25 | 5 | ||||||
| 2026-02-13 | 13F | Neuberger Berman Group LLC | 860.158 | 1,25 | 171.606 | 29,18 | ||||
| 2026-02-11 | 13F | Franklin Resources Inc | 120.883 | 321,69 | 24.114 | 437,64 | ||||
| 2026-02-17 | 13F | Optiver Holding B.V. | 103 | 21 | ||||||
| 2026-02-06 | 13F | Kingdom Financial Group LLC. | 18 | 4 | ||||||
| 2026-02-13 | 13F | MAI Capital Management | 118 | 16,83 | 24 | 53,33 | ||||
| 2026-02-09 | 13F | Jefferies Financial Group Inc. | 0 | -100,00 | 0 | |||||
| 2026-01-21 | 13F | Crews Bank & Trust | 60 | 0,00 | 12 | 22,22 | ||||
| 2026-01-20 | 13F | Stratos Wealth Partners, LTD. | 1.182 | 236 | ||||||
| 2026-02-05 | 13F | Gabelli Funds Llc | 1.700 | -90,81 | 339 | -88,29 | ||||
| 2026-02-11 | 13F | Twin Tree Management, LP | 0 | -100,00 | 0 | -100,00 | ||||
| 2026-01-29 | 13F | Concurrent Investment Advisors, LLC | 1.339 | 267 | ||||||
| 2026-02-13 | 13F | Kennedy Capital Management, Inc. | 45.653 | 3,97 | 9.107 | 32,57 | ||||
| 2025-11-14 | 13F | Mbb Public Markets I Llc | 0 | -100,00 | 0 | |||||
| 2026-02-06 | 13F | Texas Bank & Trust Co | 1.600 | 0,00 | 319 | 27,60 | ||||
| 2026-02-17 | 13F | Aristotle Capital Boston, LLC | 86.214 | -9,58 | 17.198 | 15,28 | ||||
| 2026-02-11 | 13F | Winton Capital Group Ltd | 46.163 | 9.209 | ||||||
| 2026-02-04 | 13F | Summit Wealth Group Llc / Co | 0 | -100,00 | 0 | |||||
| 2026-02-13 | 13F | Arrowstreet Capital, Limited Partnership | 836.240 | 8,68 | 166.813 | 38,57 | ||||
| 2026-02-17 | 13F | Agf Management Ltd | 17.972 | 3.585 | ||||||
| 2026-02-17 | 13F | Abel Hall, LLC | 1.379 | 275 | ||||||
| 2026-02-06 | 13F | HighTower Advisors, LLC | 3.985 | -0,45 | 795 | 26,84 | ||||
| 2026-02-02 | 13F | Fifth Third Bancorp | 11.731 | -5,33 | 2.340 | 20,74 | ||||
| 2026-02-09 | 13F | Huntington National Bank | 624 | 0,65 | 124 | 27,84 | ||||
| 2026-02-11 | 13F | Group One Trading, L.p. | Put | 0 | -100,00 | 0 | -100,00 | |||
| 2026-02-17 | 13F | Two Sigma Investments, Lp | 28.105 | -58,52 | 5.606 | -47,12 | ||||
| 2026-02-13 | 13F | Chevy Chase Trust Holdings, Inc. | 24.952 | -0,65 | 4.977 | 26,67 | ||||
| 2026-02-17 | 13F | Algert Global Llc | 32.866 | -70,88 | 7 | -64,71 | ||||
| 2026-02-17 | 13F | Iron Triangle Partners LP | 379.728 | 41,69 | 75.748 | 80,65 | ||||
| 2026-02-17 | 13F | Aquatic Capital Management LLC | 0 | -100,00 | 0 | |||||
| 2026-01-28 | 13F | Klp Kapitalforvaltning As | 12.800 | -0,78 | 2.553 | 26,51 | ||||
| 2026-02-12 | 13F | Campbell & CO Investment Adviser LLC | 0 | -100,00 | 0 | |||||
| 2026-02-19 | 13F | CI Private Wealth, LLC | 35.170 | 236,17 | 3.524 | 115,34 | ||||
| 2026-04-09 | 13F | Veracity Capital LLC | 0 | -100,00 | 0 | |||||
| 2026-02-17 | 13F | Aristeia Capital Llc | 0 | -100,00 | 0 | -100,00 | ||||
| 2026-02-10 | 13F | Thompson Siegel & Walmsley Llc | 0 | -100,00 | 0 | |||||
| 2026-01-23 | 13F | Sage Mountain Advisors LLC | 1.865 | 20,09 | 372 | 53,72 | ||||
| 2026-02-17 | 13F | Persistent Asset Partners Ltd | 2.099 | 419 | ||||||
| 2026-02-17 | 13F | Wellington Management Group Llp | 1.749.213 | -45,17 | 348.933 | -30,10 | ||||
| 2026-01-21 | 13F | Azzad Asset Management Inc /adv | 0 | -100,00 | 0 | |||||
| 2026-02-02 | 13F | Strs Ohio | 1.168 | 0,17 | 233 | 27,47 | ||||
| 2026-02-13 | 13F | Epoch Investment Partners, Inc. | 27.439 | 3,40 | 5.474 | 31,82 | ||||
| 2026-02-13 | 13F | Marshall Wace, Llp | 124.193 | -10,08 | 24.774 | 14,65 | ||||
| 2026-04-13 | 13F | Salem Investment Counselors Inc | 145 | 25 | ||||||
| 2026-02-17 | 13F | Ancora Advisors, LLC | 154 | 170,18 | 31 | 275,00 | ||||
| 2026-02-13 | 13F | Ambassador Advisors, LLC | 7.379 | 1.472 | ||||||
| 2026-02-13 | 13F | American Century Companies Inc | 8.064 | 55,53 | 1.609 | 98,27 | ||||
| 2026-02-12 | 13F | Snyder Capital Management L P | 240.963 | 35,44 | 48.067 | 72,69 | ||||
| 2026-02-04 | 13F | Wsfs Capital Management, Llc | 1.809 | 0,00 | 361 | 27,21 | ||||
| 2026-02-10 | 13F | Daiwa Securities Group Inc. | 9.346 | -19,66 | 2 | 0,00 | ||||
| 2026-02-17 | 13F | Nomura Holdings Inc | 2.843 | -99,65 | 567 | -99,55 | ||||
| 2026-01-29 | 13F | Quent Capital, LLC | 133 | -8,28 | 27 | 18,18 | ||||
| 2026-02-10 | 13F | Rothschild Investment Llc | 191 | 2,69 | 38 | 31,03 | ||||
| 2026-01-13 | 13F | Riverbridge Partners Llc | 99.328 | -20,73 | 19.814 | 1,06 | ||||
| 2026-02-13 | 13F | Y-Intercept (Hong Kong) Ltd | 9.368 | 24,48 | 1.869 | 58,71 | ||||
| 2026-02-13 | 13F | Alyeska Investment Group, L.P. | 644.726 | 120,66 | 128.610 | 181,33 | ||||
| 2026-02-09 | 13F | Mizuho Securities Usa Llc | 3.584 | 0,00 | 638 | 9,06 | ||||
| 2026-02-17 | 13F | Two Sigma Advisers, Lp | 2.300 | 459 | ||||||
| 2026-02-10 | 13F | Hillsdale Investment Management Inc. | 5.320 | -15,82 | 1.061 | 7,39 | ||||
| 2025-11-14 | 13F | Two Sigma Securities, Llc | 0 | -100,00 | 0 | |||||
| 2026-04-08 | 13F | Grove Bank & Trust | 17 | 1.600,00 | 3 | |||||
| 2025-11-13 | 13F | Perbak Capital Partners LLP | 0 | -100,00 | 0 | |||||
| 2026-02-13 | 13F | Blueshift Asset Management, LLC | 0 | -100,00 | 0 | |||||
| 2026-02-13 | 13F | Public Sector Pension Investment Board | 0 | -100,00 | 0 | |||||
| 2026-02-13 | 13F | Macquarie Group Ltd | 202.141 | -12,15 | 40.323 | 12,01 | ||||
| 2026-02-09 | 13F | Wcm Investment Management, Llc | 102.234 | 20.649 | ||||||
| 2026-02-17 | 13F | First Manhattan Co | 10.837 | 2.162 | ||||||
| 2025-11-13 | 13F | GeoWealth Management, LLC | 0 | -100,00 | 0 | |||||
| 2026-02-10 | 13F | Envestnet Asset Management Inc | 70.130 | -14,05 | 13.989 | 9,58 | ||||
| 2026-02-17 | 13F | Armistice Capital, Llc | 0 | -100,00 | 0 | |||||
| 2026-02-13 | 13F/A | Ontario Teachers Pension Plan Board | 0 | -100,00 | 0 | -100,00 | ||||
| 2026-01-20 | 13F | AdvisorNet Financial, Inc | 59 | 7,27 | 12 | 37,50 | ||||
| 2026-01-29 | 13F | Inscription Capital, LLC | 5.429 | -7,92 | 1.083 | 17,35 | ||||
| 2026-02-13 | 13F | Landscape Capital Management, L.l.c. | 8.002 | 14,77 | 1.596 | 46,42 | ||||
| 2026-02-13 | 13F | South Plains Financial, Inc. | 15 | 0,00 | 3 | 0,00 | ||||
| 2026-02-17 | 13F | Schonfeld Strategic Advisors LLC | 50.882 | 87,33 | 10.150 | 138,86 | ||||
| 2026-01-21 | 13F | Flagship Harbor Advisors, Llc | 70 | 14 | ||||||
| 2026-04-14 | 13F | Prospera Financial Services Inc | 1.809 | -5,58 | 312 | -18,32 | ||||
| 2026-02-12 | 13F | Penserra Capital Management LLC | 0 | -100,00 | 0 | |||||
| 2026-02-12 | 13F | Earnest Partners Llc | 988.259 | -1,83 | 197.138 | 25,16 | ||||
| 2026-02-13 | 13F | Pathstone Holdings, LLC | 6.649 | 8,22 | 1.326 | 37,98 | ||||
| 2026-02-17 | 13F | State Of Wisconsin Investment Board | 34.797 | -16,04 | 6.941 | 7,05 | ||||
| 2026-02-12 | 13F | Cibc World Markets Corp | 5.139 | 24,25 | 1.025 | 63,48 | ||||
| 2026-02-17 | 13F | Brevan Howard Capital Management LP | 0 | -100,00 | 0 | |||||
| 2026-02-17 | 13F | Quadrature Capital Ltd | 6.837 | -30,60 | 1.364 | -11,55 | ||||
| 2025-12-09 | 13F/A | Tudor Investment Corp Et Al | Call | 0 | -100,00 | 0 | ||||
| 2026-02-03 | 13F | We Are One Seven, LLC | 1.246 | -5,03 | 249 | 20,98 | ||||
| 2025-11-14 | 13F | Jain Global LLC | 0 | -100,00 | 0 | -100,00 | ||||
| 2026-02-20 | 13F | Kovitz Investment Group Partners, LLC | 0 | -100,00 | 0 | |||||
| 2026-01-28 | 13F | Geneos Wealth Management Inc. | 741 | 292,06 | 148 | 406,90 | ||||
| 2026-01-12 | 13F | Contravisory Investment Management, Inc. | 6.129 | 1.223 | ||||||
| 2025-10-23 | 13F | Lecap Asset Management Ltd | 0 | -100,00 | 0 | |||||
| 2026-02-11 | 13F | Los Angeles Capital Management Llc | 210 | 38 | ||||||
| 2026-02-17 | 13F | Susquehanna International Group, Llp | 23.707 | -28,59 | 4.729 | -8,95 | ||||
| 2026-01-21 | 13F | Yousif Capital Management, Llc | 5.236 | -5,44 | 1.142 | 31,87 | ||||
| 2026-02-17 | 13F | Susquehanna International Group, Llp | Put | 30.800 | -70,36 | 6.144 | -62,21 | |||
| 2025-12-09 | 13F/A | Tudor Investment Corp Et Al | Put | 0 | -100,00 | 0 | ||||
| 2026-02-10 | 13F | New Mexico Educational Retirement Board | 2.300 | 4,55 | 0 | |||||
| 2026-02-17 | 13F | Janus Henderson Group Plc | 22.200 | -6,15 | 4.432 | 19,79 | ||||
| 2026-01-16 | 13F | Louisiana State Employees Retirement System | 2.500 | -3,85 | 499 | 22,66 | ||||
| 2026-02-09 | 13F | Smithfield Trust Co | 239 | 1,70 | 0 | |||||
| 2025-10-17 | 13F | Hm Payson & Co | 0 | -100,00 | 0 | |||||
| 2026-02-04 | 13F | Madison Asset Management, LLC | 15.622 | 26,33 | 3.116 | 61,12 | ||||
| 2026-02-10 | 13F | Root Financial Partners, LLC | 160 | 41,59 | 32 | 82,35 | ||||
| 2025-11-14 | 13F | Snowden Capital Advisors LLC | 0 | -100,00 | 0 | -100,00 | ||||
| 2026-02-17 | 13F | Cape Investment Advisory, Inc. | 204 | 2,00 | 41 | 29,03 | ||||
| 2026-04-09 | 13F | Park Place Capital Corp | 195 | 0,00 | 34 | -13,16 | ||||
| 2026-02-05 | 13F | HFM Investment Advisors, LLC | 3 | 0,00 | 1 | |||||
| 2026-02-13 | 13F | Manufacturers Life Insurance Company, The | 0 | -100,00 | 0 | |||||
| 2025-11-14 | 13F | AXA Investment Managers S.A. | 7.039 | 1.101 | ||||||
| 2026-01-29 | 13F | Dunhill Financial, LLC | 2 | 100,00 | 0 | |||||
| 2026-02-17 | 13F | Hollow Brook Wealth Management LLC | 12.043 | -9,95 | 2.402 | 14,82 | ||||
| 2026-02-11 | 13F | Harvest Fund Management Co., Ltd | 1 | 0,00 | 0 | |||||
| 2026-02-17 | 13F | Susquehanna International Group, Llp | Call | 84.800 | -20,60 | 16.916 | 1,23 | |||
| 2026-02-13 | 13F | National Bank Of Canada /fi/ | 27.146 | -97,13 | 5.415 | -96,34 | ||||
| 2026-02-17 | 13F | Credit Agricole S A | 0 | -100,00 | 0 | |||||
| 2026-02-03 | 13F | Ethic Inc. | 5.395 | 0,88 | 1.076 | 28,71 | ||||
| 2026-02-13 | 13F | Baird Financial Group, Inc. | 1.847 | -1,18 | 368 | 26,03 | ||||
| 2025-11-13 | 13F | Riggs Asset Managment Co. Inc. | 0 | -100,00 | 0 | |||||
| 2025-11-12 | 13F/A | Tableaux Llc | 0 | -100,00 | 0 | |||||
| 2026-02-04 | 13F | Clark Wealth Partners | 3 | 0,00 | 1 | |||||
| 2026-02-12 | 13F | DRW Securities, LLC | 1.056 | 211 | ||||||
| 2026-02-17 | 13F | Oxford Asset Management Llp | 0 | -100,00 | 0 | -100,00 | ||||
| 2026-02-23 | 13F | Mv Capital Management, Inc. | 77 | 5,48 | 15 | 36,36 | ||||
| 2026-01-09 | 13F | Congress Asset Management Co /ma | 0 | -100,00 | 0 | |||||
| 2026-04-07 | 13F | CoreCap Advisors, LLC | 29 | 0,00 | 5 | 0,00 | ||||
| 2025-11-06 | 13F | Mechanics Financial Corp | 0 | -100,00 | 0 | -100,00 | ||||
| 2026-01-27 | 13F | GHP Investment Advisors, Inc. | 26 | 0,00 | 5 | 25,00 | ||||
| 2026-02-02 | 13F | PKO Investment Management Joint-Stock Co | 0 | -100,00 | 0 | |||||
| 2026-02-11 | 13F | Primecap Management Co/ca/ | 266.890 | -1,35 | 53.239 | 25,78 | ||||
| 2026-02-13 | 13F | Commerce Bank | 4.551 | -11,77 | 908 | 12,39 | ||||
| 2026-02-17 | 13F | Tower Research Capital LLC (TRC) | 2.480 | 133,74 | 495 | 197,59 | ||||
| 2026-02-13 | 13F | Quarry LP | 0 | -100,00 | 0 | |||||
| 2026-02-17 | 13F | Alliancebernstein L.p. | 300.416 | 36,57 | 59.927 | 74,12 | ||||
| 2026-02-13 | 13F | Healthcare Of Ontario Pension Plan Trust Fund | 1.945 | -0,21 | 388 | 27,30 | ||||
| 2026-02-17 | 13F | Summit Trail Advisors, Llc | 17.109 | -7,77 | 3.413 | 17,57 | ||||
| 2026-02-04 | 13F | Paradigm Asset Management Co Llc | 176 | 0,00 | 35 | 29,63 | ||||
| 2026-02-11 | 13F | O'shaughnessy Asset Management, Llc | 2.903 | 19,07 | 579 | 51,97 | ||||
| 2026-02-12 | 13F | Xponance, Inc. | 4.154 | 8,43 | 829 | 38,23 | ||||
| 2026-02-10 | 13F | Commonwealth Of Pennsylvania Public School Empls Retrmt Sys | 11.448 | -3,13 | 2.284 | 23,47 | ||||
| 2026-02-13 | 13F | Van Eck Associates Corp | 35.501 | -8,48 | 7 | 16,67 | ||||
| 2026-04-13 | 13F | Gateway Investment Advisers Llc | 3.532 | 5,81 | 609 | -8,42 | ||||
| 2026-04-06 | 13F | Highline Wealth Partners Llc | 7 | 1 | ||||||
| 2026-02-12 | 13F | IFC & Insurance Marketing, Inc. | 4 | 0 | ||||||
| 2026-02-20 | 13F | Sunbelt Securities, Inc. | 6 | 0,00 | 1 | |||||
| 2026-02-02 | 13F | Van Berkom & Associates Inc. | 450.690 | -9,30 | 90 | 15,58 | ||||
| 2026-02-06 | 13F | ProShare Advisors LLC | 10.756 | -18,22 | 2.146 | 4,28 | ||||
| 2026-01-30 | 13F | Interchange Capital Partners, LLC | 1.368 | 273 | ||||||
| 2026-03-12 | 13F/A | Eos Management, L.P. | 4.206 | 839 | ||||||
| 2026-01-13 | 13F | Fort Washington Investment Advisors Inc /oh/ | 1.300 | 0,00 | 259 | 27,59 | ||||
| 2026-01-21 | 13F | Cambridge Advisors Inc. | 1.200 | 239 | ||||||
| 2026-02-12 | 13F | Wealthspire Advisors, LLC | 0 | -100,00 | 0 | |||||
| 2026-02-17 | 13F | Cresset Asset Management, LLC | 4.821 | -0,08 | 962 | 27,45 | ||||
| 2026-02-10 | 13F | Westpac Banking Corp | 952 | -0,73 | 190 | 26,00 | ||||
| 2026-02-10 | 13F | MUFG Securities EMEA plc | 2.020 | 114,44 | 403 | 173,47 | ||||
| 2026-01-29 | 13F | Sanctuary Advisors, LLC | 5.851 | -6,31 | 1.167 | 19,45 | ||||
| 2025-11-21 | 13F | Nebula Research & Development LLC | 0 | -100,00 | 0 | |||||
| 2025-11-14 | 13F/A | NorthRock Partners, LLC | 0 | -100,00 | 0 | |||||
| 2026-01-14 | 13F | Spire Wealth Management | 915 | 0,22 | 183 | 28,17 | ||||
| 2026-02-12 | 13F | Ci Investments Inc. | 0 | -100,00 | 0 | |||||
| 2026-02-17 | 13F | VARCOV Co. | 1.774 | 354 | ||||||
| 2026-02-13 | 13F | Prudential Financial Inc | 37.986 | -21,04 | 7.577 | 0,68 | ||||
| 2026-02-10 | 13F | Bnp Paribas Arbitrage, Sa | 162.740 | 48,11 | 32.463 | 88,84 | ||||
| 2026-02-12 | 13F | Triumph Capital Management | 7 | 0,00 | 1 | 0,00 | ||||
| 2026-02-17 | 13F | Redwood Investment Management, Llc | 5.477 | 1 | ||||||
| 2026-01-28 | 13F | HB Wealth Management, LLC | 2.528 | 14,49 | 504 | 46,09 | ||||
| 2026-01-29 | 13F | Vanguard Group Inc | 5.887.175 | 0,81 | 1.174.374 | 28,53 | ||||
| 2026-02-06 | 13F | Resona Asset Management Co.,Ltd. | 584 | 0,00 | 119 | 38,82 | ||||
| 2026-02-03 | 13F | Sumitomo Mitsui DS Asset Management Company, Ltd | 1.271 | 254 | ||||||
| 2026-02-17 | 13F | Meridiem Capital Partners LP | 132.883 | 88,57 | 26.508 | 140,43 | ||||
| 2026-02-12 | 13F | Brown Brothers Harriman & Co | 653 | 35,48 | 130 | 73,33 | ||||
| 2026-02-13 | 13F | Edgestream Partners, L.P. | 0 | -100,00 | 0 | |||||
| 2026-02-12 | 13F | Jane Street Group, Llc | Put | 0 | -100,00 | 0 | -100,00 | |||
| 2026-02-12 | 13F | Woodley Farra Manion Portfolio Management Inc | 1.269 | 253 | ||||||
| 2026-01-28 | 13F | CAPROCK Group, Inc. | 11.010 | -3,11 | 2.196 | 18,38 | ||||
| 2026-02-05 | 13F | Thrivent Financial For Lutherans | 17.416 | 17,95 | 3 | 50,00 | ||||
| 2026-02-17 | 13F | California State Teachers Retirement System | 46.765 | 1,48 | 9.329 | 29,38 | ||||
| 2026-01-20 | 13F | Cromwell Holdings LLC | 180 | 0,00 | 36 | 25,00 | ||||
| 2026-02-12 | 13F | Dimensional Fund Advisors Lp | 1.442.224 | 27,53 | 287.703 | 62,63 | ||||
| 2025-10-28 | 13F | Wolff Wiese Magana Llc | 0 | -100,00 | 0 | |||||
| 2026-02-17 | 13F | Clark Capital Management Group, Inc. | 42.391 | 8.456 | ||||||
| 2026-02-06 | 13F | EverSource Wealth Advisors, LLC | 292 | -5,19 | 58 | 20,83 | ||||
| 2026-02-13 | 13F | Neo Ivy Capital Management | 1.248 | 170,13 | 249 | 244,44 | ||||
| 2026-04-02 | 13F | Byrne Asset Management LLC | 38 | -41,54 | 7 | -50,00 | ||||
| 2026-02-17 | 13F | Qube Research & Technologies Ltd | 5.797 | 1.156 | ||||||
| 2026-02-05 | 13F | Atria Investments Llc | 6.474 | -4,26 | 1.291 | 22,14 | ||||
| 2026-02-11 | 13F | Zions Bancorporation, National Association /ut/ | 9.512 | -6,16 | 1.897 | 19,68 | ||||
| 2026-02-12 | 13F | UniSuper Management Pty Ltd | 8.632 | -25,39 | 1.722 | -4,92 | ||||
| 2025-11-13 | 13F | Nearwater Capital Markets, Ltd | 0 | -100,00 | 0 | |||||
| 2026-02-06 | 13F | Vestmark Advisory Solutions, Inc. | 3.674 | 733 | ||||||
| 2026-02-17 | 13F | Quantinno Capital Management LP | 249.815 | 1,73 | 49.833 | 29,70 | ||||
| 2026-02-17 | 13F | United Capital Financial Advisers, Llc | 2.578 | -25,15 | 514 | -4,46 | ||||
| 2026-02-17 | 13F | Banco Bilbao Vizcaya Argentaria, S.a. | 0 | -100,00 | 0 | |||||
| 2026-01-16 | 13F | Tema Etfs Llc | 130 | 26 | ||||||
| 2025-11-14 | 13F | Bayesian Capital Management, LP | 0 | -100,00 | 0 | |||||
| 2026-02-13 | 13F | Rhenman & Partners Asset Management AB | 22.000 | 4.389 | ||||||
| 2026-02-12 | 13F | Jane Street Group, Llc | 2.009 | 48,48 | 401 | 89,57 | ||||
| 2026-02-12 | 13F | Jane Street Group, Llc | Call | 7.900 | -63,93 | 1.576 | -54,03 | |||
| 2026-01-26 | 13F | Whittier Trust Co | 188 | 0,00 | 41 | 21,21 | ||||
| 2026-03-04 | 13F | SHP Wealth Management | 425 | 85 | ||||||
| 2026-02-09 | 13F | Frazier Financial Advisors, LLC | 11 | 2 | ||||||
| 2026-01-29 | 13F | Rakuten Securities, Inc. | 0 | -100,00 | 0 | |||||
| 2026-01-13 | 13F | Sendero Wealth Management, LLC | 23.907 | 0,18 | 4.769 | 27,73 | ||||
| 2026-01-26 | 13F | AE Wealth Management LLC | 1.480 | 295 | ||||||
| 2025-11-14 | 13F | Lombard Odier Asset Management (USA) Corp | 0 | -100,00 | 0 | |||||
| 2026-02-13 | 13F | Truvestments Capital Llc | 286 | -9,21 | 57 | 16,33 | ||||
| 2026-02-12 | 13F | New York State Common Retirement Fund | 111.346 | 1,34 | 22.211 | 29,20 | ||||
| 2026-01-22 | 13F | Bartlett & Co. Wealth Management Llc | 5 | 0,00 | 1 | |||||
| 2026-01-29 | 13F | Teachers Retirement System Of The State Of Kentucky | 4.006 | 0,00 | 1 | |||||
| 2026-02-06 | 13F | Bare Financial Services, Inc | 2 | -80,00 | 0 | -100,00 | ||||
| 2026-02-11 | 13F | Clearbridge Investments, LLC | 511.618 | 22,99 | 102.058 | 56,80 | ||||
| 2026-01-29 | 13F | Global Strategic Investment Solutions, LLC | 2.698 | 0,00 | 538 | 27,49 | ||||
| 2026-02-13 | 13F | FORA Capital, LLC | 0 | -100,00 | 0 | |||||
| 2026-02-17 | 13F | Millennium Management Llc | 330.113 | -29,02 | 65.851 | -9,51 | ||||
| 2026-02-17 | 13F | Millennium Management Llc | Call | 35.900 | 7.161 | |||||
| 2026-02-11 | 13F | Nemes Rush Group LLC | 0 | -100,00 | 0 | |||||
| 2026-02-03 | 13F | F/M Investments LLC | 1.570 | 0,00 | 313 | 27,76 | ||||
| 2025-11-13 | 13F | Texas Capital Bancshares Inc/tx | 15 | 2 | ||||||
| 2026-02-13 | 13F | Broyhill Asset Management | 14.752 | -0,24 | 2.943 | 27,19 | ||||
| 2026-02-24 | 13F/A | Pacer Advisors, Inc. | 3.885 | -63,21 | 775 | -53,15 | ||||
| 2026-02-03 | 13F | NewEdge Wealth, LLC | 2.580 | 515 | ||||||
| 2026-02-17 | 13F | D. E. Shaw & Co., Inc. | Put | 0 | -100,00 | 0 | ||||
| 2026-02-03 | 13F | Mitsubishi UFJ Kokusai Asset Management Co., Ltd. | 58.397 | 4,27 | 11.821 | 34,90 | ||||
| 2026-02-12 | 13F | California Public Employees Retirement System | 88.555 | 5,68 | 17.665 | 34,74 | ||||
| 2026-02-11 | 13F | GW&K Investment Management, LLC | 101.025 | 20 | ||||||
| 2026-01-26 | 13F | Valmark Advisers, Inc. | 3.000 | 0,00 | 598 | 27,51 | ||||
| 2026-02-17 | 13F | Highland Capital Management Fund Advisors, L.p. | 0 | -100,00 | 0 | |||||
| 2026-02-17 | 13F | Engineers Gate Manager LP | 27.613 | -8,94 | 5.508 | 16,10 | ||||
| 2026-01-23 | 13F | Private Wealth Management Group, LLC | 30 | 0,00 | 6 | 25,00 | ||||
| 2026-02-17 | 13F | Steadfast Capital Management Lp | 0 | -100,00 | 0 | |||||
| 2026-02-10 | 13F | Goldman Sachs Group Inc | 317.570 | 32,76 | 63.349 | 69,26 | ||||
| 2026-01-26 | 13F | Whittier Trust Co Of Nevada Inc | 13 | 0,00 | 3 | 0,00 | ||||
| 2026-02-02 | 13F | Montag A & Associates Inc | 0 | -100,00 | 0 | |||||
| 2026-02-10 | 13F | 1492 Capital Management LLC | 6.059 | 1.209 | ||||||
| 2026-02-17 | 13F | Lakewood Capital Management, Lp | 140.240 | 0,00 | 27.975 | 27,50 | ||||
| 2026-02-04 | 13F | Swiss Life Asset Management Ltd | 2.342 | 5,97 | 467 | 35,36 | ||||
| 2026-02-11 | 13F | Vestcor Inc | 3.330 | -32,97 | 1 | |||||
| 2026-02-13 | 13F | Sterling Capital Management LLC | 2.892 | -4,11 | 577 | 22,29 | ||||
| 2026-02-13 | 13F | JustInvest LLC | 12.016 | 4,03 | 2.397 | 32,60 | ||||
| 2026-02-10 | 13F | Eurizon Capital SGR S.p.A. | 516 | 104 | ||||||
| 2026-02-13 | 13F | Sei Investments Co | 756.758 | 0,94 | 150.962 | 28,69 | ||||
| 2026-02-11 | 13F | MCF Advisors LLC | 16 | 3 | ||||||
| 2025-11-14 | 13F | Axa S.a. | 0 | -100,00 | 0 | |||||
| 2026-01-28 | 13F | Boston Trust Walden Corp | 304.877 | -0,77 | 60.817 | 26,51 | ||||
| 2026-02-12 | 13F | State Board Of Administration Of Florida Retirement System | 43.315 | 0,00 | 8.640 | 27,49 | ||||
| 2026-02-17 | 13F | Tudor Investment Corp Et Al | 4.782 | 954 | ||||||
| 2026-02-17 | 13F | Sio Capital Management, LLC | 54.985 | 10.968 | ||||||
| 2026-04-10 | 13F | Quaker Wealth Management, LLC | 3 | 0,00 | 1 | |||||
| 2026-01-29 | 13F | Dumont & Blake Investment Advisors Llc | 4.125 | -2,71 | 1 | -100,00 | ||||
| 2026-02-13 | 13F | Verition Fund Management LLC | 9.505 | -2,07 | 1.896 | 24,90 | ||||
| 2026-01-12 | 13F | CVA Family Office, LLC | 82 | 0,00 | 16 | 33,33 | ||||
| 2026-02-13 | 13F | Kayne Anderson Rudnick Investment Management Llc | 90 | 0,00 | 18 | 28,57 | ||||
| 2026-04-13 | 13F | GoalVest Advisory LLC | 0 | -100,00 | 0 | |||||
| 2026-01-26 | 13F | Private Trust Co Na | 1 | 0,00 | 0 | |||||
| 2025-11-07 | 13F | Amica Retiree Medical Trust | 2.007 | 0,00 | 0 | |||||
| 2026-02-17 | 13F | Aqr Capital Management Llc | 120.112 | -54,69 | 23.960 | -39,38 | ||||
| 2025-11-10 | 13F | China Universal Asset Management Co., Ltd. | 0 | -100,00 | 0 | -100,00 | ||||
| 2026-04-02 | 13F | Ares Financial Consulting, LLC | 3 | 0,00 | 1 | |||||
| 2026-02-10 | 13F | Fideuram Asset Management (Ireland) dac | 45 | 9 | ||||||
| 2026-02-12 | 13F | Advisors Asset Management, Inc. | 0 | -100,00 | 0 | |||||
| 2026-02-13 | 13F | State Street Corp | 1.871.688 | 2,21 | 373.364 | 30,32 | ||||
| 2026-02-17 | 13F | SageView Advisory Group, LLC | 354 | 71 | ||||||
| 2026-02-17 | 13F | Moore Capital Management, Lp | 10.903 | -77,71 | 2.175 | -71,60 | ||||
| 2026-02-10 | 13F | Connor, Clark & Lunn Investment Management Ltd. | 134.156 | -25,70 | 26.761 | -5,27 | ||||
| 2026-02-17 | 13F | Mercer Global Advisors Inc /adv | 6.316 | 1,28 | 1.260 | 29,13 | ||||
| 2026-02-05 | 13F | New York Life Investment Management Llc | 11.137 | -3,54 | 2.222 | 22,98 | ||||
| 2026-02-05 | 13F | Td Private Client Wealth Llc | 113 | 0,00 | 23 | 29,41 | ||||
| 2026-02-13 | 13F | SRS Capital Advisors, Inc. | 1.348 | -75,17 | 269 | -68,43 | ||||
| 2026-02-17 | 13F | Delaware Management Holdings, Inc. | 46.838 | 9.343 | ||||||
| 2026-04-06 | 13F | GAMMA Investing LLC | 3.468 | -5,09 | 598 | -17,86 | ||||
| 2026-01-23 | 13F | Iridian Asset Management Llc/ct | 26.568 | -7,19 | 5.300 | 18,33 | ||||
| 2026-02-12 | 13F | Rossby Financial, LCC | 2 | 0 | ||||||
| 2026-02-13 | 13F | Colony Group, LLC | 9.080 | 1.811 | ||||||
| 2026-02-09 | 13F | Coldstream Capital Management Inc | 1.983 | 2,32 | 396 | 30,36 | ||||
| 2026-02-13 | 13F | Squarepoint Ops LLC | 1.312 | -55,47 | 262 | -43,26 | ||||
| 2026-04-01 | 13F | Confluence Investment Management Llc | 100.534 | -4,82 | 17.342 | -17,69 | ||||
| 2026-02-06 | 13F | Banque Cantonale Vaudoise | 2.318 | 1,13 | 462 | |||||
| 2026-02-11 | 13F | Twin Tree Management, LP | Put | 0 | -100,00 | 0 | -100,00 | |||
| 2026-02-17 | 13F | D. E. Shaw & Co., Inc. | 431.128 | -55,07 | 86.001 | -42,72 | ||||
| 2026-01-27 | 13F | PFG Advisors | 2.369 | 473 | ||||||
| 2026-02-02 | 13F | Qrg Capital Management, Inc. | 2.272 | 15,27 | 453 | 47,08 | ||||
| 2026-02-17 | 13F | Gotham Asset Management, LLC | 289.516 | -8,31 | 57.753 | 16,90 | ||||
| 2026-02-09 | 13F | Onefund, Llc | 148 | 2,78 | 30 | 31,82 | ||||
| 2026-02-11 | 13F | Vise Technologies, Inc. | 1.491 | 297 | ||||||
| 2026-01-23 | 13F | Sumitomo Mitsui Trust Holdings, Inc. | 2.606 | -31,31 | 520 | -12,48 | ||||
| 2026-02-06 | 13F | Global Retirement Partners, LLC | 1.882 | 3.385,19 | 375 | 4.587,50 | ||||
| 2026-01-07 | 13F | Procyon Private Wealth Partners, LLC | 1.181 | 236 | ||||||
| 2026-01-21 | 13F | Aaron Wealth Advisors LLC | 2.137 | -25,51 | 426 | -4,91 | ||||
| 2026-02-09 | 13F | Hantz Financial Services, Inc. | 816 | 2,90 | 0 | |||||
| 2026-02-17 | 13F | Suvretta Capital Management, Llc | 1.010 | 201 | ||||||
| 2026-01-15 | 13F | Fortitude Family Office, LLC | 11 | 10,00 | 2 | 100,00 | ||||
| 2026-02-10 | 13F | Td Asset Management Inc | 8.477 | -1,36 | 1.691 | 25,74 | ||||
| 2026-02-10 | 13F | Basepoint Wealth LLC | 20 | 4 | ||||||
| 2026-02-04 | 13F | Oregon Public Employees Retirement Fund | 5.645 | 0,00 | 1.126 | 27,52 | ||||
| 2026-02-12 | 13F | Skandinaviska Enskilda Banken AB (publ) | 0 | -100,00 | 0 | |||||
| 2026-02-17 | 13F | PDT Partners, LLC | 19.100 | 0,00 | 3.810 | 27,51 | ||||
| 2026-02-10 | 13F | Cherry Tree Wealth Management, LLC | 0 | -100,00 | 0 | |||||
| 2026-02-10 | 13F | Natixis Advisors, L.p. | 114.357 | 8,95 | 23 | 37,50 | ||||
| 2026-01-23 | 13F | Rsm Us Wealth Management Llc | 2.218 | -4,02 | 448 | 23,82 | ||||
| 2026-02-17 | 13F | Northern Trust Corp | 439.161 | -7,83 | 87.604 | 17,51 | ||||
| 2026-02-02 | 13F | Millstone Evans Group, LLC | 16 | 0,00 | 3 | 50,00 | ||||
| 2026-01-22 | 13F | Richardson Financial Services Inc. | 118 | 24 | ||||||
| 2025-11-13 | 13F | Twin Tree Management, LP | Call | 0 | -100,00 | 0 | -100,00 | |||
| 2025-11-14 | 13F/A | Massar Capital Management, LP | 0 | -100,00 | 0 | -100,00 | ||||
| 2026-01-16 | 13F | Standard Life Aberdeen plc | 97.001 | 1.090,49 | 19.350 | 1.516,46 | ||||
| 2026-02-12 | 13F | Groupe la Francaise | 561 | -2,60 | 112 | 30,59 | ||||
| 2026-02-17 | 13F | Price T Rowe Associates Inc /md/ | 72.856 | 0,00 | 15 | 27,27 | ||||
| 2026-02-17 | 13F | Kerrisdale Advisers, LLC | 4.593 | -38,42 | 916 | -21,44 | ||||
| 2026-02-02 | 13F | Cornerstone Planning Group LLC | 11 | 0,00 | 2 | 100,00 | ||||
| 2026-02-17 | 13F | Dv Equities, Llc | 70 | 14 | ||||||
| 2026-01-12 | 13F | VisionPoint Advisory Group, LLC | 8.638 | -12,15 | 1.723 | 12,03 | ||||
| 2026-01-23 | 13F | Norris Perne & French Llp/mi | 5.475 | -43,40 | 1.092 | -27,83 | ||||
| 2026-02-24 | 13F | Bell Investment Advisors, Inc | 37 | -26,00 | 7 | 0,00 | ||||
| 2026-04-07 | 13F | Retirement Wealth Solutions LLC | 8 | -11,11 | 1 | 0,00 | ||||
| 2026-02-04 | 13F | Hartford Investment Management Co | 2.836 | -2,78 | 566 | 23,90 | ||||
| 2026-01-28 | 13F | Arizona State Retirement System | 13.715 | -5,63 | 2.736 | 20,33 | ||||
| 2026-02-04 | 13F | Sentry Investment Management Llc | 135 | 0,00 | 0 | |||||
| 2026-01-20 | 13F | Ethos Financial Group, LLC | 1.641 | 327 | ||||||
| 2026-02-02 | 13F | Principal Financial Group Inc | 119.499 | 14,11 | 23.838 | 45,49 | ||||
| 2026-01-22 | 13F | Pinnacle Bancorp, Inc. | 125 | -34,21 | 25 | -17,24 | ||||
| 2026-02-27 | 13F | Groupama Asset Managment | 2.405 | -9,45 | 480 | 15,42 | ||||
| 2026-04-13 | 13F | Czech National Bank | 13.403 | 3,28 | 2.312 | -10,66 | ||||
| 2026-02-12 | 13F | EntryPoint Capital, LLC | 0 | -100,00 | 0 | |||||
| 2026-02-05 | 13F | Cambridge Investment Research Advisors, Inc. | 1.162 | -12,57 | 0 | |||||
| 2026-01-14 | 13F | Eastern Bank | 0 | -100,00 | 0 | |||||
| 2026-01-20 | 13F | YANKCOM Partnership | 86 | 0,00 | 17 | 30,77 | ||||
| 2026-02-05 | 13F | Requisite Capital Management, LLC | 0 | -100,00 | 0 | |||||
| 2026-02-13 | 13F | Panagora Asset Management Inc | 6.073 | 1.211 | ||||||
| 2026-02-17 | 13F | Jones Financial Companies Lllp | 828 | 3,37 | 165 | 38,66 | ||||
| 2026-02-11 | 13F | Horizon Kinetics Asset Management Llc | 12.580 | -2,55 | 2.509 | 24,27 | ||||
| 2026-02-12 | 13F | Intrinsic Edge Capital Management LLC | 10.000 | 1.995 | ||||||
| 2026-01-30 | 13F | Exencial Wealth Advisors, Llc | 2.886 | 3,11 | 576 | 31,58 | ||||
| 2026-02-17 | 13F | Voloridge Investment Management, Llc | 0 | -100,00 | 0 | |||||
| 2026-02-17 | 13F | Public Employees Retirement System Of Ohio | 14.682 | -3,66 | 2.929 | 22,82 | ||||
| 2026-02-17 | 13F | Point72 Asset Management, L.P. | 221.592 | 44.203 | ||||||
| 2025-11-06 | 13F | Waterfront Wealth Inc. | 0 | -100,00 | 0 | |||||
| 2025-11-06 | 13F | Whipplewood Advisors, LLC | 0 | -100,00 | 0 | -100,00 | ||||
| 2026-02-13 | 13F | Ariel Investments, Llc | 1.427.771 | -4,18 | 284.812 | 22,16 | ||||
| 2026-04-06 | 13F | Miller Global Investments, LLC | 2.049 | -3,03 | 353 | -16,15 | ||||
| 2026-02-11 | 13F | Group One Trading, L.p. | Call | 200 | -96,72 | 40 | -95,91 | |||
| 2026-02-14 | 13F | Rockefeller Capital Management L.P. | 1.750 | 30,01 | 349 | 66,19 | ||||
| 2026-02-09 | 13F | King Luther Capital Management Corp | 64.761 | 37,85 | 12.919 | 75,76 | ||||
| 2026-02-11 | 13F | Group One Trading, L.p. | 295 | 123,48 | 59 | 190,00 | ||||
| 2026-02-11 | 13F | Cerity Partners LLC | 6.248 | 35,09 | 1.246 | 72,34 | ||||
| 2026-02-13 | 13F | Umb Bank N A/mo | 678 | -6,35 | 135 | 19,47 | ||||
| 2026-02-13 | 13F | Victory Capital Management Inc | 691.474 | 9.938,82 | 137.935 | 12.707,34 | ||||
| 2026-02-13 | 13F | S&t Bank/pa | 31 | 93,75 | 6 | 200,00 | ||||
| 2026-02-17 | 13F | Laird Norton Trust Company, Llc | 2.840 | 567 | ||||||
| 2026-02-12 | 13F | Sfam, Llc | 215 | 43 | ||||||
| 2026-02-17 | 13F | Cetera Investment Advisers | 7.125 | 7,58 | 1.421 | 37,16 | ||||
| 2026-02-12 | 13F | Geneva Capital Management Llc | 0 | -100,00 | 0 | |||||
| 2026-01-28 | 13F | Chicago Partners Investment Group LLC | 2.579 | -6,79 | 566 | 8,85 | ||||
| 2025-11-14 | 13F | Millennium Management Llc | Put | 0 | -100,00 | 0 | -100,00 | |||
| 2026-04-06 | 13F | CX Institutional | 2.285 | -2,43 | 0 | |||||
| 2026-01-27 | 13F | Forum Financial Management, LP | 2.132 | 0,14 | 425 | 27,63 | ||||
| 2026-01-27 | 13F | TD Waterhouse Canada Inc. | 1.437 | -0,76 | 287 | 16,26 | ||||
| 2026-01-28 | 13F | Salomon & Ludwin, LLC | 61 | 0,00 | 13 | 20,00 | ||||
| 2026-01-28 | 13F | WPG Advisers, LLC | 30 | -6,25 | 6 | 0,00 | ||||
| 2026-01-21 | 13F | Westfuller Advisors, LLC | 73 | 0,00 | 15 | 27,27 | ||||
| 2026-02-03 | 13F | Sequoia Financial Advisors, LLC | 3.208 | -0,03 | 640 | 27,29 | ||||
| 2026-02-13 | 13F | First Trust Advisors Lp | 6.047 | 11,44 | 1.206 | 42,22 | ||||
| 2026-01-27 | 13F | Proffitt & Goodson Inc | 0 | -100,00 | 0 | |||||
| 2026-02-09 | 13F | Avalon Trust Co | 0 | -100,00 | 0 | |||||
| 2026-01-26 | 13F | Patriot Financial Group Insurance Agency, LLC | 0 | -100,00 | 0 | |||||
| 2026-02-12 | 13F | Federation des caisses Desjardins du Quebec | 3.925 | 17,90 | 783 | 50,38 | ||||
| 2026-02-17 | 13F | Quantitative Investment Management, LLC | 3.120 | 12,31 | 1 | |||||
| 2026-02-12 | 13F | Federated Hermes, Inc. | 125.840 | -0,31 | 25.103 | 27,11 | ||||
| 2026-02-13 | 13F | BNP Paribas Asset Management Holding S.A. | 10.122 | 2 | ||||||
| 2026-01-29 | 13F | J.P. Marvel Investment Advisors, LLC | 37.234 | 0,00 | 7.427 | 27,50 | ||||
| 2026-02-02 | 13F | Benjamin Edwards Inc | 0 | -100,00 | 0 | |||||
| 2026-02-10 | 13F | Nomura Asset Management Co Ltd | 1.420 | -0,42 | 283 | 26,91 | ||||
| 2026-01-08 | 13F | Nordea Investment Management Ab | 54.694 | 43,64 | 10.985 | 94,92 | ||||
| 2026-02-19 | 13F | Invesco Ltd. | 2.696.150 | 115,83 | 537.828 | 175,18 | ||||
| 2026-02-11 | 13F | Janney Montgomery Scott LLC | 20.028 | 35,35 | 4 | 50,00 | ||||
| 2026-02-19 | 13F | Atomi Financial Group, Inc. | 1.668 | 19,57 | 333 | 52,29 | ||||
| 2026-02-13 | 13F | Treasurer of the State of North Carolina | 20.436 | -6,80 | 4 | 33,33 | ||||
| 2026-02-12 | 13F | Logan Capital Management Inc | 10.975 | -15,69 | 2.189 | 7,51 | ||||
| 2026-02-17 | 13F | Utah Retirement Systems | 8.051 | 0,00 | 1.606 | 27,56 | ||||
| 2025-10-30 | 13F | Twin Peaks Wealth Advisors, LLC | 0 | -100,00 | 0 | |||||
| 2026-02-11 | 13F | CenterBook Partners LP | 3.899 | 778 | ||||||
| 2026-04-10 | 13F | Piscataqua Savings Bank | 55 | 0,00 | 9 | -10,00 | ||||
| 2026-02-10 | 13F | Mutual Of America Capital Management Llc | 5.276 | -0,94 | 1.052 | 26,29 | ||||
| 2026-01-23 | 13F | Patton Fund Management, Inc. | 1.265 | -34,11 | 252 | -16,00 | ||||
| 2026-01-28 | 13F | DekaBank Deutsche Girozentrale | 7.142 | 0,00 | 2 | 0,00 | ||||
| 2026-02-09 | 13F | Hartland & Co., LLC | 10 | -78,26 | 2 | -85,71 | ||||
| 2026-02-26 | 13F | Anchor Investment Management, LLC | 29 | 0,00 | 6 | 25,00 | ||||
| 2026-02-13 | 13F | Walleye Capital LLC | 251.121 | 11,12 | 50.094 | 41,67 | ||||
| 2026-02-13 | 13F | Walleye Capital LLC | Put | 200 | -96,15 | 40 | -95,20 | |||
| 2026-02-10 | 13F | Bruce G. Allen Investments, LLC | 228 | -5,39 | 45 | 21,62 | ||||
| 2026-02-13 | 13F | Wells Fargo & Company/mn | 77.416 | -3,19 | 15.443 | 23,43 | ||||
| 2026-01-30 | 13F | Bogart Wealth, LLC | 57 | 418,18 | 11 | 1.000,00 | ||||
| 2026-02-11 | 13F | Arrowpoint Investment Partners (Singapore) Pte. Ltd. | 4.053 | 808 | ||||||
| 2026-02-12 | 13F | Loomis Sayles & Co L P | 62.544 | 12.476 | ||||||
| 2026-02-13 | 13F | Rafferty Asset Management, LLC | 7.529 | -0,69 | 1.502 | 26,56 | ||||
| 2026-01-29 | 13F | UBS Group AG | 388.827 | -34,40 | 77.563 | -16,37 | ||||
| 2026-02-13 | 13F | Rhumbline Advisers | 88.509 | -8,35 | 17.656 | 16,85 | ||||
| 2026-01-22 | 13F | Apollon Wealth Management, LLC | 1.454 | 290 | ||||||
| 2026-02-11 | 13F | Ameritas Investment Partners, Inc. | 4.219 | 842 | ||||||
| 2026-01-29 | 13F | Comerica Bank | 6.197 | -55,82 | 1.236 | -43,66 | ||||
| 2026-01-29 | 13F | State Of Michigan Retirement System | 12.930 | -3,00 | 2.579 | 23,69 | ||||
| 2026-02-10 | 13F | Acadian Asset Management Llc | 0 | -100,00 | 0 | |||||
| 2026-02-13 | 13F | Candriam Luxembourg S.C.A. | 33.281 | 6.639 | ||||||
| 2026-01-30 | 13F | New York State Teachers Retirement System | 40.703 | 0,00 | 8 | 33,33 | ||||
| 2026-02-06 | 13F | Tortoise Investment Management, LLC | 0 | -100,00 | 0 | |||||
| 2026-02-17 | 13F | Maryland State Retirement & Pension System | 2.664 | 0,00 | 531 | 27,64 | ||||
| 2026-01-29 | 13F | UMA Financial Services, Inc. | 30 | 0,00 | 6 | 25,00 | ||||
| 2026-02-13 | 13F | Palisade Asset Management, LLC | 0 | -100,00 | 0 | |||||
| 2025-11-12 | 13F | NewSquare Capital LLC | 0 | -100,00 | 0 | |||||
| 2026-01-30 | 13F | Pekin Hardy Strauss, Inc. | 8.964 | -75,14 | 1.788 | -68,30 | ||||
| 2025-11-14 | 13F | Binnacle Investments Inc | 2 | 0 | ||||||
| 2026-04-07 | 13F | Fragasso Group Inc. | 1.522 | -22,82 | 256 | -34,86 | ||||
| 2026-04-09 | 13F | Everhart Financial Group, Inc. | 2.904 | 10,25 | 501 | -4,76 | ||||
| 2026-01-29 | 13F | Pictet Asset Management Holding SA | 9.906 | 20,60 | 1.976 | 53,77 | ||||
| 2026-02-17 | 13F | Guggenheim Capital Llc | 5.238 | -13,46 | 1.045 | 10,24 | ||||
| 2026-02-17 | 13F | Glenmede Trust Co Na | 2.633 | 525 | ||||||
| 2026-01-22 | 13F | Kennebec Savings Bank | 114 | 0,00 | 23 | 29,41 | ||||
| 2026-02-06 | 13F | Empirical Asset Management, LLC | 1.508 | -0,33 | 301 | 27,12 | ||||
| 2025-11-12 | 13F | Nicholas Company, Inc. | 0 | -100,00 | 0 | |||||
| 2026-01-30 | 13F | Activest Wealth Management | 220 | 10.900,00 | 44 | |||||
| 2026-02-13 | 13F | Police & Firemen's Retirement System of New Jersey | 20.505 | -5,13 | 4.090 | 20,97 | ||||
| 2026-02-12 | 13F | Principal Securities, Inc. | 6.073 | 42,46 | 1.211 | 81,83 | ||||
| 2026-02-13 | 13F | Stifel Financial Corp | 4.074 | -31,47 | 813 | -12,69 | ||||
| 2026-02-13 | 13F | Oribel Capital Management, LP | 54.500 | 10.872 | ||||||
| 2026-02-06 | 13F | Covestor Ltd | 245 | -0,41 | 0 | |||||
| 2026-02-03 | 13F/A | Mount Yale Investment Advisors, LLC | 0 | -100,00 | 0 | -100,00 | ||||
| 2025-10-24 | 13F | Hemington Wealth Management | 111 | 37,04 | 0 | |||||
| 2026-02-13 | 13F | Oribel Capital Management, LP | Put | 54.500 | 10.872 | |||||
| 2026-02-06 | 13F | Leonteq Securities AG | 0 | -100,00 | 0 | |||||
| 2026-02-09 | 13F | Atlantic Trust, LLC | 0 | -100,00 | 0 | |||||
| 2026-01-12 | 13F | Heartwood Wealth Advisors LLC | 0 | -100,00 | 0 | |||||
| 2026-02-09 | 13F | Annis Gardner Whiting Capital Advisors, LLC | 8 | 166,67 | 2 | |||||
| 2025-11-14 | 13F | Capital Analysts, Inc. | 0 | -100,00 | 0 | |||||
| 2026-02-06 | 13F | Handelsbanken Fonder AB | 14.106 | -3,42 | 3 | 0,00 | ||||
| 2026-02-13 | 13F | Kestra Advisory Services, LLC | 545 | 109 | ||||||
| 2025-11-10 | 13F | MainStreet Investment Advisors LLC | 0 | -100,00 | 0 | -100,00 | ||||
| 2026-02-12 | 13F | Grey Fox Wealth Advisors, LLC | 0 | -100,00 | 0 | |||||
| 2026-01-26 | 13F | Cwm, Llc | 4.305 | 5,15 | 1 | |||||
| 2026-02-23 | 13F | Kera Capital Partners, Inc. | 2.511 | 4,49 | 529 | 40,80 | ||||
| 2026-02-12 | 13F | Ensign Peak Advisors, Inc | 2.999 | -72,10 | 598 | -64,43 | ||||
| 2026-02-17 | 13F | TCG Advisory Services, LLC | 1.565 | 312 | ||||||
| 2026-02-13 | 13F | Johnson Investment Counsel Inc | 0 | -100,00 | 0 | |||||
| 2026-02-06 | 13F | Lsv Asset Management | 475.900 | 59,81 | 95 | 104,35 | ||||
| 2026-02-04 | 13F | Ameritas Advisory Services, LLC | 0 | -100,00 | 0 | |||||
| 2026-02-13 | 13F | Morgan Stanley | 792.820 | -5,03 | 158.152 | 21,09 | ||||
| 2026-02-10 | 13F/A | Northwestern Mutual Wealth Management Co | 1.102 | 0,55 | 220 | 28,07 | ||||
| 2025-11-14 | 13F | Point72 Asia (Singapore) Pte. Ltd. | 0 | -100,00 | 0 | |||||
| 2026-02-04 | 13F | Midwest Trust Co | 26.882 | -0,61 | 5.362 | 26,73 | ||||
| 2026-02-05 | 13F | Amalgamated Bank | 9.697 | 4,12 | 2 | 0,00 | ||||
| 2026-02-11 | 13F | Simplex Trading, Llc | Put | 500 | -84,85 | 100 | ||||
| 2026-02-13 | 13F | Pacific Center for Financial Services | 26 | 0,00 | 4 | 0,00 | ||||
| 2026-02-17 | 13F | Ameriprise Financial Inc | 1.384.383 | 125,62 | 276.157 | 187,65 | ||||
| 2026-02-17 | 13F | Fmr Llc | 1.733.910 | 319,29 | 345.880 | 434,58 | ||||
| 2026-02-11 | 13F | Simplex Trading, Llc | 3.601 | 718 | ||||||
| 2026-02-11 | 13F | Simplex Trading, Llc | Call | 1.500 | -77,27 | 299 | 29.800,00 | |||
| 2026-02-11 | 13F | Rise Advisors, LLC | 0 | -100,00 | 0 | |||||
| 2026-04-07 | 13F | Farther Finance Advisors, LLC | 1.073 | 25,79 | 188 | 10,00 | ||||
| 2025-11-12 | 13F | Fox Run Management, L.l.c. | 0 | -100,00 | 0 | |||||
| 2026-01-30 | 13F | Mitsubishi UFJ Trust & Banking Corp | 0 | -100,00 | 0 | |||||
| 2026-02-10 | 13F | Principia Wealth Advisory, LLC | 1 | 0,00 | 0 | |||||
| 2026-02-13 | 13F | Toroso Investments, LLC | 5.457 | -42,93 | 1.089 | -27,27 | ||||
| 2026-02-10 | 13F | REAP Financial Group, LLC | 100 | 20 | ||||||
| 2026-02-17 | 13F | Citadel Advisors Llc | Put | 5.400 | -62,50 | 1.077 | -52,20 | |||
| 2026-02-09 | 13F | Harbour Investments, Inc. | 51 | -1,92 | 10 | 25,00 | ||||
| 2026-02-06 | 13F | Mizuho Markets Americas Llc | 0 | -100,00 | 0 | |||||
| 2026-02-17 | 13F | Citadel Advisors Llc | Call | 22.900 | -35,85 | 4.568 | -18,21 | |||
| 2026-02-11 | 13F | Jpmorgan Chase & Co | 174.768 | -44,90 | 34.863 | -29,75 | ||||
| 2026-02-17 | 13F | Citadel Advisors Llc | 417.516 | 253,74 | 83.286 | 351,02 | ||||
| 2026-02-17 | 13F | Norinchukin Bank, The | 2.811 | 6,00 | 561 | 35,27 | ||||
| 2026-04-08 | 13F | Wealth Enhancement Advisory Services, Llc | 3.858 | -37,23 | 671 | -49,55 | ||||
| 2026-01-29 | 13F | Kestra Private Wealth Services, Llc | 3.009 | 5,06 | 600 | 33,93 | ||||
| 2026-01-13 | 13F | Trust Point Inc. | 1.510 | 301 | ||||||
| 2026-02-10 | 13F | Tidemark, LLC | 25 | 0,00 | 5 | 33,33 | ||||
| 2026-02-17 | 13F | Jump Financial, LLC | 0 | -100,00 | 0 | |||||
| 2026-02-17 | 13F | Toronto Dominion Bank | 8.467 | -59,95 | 1.689 | -48,96 | ||||
| 2026-02-13 | 13F | Public Employees Retirement Association Of Colorado | 83.643 | 1.558,60 | 17 | |||||
| 2026-01-30 | 13F | Camden Capital, LLC | 1.579 | -3,25 | 315 | 23,14 | ||||
| 2025-10-29 | 13F | Yorktown Management & Research Co Inc | 0 | -100,00 | 0 | -100,00 | ||||
| 2026-02-02 | 13F | CENTRAL TRUST Co | 21 | 31,25 | 4 | 100,00 | ||||
| 2026-02-13 | 13F | Charles Schwab Investment Management Inc | 454.153 | -4,60 | 90.594 | 21,63 | ||||
| 2026-01-14 | 13F | Exchange Traded Concepts, Llc | 5.461 | -4,59 | 1.089 | 21,68 | ||||
| 2026-02-10 | 13F | Norges Bank | 485.087 | 96.765 | ||||||
| 2025-11-14 | 13F | Empower Advisory Group, LLC | 0 | -100,00 | 0 | -100,00 | ||||
| 2025-11-14 | 13F | Wolverine Trading, Llc | Call | 0 | -100,00 | 0 | ||||
| 2026-02-17 | 13F | Harris Associates L P | 1.677.606 | 13,88 | 334.649 | 45,20 | ||||
| 2026-02-17 | 13F | Prelude Capital Management, Llc | 1.159 | 231 | ||||||
| 2025-11-14 | 13F | Wolverine Trading, Llc | Put | 0 | -100,00 | 0 | ||||
| 2026-02-03 | 13F | Bokf, Na | 129 | -12,24 | 26 | 8,70 | ||||
| 2025-11-14 | 13F | Wolverine Trading, Llc | 0 | -100,00 | 0 | |||||
| 2026-02-03 | 13F | Crossmark Global Holdings, Inc. | 4.209 | -13,54 | 840 | 10,25 | ||||
| 2026-02-11 | 13F | First Command Advisory Services, Inc. | 9 | 2 | ||||||
| 2026-02-12 | 13F | Callan Family Office, LLC | 2.419 | 19,52 | 483 | 52,53 | ||||
| 2026-02-06 | 13F | First Business Financial Services, Inc. | 1.300 | 0,00 | 259 | 27,59 | ||||
| 2026-02-05 | 13F | Allworth Financial LP | 350 | 61,29 | 70 | 109,09 | ||||
| 2026-02-09 | 13F | New Age Alpha Advisors, LLC | 0 | -100,00 | 0 | |||||
| 2026-02-13 | 13F | Bank Of Nova Scotia | 6.659 | 26,98 | 1.328 | 61,95 | ||||
| 2026-02-17 | 13F | Ameriflex Group, Inc. | 34 | -50,00 | 7 | -40,00 | ||||
| 2026-02-12 | 13F | Great Lakes Advisors, Llc | 2.064 | 412 | ||||||
| 2026-02-18 | 13F | State of Tennessee, Treasury Department | 12.593 | 32,71 | 2.651 | 78,57 | ||||
| 2026-01-27 | 13F | Asset Management One Co., Ltd. | 1.847 | 4,00 | 375 | 35,38 | ||||
| 2026-02-10 | 13F | CIBC Asset Management Inc | 10.993 | 69,99 | 2.193 | 116,82 | ||||
| 2026-04-01 | 13F | Laurus Investment Counsel Inc. | 71.685 | -12,97 | 12.366 | -24,74 | ||||
| 2025-11-12 | 13F | Burgundy Asset Management Ltd. | 278.329 | -0,66 | 45.454 | 6,92 | ||||
| 2026-02-12 | 13F | AlphaCentric Advisors LLC | 0 | -100,00 | 0 | |||||
| 2026-02-17 | 13F | Man Group plc | 9.457 | -90,60 | 1.886 | -88,01 | ||||
| 2025-10-30 | 13F | UNIVEST FINANCIAL Corp | 0 | -100,00 | 0 | |||||
| 2026-01-27 | 13F | Gf Fund Management Co. Ltd. | 1.325 | -1,71 | 264 | 25,71 | ||||
| 2026-02-17 | 13F | Canada Pension Plan Investment Board | 5.500 | -94,70 | 1.097 | -93,25 | ||||
| 2026-01-22 | 13F | V-Square Quantitative Management LLC | 1.558 | 311 | ||||||
| 2026-02-17 | 13F | ISAM Funds (UK) Ltd | 0 | -100,00 | 0 | |||||
| 2026-02-17 | 13F | Amundi | 281.014 | -9,40 | 56.057 | 3,30 | ||||
| 2026-02-06 | 13F | Investment House Llc | 24.442 | -10,85 | 4.876 | 13,66 | ||||
| 2026-02-11 | 13F | LPL Financial LLC | 27.468 | 2,34 | 5.479 | 30,48 | ||||
| 2026-02-17 | 13F | Royal Bank Of Canada | 123.656 | -53,85 | 24.666 | -41,16 | ||||
| 2026-02-12 | 13F | Empirical Finance, LLC | 1.409 | -4,28 | 281 | 22,17 | ||||
| 2026-02-13 | 13F | Golden State Wealth Management, LLC | 0 | -100,00 | 0 | |||||
| 2025-11-14 | 13F | Cubist Systematic Strategies, LLC | 0 | -100,00 | 0 | -100,00 | ||||
| 2026-02-17 | 13F | Lighthouse Investment Partners, LLC | 1.489 | -72,93 | 297 | -65,47 | ||||
| 2026-02-12 | 13F | Renaissance Technologies Llc | 10.200 | 2.035 | ||||||
| 2026-02-13 | 13F | Mariner, LLC | 10.851 | -40,89 | 2.170 | -24,45 | ||||
| 2026-01-30 | 13F | Keybank National Association/oh | 4.963 | 990 | ||||||
| 2025-11-14 | 13F | Hrt Financial Lp | 0 | -100,00 | 0 | -100,00 | ||||
| 2026-04-13 | 13F | IFP Advisors, Inc | 768 | 585,71 | 132 | 500,00 | ||||
| 2026-02-06 | 13F | Pnc Financial Services Group, Inc. | 16.058 | 1,91 | 3.203 | 29,94 | ||||
| 2026-01-26 | 13F | KBC Group NV | 1.366 | 0,00 | 0 | |||||
| 2026-01-14 | 13F | ORG Partners LLC | 26 | -33,33 | 5 | -16,67 | ||||
| 2026-01-15 | 13F | Retirement Systems of Alabama | 10.470 | -0,26 | 2.089 | 27,16 | ||||
| 2026-02-09 | 13F | Royce & Associates Lp | 0 | -100,00 | 0 | |||||
| 2026-01-29 | 13F | Quest 10 Wealth Builders, Inc. | 1 | 0,00 | 0 | |||||
| 2025-10-30 | 13F | Rogco, Lp | 0 | -100,00 | 0 | |||||
| 2026-01-30 | 13F/A | M&t Bank Corp | 2.427 | 32,19 | 484 | 68,64 | ||||
| 2026-02-10 | 13F | Baker Avenue Asset Management, LP | 1.723 | -5,12 | 344 | 20,77 | ||||
| 2026-02-10 | 13F | Quantbot Technologies LP | 0 | -100,00 | 0 | |||||
| 2026-02-13 | 13F | Entropy Technologies, LP | 4.881 | -64,90 | 974 | -55,26 | ||||
| 2026-02-12 | 13F | Steward Partners Investment Advisory, Llc | 751 | -14,27 | 150 | 8,76 | ||||
| 2026-02-18 | 13F | EP Wealth Advisors, Inc. | 2.199 | 15,43 | 439 | 51,56 | ||||
| 2026-01-23 | 13F | Westside Investment Management, Inc. | 72 | 16,13 | 15 | 40,00 | ||||
| 2026-02-11 | 13F | Syon Capital Llc | 3.831 | 764 | ||||||
| 2026-04-14 | 13F | Zrc Wealth Management, Llc | 39 | 62,50 | 7 | 50,00 | ||||
| 2026-02-13 | 13F | Solstein Capital, LLC | 600 | 0,00 | 120 | 27,96 | ||||
| 2026-01-27 | 13F | WestEnd Advisors, LLC | 2 | 100,00 | 0 | |||||
| 2026-01-15 | 13F | Nisa Investment Advisors, Llc | 12.987 | 0,19 | 2.591 | 27,71 | ||||
| 2026-02-13 | 13F | Natixis | 0 | -100,00 | 0 | |||||
| 2026-02-17 | 13F | Lazard Asset Management Llc | 19.993 | 162,89 | 3.988 | 235,41 | ||||
| 2026-02-13 | 13F | Brown Advisory Inc | 2.172 | -3,42 | 433 | 23,36 | ||||
| 2026-01-30 | 13F | Us Bancorp \de\ | 7.523 | 35,18 | 1.501 | 72,41 | ||||
| 2026-02-04 | 13F | Securian Asset Management, Inc | 1.310 | -42,69 | 261 | -26,89 | ||||
| 2026-02-11 | 13F | 111 Capital | 0 | -100,00 | 0 | -100,00 | ||||
| 2026-02-13 | 13F | Mufg Securities Americas Inc. | 1.326 | -0,08 | 265 | 27,54 | ||||
| 2026-01-22 | 13F | Massachusetts Financial Services Co /ma/ | 884.691 | 176.478 | ||||||
| 2026-02-13 | 13F | Kilter Group LLC | 3 | 0,00 | 1 | |||||
| 2026-02-17 | 13F | Russell Investments Group, Ltd. | 26.413 | -46,83 | 5.269 | -32,22 | ||||
| 2026-02-17 | 13F | 13D Management LLC | 28.000 | 0,00 | 5.585 | 27,51 | ||||
| 2026-04-08 | 13F | Oliver Luxxe Assets LLC | 0 | -100,00 | 0 | |||||
| 2026-01-23 | 13F | State of Alaska, Department of Revenue | 4.881 | -7,49 | 1 | |||||
| 2026-01-22 | 13F | Venturi Wealth Management, LLC | 1.656 | 7,74 | 330 | 37,50 | ||||
| 2026-01-23 | 13F | Assetmark, Inc | 43.809 | 17,95 | 8.739 | 50,39 | ||||
| 2026-02-23 | 13F | Virtu Financial LLC | 0 | -100,00 | 0 | |||||
| 2026-03-06 | 13F | Hsbc Holdings Plc | 62.084 | -25,16 | 12.401 | -3,53 | ||||
| 2026-02-13 | 13F | Caitong International Asset Management Co., Ltd | 0 | -100,00 | 0 | |||||
| 2026-01-29 | 13F | Cornerstone Investment Partners, LLC | 3.510 | 24,38 | 700 | 58,73 | ||||
| 2026-01-28 | 13F | Universal- Beteiligungs- und Servicegesellschaft mbH | 48.841 | 6,97 | 9.770 | 36,78 | ||||
| 2025-11-06 | 13F | Illinois Municipal Retirement Fund | 0 | -100,00 | 0 | |||||
| 2026-02-10 | 13F | State of Wyoming | 3.606 | 60,34 | 719 | 104,84 | ||||
| 2026-02-03 | 13F | SBI Securities Co., Ltd. | 9 | -25,00 | 2 | 0,00 | ||||
| 2026-01-28 | 13F | Teacher Retirement System Of Texas | 6.798 | -35,60 | 1.356 | -17,87 | ||||
| 2026-02-13 | 13F | Great West Life Assurance Co /can/ | 13.456 | -12,29 | 3 | 0,00 |
Other Listings
| DE:RV6 | 148,85 € |