Grundlæggende statistik
| Porteføljeværdi | $ 110.053.343 |
| Nuværende stillinger | 76 |
Seneste beholdninger, ydeevne, AUM (fra 13F, 13D)
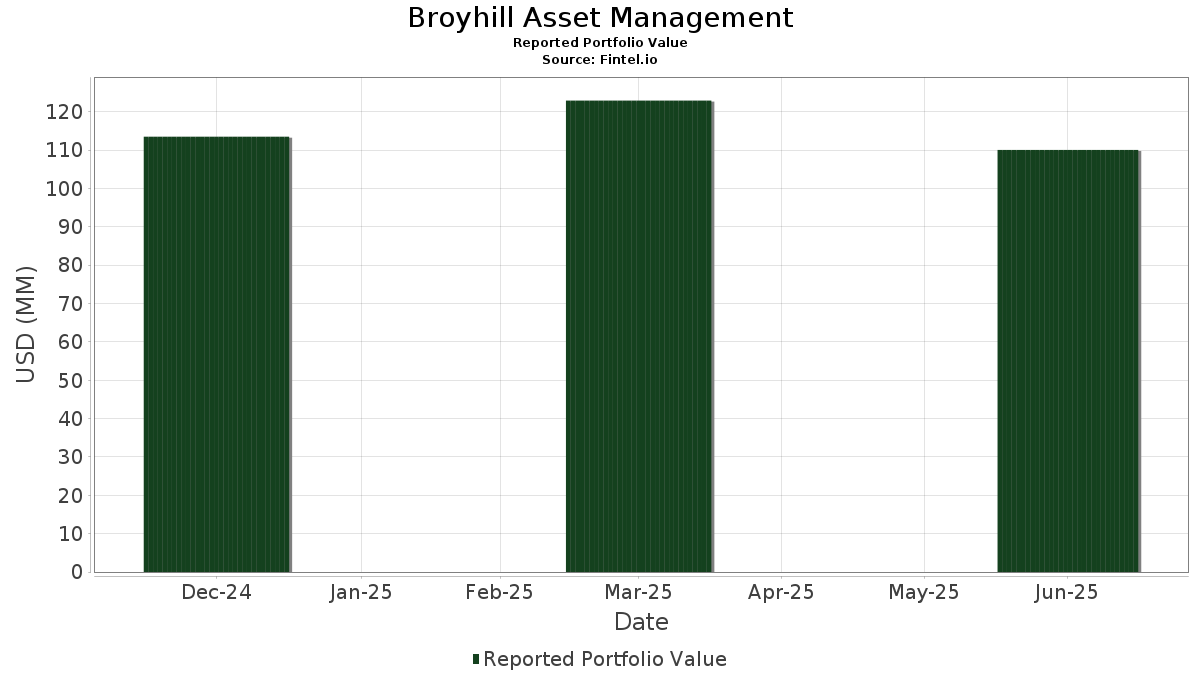
Broyhill Asset Management har afsløret 76 samlede besiddelser i deres seneste SEC-arkivering. Den seneste porteføljeværdi er beregnet til at være $ 110.053.343 USD. Faktiske aktiver under forvaltning (AUM) er denne værdi plus kontanter (som ikke er oplyst). Broyhill Asset Managements største beholdninger er iShares Trust - iShares 1-3 Year Treasury Bond ETF (US:SHY) , Philip Morris International Inc. (US:PM) , Avantor, Inc. (US:AVTR) , Baxter International Inc. (US:BAX) , and NICE Ltd. - Depositary Receipt (Common Stock) (US:NICE) . Broyhill Asset Managements nye stillinger omfatter IQVIA Holdings Inc. (US:IQV) , SPDR S&P 500 ETF (US:SPY) , Thermo Fisher Scientific Inc. (US:TMO) , Lam Research Corporation (US:LRCX) , and .
Top øger dette kvartal
Vi bruger ændringen i porteføljeallokeringen, fordi dette er den mest meningsfulde metrik. Ændringer kan skyldes handler eller ændringer i aktiekurser.
| Sikkerhed | Aktier (MM) |
Værdi (MM$) |
Portefølje % | ΔPortefølje % |
|---|---|---|---|---|
| 0,02 | 3,70 | 3,3579 | 3,3579 | |
| 0,03 | 3,20 | 2,9045 | 2,1487 | |
| 0,00 | 2,48 | 2,2562 | 0,7516 | |
| 0,02 | 2,48 | 2,2521 | 0,6285 | |
| 0,00 | 0,62 | 0,5614 | 0,5614 | |
| 0,06 | 1,54 | 1,4009 | 0,4783 | |
| 0,01 | 1,20 | 1,0910 | 0,4209 | |
| 0,00 | 0,45 | 0,4108 | 0,4108 | |
| 0,02 | 1,77 | 1,6109 | 0,3821 | |
| 0,01 | 2,64 | 2,3973 | 0,3685 |
Top falder i dette kvartal
Vi bruger ændringen i porteføljeallokeringen, fordi dette er den mest meningsfulde metrik. Ændringer kan skyldes handler eller ændringer i aktiekurser.
| Sikkerhed | Aktier (MM) |
Værdi (MM$) |
Portefølje % | ΔPortefølje % |
|---|---|---|---|---|
| 0,04 | 2,99 | 2,7212 | -1,6911 | |
| 0,06 | 1,74 | 1,5823 | -1,4063 | |
| 0,02 | 3,72 | 3,3836 | -1,2222 | |
| 0,30 | 2,64 | 2,3970 | -1,2001 | |
| 0,00 | 0,45 | 0,4058 | -1,1785 | |
| 0,10 | 1,08 | 0,9852 | -1,1472 | |
| 0,16 | 1,89 | 1,7164 | -0,8459 | |
| 0,13 | 4,03 | 3,6644 | -0,8375 | |
| 0,04 | 6,49 | 5,8937 | -0,3937 | |
| 0,36 | 4,90 | 4,4546 | -0,3595 |
13F og Fondsarkivering
Denne formular blev indsendt den 2025-08-14 for rapporteringsperioden 2025-06-30. Klik på linkikonet for at se den fulde transaktionshistorik.
Opgrader for at låse op for premium-data og eksportere til Excel ![]() .
.
| Sikkerhed | Type | Gennemsnitlig aktiekurs | Aktier (MM) |
Δ Aktier (%) |
Δ Aktier (%) |
Værdi ($MM) |
Portefølje (%) |
ΔPortefølje (%) |
|
|---|---|---|---|---|---|---|---|---|---|
| SHY / iShares Trust - iShares 1-3 Year Treasury Bond ETF | 0,12 | -11,42 | 9,84 | -11,27 | 8,9388 | -0,0815 | |||
| PM / Philip Morris International Inc. | 0,04 | -26,86 | 6,49 | -16,07 | 5,8937 | -0,3937 | |||
| AVTR / Avantor, Inc. | 0,36 | -0,23 | 4,90 | -17,15 | 4,4546 | -0,3595 | |||
| BAX / Baxter International Inc. | 0,13 | -17,62 | 4,03 | -27,13 | 3,6644 | -0,8375 | |||
| NICE / NICE Ltd. - Depositary Receipt (Common Stock) | 0,02 | -39,97 | 3,72 | -34,23 | 3,3836 | -1,2222 | |||
| IQV / IQVIA Holdings Inc. | 0,02 | 3,70 | 3,3579 | 3,3579 | |||||
| FI / Fiserv, Inc. | 0,02 | 22,92 | 3,56 | -4,02 | 3,2305 | 0,2167 | |||
| KOF / Coca-Cola FEMSA, S.A.B. de C.V. - Depositary Receipt (Common Stock) | 0,04 | -17,93 | 3,52 | -13,03 | 3,2016 | -0,0947 | |||
| DLTR / Dollar Tree, Inc. | 0,03 | 160,79 | 3,20 | 244,03 | 2,9045 | 2,1487 | |||
| FUN / Six Flags Entertainment Corporation | 0,10 | -0,13 | 3,16 | -14,81 | 2,8698 | -0,1460 | |||
| FIS / Fidelity National Information Services, Inc. | 0,04 | -49,35 | 2,99 | -44,79 | 2,7212 | -1,6911 | |||
| BALL / Ball Corporation | 0,05 | -18,57 | 2,99 | -12,28 | 2,7138 | -0,0560 | |||
| BBN / BlackRock Taxable Municipal Bond Trust | 0,17 | -2,31 | 2,72 | -5,65 | 2,4731 | 0,1263 | |||
| GLD / SPDR Gold Trust | 0,01 | 0,00 | 2,64 | 5,82 | 2,3973 | 0,3685 | |||
| NUV / Nuveen Municipal Value Fund, Inc. | 0,30 | -39,79 | 2,64 | -40,33 | 2,3970 | -1,2001 | |||
| MSFT / Microsoft Corporation | 0,00 | 1,32 | 2,48 | 34,29 | 2,2562 | 0,7516 | |||
| CRL / Charles River Laboratories International, Inc. | 0,02 | 23,20 | 2,48 | 24,21 | 2,2521 | 0,6285 | |||
| BRK.A / Berkshire Hathaway Inc. | 0,00 | 0,00 | 2,19 | -8,73 | 1,9867 | 0,0380 | |||
| WMG / Warner Music Group Corp. | 0,08 | -10,62 | 2,17 | -22,35 | 1,9677 | -0,3007 | |||
| RTO / Rentokil Initial plc - Depositary Receipt (Common Stock) | 0,09 | -20,56 | 2,13 | -16,77 | 1,9352 | -0,1458 | |||
| LQD / iShares Trust - iShares iBoxx $ Investment Grade Corporate Bond ETF | 0,02 | -15,78 | 2,05 | -15,07 | 1,8643 | -0,1010 | |||
| NVG / Nuveen AMT-Free Municipal Credit Income Fund | 0,16 | -37,76 | 1,89 | -40,04 | 1,7164 | -0,8459 | |||
| UBER / Uber Technologies, Inc. | 0,02 | -8,34 | 1,77 | 17,35 | 1,6109 | 0,3821 | |||
| FMS / Fresenius Medical Care AG - Depositary Receipt (Common Stock) | 0,06 | -58,69 | 1,74 | -52,60 | 1,5823 | -1,4063 | |||
| NBB / Nuveen Taxable Municipal Income Fund | 0,10 | -3,71 | 1,64 | -4,92 | 1,4941 | 0,0873 | |||
| NE / Noble Corporation plc | 0,06 | 21,35 | 1,54 | 35,89 | 1,4009 | 0,4783 | |||
| BRK.B / Berkshire Hathaway Inc. | 0,00 | -20,52 | 1,32 | -27,53 | 1,1966 | -0,2813 | |||
| AAPL / Apple Inc. | 0,01 | 0,00 | 1,30 | -7,62 | 1,1792 | 0,0362 | |||
| GOOG / Alphabet Inc. | 0,01 | 1,88 | 1,25 | 15,63 | 1,1364 | 0,2568 | |||
| NVDA / NVIDIA Corporation | 0,01 | 0,00 | 1,20 | 45,81 | 1,0910 | 0,4209 | |||
| XLK / The Select Sector SPDR Trust - The Technology Select Sector SPDR Fund | 0,00 | 0,00 | 1,09 | 22,66 | 0,9894 | 0,2671 | |||
| NEA / Nuveen AMT-Free Quality Municipal Income Fund | 0,10 | -57,58 | 1,08 | -58,64 | 0,9852 | -1,1472 | |||
| V / Visa Inc. | 0,00 | 0,00 | 1,05 | 1,35 | 0,9582 | 0,1114 | |||
| VIG / Vanguard Specialized Funds - Vanguard Dividend Appreciation ETF | 0,00 | 0,00 | 1,01 | 5,54 | 0,9182 | 0,1390 | |||
| ORCL / Oracle Corporation | 0,00 | 0,00 | 0,93 | 56,42 | 0,8419 | 0,3599 | |||
| JPM / JPMorgan Chase & Co. | 0,00 | -8,08 | 0,82 | 8,71 | 0,7492 | 0,1318 | |||
| BX / Blackstone Inc. | 0,01 | 0,00 | 0,79 | 7,08 | 0,7144 | 0,1167 | |||
| SLV / iShares Silver Trust | 0,02 | 0,00 | 0,75 | 5,90 | 0,6857 | 0,1058 | |||
| META / Meta Platforms, Inc. | 0,00 | -6,06 | 0,74 | 20,23 | 0,6760 | 0,1729 | |||
| AMZN / Amazon.com, Inc. | 0,00 | 0,00 | 0,71 | 15,38 | 0,6407 | 0,1432 | |||
| TFC / Truist Financial Corporation | 0,02 | 0,00 | 0,69 | 4,41 | 0,6242 | 0,0893 | |||
| XLV / The Select Sector SPDR Trust - The Health Care Select Sector SPDR Fund | 0,01 | 0,00 | 0,67 | -7,81 | 0,6124 | 0,0185 | |||
| AVGO / Broadcom Inc. | 0,00 | -9,58 | 0,63 | 48,70 | 0,5723 | 0,2281 | |||
| SPY / SPDR S&P 500 ETF | 0,00 | 0,62 | 0,5614 | 0,5614 | |||||
| DUK / Duke Energy Corporation | 0,01 | 0,00 | 0,59 | -3,28 | 0,5364 | 0,0400 | |||
| GOOGL / Alphabet Inc. | 0,00 | 0,00 | 0,59 | 13,98 | 0,5339 | 0,1144 | |||
| SO / The Southern Company | 0,01 | 0,00 | 0,58 | 0,00 | 0,5271 | 0,0546 | |||
| NXP / Nuveen Select Tax-Free Income Portfolio | 0,04 | -25,27 | 0,55 | -26,91 | 0,5038 | -0,1135 | |||
| MS / Morgan Stanley | 0,00 | 0,00 | 0,55 | 20,83 | 0,5011 | 0,1295 | |||
| CSCO / Cisco Systems, Inc. | 0,01 | 0,00 | 0,54 | 12,39 | 0,4865 | 0,0991 | |||
| ENB / Enbridge Inc. | 0,01 | 0,00 | 0,50 | 2,26 | 0,4530 | 0,0565 | |||
| NEE / NextEra Energy, Inc. | 0,01 | 3,06 | 0,47 | 0,87 | 0,4243 | 0,0479 | |||
| TMO / Thermo Fisher Scientific Inc. | 0,00 | 0,45 | 0,4108 | 0,4108 | |||||
| SCHW / The Charles Schwab Corporation | 0,00 | -80,32 | 0,45 | -77,09 | 0,4058 | -1,1785 | |||
| CB / Chubb Limited | 0,00 | 0,00 | 0,44 | -4,10 | 0,4041 | 0,0270 | |||
| HON / Honeywell International Inc. | 0,00 | 0,00 | 0,41 | 9,97 | 0,3714 | 0,0690 | |||
| HD / The Home Depot, Inc. | 0,00 | 0,00 | 0,40 | 0,00 | 0,3628 | 0,0381 | |||
| ADBE / Adobe Inc. | 0,00 | 28,42 | 0,36 | 29,64 | 0,3304 | 0,1021 | |||
| BTZ / BlackRock Credit Allocation Income Trust | 0,03 | 0,00 | 0,35 | 1,72 | 0,3225 | 0,0390 | |||
| SBUX / Starbucks Corporation | 0,00 | 0,00 | 0,33 | -6,72 | 0,3035 | 0,0126 | |||
| SHEL / Shell plc - Depositary Receipt (Common Stock) | 0,00 | 0,00 | 0,33 | -4,03 | 0,3033 | 0,0207 | |||
| SPLV / Invesco Exchange-Traded Fund Trust II - Invesco S&P 500 Low Volatility ETF | 0,00 | 0,00 | 0,33 | -2,68 | 0,2978 | 0,0242 | |||
| MRK / Merck & Co., Inc. | 0,00 | 0,00 | 0,31 | -11,83 | 0,2851 | -0,0043 | |||
| WM / Waste Management, Inc. | 0,00 | 0,00 | 0,30 | -1,31 | 0,2751 | 0,0259 | |||
| AMAT / Applied Materials, Inc. | 0,00 | 0,00 | 0,30 | 25,96 | 0,2695 | 0,0782 | |||
| CNI / Canadian National Railway Company | 0,00 | 0,00 | 0,29 | 6,72 | 0,2601 | 0,0420 | |||
| LRCX / Lam Research Corporation | 0,00 | 0,26 | 0,2379 | 0,2379 | |||||
| YUM / Yum! Brands, Inc. | 0,00 | 0,00 | 0,22 | -5,93 | 0,2020 | 0,0099 | |||
| RTX / RTX Corporation | 0,00 | 0,00 | 0,22 | 10,00 | 0,2003 | 0,0376 | |||
| FDX / FedEx Corporation | 0,00 | 0,00 | 0,21 | -6,61 | 0,1931 | 0,0077 | |||
| PFE / Pfizer Inc. | 0,01 | 0,00 | 0,21 | -4,19 | 0,1872 | 0,0120 | |||
| XLE / The Select Sector SPDR Trust - The Energy Select Sector SPDR Fund | 0,00 | 0,00 | 0,20 | -9,37 | 0,1850 | 0,0025 | |||
| VB / Vanguard Index Funds - Vanguard Small-Cap ETF | 0,00 | 0,20 | 0,1830 | 0,1830 | |||||
| NAN / Nuveen New York Quality Municipal Income Fund | 0,01 | 0,00 | 0,11 | 0,88 | 0,1037 | 0,0111 | |||
| MHN / BlackRock MuniHoldings New York Quality Fund, Inc. | 0,01 | -59,18 | 0,10 | -60,48 | 0,0892 | -0,1131 | |||
| MPW / Medical Properties Trust, Inc. | 0,01 | 0,00 | 0,05 | -28,00 | 0,0492 | -0,0124 | |||
| CMCSA / Comcast Corporation | 0,00 | -100,00 | 0,00 | 0,0000 | |||||
| TDW / Tidewater Inc. | 0,00 | -100,00 | 0,00 | 0,0000 | |||||
| BDX / Becton, Dickinson and Company | 0,00 | -100,00 | 0,00 | 0,0000 | |||||
| MQY / BlackRock MuniYield Quality Fund, Inc. | 0,00 | -100,00 | 0,00 | 0,0000 | |||||
| VAL / Valaris Limited | 0,00 | -100,00 | 0,00 | 0,0000 | |||||
| WOW / WideOpenWest, Inc. | 0,00 | -100,00 | 0,00 | 0,0000 |