Grundlæggende statistik
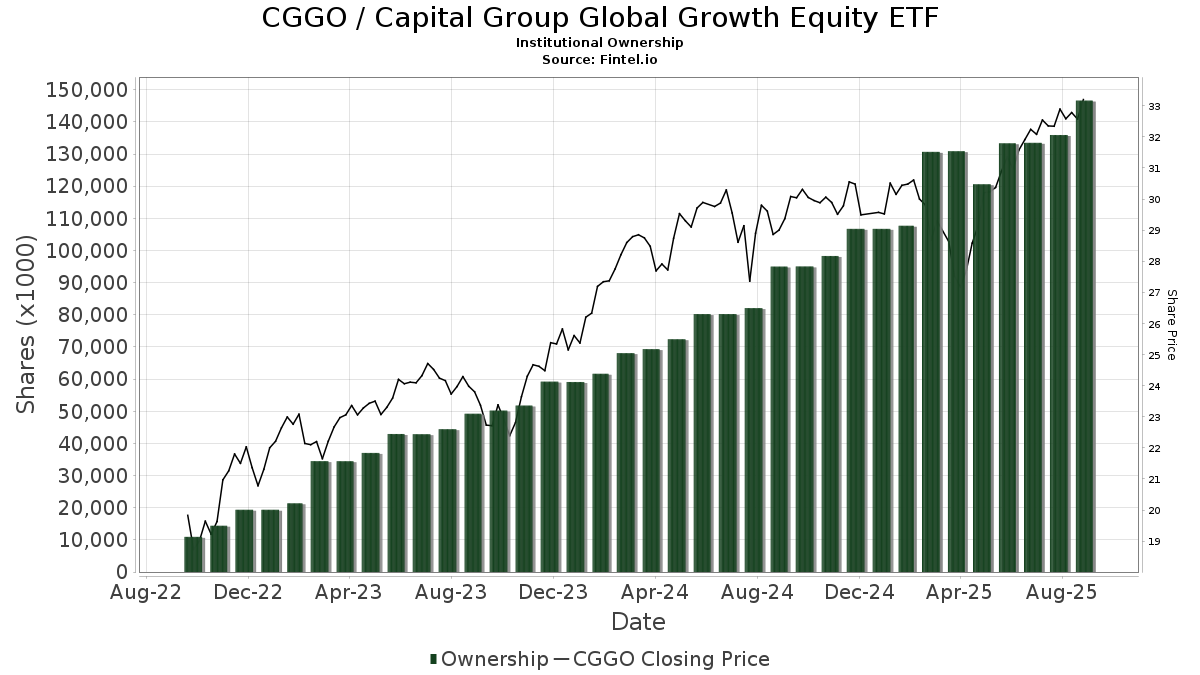
| Institutionelle ejere | 403 total, 403 long only, 0 short only, 0 long/short - change of 11,67% MRQ |
| Gennemsnitlig porteføljeallokering | 0.6329 % - change of 8,49% MRQ |
| Institutionelle aktier (lange) | 197.670.036 (ex 13D/G) - change of 31,81MM shares 19,21% MRQ |
| Institutionel værdi (lang) | $ 5.962.132 USD ($1000) |
Institutionelt ejerskab og aktionærer
Capital Group Global Growth Equity ETF (US:CGGO) har 403 institutionelle ejere og aktionærer, der har indsendt 13D/G- eller 13F-formularer til Securities Exchange Commission (SEC). Disse institutioner har i alt 197,670,036 aktier. Største aktionærer omfatter Capital Group Private Client Services, Inc., CI Private Wealth, LLC, LPL Financial LLC, Raymond James Financial Inc, Northwestern Mutual Wealth Management Co, Envestnet Asset Management Inc, Morgan Stanley, Cetera Investment Advisers, Wells Fargo & Company/mn, and Commonwealth Equity Services, Llc .
Capital Group Global Growth Equity ETF (ARCA:CGGO) institutionel ejerskabsstruktur viser aktuelle positioner i virksomheden efter institutioner og fonde, samt seneste ændringer i positionsstørrelse. Større aktionærer kan omfatte individuelle investorer, investeringsforeninger, hedgefonde eller institutioner. Skema 13D angiver, at investoren besidder (eller besidder) mere end 5 % af virksomheden og har til hensigt (eller har til hensigt at) aktivt at forfølge en ændring i forretningsstrategi. Skema 13G indikerer en passiv investering på over 5%.
The share price as of April 21, 2026 is 36,91 / share. Previously, on April 22, 2025, the share price was 27,30 / share. This represents an increase of 35,20% over that period.
Fondens stemningsscore
Fund Sentiment Score (fka Ownership Accumulation Score) finder de aktier, der bliver mest købt af fonde. Det er resultatet af en sofistikeret, multi-faktor kvantitativ model, der identificerer virksomheder med de højeste niveauer af institutionel akkumulering. Scoringsmodellen bruger en kombination af den samlede stigning i oplyste ejere, ændringerne i porteføljeallokeringer i disse ejere og andre målinger. Tallet går fra 0 til 100, hvor højere tal indikerer et højere niveau af akkumulering for sine jævnaldrende, og 50 er gennemsnittet.
Opdateringsfrekvens: Dagligt
Se Ownership Explorer, som giver en liste over højest rangerende virksomheder.
AI+ Ask Fintel’s AI assistant about Capital Group Global Growth Equity ETF.
Select a question to share a public post with an AI-crafted answer.
Thinking of good questions…
Institutionel Put/Call-forhold
Ud over at indberette standardaktie- og gældsudstedelser skal institutter med mere end 100 mill. aktiver under forvaltning også oplyse deres put- og call-optionsbeholdninger. Da salgsoptioner generelt indikerer negativ stemning, og købsoptioner indikerer positiv stemning, kan vi få en fornemmelse af den overordnede institutionelle stemning ved at plotte forholdet mellem put og kald. Diagrammet til højre viser det historiske put/call-forhold for dette instrument.
Brug af Put/Call Ratio som en indikator for investorernes stemning overvinder en af de vigtigste mangler ved at bruge totalt institutionelt ejerskab, som er, at en betydelig mængde af aktiver under forvaltning investeres passivt for at spore indekser. Passivt forvaltede fonde køber typisk ikke optioner, så indikatoren for put/call-forholdet følger mere nøje følelsen af aktivt forvaltede fonde.
13F og NPORT arkivering
Detaljer om 13F-arkivering er gratis. Detaljer om NP-ansøgninger kræver et premium-medlemskab. Grønne rækker angiver nye positioner. Røde rækker angiver lukkede positioner. Klik på linket ikon for at se den fulde transaktionshistorik.
Opgrader
for at låse premium-data op og eksportere til Excel ![]() .
.
| Fil dato | Kilde | Investor | Type | Gennemsnitlig pris (Øst) |
Aktier | Δ Aktier (%) |
Rapporteret Værdi ($1000) |
Δ Værdi (%) |
Port Alloc (%) |
|
|---|---|---|---|---|---|---|---|---|---|---|
| 2026-04-21 | 13F | Gutierrez Wealth Advisory, LLC | 237.285 | 4,63 | 7.918 | 0,76 | ||||
| 2026-04-21 | 13F | Vigil Wealth Management, LLC | 10.184 | 1,92 | 340 | -2,02 | ||||
| 2026-02-13 | 13F | Golden State Wealth Management, LLC | 16 | 128,57 | 1 | |||||
| 2026-02-13 | 13F | Integrated Wealth Concepts LLC | 345.769 | 18,36 | 11.981 | 20,02 | ||||
| 2026-04-16 | 13F | Uhlmann Price Securities, Llc | 23.856 | 0,51 | 796 | -3,16 | ||||
| 2026-04-10 | 13F | Perigon Wealth Management, LLC | 16.820 | 11,61 | 561 | 7,47 | ||||
| 2026-02-03 | 13F | Bokf, Na | 510 | 0,00 | 18 | 0,00 | ||||
| 2026-02-02 | 13F | Balentine LLC | 184.812 | -0,39 | 6.404 | 1,01 | ||||
| 2026-04-08 | 13F | Stonebridge Financial Group, LLC | 453.528 | 135,28 | 15.134 | 126,59 | ||||
| 2026-04-15 | 13F | Adamsbrown Wealth Consultants Llc | 12.251 | 0,00 | 409 | -3,77 | ||||
| 2026-04-22 | 13F | Vicus Capital | 9.542 | 15,49 | 318 | 11,19 | ||||
| 2026-01-20 | 13F | Sovran Advisors, LLC | 101.658 | -2,51 | 3.669 | 0,69 | ||||
| 2026-04-16 | 13F | Financial Management Network Inc | 190.849 | 0,76 | 6.834 | 2,64 | ||||
| 2026-02-10 | 13F | Peapack Gladstone Financial Corp | 229.519 | 4,95 | 8 | 0,00 | ||||
| 2026-01-29 | 13F | Dunhill Financial, LLC | 117 | 0,00 | 4 | 33,33 | ||||
| 2026-04-15 | 13F | Silverlake Wealth Management Llc | 80.616 | 4,75 | 2.690 | 0,90 | ||||
| 2026-02-12 | 13F | Rossby Financial, LCC | 328 | 1.326,09 | 11 | |||||
| 2025-11-14 | 13F | WNY Asset Management, LLC | 662.480 | 4,05 | 22.637 | 11,21 | ||||
| 2026-01-09 | 13F | 180 Wealth Advisors, Llc | 23.572 | 8,39 | 817 | 9,83 | ||||
| 2026-04-21 | 13F | Financial Planning Navigators CORP | 27.737 | -6,50 | 926 | -9,93 | ||||
| 2026-01-28 | 13F | HB Wealth Management, LLC | 26.019 | -0,07 | 902 | 1,35 | ||||
| 2026-02-17 | 13F | VestGen Advisors, LLC | 80.903 | -65,14 | 2.803 | -64,65 | ||||
| 2026-01-20 | 13F | Stratos Wealth Advisors, LLC | 17.945 | 4,74 | 622 | 6,15 | ||||
| 2026-02-12 | 13F | CIBC Private Wealth Group, LLC | 7.116 | 71,26 | 247 | 74,47 | ||||
| 2026-02-10 | 13F | Advisor Resource Council | 8.535 | 307 | ||||||
| 2026-02-13 | 13F | Smartleaf Asset Management LLC | 210.651 | 10,77 | 7.335 | 13,48 | ||||
| 2026-02-17 | 13F | Wiley Bros.-aintree Capital, Llc | 1.589.634 | 14,65 | 54.923 | 15,89 | ||||
| 2026-04-15 | 13F | DAVENPORT & Co LLC | 125.061 | 5,43 | 4.173 | 1,53 | ||||
| 2026-04-14 | 13F | Arvest Investments, Inc. | 442 | 0,00 | 15 | -6,67 | ||||
| 2026-04-08 | 13F | Wealth Science Advisors LLC | 636.392 | 0,00 | 22.051 | 0,00 | ||||
| 2026-04-15 | 13F | Ai Financial Services Llc | 93.433 | 5,37 | 3.118 | 1,46 | ||||
| 2026-04-22 | 13F | Apollon Wealth Management, LLC | 452.270 | 7,94 | 15.092 | 3,95 | ||||
| 2026-02-05 | 13F | Bessemer Group Inc | 9.750 | 0,00 | 0 | |||||
| 2026-01-15 | 13F | Clg Llc | 104.825 | -32,79 | 3.632 | -31,84 | ||||
| 2026-02-17 | 13F | Advisory Services Network, LLC | 27.474 | 6,66 | 952 | 8,07 | ||||
| 2026-02-06 | 13F | Larson Financial Group LLC | 6.375 | 0,00 | 221 | 1,38 | ||||
| 2026-04-13 | 13F | Professional Financial Advisors, LLC | 38.354 | 1,29 | 1.280 | -2,52 | ||||
| 2026-04-10 | 13F | Novem Group | 57.063 | -0,62 | 1.904 | -4,27 | ||||
| 2026-01-27 | 13F | Belpointe Asset Management LLC | 33.774 | 0,13 | 1.170 | 1,56 | ||||
| 2026-02-03 | 13F | McIlrath & Eck, LLC | 523 | 0,00 | 18 | 5,88 | ||||
| 2026-02-12 | 13F | Quadrant Capital Group Llc | 18.866 | 654 | ||||||
| 2026-02-02 | 13F | Eq Wealth Advisors, Llc | 103.037 | 11,16 | 3.570 | 12,72 | ||||
| 2026-02-13 | 13F | Focused Alpha, Llc | 6.961 | 241 | ||||||
| 2026-01-23 | 13F | Transcend Wealth Collective, Llc | 7.980 | -2,73 | 277 | -1,43 | ||||
| 2026-01-20 | 13F | NavPoint Financial, Inc. | 252.169 | 4,19 | 8.738 | 5,65 | ||||
| 2026-02-04 | 13F | Catalyst Financial Partners Llc | 105.927 | 104,43 | 3.670 | 107,34 | ||||
| 2026-04-08 | 13F | KWB Wealth | 376.888 | -0,61 | 13.059 | -0,61 | ||||
| 2026-02-13 | 13F | Bay Colony Advisory Group, Inc d/b/a Bay Colony Advisors | 0 | -100,00 | 0 | |||||
| 2026-04-21 | 13F | Wedbush Securities Inc | 10.127 | -5,86 | 0 | |||||
| 2026-02-03 | 13F | Ridgeline Wealth Planning, LLC | 336.017 | -15,26 | 11.643 | -14,07 | ||||
| 2026-04-08 | 13F | DiNuzzo Private Wealth, Inc. | 1.123 | 37 | ||||||
| 2026-02-13 | 13F | Citigroup Inc | 8.048 | 373,41 | 279 | 379,31 | ||||
| 2026-02-13 | 13F | Cozad Asset Management Inc | 6.705 | 0,00 | 232 | 1,31 | ||||
| 2026-02-11 | 13F | Capital Group Private Client Services, Inc. | 21.118.680 | 4,14 | 731.762 | 5,60 | ||||
| 2026-02-17 | 13F | Summit Global Investments | 14.668 | 8,38 | 1 | |||||
| 2026-02-05 | 13F | AlphaCore Capital LLC | 149.828 | -4,51 | 5.192 | -3,17 | ||||
| 2026-02-12 | 13F | Commonwealth Equity Services, Llc | 5.399.474 | 5,58 | 187.092 | 107.423,56 | ||||
| 2026-01-21 | 13F | Landaas & Co /wi /adv | 33.012 | 137,56 | 1.144 | 140,63 | ||||
| 2026-04-08 | 13F | Sax Wealth Advisors, Llc | 8.038 | 0,00 | 279 | 0,00 | ||||
| 2026-04-07 | 13F | Signaturefd, Llc | 84 | 0,00 | 3 | 0,00 | ||||
| 2026-04-13 | 13F | Massmutual Trust Co Fsb/adv | 315 | 11 | ||||||
| 2026-02-12 | 13F | BlackRock, Inc. | 49.584 | -2,09 | 1.718 | -0,69 | ||||
| 2026-02-13 | 13F | Ubs Asset Management Americas Inc | 2.396 | 83 | ||||||
| 2026-02-17 | 13F | Captrust Financial Advisors | 945.652 | 1,34 | 32.767 | 2,76 | ||||
| 2026-02-05 | 13F | Compton Financial Group, LLC | 6.706 | 232 | ||||||
| 2026-01-23 | 13F | Clarity Wealth Advisors, LLC | 317.991 | 5,55 | 11.018 | 7,03 | ||||
| 2026-01-26 | 13F | Cwm, Llc | 222.566 | -45,17 | 8 | -46,15 | ||||
| 2026-02-18 | 13F | GWM Advisors LLC | 1.516.092 | 8,23 | 52.533 | 9,75 | ||||
| 2026-02-10 | 13F | Cravens & Co Advisors, LLC | 6.194 | -1,05 | 223 | 4,69 | ||||
| 2026-02-13 | 13F | Transamerica Financial Advisors, Inc. | 10.027 | 68,66 | 347 | 70,94 | ||||
| 2026-04-13 | 13F | Mather Group, Llc. | 2.794 | 93 | ||||||
| 2026-02-06 | 13F | GPS Wealth Strategies Group, LLC | 0 | -100,00 | 0 | |||||
| 2026-04-20 | 13F | WealthSpring Partners, LLC | 28.261 | 943 | ||||||
| 2026-04-21 | 13F | Financial Council Asset Management Inc | 1.558.410 | 5,06 | 52.004 | 1,18 | ||||
| 2026-04-22 | 13F | Patriot Financial Group Insurance Agency, LLC | 24.444 | 162,61 | 816 | 153,11 | ||||
| 2026-02-04 | 13F | Money Concepts Capital Corp | 13.200 | 7,26 | 457 | 8,81 | ||||
| 2026-02-03 | 13F | International Assets Investment Management, Llc | 17.433 | 20,11 | 604 | 31,30 | ||||
| 2026-02-17 | 13F | IHT Wealth Management, LLC | 11.589 | 43,66 | 402 | 45,82 | ||||
| 2026-01-29 | 13F | Concurrent Investment Advisors, LLC | 167.238 | 81,18 | 5.795 | 83,76 | ||||
| 2026-01-28 | 13F | West Michigan Advisors, Llc | 158.054 | 1,95 | 5.477 | 3,38 | ||||
| 2026-02-11 | 13F | Capital Analysts, Inc. | 237.017 | 11,84 | 8 | 14,29 | ||||
| 2026-02-12 | 13F | Johnson Financial Group, Inc. | 350 | 12 | ||||||
| 2026-04-10 | 13F | Boyer Financial Services, Inc. | 173.332 | 8,89 | 5.784 | 3,38 | ||||
| 2026-04-07 | 13F | Park Avenue Securities Llc | 77.715 | 14,58 | 3 | 0,00 | ||||
| 2025-11-12 | 13F | Willow Creek Wealth Management Inc. | 9.842 | 0,00 | 336 | 7,01 | ||||
| 2026-01-26 | 13F | Asset Dedication, LLC | 175 | 0,00 | 6 | 20,00 | ||||
| 2026-02-17 | 13F | Signature Equity Partners, LLC | 457 | 16 | ||||||
| 2026-04-16 | 13F | Balboa Wealth Partners | 15.309 | 4,08 | 511 | 0,20 | ||||
| 2026-04-09 | 13F | McNamara Financial Services, Inc. | 13.930 | -7,81 | 465 | -11,28 | ||||
| 2026-02-20 | 13F | Ruggaard & Associates LLC | 247.414 | -7,32 | 8.573 | -6,02 | ||||
| 2026-04-14 | 13F | Nbc Securities, Inc. | 740 | 0,00 | 25 | -4,00 | ||||
| 2026-02-11 | 13F | Tradition Wealth Management, LLC | 78.193 | 0,04 | 2.709 | 1,46 | ||||
| 2026-01-20 | 13F | Stratos Wealth Partners, LTD. | 91.847 | 29,14 | 3.183 | 30,95 | ||||
| 2026-02-02 | 13F | Truist Financial Corp | 149.307 | 13,10 | 5.173 | 14,68 | ||||
| 2025-11-14 | 13F | Skopos Labs, Inc. | 0 | -100,00 | 0 | |||||
| 2026-02-17 | 13F | Susquehanna International Group, Llp | 0 | -100,00 | 0 | |||||
| 2026-01-21 | 13F | Prime Capital Investment Advisors, LLC | 8.309 | 1,61 | 288 | 2,87 | ||||
| 2026-01-12 | 13F | Daymark Wealth Partners, Llc | 10.227 | -15,28 | 354 | -14,08 | ||||
| 2026-04-06 | 13F | CX Institutional | 1.198 | 0,00 | 0 | |||||
| 2026-03-26 | 13F | Merited Wealth, LLC | 75.103 | 2.602 | ||||||
| 2026-02-10 | 13F | Moors & Cabot, Inc. | 21.834 | -4,76 | 757 | -3,45 | ||||
| 2026-04-15 | 13F | Tenzing Financial LLC | 7.729 | 0,00 | 281 | 4,87 | ||||
| 2026-04-17 | 13F | Trinity Wealth Management, LLC | 9.032 | 23,39 | 301 | 18,97 | ||||
| 2026-02-17 | 13F | Two Sigma Securities, Llc | 10.715 | 371 | ||||||
| 2026-01-21 | 13F | Capital Investment Advisory Services, LLC | 10.081 | 67,26 | 349 | 70,24 | ||||
| 2026-04-17 | 13F | Aspire Growth Partners LLC | 8.180 | 0,00 | 273 | -3,89 | ||||
| 2026-02-13 | 13F | Blueprint Financial Advisors LLC | 60.361 | 47,11 | 2.092 | 49,14 | ||||
| 2026-02-11 | 13F | Mascagni Wealth Management, Inc. | 39.193 | 1,41 | 1.358 | 2,88 | ||||
| 2026-03-24 | 13F/A | Barclays Plc | 0 | -100,00 | 0 | |||||
| 2026-04-13 | 13F | Creative Financial Designs Inc /adv | 2.258 | 13,70 | 75 | 10,29 | ||||
| 2026-02-06 | 13F | Cvfg Llc | 98.014 | 0,69 | 3.396 | 2,10 | ||||
| 2026-01-28 | 13F | Salomon & Ludwin, LLC | 680 | 0,00 | 24 | 4,35 | ||||
| 2026-02-09 | 13F | Hartland & Co., LLC | 696 | -93,87 | 24 | -93,80 | ||||
| 2026-04-22 | 13F | Smallwood Wealth Investment Management, LLC | 115.583 | -0,29 | 3.857 | -3,96 | ||||
| 2026-04-17 | 13F | Total Clarity Wealth Management, Inc. | 33.733 | -25,62 | 1.126 | -28,39 | ||||
| 2026-04-21 | 13F | OneAscent Financial Services LLC | 228.455 | 7.624 | ||||||
| 2026-02-12 | 13F | Great Valley Advisor Group, Inc. | 10.954 | 10,74 | 380 | 12,43 | ||||
| 2026-01-28 | 13F | Rather & Kittrell, Inc. | 61.527 | 0,00 | 2.132 | 1,38 | ||||
| 2026-02-11 | 13F | Gwn Securities Inc. | 14.417 | 48,22 | 500 | 50,30 | ||||
| 2026-02-17 | 13F | Cetera Investment Advisers | 7.734.465 | 9,71 | 267.999 | 11,25 | ||||
| 2026-02-11 | 13F | Cerity Partners LLC | 30.340 | 0,60 | 1.051 | 2,04 | ||||
| 2026-02-09 | 13F | Integrity Advisory Solutions, LLC | 108.244 | 9,55 | 3.751 | 11,08 | ||||
| 2026-02-03 | 13F | Sequoia Financial Advisors, LLC | 8.818 | 6,24 | 306 | 7,77 | ||||
| 2026-01-27 | 13F | TD Waterhouse Canada Inc. | 1.989 | 0,00 | 69 | 0,00 | ||||
| 2026-01-23 | 13F | FSM Wealth Advisors, LLC | 163.709 | 1,18 | 5.673 | 2,60 | ||||
| 2026-02-10 | 13F | Envestnet Asset Management Inc | 10.246.121 | 11,26 | 355.028 | 12,82 | ||||
| 2026-04-17 | 13F | Stonebridge Financial Group, LLC / MO | 38.045 | -1,33 | 1.270 | -5,01 | ||||
| 2026-02-17 | 13F | Main Street Financial Solutions, LLC | 288.179 | 0,48 | 9.985 | 1,89 | ||||
| 2026-02-02 | 13F | Mutual Advisors, LLC | 204.252 | 2,65 | 7.077 | 2,65 | ||||
| 2026-04-17 | 13F | Cora Capital Advisors Llc | 6.774 | -0,06 | 226 | -3,42 | ||||
| 2026-04-21 | 13F | Moseley Investment Management Inc | 98.626 | 5,83 | 3.291 | 1,95 | ||||
| 2026-04-22 | 13F | Fearless Solutions, LLC dba Best Invest | 20.639 | -0,69 | 689 | -4,44 | ||||
| 2026-04-20 | 13F | SILVER OAK SECURITIES, Inc | 337.869 | 11.275 | ||||||
| 2026-02-05 | 13F | Western Wealth Management, LLC | 27.910 | 3,38 | 967 | 4,88 | ||||
| 2026-02-14 | 13F | Rockefeller Capital Management L.P. | 165.976 | 59,79 | 5.756 | 62,16 | ||||
| 2026-02-17 | 13F | D. E. Shaw & Co., Inc. | 10.347 | -61,23 | 359 | -60,75 | ||||
| 2026-04-14 | 13F | Prospera Financial Services Inc | 491.246 | -20,38 | 16.400 | -23,31 | ||||
| 2026-01-28 | 13F | Financial Perspectives, Inc | 68.567 | 15,30 | 2.376 | 16,88 | ||||
| 2026-02-12 | 13F | Kovack Advisors, Inc. | 9.163 | 10,36 | 290 | 2,47 | ||||
| 2026-02-19 | 13F | CI Private Wealth, LLC | 20.211.701 | 2.846,27 | 20.220 | -13,74 | ||||
| 2026-02-13 | 13F | Morgan Stanley | 9.961.008 | 15,30 | 345.149 | 16,92 | ||||
| 2026-02-17 | 13F | GeoWealth Management, LLC | 5.751 | 199 | ||||||
| 2026-02-06 | 13F | Mach-1 Financial Group, Inc. | 0 | -100,00 | 0 | |||||
| 2026-02-05 | 13F | Stephens Inc /ar/ | 371.033 | 69,66 | 12.856 | 72,06 | ||||
| 2026-04-22 | 13F | Kennedy Investment Group | 6.290 | 210 | ||||||
| 2026-02-12 | 13F | Insigneo Advisory Services, Llc | 20.034 | -3,18 | 694 | -1,84 | ||||
| 2026-02-12 | 13F | Forge Financial Services LLC | 845.108 | 2,67 | 29.283 | 2,64 | ||||
| 2026-02-10 | 13F | Vantus Wealth LLC | 23.798 | 825 | ||||||
| 2026-02-13 | 13F | Jacobi Capital Management LLC | 37.144 | 36,07 | 1.287 | 38,09 | ||||
| 2026-04-08 | 13F | Sapient Capital Llc | 6.260 | 209 | ||||||
| 2026-02-13 | 13F | SRS Capital Advisors, Inc. | 1.362 | 16,61 | 47 | 20,51 | ||||
| 2026-03-05 | 13F | Gunpowder Capital Management, LLC dba Oliver Wealth Management | 5.841 | 202 | ||||||
| 2026-02-04 | 13F | Strategic Family Wealth Counselors, L.L.C. | 49.396 | 2,79 | 1.760 | 7,19 | ||||
| 2026-02-17 | 13F | Equitable Holdings, Inc. | 253.920 | 27,26 | 8.798 | 29,04 | ||||
| 2026-04-14 | 13F | LifeGoal Wealth Advisors | 473.839 | 13,61 | 16.098 | 11,35 | ||||
| 2026-04-15 | 13F | Howard Capital Management Group, LLC | 18.566 | 0,00 | 620 | -3,73 | ||||
| 2026-02-03 | 13F | Entruity Wealth, LLC | 146.199 | 0,58 | 5.066 | 1,99 | ||||
| 2026-02-12 | 13F | Carson Advisory Inc. | 236.754 | 3,33 | 8.204 | 4,78 | ||||
| 2026-02-13 | 13F | Baird Financial Group, Inc. | 1.417.348 | 1,27 | 49.111 | 2,69 | ||||
| 2026-02-12 | 13F | Reliant Wealth Planning | 653.251 | -1,78 | 22.635 | -0,40 | ||||
| 2026-01-29 | 13F | Sanctuary Advisors, LLC | 17.820 | 37,55 | 617 | 39,59 | ||||
| 2026-03-25 | 13F | Mission Financial Group, LLC | 9.206 | 319 | ||||||
| 2026-02-18 | 13F | EP Wealth Advisors, Inc. | 52.453 | 10,49 | 1.817 | 19,78 | ||||
| 2026-02-09 | 13F | Kestra Investment Management, LLC | 374.496 | 14,64 | 12.976 | 16,25 | ||||
| 2026-02-17 | 13F | High Falls Advisors, Inc | 9.251 | 7,01 | 321 | 8,47 | ||||
| 2026-02-04 | 13F | Certior Financial Group, Llc | 21.932 | 6,58 | 760 | 7,97 | ||||
| 2026-02-18 | 13F | Beacon Pointe Advisors, LLC | 641.378 | 0,45 | 22.224 | 1,86 | ||||
| 2026-02-04 | 13F | Pensionmark Financial Group, Llc | 52.215 | 87,26 | 1.057 | 11,03 | ||||
| 2026-02-06 | 13F | EverSource Wealth Advisors, LLC | 47.974 | 1,92 | 1.662 | 3,36 | ||||
| 2026-04-15 | 13F | Code Waechter LLC | 64.521 | 2.153 | ||||||
| 2026-01-28 | 13F | Cornerstone Advisory, LLC | 19.019 | -8,17 | 659 | -6,79 | ||||
| 2026-02-05 | 13F | Burford Brothers, Inc. | 163.303 | 2,87 | 5.658 | 4,31 | ||||
| 2026-01-30 | 13F | Strategic Blueprint, LLC | 153.243 | -80,73 | 5.310 | -80,47 | ||||
| 2026-02-11 | 13F | Capital International Investors | 0 | -100,00 | 0 | |||||
| 2026-02-03 | 13F | We Are One Seven, LLC | 29.929 | 146,29 | 1.037 | 149,88 | ||||
| 2026-04-07 | 13F | CoreCap Advisors, LLC | 1.315 | 7,88 | 44 | 2,38 | ||||
| 2026-02-11 | 13F | Ameritas Investment Partners, Inc. | 946 | 33 | ||||||
| 2026-02-13 | 13F | Stifel Financial Corp | 938.772 | 10,54 | 32.529 | 12,10 | ||||
| 2026-02-17 | 13F | Summit Trail Advisors, Llc | 6.075 | 0,00 | 210 | 1,45 | ||||
| 2026-02-11 | 13F | O'shaughnessy Asset Management, Llc | 67.281 | 626,89 | 2.331 | 637,66 | ||||
| 2026-02-05 | 13F | Atria Investments Llc | 37.674 | 1.305 | ||||||
| 2026-02-09 | 13F | HBK Sorce Advisory LLC | 7.063 | -2,46 | 255 | 2,82 | ||||
| 2026-02-10 | 13F | Thoroughbred Financial Services, Llc | 65.390 | 17,44 | 2 | 100,00 | ||||
| 2026-02-06 | 13F | Vestmark Advisory Solutions, Inc. | 264.286 | 12,76 | 9.158 | 14,33 | ||||
| 2026-01-21 | 13F | BIP Wealth, LLC | 682.727 | 23.656 | ||||||
| 2026-02-13 | 13F | SYM FINANCIAL Corp | 0 | -100,00 | 0 | |||||
| 2026-02-18 | 13F | Troutman Wealth Management, LLC | 11.089 | 384 | ||||||
| 2026-02-09 | 13F | Frazier Financial Advisors, LLC | 372.646 | 5,28 | 12.912 | 6,76 | ||||
| 2026-01-23 | 13F | Diversify Advisory Services, LLC | 14.198 | 514 | ||||||
| 2026-02-26 | 13F | Oak Grove Capital LLC | 7.107 | 246 | ||||||
| 2026-02-13 | 13F | Ausdal Financial Partners, Inc. | 7.297 | -0,36 | 253 | 0,80 | ||||
| 2026-04-08 | 13F | Olistico Wealth, LLC | 22.689 | 0,00 | 757 | -3,69 | ||||
| 2026-04-21 | 13F | Trueblood Wealth Management, LLC | 95.233 | 7,97 | 3.178 | 3,96 | ||||
| 2026-02-17 | 13F | Private Advisor Group, LLC | 872.724 | -18,91 | 30.240 | -17,78 | ||||
| 2026-02-11 | 13F | M Holdings Securities, Inc. | 12.810 | 0 | ||||||
| 2026-02-06 | 13F | Global Retirement Partners, LLC | 31.629 | 190,20 | 1.096 | 194,35 | ||||
| 2026-02-18 | 13F | Hanlon Investment Management, Inc. | 6.699 | -4,44 | 232 | -2,93 | ||||
| 2026-02-11 | 13F | Convergence Financial, LLC | 27.399 | -1,77 | 949 | -0,42 | ||||
| 2026-04-22 | 13F | MFA Wealth Services | 10.739 | 14,54 | 358 | 10,49 | ||||
| 2026-02-10 | 13F | Waterloo Capital, L.P. | 12.857 | -2,71 | 445 | -1,33 | ||||
| 2026-04-16 | 13F | BridgePort Financial Solutions, LLC | 26.547 | 0,97 | 886 | -2,85 | ||||
| 2026-02-13 | 13F | BNB Wealth Management, LLC | 335.837 | 11.637 | ||||||
| 2026-02-13 | 13F | Kestra Advisory Services, LLC | 0 | -100,00 | 0 | |||||
| 2026-04-17 | 13F | CENTRAL TRUST Co | 125 | 0,00 | 4 | 0,00 | ||||
| 2026-04-01 | 13F | Signature Wealth Management Group | 20.920 | 6,00 | 698 | 2,20 | ||||
| 2026-02-04 | 13F | Ameritas Advisory Services, LLC | 95.436 | 16,72 | 3.307 | 18,37 | ||||
| 2026-02-20 | 13F | Sunbelt Securities, Inc. | 756 | 1,20 | 26 | 4,00 | ||||
| 2026-02-05 | 13F | Evergreen Wealth Partners LLC | 22.584 | 783 | ||||||
| 2026-02-09 | 13F | Kingsview Wealth Management, LLC | 12.098 | -57,92 | 419 | -57,33 | ||||
| 2026-04-13 | 13F | IFP Advisors, Inc | 4.705 | -21,71 | 157 | -24,52 | ||||
| 2026-02-17 | 13F | Qube Research & Technologies Ltd | 0 | -100,00 | 0 | |||||
| 2026-01-26 | 13F | Valmark Advisers, Inc. | 755.810 | 20,97 | 26.189 | 22,67 | ||||
| 2026-01-26 | 13F | Seamount Financial Group Inc | 39.671 | 12,07 | 1.375 | 13,65 | ||||
| 2026-02-10 | 13F | BKD Wealth Advisors, LLC | 5.903 | 0,00 | 205 | 1,49 | ||||
| 2026-04-21 | 13F | Vise Technologies, Inc. | 56.505 | 0,00 | 1.958 | 0,00 | ||||
| 2025-11-04 | 13F | Woodmont Investment Counsel Llc | 0 | -100,00 | 0 | |||||
| 2026-01-29 | 13F | Aprio Wealth Management, LLC | 85.697 | 2.969 | ||||||
| 2026-04-15 | 13F | Arlington Financial Advisors, LLC | 1.477.118 | 5,47 | 49.291 | 1,57 | ||||
| 2026-02-02 | 13F | Benjamin Edwards Inc | 817.694 | 20,14 | 28.333 | 21,83 | ||||
| 2025-11-13 | 13F | Marshall Wace, Llp | 0 | -100,00 | 0 | |||||
| 2026-04-20 | 13F | McKinley Carter Wealth Services, Inc. | 0 | -100,00 | 0 | |||||
| 2026-04-13 | 13F | St Germain D J Co Inc | 910.205 | -0,27 | 30.374 | -3,95 | ||||
| 2026-02-11 | 13F | Meeder Advisory Services, Inc. | 8.487 | 294 | ||||||
| 2026-02-12 | 13F | Renaissance Technologies Llc | 40.400 | 1.400 | ||||||
| 2026-02-05 | 13F | Allworth Financial LP | 2.702 | 11,51 | 94 | 13,41 | ||||
| 2026-02-06 | 13F | Synergy Investment Management, LLC | 12.025 | 2,47 | 417 | 4,00 | ||||
| 2026-02-09 | 13F | Atlantic Trust, LLC | 0 | -100,00 | 0 | |||||
| 2026-01-14 | 13F | ORG Partners LLC | 30.138 | 107,58 | 1.044 | 81,57 | ||||
| 2026-01-23 | 13F | Assetmark, Inc | 766.865 | 33,69 | 26.572 | 35,57 | ||||
| 2026-02-02 | 13F | Souders Financial Advisors | 351.463 | 3,94 | 12.178 | 5,41 | ||||
| 2026-04-17 | 13F | United Advisor Group, LLC | 11.587 | 0,00 | 387 | -3,74 | ||||
| 2026-01-23 | 13F | HBW Advisory Services LLC | 105.987 | 1,80 | 3.672 | 3,23 | ||||
| 2026-02-17 | 13F | Russell Investments Group, Ltd. | 338 | -58,63 | 12 | -59,26 | ||||
| 2026-04-22 | 13F | Janney Montgomery Scott LLC | 1.085.698 | 23,23 | 36 | 20,00 | ||||
| 2026-01-28 | 13F | Kingswood Wealth Advisors, Llc | 103.881 | 1.273,00 | 3.599 | 1.294,96 | ||||
| 2026-02-13 | 13F | Advyzon Investment Management, LLC | 20.928 | 725 | ||||||
| 2026-02-13 | 13F | Resources Investment Advisors, LLC. | 19.745 | 684 | ||||||
| 2026-02-10 | 13F | Rothschild Investment Llc | 270.536 | 13,87 | 9.374 | 15,47 | ||||
| 2026-04-15 | 13F | Nations Financial Group Inc, /ia/ /adv | 38.089 | 45,13 | 1.271 | 39,82 | ||||
| 2026-02-11 | 13F | LPL Financial LLC | 15.068.808 | 14,93 | 522.134 | 16,55 | ||||
| 2026-02-09 | 13F | Bleakley Financial Group, LLC | 497.148 | 7,92 | 17.226 | 9,44 | ||||
| 2026-02-12 | 13F | Steward Partners Investment Advisory, Llc | 299.822 | 2,12 | 10.389 | 3,55 | ||||
| 2026-02-04 | 13F | Colonial River Wealth Management, LLC | 41.497 | 4,98 | 1.438 | 6,44 | ||||
| 2026-02-06 | 13F | Envestnet Portfolio Solutions, Inc. | 130.217 | 18,71 | 4.512 | 20,38 | ||||
| 2026-04-09 | 13F | Silvia Mccoll Wealth Management, Llc | 110.051 | 2,05 | 3.672 | -1,71 | ||||
| 2026-02-06 | 13F | Cullen/frost Bankers, Inc. | 137.291 | 25,91 | 4.757 | 27,70 | ||||
| 2026-01-28 | 13F | Barrett & Company, Inc. | 8.977 | 0,11 | 311 | 1,63 | ||||
| 2026-02-12 | 13F | Wealthspire Advisors, LLC | 0 | -100,00 | 0 | |||||
| 2026-02-18 | 13F | Royal Harbor Partners, LLC | 281.527 | -1,14 | 9.755 | 0,25 | ||||
| 2026-04-08 | 13F | First Heartland Consultants, Inc. | 36.373 | 15,84 | 1.214 | 11,49 | ||||
| 2026-02-13 | 13F | OpenArc Corporate Advisory, LLC | 7.786 | 270 | ||||||
| 2026-04-20 | 13F | Kestra Private Wealth Services, Llc | 95.696 | 15,22 | 3.193 | 10,98 | ||||
| 2026-01-27 | 13F | PFG Advisors | 109.526 | 10,76 | 3.795 | 12,34 | ||||
| 2026-01-30 | 13F | Turning Point Benefit Group, Inc. | 64 | -20,00 | 2 | 0,00 | ||||
| 2026-04-14 | 13F | Wealthcare Advisory Partners LLC | 6.042 | 3,41 | 202 | -0,50 | ||||
| 2026-04-15 | 13F | Signature Estate & Investment Advisors Llc | 248.107 | 3,27 | 8.279 | -0,54 | ||||
| 2026-01-28 | 13F | Geneos Wealth Management Inc. | 90.190 | 33,09 | 3.125 | 34,99 | ||||
| 2026-02-09 | 13F | Cary Street Partners Financial Llc | 251.277 | 3,76 | 8.707 | 5,21 | ||||
| 2026-01-30 | 13F | Sigma Planning Corp | 16.269 | 13,86 | 572 | 17,21 | ||||
| 2026-01-30 | 13F | Us Bancorp \de\ | 9.840 | 7,26 | 341 | 8,63 | ||||
| 2026-01-15 | 13F | Saxony Capital Management, LLC | 48.218 | 67,84 | 1.671 | 70,23 | ||||
| 2026-02-12 | 13F | Brown Brothers Harriman & Co | 79.321 | 0,00 | 2.748 | 1,40 | ||||
| 2026-04-22 | 13F | Pinnacle Bancorp, Inc. | 5.900 | 2,61 | 197 | -1,51 | ||||
| 2026-01-21 | 13F | Ergawealth Advisors, Inc. | 457.916 | 117,83 | 15.867 | 120,91 | ||||
| 2026-02-13 | 13F | Sei Investments Co | 1.622.498 | 22,96 | 56.220 | 24,68 | ||||
| 2026-01-07 | 13F | Sagespring Wealth Partners, Llc | 200.838 | 9,12 | 4.524 | 16,36 | ||||
| 2026-02-11 | 13F | Legacy Capital Wealth Management, Llc | 35.260 | -75,34 | 1.222 | -70,77 | ||||
| 2026-02-17 | 13F | Aqr Capital Management Llc | 9.968 | 48,93 | 345 | 51,32 | ||||
| 2026-02-18 | 13F | Vermillion & White Wealth Management Group, LLC | 3.647 | 10,62 | 126 | 12,50 | ||||
| 2026-03-05 | 13F | Bayban | 670 | 23 | ||||||
| 2026-04-08 | 13F | Leonard Rickey Investment Advisors P.L.L.C. | 115.810 | -0,03 | 3.865 | -3,74 | ||||
| 2026-02-05 | 13F | Financial Security Advisor, Inc. | 16.556 | -3,22 | 574 | -1,88 | ||||
| 2026-02-05 | 13F | Kmt Wealth Management, Llc | 10.286 | 0,00 | 356 | 1,42 | ||||
| 2026-02-05 | 13F | Cambridge Investment Research Advisors, Inc. | 3.214.170 | 12,57 | 111 | 14,43 | ||||
| 2026-04-06 | 13F | GAMMA Investing LLC | 737 | -10,88 | 25 | -14,29 | ||||
| 2026-02-12 | 13F | Daybright Advisory Services, Inc. | 45.498 | 1.576 | ||||||
| 2026-02-13 | 13F | Beacon Financial Advisory LLC | 61.039 | 11,89 | 2.115 | 13,47 | ||||
| 2026-02-05 | 13F | Cornerstone Wealth Management, LLC | 21.688 | 752 | ||||||
| 2026-02-11 | 13F | Endeavor Private Wealth, Inc. | 82.780 | 4,73 | 2.868 | 6,22 | ||||
| 2026-04-15 | 13F | Merit Financial Group, LLC | 92.975 | 3,28 | 3.103 | -0,55 | ||||
| 2026-04-21 | 13F | Pflug Koory, LLC | 729 | 0,00 | 24 | -4,00 | ||||
| 2026-01-08 | 13F | Lincoln Capital LLC | 28.697 | 23,97 | 994 | 23,63 | ||||
| 2026-01-26 | 13F | Private Trust Co Na | 11.356 | 17,94 | 393 | 19,45 | ||||
| 2026-02-17 | 13F | Mercer Global Advisors Inc /adv | 18.804 | -4,86 | 652 | -3,56 | ||||
| 2026-02-12 | 13F | Summit Financial, LLC | 113.065 | 8,61 | 3.918 | 10,12 | ||||
| 2026-02-06 | 13F | Axxcess Wealth Management, Llc | 263.048 | 104,28 | 9.115 | 107,14 | ||||
| 2026-02-10 | 13F | Goldman Sachs Group Inc | 95.375 | 377,57 | 3.305 | 384,46 | ||||
| 2025-11-06 | 13F | Whipplewood Advisors, LLC | 0 | -100,00 | 0 | |||||
| 2025-11-06 | 13F | Financial Advocates Investment Management | 21.959 | -49,49 | 750 | -46,00 | ||||
| 2026-02-17 | 13F | Miller Capital Partners, Inc. | 1.184 | 41 | ||||||
| 2026-01-30 | 13F | Exencial Wealth Advisors, Llc | 16.516 | 572 | ||||||
| 2026-02-13 | 13F | Colony Group, LLC | 874.055 | 1,15 | 30.286 | 2,58 | ||||
| 2026-02-12 | 13F | RPg Family Wealth Advisory, LLC | 154.015 | -1,38 | 5.337 | 0,00 | ||||
| 2026-02-11 | 13F | Greykasell Wealth Strategies, Inc. | 69.301 | 0,13 | 2.401 | 1,57 | ||||
| 2026-03-10 | 13F | Advisortrust Partners, Llc | 6.849 | 237 | ||||||
| 2026-02-17 | 13F | Citadel Advisors Llc | 0 | -100,00 | 0 | |||||
| 2026-02-04 | 13F | Summit Wealth Group Llc / Co | 25.660 | 889 | ||||||
| 2026-01-21 | 13F | Signature Resources Capital Management, LLC | 29.217 | 21,57 | 1.012 | 23,26 | ||||
| 2026-02-04 | 13F | Meridian Wealth Management, LLC | 59.125 | 0,13 | 2.049 | 1,54 | ||||
| 2026-01-21 | 13F | Indiana Trust & Investment Management CO | 605 | 0,00 | 21 | 0,00 | ||||
| 2026-01-23 | 13F | Capital Planning LLC | 26.614 | 81,89 | 935 | 87,37 | ||||
| 2026-01-23 | 13F | Rsm Us Wealth Management Llc | 18.276 | -1,76 | 636 | 0,16 | ||||
| 2026-02-11 | 13F | Gateway Wealth Partners, LLC | 50.480 | 68,87 | 1.749 | 71,30 | ||||
| 2026-02-09 | 13F | MSH Capital Advisors LLC | 27.039 | 22,92 | 937 | 24,63 | ||||
| 2026-02-13 | 13F | Arkadios Wealth Advisors | 73.359 | 113,79 | 2.542 | 116,81 | ||||
| 2026-04-07 | 13F | U.S. Capital Wealth Advisors, LLC | 241.675 | 3,18 | 8.065 | -0,64 | ||||
| 2026-01-27 | 13F | Latitude Advisors, LLC | 37.800 | 17,34 | 1.310 | 19,00 | ||||
| 2026-02-17 | 13F | Jones Financial Companies Lllp | 4.182.196 | 16,87 | 144.918 | 19,67 | ||||
| 2026-02-06 | 13F | Harmony Asset Management Llc | 8.078 | 0,00 | 280 | 1,09 | ||||
| 2026-04-16 | 13F | Smith Thornton Advisors LLC | 153.251 | 8,78 | 5.114 | 4,75 | ||||
| 2026-04-17 | 13F | AdvisorNet Financial, Inc | 425 | -31,56 | 14 | -33,33 | ||||
| 2026-02-10 | 13F | Natixis Advisors, L.p. | 283.688 | 13,55 | 10 | 12,50 | ||||
| 2026-01-20 | 13F | American National Bank | 630 | 0,00 | 22 | 0,00 | ||||
| 2026-02-17 | 13F | Northern Trust Corp | 12.829 | 445 | ||||||
| 2026-01-07 | 13F | Procyon Private Wealth Partners, LLC | 36.901 | 8,83 | 1.279 | 10,36 | ||||
| 2026-04-21 | 13F | Main Line Retirement Advisors, LLC | 6.229 | 0,00 | 208 | -3,72 | ||||
| 2025-11-13 | 13F | Herold Advisors, Inc. | 0 | -100,00 | 0 | |||||
| 2026-02-13 | 13F | Pinnacle Wealth Planning Services, Inc. | 1.158 | 40 | ||||||
| 2026-01-30 | 13F | Simplicity Wealth,LLC | 8.219 | -0,58 | 285 | 0,71 | ||||
| 2026-02-09 | 13F | Huntington National Bank | 3 | -95,74 | ||||||
| 2026-02-17 | 13F | Raymond James Financial Inc | 13.130.315 | 9,34 | 454.965 | 10,87 | ||||
| 2026-01-16 | 13F | Tempus Wealth Planning, LLC | 39.137 | -1,72 | 1.356 | -0,29 | ||||
| 2026-02-26 | 13F | TD Capital Management LLC | 1.387 | 48 | ||||||
| 2026-04-15 | 13F | Weatherly Asset Management L. P. | 33.609 | 0,83 | 1.122 | -2,86 | ||||
| 2026-02-13 | 13F | Mml Investors Services, Llc | 3.182.129 | 6,24 | 110.261 | 7,73 | ||||
| 2026-03-27 | 13F | Prosperity Wealth Management, Inc. | 13.463 | 99,57 | 467 | 102,61 | ||||
| 2026-02-17 | 13F | Advisor Group Holdings, Inc. | 4.058.668 | -7,61 | 140.654 | -3,62 | ||||
| 2026-01-21 | 13F | Walkner Condon Financial Advisors LLC | 17.060 | 0,00 | 591 | 1,55 | ||||
| 2026-02-06 | 13F | HighTower Advisors, LLC | 462.279 | 31,88 | 16.018 | 33,73 | ||||
| 2026-02-10 | 13F | Sittner & Nelson, Llc | 37.313 | 25,95 | 1.348 | 33,10 | ||||
| 2026-01-27 | 13F | Brighton Jones Llc | 0 | -100,00 | 0 | |||||
| 2025-11-05 | 13F | Moloney Securities Asset Management, LLC | 34.147 | -4,79 | 1.167 | 1,75 | ||||
| 2026-01-29 | 13F | D.a. Davidson & Co. | 809.229 | 1,00 | 28.040 | 2,42 | ||||
| 2026-02-17 | 13F | Lantern Wealth Advisors, LLC | 19.813 | 86,60 | 687 | 89,50 | ||||
| 2026-04-09 | 13F | Lantz Financial LLC | 10.200 | 1,79 | 340 | -2,02 | ||||
| 2026-01-23 | 13F | Brown Miller Wealth Management, LLC | 23.603 | 0,00 | 818 | 1,36 | ||||
| 2026-02-12 | 13F | Jane Street Group, Llc | 0 | -100,00 | 0 | |||||
| 2026-04-16 | 13F | Johnson Bixby & Associates, LLC | 184.157 | -6,05 | 6.145 | -9,51 | ||||
| 2026-04-17 | 13F/A | Founders Financial Securities Llc | 169.533 | 32,02 | 6.071 | 36,44 | ||||
| 2026-04-17 | 13F | RFG Advisory, LLC | 51.414 | 3,38 | 1.716 | -0,46 | ||||
| 2026-02-02 | 13F | KPP Advisory Services LLC | 9.702 | -22,93 | 336 | -21,86 | ||||
| 2026-02-13 | 13F | Sofos Investments, Inc. | 590 | 0,00 | 20 | 0,00 | ||||
| 2026-03-23 | 13F | J. Derek Lewis & Associates Inc. | 584.262 | 20.245 | ||||||
| 2026-01-30 | 13F | Archer Investment Corp | 6 | 0,00 | 0 | |||||
| 2026-02-02 | 13F | Oppenheimer & Co Inc | 45.312 | 85,75 | 1.570 | 88,48 | ||||
| 2026-04-10 | 13F | Octavia Wealth Advisors, LLC | 10.830 | 3,50 | 361 | -0,28 | ||||
| 2026-01-30 | 13F | Richardson Capital Management LLC | 1.895 | 32,98 | 66 | 35,42 | ||||
| 2026-02-11 | 13F | J.w. Cole Advisors, Inc. | 110.697 | 17,02 | 3.774 | 16,74 | ||||
| 2026-02-17 | 13F | Bank Of America Corp /de/ | 3.465.284 | 9,45 | 120.072 | 10,99 | ||||
| 2025-11-14 | 13F | Old Mission Capital Llc | 0 | -100,00 | 0 | |||||
| 2026-02-23 | 13F | Kera Capital Partners, Inc. | 219.467 | 3,75 | 7.975 | 10,33 | ||||
| 2026-02-13 | 13F | MAI Capital Management | 270.298 | 9,14 | 9.366 | 10,67 | ||||
| 2026-01-15 | 13F | Lodestone Wealth Management LLC | 25.218 | 5,11 | 874 | 6,59 | ||||
| 2026-04-21 | 13F | SmartHarvest Portfolios, LLC | 8.500 | 284 | ||||||
| 2026-04-10 | 13F | Capital Investment Management, Inc. | 27.991 | 970 | ||||||
| 2026-02-12 | 13F | Callan Family Office, LLC | 7.824 | 271 | ||||||
| 2026-02-10 | 13F | IFG Advisory, LLC | 59.444 | 2.060 | ||||||
| 2026-04-16 | 13F | Sweeney & Michel, Llc | 48.199 | 4,26 | 1.752 | 3,92 | ||||
| 2026-02-13 | 13F | Gts Securities Llc | 13.477 | 467 | ||||||
| 2026-02-17 | 13F | Creative Planning | 51.190 | 16,54 | 1.774 | 18,20 | ||||
| 2026-04-13 | 13F | Kmg Fiduciary Partners, Llc | 17.401 | -0,04 | 581 | -3,81 | ||||
| 2026-01-27 | 13F | Berger Financial Group, Inc | 7.429 | 1,86 | 257 | 3,21 | ||||
| 2026-02-13 | 13F | Tudor Financial Inc. | 17.890 | 35,44 | 620 | 37,25 | ||||
| 2026-02-10 | 13F | Nvest Financial, LLC | 8.419 | 42,69 | 292 | 44,78 | ||||
| 2026-02-17 | 13F | Royal Bank Of Canada | 3.232.316 | 7,23 | 112.000 | 8,74 | ||||
| 2026-04-17 | 13F | Aspen Capital Management, LLC | 9.974 | 0,00 | 333 | -3,77 | ||||
| 2026-01-13 | 13F | Mayflower Financial Advisors, LLC | 9.744 | 0,30 | 338 | 1,81 | ||||
| 2026-02-17 | 13F | TCG Advisory Services, LLC | 12.364 | 0,07 | 428 | 1,42 | ||||
| 2026-01-06 | 13F | Advance Capital Management, Inc. | 44.092 | 6,04 | 1.528 | 7,54 | ||||
| 2026-02-13 | 13F | Venture Visionary Partners LLC | 71.073 | 103,31 | 2.509 | 110,05 | ||||
| 2026-04-22 | 13F | Motco | 2.666 | 89 | ||||||
| 2026-04-08 | 13F | M.e. Allison & Co., Inc. | 25.914 | 7,15 | 865 | 3,23 | ||||
| 2026-02-13 | 13F | Wells Fargo & Company/mn | 5.847.836 | 32,47 | 202.628 | 34,33 | ||||
| 2026-04-13 | 13F | Armstrong, Fleming & Moore, Inc | 42.815 | -0,44 | 1.429 | -4,16 | ||||
| 2026-02-12 | 13F | StoneX Group Inc. | 0 | -100,00 | 0 | |||||
| 2026-02-10 | 13F/A | Northwestern Mutual Wealth Management Co | 11.053.425 | 0,31 | 383.001 | 1,72 | ||||
| 2026-02-12 | 13F | Founders Financial Alliance, LLC | 8.660 | -15,59 | 300 | -14,29 | ||||
| 2026-01-20 | 13F | Savvy Advisors, Inc. | 7.734 | 268 | ||||||
| 2026-02-12 | 13F | Gerber Kawasaki Wealth & Investment Management | 237.326 | 1,56 | 8.223 | 2,99 | ||||
| 2026-01-28 | 13F | Confluence Wealth Services, Inc. | 184.061 | 4,82 | 6.378 | 6,30 | ||||
| 2026-02-03 | 13F | American Financial Advisors, LLC | 23.638 | -0,55 | 819 | 0,86 | ||||
| 2026-04-15 | 13F | Michael Brady & Co., LLC | 265.957 | 1,97 | 8.875 | -1,80 | ||||
| 2026-02-09 | 13F | Fisher Asset Management, LLC | 6.134 | -4,59 | 213 | -3,20 | ||||
| 2026-02-17 | 13F | Ameriprise Financial Inc | 20.459 | -9,04 | 709 | -7,81 | ||||
| 2026-02-13 | 13F | Visionary Wealth Advisors | 16.247 | 29,50 | 563 | 31,31 | ||||
| 2026-02-09 | 13F | Harbour Investments, Inc. | 265.540 | 20,06 | 9.201 | 21,74 | ||||
| 2026-02-05 | 13F | Presper Financial Architects, LLC | 23.747 | -5,75 | 823 | -4,42 | ||||
| 2026-04-08 | 13F | Wealth Enhancement Advisory Services, Llc | 1.392.172 | -30,93 | 47.125 | -34,85 | ||||
| 2026-02-09 | 13F | 44 Wealth Management Llc | 41.137 | -4,74 | 1.425 | -3,39 | ||||
| 2026-02-10 | 13F | Root Financial Partners, LLC | 5.540 | 0,00 | 192 | 1,06 | ||||
| 2026-01-29 | 13F | Comerica Bank | 32.311 | 9,94 | 1.120 | 11,45 | ||||
| 2026-02-05 | 13F | ORBA Wealth Advisors, L.L.C. | 74.764 | -16,73 | 2.591 | -15,55 | ||||
| 2026-02-17 | 13F | Vertex Planning Partners, LLC | 6.874 | 6,69 | 238 | 8,18 | ||||
| 2026-04-13 | 13F | LexAurum Advisors, LLC | 8.736 | 292 | ||||||
| 2026-02-17 | 13F | Ameriflex Group, Inc. | 1.401 | 47,47 | 49 | 50,00 | ||||
| 2026-04-07 | 13F | Farther Finance Advisors, LLC | 189.049 | -59,38 | 6.422 | -60,19 | ||||
| 2026-02-13 | 13F | Mariner, LLC | 72.647 | 90,27 | 2.517 | 93,02 | ||||
| 2026-04-08 | 13F | Bill Few Associates, Inc. | 114.629 | 4,76 | 3.825 | 0,90 | ||||
| 2026-04-14 | 13F | Thurston, Springer, Miller, Herd & Titak, Inc. | 1.550 | 22,24 | 52 | 18,60 | ||||
| 2026-01-23 | 13F | Smith, Moore & Co. | 168.956 | 2,53 | 5.854 | 3,98 | ||||
| 2026-02-10 | 13F | CIBC World Markets Inc. | 7.849 | 4,32 | 272 | 5,45 | ||||
| 2026-01-20 | 13F | Investment Planning Advisors, Inc. | 19.883 | 1,51 | 689 | 2,84 | ||||
| 2026-02-17 | 13F | Fmr Llc | 353 | 12 | ||||||
| 2026-02-12 | 13F | Titleist Asset Management, Llc | 37.909 | 1.314 | ||||||
| 2026-01-29 | 13F | UBS Group AG | 4.032.146 | 4,19 | 139.714 | 5,65 | ||||
| 2026-01-27 | 13F | Security Financial Services, INC. | 24.214 | 25,26 | 839 | 27,12 | ||||
| 2026-02-17 | 13F | Modern Wealth Management, LLC | 52.098 | 2,45 | 1.805 | 3,91 | ||||
| 2026-04-15 | 13F | LongView Wealth Management | 85.245 | -4,25 | 3.154 | -2,17 | ||||
| 2026-02-13 | 13F | Flow Traders U.s. Llc | 0 | -100,00 | 0 | |||||
| 2025-11-04 | 13F | Gimbal Financial | 8.980 | 0,00 | 307 | 6,62 | ||||
| 2026-02-03 | 13F | Koshinski Asset Management, Inc. | 168.739 | -0,52 | 5.847 | 0,86 | ||||
| 2026-04-08 | 13F | Dynamic Advisor Solutions LLC | 27.016 | 5,14 | 902 | 1,24 | ||||
| 2026-01-12 | 13F | Paragon Advisors, LLC | 176.224 | 25,06 | 6.106 | 26,81 | ||||
| 2026-04-21 | 13F | AA Financial Advisors, LLC | 284.226 | -12,73 | 9.485 | -15,95 | ||||
| 2026-01-26 | 13F | Northwest Financial Advisors | 60.384 | 0,59 | 2.092 | 2,00 | ||||
| 2026-04-14 | 13F | Zrc Wealth Management, Llc | 894 | 0,00 | 30 | -3,33 | ||||
| 2026-02-13 | 13F | Change Path, LLC | 17.632 | 3,96 | 611 | 5,35 | ||||
| 2026-02-12 | 13F | Brinker Capital Investments, LLC | 214.103 | 7,20 | 7.419 | 8,70 | ||||
| 2026-02-17 | 13F | Perennial Investment Advisors, LLC | 155.042 | 25,55 | 5.372 | 27,33 | ||||
| 2026-02-12 | 13F | Principal Securities, Inc. | 296.491 | 11,61 | 10.273 | 13,18 | ||||
| 2026-02-09 | 13F | Integrity Alliance, Llc. | 11.410 | 395 | ||||||
| 2026-02-09 | 13F | FinDec Wealth Services, Inc. | 6.281 | -4,19 | 218 | -3,12 | ||||
| 2026-02-11 | 13F | Jpmorgan Chase & Co | 830.059 | 60,01 | 28.762 | 69,40 | ||||
| 2026-01-20 | 13F | Ascent Group, LLC | 8.787 | 1,67 | 304 | 3,05 | ||||
| 2026-04-20 | 13F | LVW Advisors, LLC | 1.044.217 | -2,20 | 34.846 | -5,82 | ||||
| 2026-02-10 | 13F | Calton & Associates, Inc. | 43.190 | 1.497 | ||||||
| 2026-02-17 | 13F | Blueprint Investment Partners LLC | 61.485 | 49,85 | 2.130 | 51,93 |