Grundlæggende statistik
| Institutionelle aktier (lange) | 194.913.307 - 63,70% (ex 13D/G) - change of 16,78MM shares 9,42% MRQ |
| Institutionel værdi (lang) | $ 5.152.294 USD ($1000) |
Institutionelt ejerskab og aktionærer
Brookfield Renewable Partners L.P. - Limited Partnership (US:BEP) har 253 institutionelle ejere og aktionærer, der har indsendt 13D/G- eller 13F-formularer til Securities Exchange Commission (SEC). Disse institutioner har i alt 194,913,307 aktier. Største aktionærer omfatter Brookfield Asset Management Inc., Royal Bank Of Canada, Principal Financial Group Inc, FIL Ltd, Bank Of Montreal /can/, PMBMX - MidCap Fund (f/k/a MidCap Blend Fund) R-3, State Of Wisconsin Investment Board, CIBC Asset Management Inc, Morgan Stanley, and CIBC World Markets Inc. .
Brookfield Renewable Partners L.P. - Limited Partnership (NYSE:BEP) institutionel ejerskabsstruktur viser aktuelle positioner i virksomheden efter institutioner og fonde, samt seneste ændringer i positionsstørrelse. Større aktionærer kan omfatte individuelle investorer, investeringsforeninger, hedgefonde eller institutioner. Skema 13D angiver, at investoren besidder (eller besidder) mere end 5 % af virksomheden og har til hensigt (eller har til hensigt at) aktivt at forfølge en ændring i forretningsstrategi. Skema 13G indikerer en passiv investering på over 5%.
The share price as of March 13, 2026 is 30,17 / share. Previously, on March 17, 2025, the share price was 22,89 / share. This represents an increase of 31,80% over that period.

Fondens stemningsscore
Fund Sentiment Score (fka Ownership Accumulation Score) finder de aktier, der bliver mest købt af fonde. Det er resultatet af en sofistikeret, multi-faktor kvantitativ model, der identificerer virksomheder med de højeste niveauer af institutionel akkumulering. Scoringsmodellen bruger en kombination af den samlede stigning i oplyste ejere, ændringerne i porteføljeallokeringer i disse ejere og andre målinger. Tallet går fra 0 til 100, hvor højere tal indikerer et højere niveau af akkumulering for sine jævnaldrende, og 50 er gennemsnittet.
Opdateringsfrekvens: Dagligt
Se Ownership Explorer, som giver en liste over højest rangerende virksomheder.
AI+ Ask Fintel’s AI assistant about Brookfield Renewable Partners L.P. - Limited Partnership.
Select a question to share a public post with an AI-crafted answer.
Thinking of good questions…
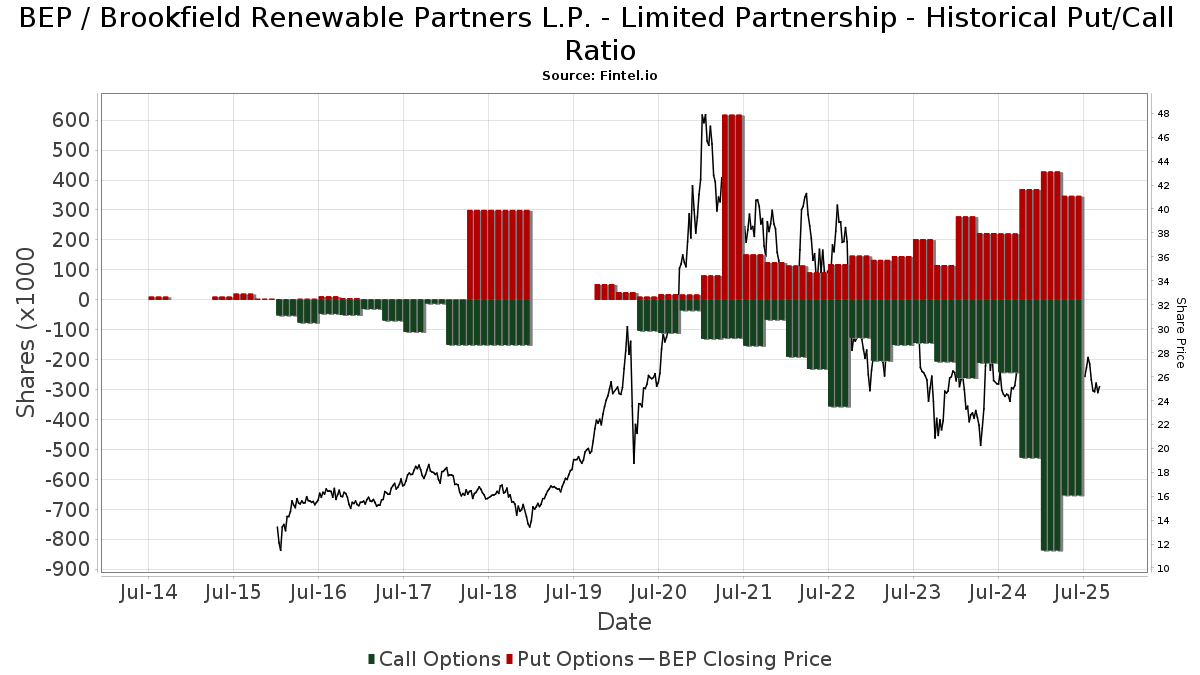
Institutionel Put/Call-forhold
Ud over at indberette standardaktie- og gældsudstedelser skal institutter med mere end 100 mill. aktiver under forvaltning også oplyse deres put- og call-optionsbeholdninger. Da salgsoptioner generelt indikerer negativ stemning, og købsoptioner indikerer positiv stemning, kan vi få en fornemmelse af den overordnede institutionelle stemning ved at plotte forholdet mellem put og kald. Diagrammet til højre viser det historiske put/call-forhold for dette instrument.
Brug af Put/Call Ratio som en indikator for investorernes stemning overvinder en af de vigtigste mangler ved at bruge totalt institutionelt ejerskab, som er, at en betydelig mængde af aktiver under forvaltning investeres passivt for at spore indekser. Passivt forvaltede fonde køber typisk ikke optioner, så indikatoren for put/call-forholdet følger mere nøje følelsen af aktivt forvaltede fonde.
13F og NPORT arkivering
Detaljer om 13F-arkivering er gratis. Detaljer om NP-ansøgninger kræver et premium-medlemskab. Grønne rækker angiver nye positioner. Røde rækker angiver lukkede positioner. Klik på linket ikon for at se den fulde transaktionshistorik.
Opgrader
for at låse premium-data op og eksportere til Excel ![]() .
.
| Fil dato | Kilde | Investor | Type | Gennemsnitlig pris (Øst) |
Aktier | Δ Aktier (%) |
Rapporteret Værdi ($1000) |
Δ Værdi (%) |
Port Alloc (%) |
|
|---|---|---|---|---|---|---|---|---|---|---|
| 2026-02-13 | 13F | Aviso Financial Inc. | 0 | -100,00 | 0 | |||||
| 2026-02-11 | 13F | Tacita Capital Inc | 119.101 | 0,65 | 3.220 | 5,54 | ||||
| 2026-01-23 | 13F | Natural Investments, Llc | 35.777 | -3,01 | 1 | |||||
| 2026-02-11 | 13F | Cedar Mountain Advisors, LLC | 12 | 0,00 | 0 | |||||
| 2026-02-24 | 13F | Ketron Financial | 11.292 | 305 | ||||||
| 2026-02-12 | 13F | SWAN Capital LLC | 0 | -100,00 | 0 | |||||
| 2026-02-03 | 13F | Washington Trust Advisors, Inc. | 7.201 | 0,00 | 194 | 4,86 | ||||
| 2026-02-17 | 13F | Private Advisor Group, LLC | 17.681 | 0,03 | 477 | 4,62 | ||||
| 2025-11-12 | 13F | Transce3nd, LLC | 0 | -100,00 | 0 | |||||
| 2026-02-13 | 13F | Wells Fargo & Company/mn | 64.295 | 35,52 | 1.734 | 41,78 | ||||
| 2026-01-20 | 13F | Thurston, Springer, Miller, Herd & Titak, Inc. | 168 | 5 | ||||||
| 2026-02-11 | 13F | Jpmorgan Chase & Co | 241.002 | 1.120,08 | 6.500 | 1.176,82 | ||||
| 2026-01-29 | 13F | Nbc Securities, Inc. | 1.974 | 0,00 | 53 | 6,00 | ||||
| 2026-02-09 | 13F | Atlantic Trust, LLC | 8.866 | 0,00 | 239 | 4,82 | ||||
| 2026-02-02 | 13F | Pittenger & Anderson Inc | 60 | 0,00 | 2 | 0,00 | ||||
| 2025-11-13 | 13F | Nemes Rush Group LLC | 0 | -100,00 | 0 | -100,00 | ||||
| 2026-02-17 | 13F | Royal Bank Of Canada | Put | 700.000 | 18.879 | |||||
| 2026-01-12 | 13F | Byrne Asset Management LLC | 100 | 0,00 | 3 | 0,00 | ||||
| 2026-02-17 | 13F | Royal Bank Of Canada | 17.738.900 | 5,93 | 478.418 | 10,78 | ||||
| 2026-01-05 | 13F | GAMMA Investing LLC | 1.124 | 0,00 | 30 | 7,14 | ||||
| 2026-01-07 | 13F | Epiq Partners, Llc | 95.210 | -22,72 | 2.568 | -19,20 | ||||
| 2026-03-11 | 13F | Leonteq Securities AG | 0 | -100,00 | 0 | |||||
| 2026-02-13 | 13F | Brown Advisory Inc | 72.485 | 22,94 | 1.955 | 28,55 | ||||
| 2026-01-28 | 13F | HB Wealth Management, LLC | 37.975 | 0,00 | 1.024 | 4,60 | ||||
| 2026-02-13 | 13F | Golden State Wealth Management, LLC | 0 | -100,00 | 0 | -100,00 | ||||
| 2025-09-26 | NP | PID - Invesco International Dividend Achievers ETF This fund is a listed as child fund of Invesco Ltd. and if that institution has disclosed ownership in this security, then these positions will not be double counted when calculating total shares and total value | 1.398.733 | -1,99 | 38.535 | 17,19 | ||||
| 2026-01-27 | 13F | WealthCollab, LLC | 1 | 0 | ||||||
| 2025-10-15 | 13F | Mb, Levis & Associates, Llc | 0 | -100,00 | 0 | |||||
| 2026-02-13 | 13F | Citigroup Inc | 781.437 | 360,70 | 21.144 | 383,62 | ||||
| 2026-02-13 | 13F | Van Eck Associates Corp | 22.191 | 110,72 | 1 | |||||
| 2026-02-02 | 13F | Intact Investment Management Inc. | 1.156.587 | 45,34 | 31.253 | 52,36 | ||||
| 2026-02-10 | 13F | Pasadena Private Wealth, LLC | Call | 1.500 | 8 | |||||
| 2026-02-13 | 13F | National Bank Of Canada /fi/ | 2.882.310 | 6,86 | 76.227 | 10,11 | ||||
| 2025-10-31 | 13F | Whittier Trust Co | 0 | -100,00 | 0 | |||||
| 2026-02-13 | 13F | Morgan Stanley | 4.029.046 | 41,87 | 108.663 | 48,36 | ||||
| 2026-01-29 | 13F | Advisors Capital Management, LLC | 409.932 | 0,25 | 11.056 | 4,84 | ||||
| 2025-09-25 | NP | CCNR - ALPS | CoreCommodity Natural Resources ETF | 26.420 | 728 | ||||||
| 2026-02-11 | 13F | LPL Financial LLC | 62.806 | 5,93 | 1.694 | 10,73 | ||||
| 2026-01-23 | 13F | Tyche Wealth Partners LLC | 13.450 | -15,67 | 363 | -11,92 | ||||
| 2026-02-17 | 13F | Guardian Partners Inc. | 0 | -100,00 | 0 | |||||
| 2025-10-27 | 13F | Bangor Savings Bank | 0 | -100,00 | 0 | |||||
| 2025-10-24 | 13F | Tema Etfs Llc | 0 | -100,00 | 0 | |||||
| 2026-02-13 | 13F | Arkadios Wealth Advisors | 56.537 | -3,22 | 1.525 | 1,20 | ||||
| 2026-02-13 | 13F | SRS Capital Advisors, Inc. | 0 | -100,00 | 0 | |||||
| 2026-02-11 | 13F | Clearbridge Investments, LLC | 706.237 | 1.144,95 | 19.047 | 1.201,91 | ||||
| 2026-02-17 | 13F | Highland Capital Management Fund Advisors, L.p. | 57.506 | 0,00 | 1.551 | 4,52 | ||||
| 2025-09-26 | NP | FPWR - First Trust EIP Carbon Impact ETF This fund is a listed as child fund of First Trust Advisors Lp and if that institution has disclosed ownership in this security, then these positions will not be double counted when calculating total shares and total value | 12.761 | 10,00 | 352 | 31,95 | ||||
| 2026-02-05 | 13F | SFE Investment Counsel | 66.045 | 3,95 | 1.781 | 8,73 | ||||
| 2026-02-06 | 13F | IFP Advisors, Inc | 391 | 11 | ||||||
| 2026-02-17 | 13F | Advisor Group Holdings, Inc. | 27.836 | 8,08 | 751 | 13,98 | ||||
| 2026-02-11 | 13F | Simplex Trading, Llc | Call | 0 | -100,00 | 0 | ||||
| 2026-02-12 | 13F | Bank Of Nova Scotia Trust Co | 10.705 | -95,19 | 289 | -94,98 | ||||
| 2026-02-18 | 13F | GWM Advisors LLC | 0 | -100,00 | 0 | |||||
| 2026-02-11 | 13F | Simplex Trading, Llc | Put | 0 | -100,00 | 0 | ||||
| 2026-02-05 | 13F | Cambridge Investment Research Advisors, Inc. | 34.758 | 15,22 | 1 | |||||
| 2026-01-30 | 13F | Lincluden Management Ltd | 575.275 | -4,34 | 21 | 40,00 | ||||
| 2026-02-05 | 13F | Allworth Financial LP | 8.645 | 9,50 | 233 | 14,78 | ||||
| 2026-02-11 | 13F | TruNorth Capital Management, LLC | 0 | -100,00 | 0 | |||||
| 2026-01-23 | 13F | Valley National Advisers Inc | 940 | 0,00 | 0 | |||||
| 2026-02-17 | 13F | Russell Investments Group, Ltd. | 1.339 | 0,00 | 36 | 5,88 | ||||
| 2026-02-12 | 13F | Steward Partners Investment Advisory, Llc | 1.218 | -10,11 | 33 | -5,88 | ||||
| 2026-02-13 | 13F | K2 Principal Fund, L.p. | 129.900 | 3.468 | ||||||
| 2026-01-15 | 13F | Gunderson Capital Management Inc. | 55.032 | -2,03 | 1.484 | 2,49 | ||||
| 2026-01-23 | 13F | Assetmark, Inc | 129 | 0,00 | 3 | 0,00 | ||||
| 2026-02-17 | 13F | Advisory Services Network, LLC | 9.300 | 25,68 | 251 | 31,58 | ||||
| 2026-01-20 | 13F | Nvwm, Llc | 68 | 0,00 | 2 | 0,00 | ||||
| 2026-02-13 | 13F | WealthTrust Axiom LLC | 13.425 | -1,97 | 362 | 2,55 | ||||
| 2026-02-13 | 13F | Neuberger Berman Group LLC | 71.096 | -84,31 | 1.917 | -83,59 | ||||
| 2026-02-11 | 13F | Group One Trading, L.p. | Call | 5.300 | 211,76 | 143 | 230,23 | |||
| 2026-02-11 | 13F | Group One Trading, L.p. | Put | 1.300 | -13,33 | 35 | -7,89 | |||
| 2026-01-12 | 13F | Rialto Wealth Management, LLC | 82 | 0,00 | 2 | 0,00 | ||||
| 2026-02-11 | 13F | Group One Trading, L.p. | 396 | -94,96 | 11 | -95,05 | ||||
| 2026-02-17 | 13F | MIRAE ASSET GLOBAL ETFS HOLDINGS Ltd. | 45.400 | -1,45 | 1.228 | 3,45 | ||||
| 2026-02-10 | 13F | Connor, Clark & Lunn Investment Management Ltd. | 2.736.463 | 353,85 | 73.948 | 375,95 | ||||
| 2026-02-10 | 13F | Bowen Hanes & Co Inc | 780.705 | 0,00 | 21 | -99,90 | ||||
| 2026-02-13 | 13F | Financial Freedom, LLC | 1.268 | 0,00 | 34 | 6,25 | ||||
| 2026-01-16 | 13F | West Branch Capital LLC | 51 | 0,00 | 1 | 0,00 | ||||
| 2026-01-15 | 13F | Nisa Investment Advisors, Llc | 86 | 0,00 | 2 | 0,00 | ||||
| 2026-01-22 | 13F | CCLA Investment Management Ltd | 2.199.682 | -6,94 | 59 | -1,67 | ||||
| 2026-02-02 | 13F | Millstone Evans Group, LLC | 1.065 | 0,00 | 29 | 3,70 | ||||
| 2026-02-12 | 13F | Wealthspire Advisors, LLC | 0 | -100,00 | 0 | |||||
| 2026-02-13 | 13F | Commerce Bank | 468.575 | 0,00 | 12.637 | 4,58 | ||||
| 2026-01-26 | 13F | JNBA Financial Advisors | 1.000 | 0,00 | 27 | 4,00 | ||||
| 2026-02-17 | 13F | Liontrust Investment Partners LLP | 786.251 | -14,45 | 21.205 | -10,54 | ||||
| 2026-02-11 | 13F | Gilpin Wealth Management, Llc | 91 | 2 | ||||||
| 2026-01-20 | 13F | SOA Wealth Advisors, LLC. | 28.270 | 0,00 | 28 | 0,00 | ||||
| 2026-02-13 | 13F | Manufacturers Life Insurance Company, The | 0 | -100,00 | 0 | -100,00 | ||||
| 2026-02-17 | 13F | SageView Advisory Group, LLC | 918 | 25 | ||||||
| 2026-01-29 | 13F | UBS Group AG | 144.450 | -87,93 | 3.896 | -87,38 | ||||
| 2026-02-17 | 13F | SIG North Trading, ULC | Call | 100.100 | 83,33 | 2.700 | 91,69 | |||
| 2025-09-29 | NP | RNRG - Global X YieldCo & Renewable Energy Income ETF This fund is a listed as child fund of Mirae Asset Global Investments Co., Ltd. and if that institution has disclosed ownership in this security, then these positions will not be double counted when calculating total shares and total value | 50.944 | -0,22 | 1.407 | 20,15 | ||||
| 2026-02-17 | 13F | SIG North Trading, ULC | 256.429 | 1.868,44 | 6.916 | 1.964,18 | ||||
| 2026-02-12 | 13F | Rossby Financial, LCC | 0 | -100,00 | 0 | |||||
| 2026-02-17 | 13F | SIG North Trading, ULC | Put | 714.900 | 999,85 | 19.281 | 1.050,36 | |||
| 2026-02-03 | 13F | Credit Industriel Et Commercial | 416.093 | 0,00 | 11.222 | 4,58 | ||||
| 2026-02-12 | 13F | Chilton Capital Management Llc | 5.895 | 0,00 | 159 | 3,95 | ||||
| 2026-02-12 | 13F | CIBC Private Wealth Group, LLC | 706.122 | -9,16 | 19.044 | -5,00 | ||||
| 2026-01-28 | 13F | Chicago Partners Investment Group LLC | 0 | -100,00 | 0 | |||||
| 2026-02-10 | 13F | Bnp Paribas Arbitrage, Sa | 67.350 | 617,18 | 1.816 | 650,41 | ||||
| 2025-09-29 | NP | AWYIX - CIBC ATLAS EQUITY INCOME FUND Institutional Class Shares | 224.048 | 0,00 | 6.173 | 19,57 | ||||
| 2026-02-04 | 13F | Ameritas Advisory Services, LLC | 0 | -100,00 | 0 | |||||
| 2026-02-10 | 13F | Td Asset Management Inc | 2.696.678 | 23,41 | 72.967 | 29,53 | ||||
| 2026-01-12 | 13F | Seacrest Wealth Management, Llc | 13.524 | -6,27 | 372 | -7,94 | ||||
| 2026-01-20 | 13F | Signaturefd, Llc | 457 | 0,00 | 12 | 9,09 | ||||
| 2026-01-30 | 13F | Laurel Wealth Advisors LLC | 3 | 0 | ||||||
| 2026-02-05 | 13F | Bessemer Group Inc | 8.790 | 0,00 | 0 | |||||
| 2026-02-13 | 13F | Stifel Financial Corp | 36.212 | -2,86 | 977 | 1,56 | ||||
| 2026-02-11 | 13F | Deltroit Asset Management (UK) LLP | 553.783 | 14.936 | ||||||
| 2026-02-17 | 13F | Investment Management Corp of Ontario | 28.153 | 759 | ||||||
| 2026-02-13 | 13F | Voya Financial Advisors, Inc. | 0 | -100,00 | 0 | |||||
| 2026-02-10 | 13F | Goldman Sachs Group Inc | 1.195.658 | -14,01 | 32.247 | -10,08 | ||||
| 2026-02-12 | 13F | Northwest & Ethical Investments L.P. | 224.844 | 74,68 | 6.051 | 80,79 | ||||
| 2026-02-17 | 13F | Susquehanna Portfolio Strategies, LLC | 16.900 | 0,00 | 456 | 4,60 | ||||
| 2026-01-20 | 13F | Stratos Wealth Partners, LTD. | 11.046 | 0,26 | 298 | 4,58 | ||||
| 2025-11-14 | 13F | S&t Bank/pa | 0 | -100,00 | 0 | |||||
| 2026-02-12 | 13F | Commonwealth Equity Services, Llc | 25.720 | -0,53 | 694 | |||||
| 2025-10-31 | 13F | Nicola Wealth Management Ltd. | 0 | -100,00 | 0 | |||||
| 2026-02-13 | 13F | Corient IA LLC | 7.500 | 202 | ||||||
| 2026-02-13 | 13F | Kestra Advisory Services, LLC | 8.326 | 225 | ||||||
| 2026-01-14 | 13F | Spire Wealth Management | 758 | 66,23 | 20 | 81,82 | ||||
| 2026-01-21 | 13F | SJS Investment Consulting Inc. | 200 | 0,00 | 5 | 0,00 | ||||
| 2026-02-17 | 13F | Captrust Financial Advisors | 23.178 | -2,94 | 625 | 1,63 | ||||
| 2026-02-02 | 13F | Principal Financial Group Inc | 10.305.148 | 1,75 | 277.930 | 6,41 | ||||
| 2026-02-13 | 13F | Mariner, LLC | 16.397 | 18,39 | 442 | 23,81 | ||||
| 2026-02-02 | 13F | Fifth Third Bancorp | 3 | 0,00 | 0 | |||||
| 2026-02-09 | 13F | Harbour Investments, Inc. | 185 | -9,76 | 5 | -20,00 | ||||
| 2026-01-29 | 13F | Warren Street Wealth Advisors, LLC | 8.356 | 225 | ||||||
| 2025-11-13 | 13F | NINE MASTS CAPITAL Ltd | 0 | -100,00 | 0 | |||||
| 2026-02-09 | 13F | Huntington National Bank | 1.073 | -0,09 | 29 | 3,70 | ||||
| 2026-02-05 | 13F | Center for Financial Planning, Inc. | 22 | 0,00 | 1 | |||||
| 2026-02-11 | 13F | Monetary Management Group Inc | 4.000 | 108 | ||||||
| 2026-01-27 | 13F | Waterfront Wealth Inc. | 10.637 | 0,71 | 304 | 0,66 | ||||
| 2025-11-14 | 13F | Point72 Europe (London) LLP | 96.400 | 2.485 | ||||||
| 2026-01-14 | 13F/A | TABR Capital Management, LLC | 20.175 | 544 | ||||||
| 2025-09-26 | NP | PFM - Invesco Dividend Achievers ETF | 8.176 | -1,30 | 225 | 18,42 | ||||
| 2026-01-12 | 13F | AllSquare Wealth Management LLC | 0 | -100,00 | 0 | |||||
| 2026-02-13 | 13F | Baldwin Investment Management, LLC | 21.459 | -19,50 | 579 | -15,87 | ||||
| 2026-02-13 | 13F | Ubs Asset Management Americas Inc | 600 | 16 | ||||||
| 2026-01-07 | 13F | Hilltop National Bank | 1.830 | 0,00 | 49 | 4,26 | ||||
| 2026-02-17 | 13F | Capstone Investment Advisors, Llc | 7.615 | -56,98 | 205 | -55,04 | ||||
| 2026-02-06 | 13F | GPS Wealth Strategies Group, LLC | 400 | -46,74 | 11 | -47,37 | ||||
| 2026-01-30 | 13F | Activest Wealth Management | 0 | -100,00 | 0 | |||||
| 2026-01-12 | 13F | DAVENPORT & Co LLC | 343.795 | -4,78 | 9.267 | -0,82 | ||||
| 2026-02-09 | 13F | Geode Capital Management, Llc | 10.032 | 372 | ||||||
| 2026-01-23 | 13F | Farther Finance Advisors, LLC | 0 | -100,00 | 0 | |||||
| 2026-02-13 | 13F | Gen-Wealth Partners Inc | 21 | 0,00 | 1 | |||||
| 2026-01-21 | 13F | Sowell Financial Services LLC | 9.599 | 0,00 | 259 | 4,45 | ||||
| 2026-02-12 | 13F | BlackRock, Inc. | 421 | 11 | ||||||
| 2025-09-24 | NP | PMBMX - MidCap Fund (f/k/a MidCap Blend Fund) R-3 | 7.902.005 | 4,68 | 217.700 | 25,17 | ||||
| 2026-02-18 | 13F | Mackenzie Financial Corp | 48.359 | 3,47 | 1.297 | 7,72 | ||||
| 2026-02-13 | 13F | First Trust Advisors Lp | 696.254 | 5,38 | 18.778 | 10,20 | ||||
| 2026-02-14 | 13F | Adalta Capital Management LLC | 22.451 | 0,00 | 606 | 4,49 | ||||
| 2026-02-13 | 13F | Heritage Wealth Advisors | 354 | 0,00 | 10 | 0,00 | ||||
| 2026-02-17 | 13F | Susquehanna International Group, Llp | Call | 214.600 | 8,06 | 5.788 | 13,01 | |||
| 2026-02-17 | 13F | Susquehanna International Group, Llp | Put | 61.000 | -36,92 | 1.645 | -34,02 | |||
| 2026-02-09 | 13F | Hartland & Co., LLC | 5.730 | 0,02 | 155 | 4,76 | ||||
| 2026-02-11 | 13F | Capital Analysts, Inc. | 139 | 0,00 | 0 | |||||
| 2025-11-14 | 13F | Wolverine Trading, Llc | Put | 38.600 | -5,85 | 1.012 | -3,62 | |||
| 2026-02-09 | 13F | Avalon Trust Co | 2.000 | 54 | ||||||
| 2025-09-26 | NP | GYLD - Arrow Dow Jones Global Yield ETF | 6.909 | 16,23 | 190 | 39,71 | ||||
| 2026-02-17 | 13F | Blair William & Co/il | 18.657 | 0,04 | 503 | 4,79 | ||||
| 2026-02-11 | 13F | Parallel Advisors, LLC | 10 | 0,00 | 0 | |||||
| 2026-02-17 | 13F | Abel Hall, LLC | 20.000 | 0,00 | 539 | 4,66 | ||||
| 2026-02-13 | 13F | Alberta Investment Management Corp | 310.100 | 8.380 | ||||||
| 2026-02-17 | 13F | Agf Management Ltd | 936.892 | -23,40 | 25.858 | -19,37 | ||||
| 2025-11-14 | 13F | Wolverine Trading, Llc | 22.073 | -3,33 | 579 | -1,03 | ||||
| 2025-11-14 | 13F | Wolverine Trading, Llc | Call | 10.600 | -18,46 | 278 | -16,57 | |||
| 2026-02-13 | 13F | Resources Management Corp /ct/ /adv | 450 | 0,00 | 0 | |||||
| 2026-02-17 | 13F | Arosa Capital Management LP | 155.000 | 4.180 | ||||||
| 2026-02-13 | 13F | Barclays Plc | 21.499 | 31,28 | 580 | 37,20 | ||||
| 2026-02-03 | 13F | Sequoia Financial Advisors, LLC | 201.231 | 0,03 | 5.427 | 4,61 | ||||
| 2026-01-09 | 13F | Pacifica Partners Inc. | 12.095 | 0,00 | 337 | 4,98 | ||||
| 2026-02-17 | 13F | Whitebox Advisors Llc | 170.000 | 4.585 | ||||||
| 2026-02-17 | 13F | Jones Financial Companies Lllp | 4.973 | -8,63 | 134 | -4,96 | ||||
| 2026-01-27 | 13F | TD Waterhouse Canada Inc. | 833.139 | 2,32 | 22.459 | 3,72 | ||||
| 2026-02-12 | 13F | Jane Street Group, Llc | Put | 0 | -100,00 | 0 | -100,00 | |||
| 2025-11-07 | 13F | NEOS Investment Management LLC | 0 | -100,00 | 0 | |||||
| 2026-02-05 | 13F | S&co Inc | 10.000 | 0,00 | 0 | |||||
| 2025-11-13 | 13F | Promus Capital, LLC | 0 | -100,00 | 0 | |||||
| 2026-02-10 | 13F | Rothschild Investment Llc | 45 | 0,00 | 1 | 0,00 | ||||
| 2026-02-04 | 13F | Birchbrook, Inc. | 200 | 0,00 | 5 | 0,00 | ||||
| 2026-02-17 | 13F | Mirabella Financial Services Llp | 62.600 | 1.688 | ||||||
| 2026-02-13 | 13F | Peak6 Llc | Call | 305.500 | 101,52 | 8.239 | 110,77 | |||
| 2026-02-14 | 13F | Rockefeller Capital Management L.P. | 511.152 | -8,43 | 13.786 | -4,24 | ||||
| 2026-02-03 | 13F | Coston, McIsaac & Partners | 190 | 0,00 | 0 | |||||
| 2026-02-17 | 13F | Northern Trust Corp | 46.334 | -0,78 | 1.250 | 3,74 | ||||
| 2026-02-13 | 13F | Umb Bank N A/mo | 3.650 | 98 | ||||||
| 2026-02-17 | 13F | Ameriprise Financial Inc | 1.852.822 | 3,40 | 49.971 | 8,13 | ||||
| 2025-11-12 | 13F | Itau Unibanco Holding S.A. | 0 | -100,00 | 0 | |||||
| 2026-02-10 | 13F | Foundations Investment Advisors, LLC | 7.541 | 203 | ||||||
| 2026-02-17 | 13F | Citadel Advisors Llc | 430.889 | 11.621 | ||||||
| 2026-02-13 | 13F | Natixis | 18.112 | -2,26 | 488 | 2,31 | ||||
| 2026-02-17 | 13F | Citadel Advisors Llc | Call | 46.000 | -55,98 | 1.241 | -53,99 | |||
| 2026-01-09 | 13F | Silver Lake Advisory, LLC | 20.175 | 0,00 | 544 | 4,62 | ||||
| 2026-01-20 | 13F | Aspiriant, Llc | 8.561 | 0,00 | 231 | 4,55 | ||||
| 2026-01-26 | 13F | PFG Investments, LLC | 52.726 | -0,72 | 1.422 | 3,87 | ||||
| 2026-02-17 | 13F | Citadel Advisors Llc | Put | 59.300 | -40,82 | 1.599 | -38,12 | |||
| 2026-01-20 | 13F | AdvisorNet Financial, Inc | 41 | 2,50 | 1 | 0,00 | ||||
| 2025-11-07 | 13F | Atticus Wealth Management, Llc | 0 | -100,00 | 0 | -100,00 | ||||
| 2026-01-28 | 13F | Financial Perspectives, Inc | 150 | 0,00 | 4 | 33,33 | ||||
| 2026-02-13 | 13F | NewGen Asset Management Ltd | 239.500 | 0,00 | 6.474 | -11,48 | ||||
| 2026-02-12 | 13F | Bank Of Montreal /can/ | 8.394.947 | 20,29 | 226.859 | 26,15 | ||||
| 2026-02-17 | 13F | Northern Right Capital Management, L.P. | 162.398 | 111,96 | 4.380 | 121,72 | ||||
| 2026-02-20 | 13F | Sunbelt Securities, Inc. | 0 | -100,00 | 0 | |||||
| 2026-02-17 | 13F | Point72 Asset Management, L.P. | 802.104 | 114,64 | 21.681 | 125,09 | ||||
| 2026-02-17 | 13F | XTX Topco Ltd | 39.782 | 1.073 | ||||||
| 2026-02-17 | 13F | First Manhattan Co | 280.433 | -19,16 | 7.563 | -15,46 | ||||
| 2026-01-15 | 13F | Bernard Wealth Management Corp. | 5 | 0,00 | 0 | |||||
| 2026-01-22 | 13F | Apollon Wealth Management, LLC | 17.060 | 0,00 | 460 | 4,78 | ||||
| 2026-01-30 | 13F | Caldwell Securities, Inc | 318 | -50,08 | 9 | -50,00 | ||||
| 2026-02-17 | 13F | FIL Ltd | 8.975.587 | -0,65 | 242.545 | 4,16 | ||||
| 2026-01-20 | 13F | Wall Street Access Asset Management, LLC | 1.013 | 27 | 3,85 | |||||
| 2026-02-13 | 13F | Brookfield Asset Management Inc. | 81.306.719 | 9,37 | 2.192.842 | 14,38 | ||||
| 2025-11-14 | 13F | Cubist Systematic Strategies, LLC | 19.390 | 0,00 | 500 | 1,01 | ||||
| 2026-03-03 | 13F/A | Ovata Capital Management Ltd | 180.781 | 3,35 | 4.876 | 8,07 | ||||
| 2026-01-23 | 13F | Sage Investment Counsel LLC | 21.925 | 0,00 | 591 | 4,60 | ||||
| 2026-02-10 | 13F | Edgemoor Investment Advisors, Inc. | 58.741 | -17,74 | 1.584 | -13,96 | ||||
| 2026-02-13 | 13F | Peak6 Llc | Put | 0 | -100,00 | 0 | -100,00 | |||
| 2026-02-11 | 13F | Franklin Resources Inc | 7.924 | -32,50 | 214 | -29,47 | ||||
| 2026-01-21 | 13F | Indiana Trust & Investment Management CO | 6.410 | 0,00 | 173 | 4,24 | ||||
| 2026-02-19 | 13F | CI Private Wealth, LLC | 11.842 | 1,72 | 319 | 6,33 | ||||
| 2026-01-30 | 13F | Bogart Wealth, LLC | 0 | -100,00 | 0 | |||||
| 2026-02-06 | 13F | HighTower Advisors, LLC | 41.575 | -16,93 | 1.121 | -13,10 | ||||
| 2026-02-12 | 13F | Jane Street Group, Llc | 92.140 | 9,94 | 2.485 | 14,99 | ||||
| 2026-02-03 | 13F | K.J. Harrison & Partners Inc | 10.000 | 0,00 | 271 | 1,89 | ||||
| 2026-02-12 | 13F | Scotia Capital Inc. | 2.829.649 | 2,84 | 76.278 | 7,74 | ||||
| 2026-02-12 | 13F | Jane Street Group, Llc | Call | 36.700 | 45,06 | 990 | 51,69 | |||
| 2026-02-05 | 13F | Burford Brothers, Inc. | 11.472 | 0,00 | 309 | 4,75 | ||||
| 2026-02-17 | 13F | Raymond James Financial Inc | 125.417 | 10,97 | 3.382 | 16,06 | ||||
| 2026-02-11 | 13F | Everett Harris & Co /ca/ | 30.000 | 0,00 | 809 | 4,66 | ||||
| 2026-02-06 | 13F | Pnc Financial Services Group, Inc. | 5.550 | 81,97 | 150 | 91,03 | ||||
| 2026-01-30 | 13F | Us Bancorp \de\ | 950 | 0,00 | 26 | 4,17 | ||||
| 2025-11-12 | 13F | CIBC Bancorp USA Inc. | 773.321 | 19.944 | ||||||
| 2025-11-13 | 13F | NewGen Equity Long/Short Fund | 239.500 | -0,99 | 7.314 | 18,68 | ||||
| 2026-02-17 | 13F | Cetera Investment Advisers | 82.792 | -1,56 | 2.233 | 2,90 | ||||
| 2026-02-10 | 13F | Tidemark, LLC | 225 | 0,00 | 6 | 20,00 | ||||
| 2026-02-17 | 13F | American Trust Investment Advisors, LLC | 10.225 | 0,00 | 276 | 4,56 | ||||
| 2026-02-04 | 13F | Atlantic Union Bankshares Corp | 0 | -100,00 | 0 | |||||
| 2026-02-13 | 13F | MAI Capital Management | 69.912 | 0,77 | 1.886 | 5,37 | ||||
| 2026-02-10 | 13F | Walter Public Investments Inc. | 21.000 | 0,00 | 567 | 5,00 | ||||
| 2026-02-12 | 13F | Federation des caisses Desjardins du Quebec | 735.124 | 12,21 | 19.826 | 17,60 | ||||
| 2026-02-18 | 13F | Guardian Capital Lp | 11.567 | -2,39 | 313 | 2,30 | ||||
| 2026-01-14 | 13F | Moisand Fitzgerald Tamayo, LLC | 174 | 0,00 | 5 | 0,00 | ||||
| 2026-02-17 | 13F | State Of Wisconsin Investment Board | 4.867.084 | 128,02 | 131.265 | 138,45 | ||||
| 2026-01-06 | 13F | Walnut Private Equity Partners, Llc | 131.804 | 0,00 | 3.555 | 4,56 | ||||
| 2026-01-12 | 13F | Roble, Belko & Company, Inc | 13 | 0,00 | 0 | |||||
| 2026-02-10 | 13F | Bnp Paribas Arbitrage, Sa | Put | 0 | -100,00 | 0 | -100,00 | |||
| 2026-02-10 | 13F | Bnp Paribas Arbitrage, Sa | Call | 0 | -100,00 | 0 | -100,00 | |||
| 2026-02-10 | 13F | SCS Capital Management LLC | 71.736 | 0,31 | 1.935 | 4,88 | ||||
| 2026-02-10 | 13F | CIBC World Markets Inc. | 2.989.622 | 4,45 | 80.809 | 9,57 | ||||
| 2026-02-13 | 13F | Beutel, Goodman & Co Ltd. | 349.407 | -5,32 | 9 | 0,00 | ||||
| 2026-01-22 | 13F | Evermay Wealth Management Llc | 2.100 | 0,00 | 57 | 3,70 | ||||
| 2026-02-12 | 13F | BRYN MAWR TRUST Co | 675 | 0,00 | 18 | 5,88 | ||||
| 2026-02-10 | 13F | Texas Yale Capital Corp. | 49.350 | 0,00 | 1.331 | 4,56 | ||||
| 2026-02-12 | 13F | Insigneo Advisory Services, Llc | 12.775 | 0,00 | 345 | 4,56 | ||||
| 2026-01-15 | 13F | Founders Capital Management | 47 | 0,00 | 1 | 0,00 | ||||
| 2026-01-22 | 13F | JCIC Asset Management Inc. | 2.959 | 5,91 | 80 | 11,27 | ||||
| 2026-02-06 | 13F | Larson Financial Group LLC | 200 | 0,00 | 5 | 0,00 | ||||
| 2026-02-10 | 13F | Fort Sheridan Advisors Llc | 68.419 | 0,01 | 1.845 | 4,59 | ||||
| 2026-01-29 | 13F | IMC-Chicago, LLC | Put | 13.800 | 372 | |||||
| 2026-01-29 | 13F | Kestra Private Wealth Services, Llc | 7.928 | -6,66 | 214 | -2,74 | ||||
| 2026-01-29 | 13F | IMC-Chicago, LLC | Call | 20.500 | 4,06 | 553 | 8,66 | |||
| 2026-01-21 | 13F | Future Financial Wealth Managment LLC | 0 | -100,00 | 0 | |||||
| 2026-01-23 | 13F | U.S. Capital Wealth Advisors, LLC | 29.600 | 0,00 | 798 | 4,59 | ||||
| 2026-01-28 | 13F | Davis-rea Ltd. | 142.596 | -5,25 | 3.856 | -0,67 | ||||
| 2026-02-11 | 13F | J.w. Cole Advisors, Inc. | 7.783 | 208 | ||||||
| 2026-01-12 | 13F | Rempart Asset Management Inc. | 276.764 | -0,21 | 7.483 | 4,61 | ||||
| 2026-02-17 | 13F | Toronto Dominion Bank | Call | 14.100 | -6,62 | 381 | -2,06 | |||
| 2026-02-17 | 13F | Bank Of America Corp /de/ | 189.640 | -19,62 | 5.115 | -15,94 | ||||
| 2026-02-13 | 13F | BRITISH COLUMBIA INVESTMENT MANAGEMENT Corp | 121.830 | -0,47 | 3.292 | 4,38 | ||||
| 2026-02-10 | 13F | Envestnet Asset Management Inc | 0 | -100,00 | 0 | |||||
| 2026-02-13 | 13F | Pathstone Holdings, LLC | 21.124 | -19,75 | 570 | -16,08 | ||||
| 2026-02-17 | 13F | Tower Research Capital LLC (TRC) | 7.795 | 5.389,44 | 210 | 6.900,00 | ||||
| 2026-01-12 | 13F | Salem Investment Counselors Inc | 9.262 | 0,00 | 250 | 4,62 | ||||
| 2026-02-12 | 13F | Groupe la Francaise | 54.295 | 0,00 | 1.464 | 4,57 | ||||
| 2026-02-13 | 13F | Evelyn Partners Investment Management LLP | 29.898 | -11,14 | 808 | -6,92 | ||||
| 2026-02-13 | 13F | Public Sector Pension Investment Board | 13.332 | 360 | ||||||
| 2026-02-17 | 13F | Scarborough Advisors, LLC | 210 | 0,00 | 6 | 0,00 | ||||
| 2026-01-23 | 13F | Diversify Advisory Services, LLC | 27.045 | -4,70 | 763 | -14,77 | ||||
| 2026-02-10 | 13F | CIBC Asset Management Inc | 4.567.224 | -0,51 | 123.488 | 4,50 | ||||
| 2026-02-17 | 13F | PenderFund Capital Management Ltd. | 30.000 | 0,00 | 811 | 4,79 | ||||
| 2025-10-31 | 13F | Whittier Trust Co Of Nevada Inc | 0 | -100,00 | 0 | |||||
| 2026-02-17 | 13F | Cresset Asset Management, LLC | 9.431 | -5,98 | 254 | -1,55 | ||||
| 2026-02-12 | 13F | Hrt Financial Lp | 47.101 | 1 | ||||||
| 2026-03-12 | 13F | Winthrop Partners - Wny, Llc | 0 | -100,00 | 0 | |||||
| 2026-02-17 | 13F | Beacon Investment Advisors Llc | 12.062 | 0,90 | 325 | 5,52 | ||||
| 2026-02-10 | 13F | Root Financial Partners, LLC | 1.800 | 0,00 | 49 | 4,35 | ||||
| 2026-02-17 | 13F | Toronto Dominion Bank | 1.948.510 | 13,59 | 52.648 | 19,08 | ||||
| 2026-02-17 | 13F | Toronto Dominion Bank | Put | 10.100 | 206,06 | 273 | 220,00 | |||
| 2026-02-11 | 13F | Fiera Capital Corp | 16.837 | -30,82 | 455 | -27,43 | ||||
| 2026-02-12 | 13F | Triumph Capital Management | 2.120 | 0,00 | 57 | 5,56 | ||||
| 2026-02-06 | 13F | Global Retirement Partners, LLC | 2.207 | 284,49 | 60 | 321,43 | ||||
| 2026-01-26 | 13F | Cwm, Llc | 45 | 0,00 | 0 | |||||
| 2026-02-03 | 13F | McIlrath & Eck, LLC | 98 | 0,00 | 3 | 0,00 | ||||
| 2026-02-09 | 13F | Frazier Financial Advisors, LLC | 270 | 0,00 | 7 | 16,67 | ||||
| 2026-01-28 | 13F | Gold Investment Management Ltd. | 101.946 | 3,58 | 2.755 | 8,55 | ||||
| 2026-02-10 | 13F/A | Northwestern Mutual Wealth Management Co | 3.835 | 57,69 | 103 | 66,13 | ||||
| 2026-02-13 | 13F | Bank Of Nova Scotia | 1.034.001 | 0,85 | 27.940 | 5,75 | ||||
| 2026-02-11 | 13F | Picton Mahoney Asset Management | 1.678.827 | 56,81 | 45.431 | 168.159,26 | ||||
| 2026-02-13 | 13F | 1832 Asset Management L.P. | 93.743 | -68,35 | 2.528 | -66,90 | ||||
| 2026-01-30 | 13F | Keybank National Association/oh | 9.386 | 0,00 | 253 | 4,55 | ||||
| 2026-02-12 | 13F | Principal Securities, Inc. | 0 | -100,00 | 0 | -100,00 | ||||
| 2026-02-12 | 13F | Zevin Asset Management Llc | 9.483 | 0,00 | 256 | |||||
| 2026-02-17 | 13F | Fmr Llc | 37 | -100,00 | 1 | -100,00 | ||||
| 2026-02-17 | 13F | Ameriflex Group, Inc. | 500 | 66,67 | 13 | 85,71 | ||||
| 2025-11-14 | 13F | Strategic Wealth Partners, Ltd. | 21.043 | 3,48 | 543 | 4,63 | ||||
| 2026-01-21 | 13F | Flagship Harbor Advisors, Llc | 5.200 | 140 | ||||||
| 2026-02-05 | 13F | Cardinal Point Capital Management, ULC | 25.571 | -4,57 | 692 | 0,14 | ||||
| 2026-02-19 | 13F | Invesco Ltd. | 1.408.205 | -17,95 | 37.979 | -14,20 | ||||
| 2026-02-13 | 13F | Motiv8 Investments LLC | 6.512 | 0 | ||||||
| 2026-01-29 | 13F | Sanctuary Advisors, LLC | 63.723 | 6,57 | 1.719 | 11,41 |
Other Listings
| CA:BEP.UN | 41,47 CA$ |