Grundlæggende statistik
| Institutionelle aktier (lange) | 196.452.513 - 97,67% (ex 13D/G) - change of -72,60MM shares -26,98% MRQ |
| Institutionel værdi (lang) | $ 3.845.132 USD ($1000) |
Institutionelt ejerskab og aktionærer
Bath & Body Works, Inc. (US:BBWI) har 456 institutionelle ejere og aktionærer, der har indsendt 13D/G- eller 13F-formularer til Securities Exchange Commission (SEC). Disse institutioner har i alt 196,452,513 aktier. Største aktionærer omfatter Vanguard Group Inc, BlackRock, Inc., Fmr Llc, Aqr Capital Management Llc, State Street Corp, D. E. Shaw & Co., Inc., American Century Companies Inc, Alliancebernstein L.p., Geode Capital Management, Llc, and Canada Pension Plan Investment Board .
Bath & Body Works, Inc. (NYSE:BBWI) institutionel ejerskabsstruktur viser aktuelle positioner i virksomheden efter institutioner og fonde, samt seneste ændringer i positionsstørrelse. Større aktionærer kan omfatte individuelle investorer, investeringsforeninger, hedgefonde eller institutioner. Skema 13D angiver, at investoren besidder (eller besidder) mere end 5 % af virksomheden og har til hensigt (eller har til hensigt at) aktivt at forfølge en ændring i forretningsstrategi. Skema 13G indikerer en passiv investering på over 5%.
The share price as of April 10, 2026 is 18,11 / share. Previously, on April 11, 2025, the share price was 26,64 / share. This represents a decline of 32,02% over that period.

Fondens stemningsscore
Fund Sentiment Score (fka Ownership Accumulation Score) finder de aktier, der bliver mest købt af fonde. Det er resultatet af en sofistikeret, multi-faktor kvantitativ model, der identificerer virksomheder med de højeste niveauer af institutionel akkumulering. Scoringsmodellen bruger en kombination af den samlede stigning i oplyste ejere, ændringerne i porteføljeallokeringer i disse ejere og andre målinger. Tallet går fra 0 til 100, hvor højere tal indikerer et højere niveau af akkumulering for sine jævnaldrende, og 50 er gennemsnittet.
Opdateringsfrekvens: Dagligt
Se Ownership Explorer, som giver en liste over højest rangerende virksomheder.
AI+ Ask Fintel’s AI assistant about Bath & Body Works, Inc..
Select a question to share a public post with an AI-crafted answer.
Thinking of good questions…
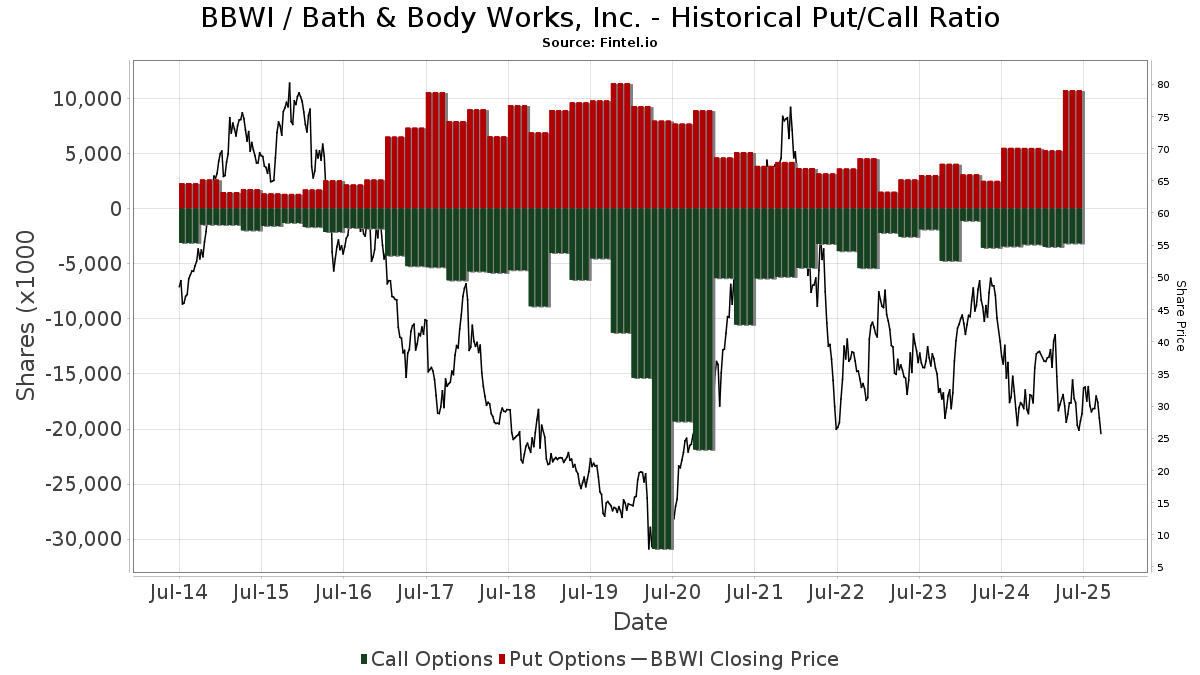
Institutionel Put/Call-forhold
Ud over at indberette standardaktie- og gældsudstedelser skal institutter med mere end 100 mill. aktiver under forvaltning også oplyse deres put- og call-optionsbeholdninger. Da salgsoptioner generelt indikerer negativ stemning, og købsoptioner indikerer positiv stemning, kan vi få en fornemmelse af den overordnede institutionelle stemning ved at plotte forholdet mellem put og kald. Diagrammet til højre viser det historiske put/call-forhold for dette instrument.
Brug af Put/Call Ratio som en indikator for investorernes stemning overvinder en af de vigtigste mangler ved at bruge totalt institutionelt ejerskab, som er, at en betydelig mængde af aktiver under forvaltning investeres passivt for at spore indekser. Passivt forvaltede fonde køber typisk ikke optioner, så indikatoren for put/call-forholdet følger mere nøje følelsen af aktivt forvaltede fonde.
13D/G-arkivering
Vi præsenterer 13D/G ansøgninger separat fra 13F ansøgninger på grund af den forskellige behandling af SEC. 13D/G-ansøgninger kan indgives af grupper af investorer (med én ledende), hvorimod 13F-ansøgninger ikke kan. Dette resulterer i situationer, hvor en investor kan indsende en 13D/G, der rapporterer én værdi for de samlede aktier (der repræsenterer alle de aktier, der ejes af investorgruppen), men derefter indsender en 13F, der rapporterer en anden værdi for de samlede aktier (der udelukkende repræsenterer deres egne) ejendomsret). Det betyder, at aktieejerskab af 13D/G-arkiver og 13F-arkiveringer ofte ikke er direkte sammenlignelige, så vi præsenterer dem separat.
Bemærk: Fra den 16. maj 2021 viser vi ikke længere ejere, der ikke har indsendt en 13D/G inden for det seneste år. Tidligere viste vi den fulde historie af 13D/G-arkiver. Generelt skal enheder, der er forpligtet til at indgive 13D/G-ansøgninger, indgive mindst årligt, før de indsender en afsluttende ansøgning. Dog forlader fonde nogle gange positioner uden at indsende en afsluttende ansøgning (dvs. de afvikler), så visning af den fulde historie resulterede nogle gange i forvirring om det nuværende ejerskab. For at undgå forvirring viser vi nu kun 'aktuelle' ejere - det vil sige - ejere, der har anmeldt inden for det seneste år.
Upgrade to unlock premium data.
| Fil dato | Form | Investor | Forrige Aktier |
Seneste Aktier |
Δ Aktier (Procent) |
Ejendomsret (Procent) |
Δ Ejerskab (Procent) |
|
|---|---|---|---|---|---|---|---|---|
| 2026-02-13 | AQR CAPITAL MANAGEMENT LLC | 11,445,928 | 5.59 | |||||
| 2025-11-05 | FMR LLC | 12,412,497 | 17,176,068 | 38.38 | 8.30 | 40.68 | ||
| 2025-10-31 | VICTORY CAPITAL MANAGEMENT INC | 12,773,211 | 8,405,430 | -34.19 | 4.08 | -32.45 | ||
| 2025-08-14 | T. Rowe Price Investment Management, Inc. | 11,016,767 | 1,202,931 | -89.08 | 0.60 | -88.24 | ||
| 2025-04-17 | BlackRock, Inc. | 29,143,727 | 18,850,697 | -35.32 | 8.80 | -33.83 |
13F og NPORT arkivering
Detaljer om 13F-arkivering er gratis. Detaljer om NP-ansøgninger kræver et premium-medlemskab. Grønne rækker angiver nye positioner. Røde rækker angiver lukkede positioner. Klik på linket ikon for at se den fulde transaktionshistorik.
Opgrader
for at låse premium-data op og eksportere til Excel ![]() .
.
| Fil dato | Kilde | Investor | Type | Gennemsnitlig pris (Øst) |
Aktier | Δ Aktier (%) |
Rapporteret Værdi ($1000) |
Δ Værdi (%) |
Port Alloc (%) |
|
|---|---|---|---|---|---|---|---|---|---|---|
| 2026-01-30 | 13F | North Star Investment Management Corp. | 1.400 | 0,00 | 28 | -22,22 | ||||
| 2026-02-02 | 13F | Cornerstone Planning Group LLC | 0 | -100,00 | 0 | |||||
| 2026-02-17 | 13F | Worldquant Millennium Advisors Llc | 86.283 | -62,69 | 1.733 | -70,92 | ||||
| 2025-11-14 | 13F | Oxford Asset Management Llp | 0 | -100,00 | 0 | -100,00 | ||||
| 2026-02-03 | 13F | Bronte Capital Management Pty Ltd. | 254.611 | 121,78 | 5.113 | 54,72 | ||||
| 2025-11-14 | 13F | Mubadala Investment Co PJSC | 0 | -100,00 | 0 | -100,00 | ||||
| 2026-02-17 | 13F | Hotchkis & Wiley Capital Management Llc | 244.780 | 12,79 | 4.915 | -12,08 | ||||
| 2026-02-17 | 13F | Shay Capital LLC | Call | 73.000 | -84,57 | 1.466 | -87,98 | |||
| 2026-02-19 | 13F | Invesco Ltd. | 652.991 | 43,62 | 13.112 | 11,95 | ||||
| 2026-02-09 | 13F | Shufro Rose & Co Llc | 36.400 | 171,64 | 731 | 79,80 | ||||
| 2026-02-12 | 13F | Distillate Capital Partners LLC | 0 | -100,00 | 0 | |||||
| 2026-02-10 | 13F | Commonwealth Of Pennsylvania Public School Empls Retrmt Sys | 51.597 | -5,00 | 1.036 | -25,95 | ||||
| 2026-02-17 | 13F | Millennium Management Llc | 2.837.896 | 64,18 | 56.985 | 27,98 | ||||
| 2026-01-20 | 13F | Cromwell Holdings LLC | 400 | -20,00 | 8 | -33,33 | ||||
| 2026-02-11 | 13F | Fox Run Management, L.l.c. | 42.326 | 42,70 | 850 | 11,13 | ||||
| 2026-01-23 | 13F | Robeco Institutional Asset Management B.V. | 0 | -100,00 | 0 | |||||
| 2026-02-17 | 13F | Millennium Management Llc | Put | 138.100 | 335,65 | 2.773 | 239,83 | |||
| 2026-02-10 | 13F | Axq Capital, Lp | 75.675 | 1.520 | ||||||
| 2026-02-17 | 13F | Millennium Management Llc | Call | 187.800 | 435,04 | 3.771 | 317,15 | |||
| 2026-02-12 | 13F | Xponance, Inc. | 19.538 | -18,66 | 392 | -36,57 | ||||
| 2026-02-13 | 13F | Nicolet Advisory Services, Llc | 10.009 | -11,24 | 226 | -22,15 | ||||
| 2026-01-05 | 13F | Chesapeake Asset Management Llc | 0 | -100,00 | 0 | |||||
| 2026-01-29 | 13F | UBS Group AG | Call | 42.000 | 843 | |||||
| 2026-01-29 | 13F | UBS Group AG | 451.636 | -68,73 | 9.069 | -75,63 | ||||
| 2026-02-10 | 13F | Envestnet Asset Management Inc | 110.068 | -31,08 | 2.210 | -46,27 | ||||
| 2026-01-20 | 13F | AdvisorNet Financial, Inc | 2 | 0 | ||||||
| 2026-01-29 | 13F | Vanguard Group Inc | 26.030.589 | -1,89 | 522.694 | -23,53 | ||||
| 2026-02-11 | 13F | SOUTH STATE Corp | 5 | 0,00 | 0 | |||||
| 2026-02-13 | 13F | Korea Investment CORP | 0 | -100,00 | 0 | |||||
| 2026-02-13 | 13F | Pathstone Holdings, LLC | 38.859 | 4,78 | 780 | -18,32 | ||||
| 2026-04-06 | 13F | GAMMA Investing LLC | 3.590 | 337,80 | 67 | 318,75 | ||||
| 2026-01-23 | 13F | Sumitomo Mitsui Trust Holdings, Inc. | 0 | -100,00 | 0 | |||||
| 2026-02-11 | 13F | Buckingham Strategic Partners | 35.379 | 80,33 | 710 | 47,00 | ||||
| 2026-02-17 | 13F | State Of Wisconsin Investment Board | 93.046 | -33,89 | 1.868 | -48,47 | ||||
| 2026-04-06 | 13F | Highline Wealth Partners Llc | 141 | 3 | ||||||
| 2026-02-17 | 13F | Cetera Investment Advisers | 46.871 | 70,81 | 941 | 33,29 | ||||
| 2026-02-17 | 13F | Saba Capital Management, L.P. | 12.758 | 256 | ||||||
| 2026-02-09 | 13F | Frazier Financial Advisors, LLC | 48.728 | 0,00 | 978 | -22,07 | ||||
| 2026-02-13 | 13F | Ontario Teachers Pension Plan Board | 0 | -100,00 | 0 | |||||
| 2026-02-20 | 13F | Sunbelt Securities, Inc. | 130 | 136,36 | 3 | 100,00 | ||||
| 2025-11-07 | 13F | Beacon Capital Management, LLC | 0 | -100,00 | 0 | |||||
| 2026-01-29 | 13F | Teachers Retirement System Of The State Of Kentucky | 63.846 | 0,00 | 1 | 0,00 | ||||
| 2026-02-13 | 13F | Ieq Capital, Llc | 496.624 | 37,40 | 9.972 | 7,11 | ||||
| 2026-02-13 | 13F | Entropy Technologies, LP | 19.343 | 388 | ||||||
| 2026-02-17 | 13F | Dark Forest Capital Management Lp | 28.231 | -72,23 | 567 | -78,38 | ||||
| 2026-01-20 | 13F | Trust Co Of Toledo Na /oh/ | 14.902 | -0,43 | 299 | -22,34 | ||||
| 2025-11-13 | 13F | Twin Tree Management, LP | Call | 0 | -100,00 | 0 | -100,00 | |||
| 2026-01-22 | 13F | Financial Consulate, Inc | 324 | 0,93 | 7 | -25,00 | ||||
| 2026-02-17 | 13F | Janus Henderson Group Plc | 762.911 | -48,94 | 15.319 | -60,20 | ||||
| 2026-04-07 | 13F | CoreCap Advisors, LLC | 152 | -22,84 | 3 | -33,33 | ||||
| 2025-11-12 | 13F | 111 Capital | 0 | -100,00 | 0 | |||||
| 2026-01-27 | 13F | Fiduciary Advisors, Inc. | 10 | 0 | ||||||
| 2026-02-09 | 13F | Atlantic Trust, LLC | 0 | -100,00 | 0 | |||||
| 2026-02-17 | 13F | Freestone Grove Partners LP | 37.644 | 19,10 | 756 | -7,25 | ||||
| 2025-10-31 | 13F | CIBC Asset Management Inc | 0 | -100,00 | 0 | |||||
| 2026-01-23 | 13F | TFC Financial Management | 28 | 1 | ||||||
| 2026-02-13 | 13F | Prudential Financial Inc | 181.983 | -5,73 | 3.674 | -26,11 | ||||
| 2026-02-17 | 13F | Sherbrooke Park Advisers Llc | 0 | -100,00 | 0 | |||||
| 2025-11-14 | 13F | Bayesian Capital Management, LP | 0 | -100,00 | 0 | |||||
| 2026-01-14 | 13F | Pallas Capital Advisors LLC | 43.519 | 108,26 | 874 | 62,27 | ||||
| 2026-02-10 | 13F | Rothschild Investment Llc | 9.643 | 106,05 | 194 | 60,83 | ||||
| 2026-02-17 | 13F | Two Sigma Investments, Lp | 848.639 | -41,20 | 17.041 | -54,17 | ||||
| 2026-02-05 | 13F | Atria Investments Llc | 13.049 | -33,68 | 262 | -48,22 | ||||
| 2025-11-07 | 13F | M&G Plc | 0 | -100,00 | 0 | -100,00 | ||||
| 2025-11-13 | 13F | Eisler Capital Management Ltd. | Put | 140.000 | 3.655 | |||||
| 2026-01-09 | 13F | Diversified Trust Co | 0 | -100,00 | 0 | |||||
| 2026-02-06 | 13F | Tortoise Investment Management, LLC | 13.844 | -6,10 | 278 | -26,91 | ||||
| 2025-11-13 | 13F | Glenmede Investment Management, LP | 0 | -100,00 | 0 | -100,00 | ||||
| 2026-01-27 | 13F | Bayforest Capital Ltd | 13.194 | 265 | ||||||
| 2026-02-03 | 13F | Mma Asset Management Llc | 0 | -100,00 | 0 | |||||
| 2026-02-17 | 13F | Wellington Management Group Llp | 0 | -100,00 | 0 | |||||
| 2026-02-10 | 13F | Root Financial Partners, LLC | 70 | -72,11 | 1 | -83,33 | ||||
| 2026-02-11 | 13F | O'shaughnessy Asset Management, Llc | 16.317 | -91,04 | 328 | -93,03 | ||||
| 2026-02-04 | 13F | Versor Investments LP | 60.000 | 45,99 | 1.205 | 13,80 | ||||
| 2026-02-02 | 13F | Oppenheimer Asset Management Inc. | 0 | -100,00 | 0 | |||||
| 2025-11-14 | 13F | Point72 (DIFC) Ltd | 41.678 | 799,59 | 1.074 | 677,54 | ||||
| 2026-02-17 | 13F | Alliancebernstein L.p. | 5.024.210 | -14,28 | 100.886 | -33,18 | ||||
| 2025-11-14 | 13F | WealthTrak Capital Management LLC | 0 | -100,00 | 0 | |||||
| 2026-02-17 | 13F | Wealth Watch Advisors, INC | 0 | -100,00 | 0 | |||||
| 2026-02-17 | 13F | Caption Management, LLC | Put | 0 | -100,00 | 0 | ||||
| 2026-02-17 | 13F | Governors Lane LP | Call | 100.000 | 0,00 | 2.008 | -22,05 | |||
| 2026-02-17 | 13F | Creative Planning | 64.477 | 43,60 | 1.295 | 11,94 | ||||
| 2026-02-17 | 13F | Advisory Services Network, LLC | 0 | -100,00 | 0 | |||||
| 2026-02-17 | 13F | Snowden Capital Advisors LLC | 0 | -100,00 | 0 | |||||
| 2026-02-13 | 13F | Charles Schwab Investment Management Inc | 1.564.503 | -0,05 | 31.415 | -22,09 | ||||
| 2026-02-04 | 13F | Plato Investment Management Ltd | 0 | -100,00 | 0 | |||||
| 2025-11-07 | 13F | HighTower Advisors, LLC | 0 | -100,00 | 0 | |||||
| 2025-11-13 | 13F | Bank Of Montreal /can/ | Put | 0 | -100,00 | 0 | -100,00 | |||
| 2026-02-13 | 13F | Integrated Wealth Concepts LLC | 21.259 | 97,06 | 427 | 53,79 | ||||
| 2026-02-10 | 13F | Savant Capital, LLC | 0 | -100,00 | 0 | |||||
| 2026-02-13 | 13F | Bridgewater Associates, LP | 285.834 | -8,18 | 5.740 | -28,43 | ||||
| 2026-02-10 | 13F | Lido Advisors, LLC | 12.223 | -5,72 | 291 | -12,87 | ||||
| 2026-02-13 | 13F | Golden State Wealth Management, LLC | 480 | 0,42 | 10 | -25,00 | ||||
| 2025-10-21 | 13F | Fifth Third Wealth Advisors LLC | 0 | -100,00 | 0 | -100,00 | ||||
| 2026-02-13 | 13F | OMERS ADMINISTRATION Corp | 0 | -100,00 | 0 | |||||
| 2026-01-30 | 13F | Wealthfront Advisers Llc | 65.192 | -8,76 | 1.309 | -28,86 | ||||
| 2026-02-17 | 13F | Adage Capital Partners Gp, L.l.c. | 150.000 | 50,00 | 3.012 | 16,93 | ||||
| 2026-02-03 | 13F/A | Bank Of America Corp /de/ | Put | 0 | -100,00 | 0 | -100,00 | |||
| 2026-04-02 | 13F | Hilltop National Bank | 2.067 | 0,00 | 39 | -7,32 | ||||
| 2026-02-13 | 13F | Mariner, LLC | 171.741 | 175,65 | 3.449 | 114,96 | ||||
| 2026-02-03 | 13F | Maxi Investments CY Ltd | 0 | -100,00 | 0 | |||||
| 2026-01-28 | 13F | waypoint wealth counsel | 11.524 | 231 | ||||||
| 2025-10-31 | 13F | Y-Intercept (Hong Kong) Ltd | 0 | -100,00 | 0 | |||||
| 2026-02-04 | 13F | Dogwood Wealth Management LLC | 240 | 1,27 | 5 | -33,33 | ||||
| 2026-02-17 | 13F | XTX Topco Ltd | 80.548 | 65,17 | 1.617 | 28,74 | ||||
| 2026-01-27 | 13F | First Horizon Corp | 2.218 | 96,28 | 45 | 51,72 | ||||
| 2026-02-03 | 13F | SBI Securities Co., Ltd. | 674 | 3,22 | 14 | -18,75 | ||||
| 2026-02-13 | 13F | Atika Capital Management LLC | 225.000 | 4.518 | ||||||
| 2026-02-12 | 13F | Principal Securities, Inc. | 0 | -100,00 | 0 | -100,00 | ||||
| 2026-02-17 | 13F | Prelude Capital Management, Llc | 0 | -100,00 | 0 | |||||
| 2026-01-14 | 13F | Jfs Wealth Advisors, Llc | 57 | -10,94 | 1 | 0,00 | ||||
| 2026-01-30 | 13F | State of New Jersey Common Pension Fund D | 102.221 | 41,38 | 2.053 | 10,20 | ||||
| 2026-02-05 | 13F | Thrivent Financial For Lutherans | 111.824 | -4,70 | 2 | -33,33 | ||||
| 2026-02-10 | 13F | Ritter Daniher Financial Advisory LLC / DE | 0 | -100,00 | 0 | |||||
| 2026-02-05 | 13F | Bessemer Group Inc | 1.953 | -94,59 | 0 | |||||
| 2026-02-17 | 13F | Caisse De Depot Et Placement Du Quebec | 0 | -100,00 | 0 | |||||
| 2026-03-12 | 13F/A | Peak6 Llc | 0 | -100,00 | 0 | -100,00 | ||||
| 2026-01-27 | 13F | Brighton Jones Llc | 0 | -100,00 | 0 | |||||
| 2026-02-06 | 13F | Newport Trust Co | 276.594 | -3,51 | 5.554 | -24,78 | ||||
| 2026-04-08 | 13F | DiNuzzo Private Wealth, Inc. | 29 | 222,22 | 1 | |||||
| 2026-02-17 | 13F | Boothbay Fund Management, Llc | 23.627 | 474 | ||||||
| 2026-02-17 | 13F | Quantinno Capital Management LP | 151.543 | -39,75 | 3.043 | -53,03 | ||||
| 2026-02-17 | 13F | Wiley Bros.-aintree Capital, Llc | 16.432 | -12,66 | 322 | -33,68 | ||||
| 2025-11-14 | 13F | Wolverine Trading, Llc | 38.514 | 1.004 | ||||||
| 2026-02-12 | 13F | Paradigm Capital Management Inc/ny | 200.000 | 4.016 | ||||||
| 2025-11-14 | 13F | Wolverine Trading, Llc | Call | 97.000 | 2.528 | |||||
| 2026-02-10 | 13F | Mutual Of America Capital Management Llc | 85.810 | -12,20 | 1.723 | -31,55 | ||||
| 2025-11-14 | 13F | Wolverine Trading, Llc | Put | 254.700 | 6.637 | |||||
| 2026-01-29 | 13F | Northern Oak Wealth Management Inc | 16.520 | -3,35 | 332 | -24,77 | ||||
| 2026-01-12 | 13F | Rialto Wealth Management, LLC | 28 | -3,45 | 1 | |||||
| 2026-01-15 | 13F | Hengehold Capital Management Llc | 32.300 | 0,00 | 649 | -22,12 | ||||
| 2026-01-16 | 13F | FNY Investment Advisers, LLC | 100 | -27,01 | 0 | |||||
| 2026-02-13 | 13F | Parkside Financial Bank & Trust | 474 | -72,65 | 10 | -79,55 | ||||
| 2026-02-12 | 13F | BRYN MAWR TRUST Co | 0 | -100,00 | 0 | |||||
| 2026-02-13 | 13F | Morgan Stanley | 2.478.682 | -37,84 | 49.772 | -51,55 | ||||
| 2026-02-02 | 13F | Horizon Investments, LLC | 32.057 | 644 | ||||||
| 2026-02-12 | 13F | Dimensional Fund Advisors Lp | 2.636.642 | 2,43 | 52.945 | -20,16 | ||||
| 2026-02-10 | 13F | Jupiter Asset Management Ltd | 951.240 | -74,39 | 19.101 | -80,04 | ||||
| 2026-02-12 | 13F | Brown Brothers Harriman & Co | 175 | -20,45 | 4 | -40,00 | ||||
| 2025-11-13 | 13F | Eisler Capital Management Ltd. | 0 | -100,00 | 0 | -100,00 | ||||
| 2026-02-17 | 13F | Clear Street Markets Llc | 0 | -100,00 | 0 | |||||
| 2025-11-13 | 13F | Eisler Capital Management Ltd. | Call | 0 | -100,00 | 0 | -100,00 | |||
| 2026-02-06 | 13F | Lsv Asset Management | 153.566 | 0,00 | 3 | 0,00 | ||||
| 2026-02-11 | 13F | Group One Trading, L.p. | 0 | -100,00 | 0 | -100,00 | ||||
| 2026-02-17 | 13F | California State Teachers Retirement System | 218.044 | 15,25 | 4.378 | -10,16 | ||||
| 2026-02-04 | 13F | Virginia Retirement Systems Et Al | 22.550 | -52,22 | 453 | -62,80 | ||||
| 2026-02-05 | 13F | Barr E S & Co | 18.000 | 361 | ||||||
| 2026-02-05 | 13F | Northwestern Mutual Investment Management Company, Llc | 46.133 | -2,19 | 926 | -23,79 | ||||
| 2026-02-06 | 13F | IFP Advisors, Inc | 5.686 | -83,54 | 114 | -87,18 | ||||
| 2026-01-26 | 13F | Mirae Asset Global Investments Co., Ltd. | 2.224 | 1,65 | 45 | -21,43 | ||||
| 2026-02-17 | 13F | Numerai GP LLC | 22.009 | 442 | ||||||
| 2026-01-26 | 13F | Cwm, Llc | 225.110 | 123,78 | 5 | 100,00 | ||||
| 2026-02-12 | 13F | Swiss National Bank | 406.600 | 4,42 | 8.165 | -18,60 | ||||
| 2026-02-13 | 13F | Transamerica Financial Advisors, Inc. | 15 | 0 | ||||||
| 2026-02-03 | 13F | Western Standard LLC | 0 | -100,00 | 0 | -100,00 | ||||
| 2025-11-07 | 13F | Atticus Wealth Management, Llc | 0 | -100,00 | 0 | -100,00 | ||||
| 2026-02-17 | 13F | Qube Research & Technologies Ltd | 959.451 | 1.314,54 | 19.266 | 1.002,75 | ||||
| 2026-01-08 | 13F | True Wealth Design, LLC | 1.160 | 106,77 | 23 | 64,29 | ||||
| 2026-02-13 | 13F | Atlas Capital Advisors Llc | 7.745 | -5,92 | 156 | -36,99 | ||||
| 2026-02-11 | 13F | Allianz Asset Management GmbH | 632.488 | 139,92 | 12.700 | 87,01 | ||||
| 2026-02-17 | 13F | Tower Research Capital LLC (TRC) | 7.512 | -16,40 | 151 | -35,06 | ||||
| 2026-02-02 | 13F | Danske Bank A/s | 1.500 | 0,00 | 30 | -21,05 | ||||
| 2025-11-13 | 13F | CLARET ASSET MANAGEMENT Corp | 0 | -100,00 | 0 | |||||
| 2026-01-26 | 13F | JNBA Financial Advisors | 1.000 | 0,00 | 20 | -20,00 | ||||
| 2026-02-17 | 13F/A | North Capital, Inc. | 0 | -100,00 | 0 | |||||
| 2026-02-17 | 13F | Caption Management, LLC | 0 | -100,00 | 0 | |||||
| 2026-02-10 | 13F | Natixis Advisors, L.p. | 378.827 | 18,57 | 8 | -12,50 | ||||
| 2026-02-02 | 13F | Principal Financial Group Inc | 443.536 | -5,69 | 8.906 | -26,48 | ||||
| 2026-01-14 | 13F | Wedge Capital Management L L P/nc | 214.362 | 49,89 | 4.304 | 16,83 | ||||
| 2026-02-17 | 13F | SageView Advisory Group, LLC | 601 | 12 | ||||||
| 2026-02-05 | 13F | Chase Investment Counsel Corp | 80.000 | 2 | ||||||
| 2026-02-13 | 13F | Maverick Capital Ltd | 0 | -100,00 | 0 | |||||
| 2026-02-17 | 13F | Public Employees Retirement System Of Ohio | 62.028 | -6,74 | 1.246 | -27,32 | ||||
| 2026-01-30 | 13F | American Capital Advisory, LLC | 1.306 | 0,00 | 26 | -21,21 | ||||
| 2025-10-30 | 13F | Twin Peaks Wealth Advisors, LLC | 0 | -100,00 | 0 | |||||
| 2026-02-13 | 13F | SRS Capital Advisors, Inc. | 2.038 | -98,34 | 41 | -98,73 | ||||
| 2025-11-14 | 13F | Graham Capital Management, L.P. | 0 | -100,00 | 0 | -100,00 | ||||
| 2026-02-12 | 13F | Cloud Capital Management, LLC | 0 | -100,00 | 0 | |||||
| 2026-03-12 | 13F/A | Peak6 Llc | Call | 3.600 | -2,70 | 72 | -24,21 | |||
| 2026-02-17 | 13F | Price T Rowe Associates Inc /md/ | 212.158 | -79,88 | 4 | -85,19 | ||||
| 2026-03-12 | 13F/A | Peak6 Llc | Put | 124.000 | 29,84 | 2.490 | 1,18 | |||
| 2026-04-08 | 13F | Arlington Trust Co LLC | 36 | 1 | ||||||
| 2026-02-13 | 13F | Fieldview Capital Management, LLC | 10.356 | -22,01 | 208 | -39,47 | ||||
| 2026-02-17 | 13F | Royal Bank Of Canada | Put | 3.000 | 60 | |||||
| 2026-02-17 | 13F | Royal Bank Of Canada | 20.476 | -69,70 | 410 | -76,45 | ||||
| 2026-01-12 | 13F | CVA Family Office, LLC | 22 | 0 | ||||||
| 2026-01-13 | 13F | Mather Group, Llc. | 0 | -100,00 | 0 | |||||
| 2026-02-03 | 13F | Farmers & Merchants Investments Inc | 190 | 0,00 | 4 | -25,00 | ||||
| 2026-02-13 | 13F | Panagora Asset Management Inc | 709.284 | -10,27 | 14.242 | -30,06 | ||||
| 2026-02-02 | 13F | Baypointe Partners LLC | 0 | -100,00 | 0 | |||||
| 2026-02-13 | 13F | BNP Paribas Asset Management Holding S.A. | 3.197 | 47,87 | 0 | |||||
| 2026-01-28 | 13F | Arizona State Retirement System | 57.666 | -3,06 | 1.158 | -24,48 | ||||
| 2026-02-11 | 13F | Erste Asset Management GmbH | 140.205 | 2.863 | ||||||
| 2026-02-13 | 13F | Treasurer of the State of North Carolina | 86.348 | -9,79 | 2 | -50,00 | ||||
| 2026-02-09 | 13F | Hantz Financial Services, Inc. | 3.406 | -53,85 | 0 | |||||
| 2026-02-13 | 13F | Kennedy Capital Management, Inc. | 0 | -100,00 | 0 | |||||
| 2026-02-24 | 13F | Bell Investment Advisors, Inc | 134 | 644,44 | 3 | |||||
| 2026-02-13 | 13F | Verition Fund Management LLC | 310.448 | -46,51 | 6.234 | -58,31 | ||||
| 2026-01-09 | 13F | Zrc Wealth Management, Llc | 0 | 0 | ||||||
| 2026-02-13 | 13F | Neo Ivy Capital Management | 0 | -100,00 | 0 | |||||
| 2026-02-13 | 13F | Headlands Technologies LLC | 21.236 | 426 | ||||||
| 2026-02-17 | 13F | Utah Retirement Systems | 11.254 | 0,00 | 226 | -22,15 | ||||
| 2025-11-14 | 13F | Parallax Volatility Advisers, L.P. | Put | 0 | -100,00 | 0 | -100,00 | |||
| 2026-01-26 | 13F | Private Trust Co Na | 203 | 69,17 | 4 | 33,33 | ||||
| 2026-02-13 | 13F | Alberta Investment Management Corp | 56.500 | 1.135 | ||||||
| 2026-02-13 | 13F | Victory Capital Management Inc | 974.711 | -88,55 | 19.572 | -91,07 | ||||
| 2026-02-17 | 13F | Capstone Investment Advisors, Llc | 43.017 | -12,03 | 864 | -31,45 | ||||
| 2026-01-27 | 13F | Fiscal Wisdom Wealth Management, LLC | 10.415 | -6,59 | 209 | -27,93 | ||||
| 2026-02-12 | 13F | New York State Common Retirement Fund | 630.209 | -0,60 | 12.655 | -22,52 | ||||
| 2026-02-13 | 13F | Sterling Capital Management LLC | 12.191 | -46,79 | 245 | -58,64 | ||||
| 2026-02-12 | 13F | Jane Street Group, Llc | 2.873.844 | 850,90 | 57.707 | 641,25 | ||||
| 2026-02-12 | 13F | Steward Partners Investment Advisory, Llc | 3.523 | -1,32 | 71 | -23,08 | ||||
| 2026-02-13 | 13F | Colony Group, LLC | 49.403 | 103,30 | 992 | 56,22 | ||||
| 2026-02-13 | 13F | Wells Fargo & Company/mn | 274.826 | -11,65 | 5.519 | -31,13 | ||||
| 2026-01-21 | 13F | Capital Advisors, Ltd. LLC | 1.074 | 0,00 | 0 | |||||
| 2026-02-12 | 13F | Jane Street Group, Llc | Call | 479.900 | 65,48 | 9.636 | 29,00 | |||
| 2026-01-30 | 13F | Us Bancorp \de\ | 3.406 | 21,86 | 68 | -5,56 | ||||
| 2026-02-11 | 13F | Syon Capital Llc | 0 | -100,00 | 0 | -100,00 | ||||
| 2026-02-12 | 13F | Jane Street Group, Llc | Put | 281.600 | -62,07 | 5.655 | -70,44 | |||
| 2026-01-29 | 13F | St Germain D J Co Inc | 65 | 0,00 | 1 | 0,00 | ||||
| 2026-01-22 | 13F | Harwood Advisory Group, LLC | 18 | 0,00 | 0 | |||||
| 2026-02-05 | 13F | Allworth Financial LP | 12.210 | 25,63 | 245 | -2,00 | ||||
| 2025-11-14 | 13F | Fund 1 Investments, LLC | Call | 0 | -100,00 | 0 | -100,00 | |||
| 2026-01-15 | 13F | Fortitude Family Office, LLC | 46 | -37,84 | 1 | -100,00 | ||||
| 2025-11-14 | 13F | Hughes Financial Services, LLC | 0 | -100,00 | 0 | |||||
| 2026-01-30 | 13F | ARGA Investment Management, LP | 619.722 | -0,22 | 12.444 | -22,22 | ||||
| 2026-02-12 | 13F | Wealthspire Advisors, LLC | 0 | -100,00 | 0 | |||||
| 2025-11-10 | 13F | Citigroup Inc | Put | 0 | -100,00 | 0 | -100,00 | |||
| 2026-02-06 | 13F | ProShare Advisors LLC | 0 | -100,00 | 0 | |||||
| 2026-02-10 | 13F | Horizon Bancorp Inc /in/ | 5.504 | -7,42 | 0 | |||||
| 2026-02-12 | 13F | Rossby Financial, LCC | 12 | 0 | ||||||
| 2026-04-08 | 13F | Grove Bank & Trust | 51 | 1 | ||||||
| 2026-02-17 | 13F | Tudor Investment Corp Et Al | Put | 368.800 | -50,07 | 7.406 | -61,08 | |||
| 2026-02-12 | 13F | Ci Investments Inc. | 0 | -100,00 | 0 | |||||
| 2026-02-17 | 13F | SummitTX Capital, L.P. | 0 | -100,00 | 0 | |||||
| 2026-02-17 | 13F | Tudor Investment Corp Et Al | Call | 128.800 | -39,95 | 2.586 | -53,19 | |||
| 2026-02-17 | 13F | Aqr Capital Management Llc | 11.445.928 | 132,55 | 229.834 | 81,27 | ||||
| 2026-02-17 | 13F | Tudor Investment Corp Et Al | 371.341 | 7.457 | ||||||
| 2026-02-03 | 13F | Sequoia Financial Advisors, LLC | 15.690 | 36,70 | 315 | 6,78 | ||||
| 2026-02-10 | 13F | Hillsdale Investment Management Inc. | 120.200 | 0,17 | 2.414 | -21,93 | ||||
| 2026-02-12 | 13F | Campbell & CO Investment Adviser LLC | 20.217 | 406 | ||||||
| 2026-02-05 | 13F | HFM Investment Advisors, LLC | 0 | -100,00 | 0 | |||||
| 2026-01-28 | 13F | WPG Advisers, LLC | 232 | -15,33 | 5 | -42,86 | ||||
| 2026-02-13 | 13F | Umb Bank N A/mo | 1.344 | -37,34 | 27 | -52,73 | ||||
| 2026-02-17 | 13F | Atlantic Investment Management Inc | 0 | -100,00 | 0 | |||||
| 2026-02-13 | 13F | Segall Bryant & Hamill, Llc | 277.989 | -32,52 | 5.582 | -47,39 | ||||
| 2026-01-28 | 13F | DekaBank Deutsche Girozentrale | 32.632 | 0,00 | 1 | |||||
| 2026-02-13 | 13F | 1832 Asset Management L.P. | 0 | -100,00 | 0 | -100,00 | ||||
| 2026-02-17 | 13F | Algert Global Llc | 252.394 | 46,88 | 5 | 25,00 | ||||
| 2026-02-17 | 13F | Main Street Financial Solutions, LLC | 76.500 | 53,00 | 1.536 | 19,25 | ||||
| 2026-02-10 | 13F | Nomura Asset Management Co Ltd | 1.780 | 0,00 | 36 | -22,22 | ||||
| 2026-02-11 | 13F | Jpmorgan Chase & Co | 580.433 | -91,26 | 11.655 | -93,18 | ||||
| 2026-04-06 | 13F | CX Institutional | 190 | 1,06 | 0 | |||||
| 2026-01-28 | 13F | Chicago Partners Investment Group LLC | 21.351 | 474 | ||||||
| 2026-02-03 | 13F | Mitsubishi UFJ Kokusai Asset Management Co., Ltd. | 46.172 | 0,00 | 958 | -19,51 | ||||
| 2026-02-17 | 13F | United Capital Financial Advisers, Llc | 0 | -100,00 | 0 | |||||
| 2026-02-11 | 13F | LPL Financial LLC | 27.126 | -53,61 | 545 | -63,88 | ||||
| 2026-02-11 | 13F | Inceptionr Llc | 24.699 | 153,09 | 496 | 97,21 | ||||
| 2026-02-13 | 13F | State Street Corp | 6.823.811 | -0,75 | 137.022 | -22,63 | ||||
| 2026-02-05 | 13F | DnB Asset Management AS | 0 | -100,00 | 0 | |||||
| 2026-01-29 | 13F | Quent Capital, LLC | 248 | -65,12 | 5 | -77,78 | ||||
| 2026-02-12 | 13F | Federated Hermes, Inc. | 204.850 | -63,40 | 4.113 | -71,47 | ||||
| 2026-01-30 | 13F | Keybank National Association/oh | 0 | -100,00 | 0 | |||||
| 2026-01-21 | 13F | Westfuller Advisors, LLC | 0 | -100,00 | 0 | |||||
| 2026-02-12 | 13F | Adviser Investments LLC | 0 | -100,00 | 0 | |||||
| 2026-02-13 | 13F | First Trust Advisors Lp | 498.458 | 93,26 | 10.009 | 50,65 | ||||
| 2026-02-11 | 13F | Cerity Partners LLC | 185.013 | 4,84 | 3.715 | -18,26 | ||||
| 2026-02-17 | 13F | Nomura Holdings Inc | 52.350 | 1.051 | ||||||
| 2026-02-17 | 13F | Nomura Holdings Inc | Put | 75.000 | 1.506 | |||||
| 2025-11-10 | 13F | Optiver Holding B.V. | 0 | -100,00 | 0 | -100,00 | ||||
| 2025-11-14 | 13F | Interval Partners, LP | 0 | -100,00 | 0 | |||||
| 2026-01-06 | 13F | Iowa State Bank | 0 | -100,00 | 0 | |||||
| 2026-02-03 | 13F | Strengthening Families & Communities, LLC | 17 | 0,00 | 0 | |||||
| 2026-02-17 | 13F | Holocene Advisors, LP | 175.203 | 54,43 | 3.518 | 20,40 | ||||
| 2026-02-12 | 13F | Penserra Capital Management LLC | 0 | -100,00 | 0 | |||||
| 2026-01-28 | 13F | CAPROCK Group, Inc. | 0 | -100,00 | 0 | |||||
| 2026-02-12 | 13F | Earnest Partners Llc | 1.163.768 | -7,34 | 23.368 | -27,77 | ||||
| 2026-02-23 | 13F | Mv Capital Management, Inc. | 0 | -100,00 | 0 | |||||
| 2026-02-17 | 13F | Css Llc/il | 17.119 | -31,22 | 344 | -46,49 | ||||
| 2025-11-14 | 13F | Point72 Hong Kong Ltd | 35.185 | 906 | ||||||
| 2026-02-02 | 13F | Strs Ohio | 451.936 | 8.777,16 | 9.075 | 6.826,72 | ||||
| 2026-02-09 | 13F | Hartland & Co., LLC | 1.079 | -64,24 | 22 | -72,73 | ||||
| 2026-02-10 | 13F | New Mexico Educational Retirement Board | 42.700 | 0,00 | 1 | -100,00 | ||||
| 2026-01-23 | 13F | Deprince Race & Zollo Inc | 0 | -100,00 | 0 | |||||
| 2026-01-26 | 13F | Main Street Group, LTD | 0 | -100,00 | 0 | |||||
| 2026-02-17 | 13F | Ancora Advisors, LLC | 179.208 | 1.378.423,08 | 3.598 | |||||
| 2026-02-13 | 13F | Aviso Financial Inc. | 0 | -100,00 | 0 | |||||
| 2026-02-13 | 13F | Van Eck Associates Corp | 138.374 | -4,00 | 3 | -33,33 | ||||
| 2026-02-02 | 13F | New England Capital Financial Advisors LLC | 643 | 1,10 | 13 | -25,00 | ||||
| 2026-02-11 | 13F | Makaira Partners LLC | 734.355 | -46,40 | 14.746 | -58,22 | ||||
| 2026-02-17 | 13F | Jain Global LLC | 32.733 | 657 | ||||||
| 2026-02-17 | 13F | Cinctive Capital Management LP | 69.947 | 239,40 | 1.405 | 164,91 | ||||
| 2026-02-17 | 13F | Range Rock Capital, LLC | 182.121 | 3.657 | ||||||
| 2026-02-06 | 13F | Creative Financial Designs Inc /adv | 1.525 | 1,06 | 31 | -21,05 | ||||
| 2026-02-04 | 13F | Ameritas Advisory Services, LLC | 0 | -100,00 | 0 | |||||
| 2026-02-04 | 13F | Boyd Watterson Asset Management Llc/oh | 178 | -8,72 | 4 | -40,00 | ||||
| 2026-02-13 | 13F | Commerce Bank | 0 | -100,00 | 0 | |||||
| 2025-11-14 | 13F | Mml Investors Services, Llc | 0 | -100,00 | 0 | |||||
| 2026-02-17 | 13F | RPD Fund Management LLC | 33.000 | 663 | ||||||
| 2026-02-06 | 13F | Gsa Capital Partners Llp | 20.579 | 0 | ||||||
| 2026-02-17 | 13F | Quadrature Capital Ltd | 35.099 | 705 | ||||||
| 2025-10-27 | 13F | Stone House Investment Management, LLC | 0 | -100,00 | 0 | |||||
| 2026-02-10 | 13F | Goldman Sachs Group Inc | 919.236 | 27,70 | 18.458 | -0,45 | ||||
| 2026-02-11 | 13F | Primecap Management Co/ca/ | 317.190 | -10,64 | 6.369 | -30,34 | ||||
| 2026-02-17 | 13F | Polymer Capital Management (US) LLC | 78.365 | 348,31 | 1.574 | 249,56 | ||||
| 2026-04-08 | 13F | Quantum Financial Advisors, LLC | 0 | -100,00 | 0 | |||||
| 2026-02-13 | 13F | American Century Companies Inc | 5.313.901 | 2,70 | 106.703 | -19,95 | ||||
| 2026-02-17 | 13F | Aster Capital Management (DIFC) Ltd | 10.295 | 51,51 | 207 | 17,71 | ||||
| 2026-02-12 | 13F | Ankerstar Wealth, LLC | 4 | 0 | ||||||
| 2026-02-17 | 13F | Northern Trust Corp | 2.054.271 | 0,08 | 41.250 | -21,99 | ||||
| 2026-01-15 | 13F | Nisa Investment Advisors, Llc | 38.674 | -0,09 | 777 | -22,17 | ||||
| 2026-01-28 | 13F | Teacher Retirement System Of Texas | 0 | -100,00 | 0 | |||||
| 2026-02-17 | 13F | Jones Financial Companies Lllp | 62.757 | 45,42 | 1.260 | 9,57 | ||||
| 2026-02-13 | 13F | Saxon Interests, Inc. | 53.627 | 1.077 | ||||||
| 2026-02-13 | 13F | Squarepoint Ops LLC | 302.635 | 4,85 | 6.077 | -18,27 | ||||
| 2026-02-17 | 13F | Evolve Private Wealth, Llc | 23.988 | 482 | ||||||
| 2025-10-22 | 13F | Geneos Wealth Management Inc. | 0 | -100,00 | 0 | -100,00 | ||||
| 2026-02-12 | 13F | Barington Capital Group, L.p. | 75.000 | -40,00 | 1.506 | -53,23 | ||||
| 2026-02-19 | 13F | CI Private Wealth, LLC | 97.202 | 475,84 | 419 | -3,46 | ||||
| 2026-01-16 | 13F | FNY Investment Advisers, LLC | Call | 0 | -100,00 | 0 | ||||
| 2026-02-13 | 13F | Squarepoint Ops LLC | Call | 223.700 | -16,99 | 4.492 | -35,31 | |||
| 2026-02-13 | 13F | Squarepoint Ops LLC | Put | 233.200 | 194,07 | 4.683 | 129,29 | |||
| 2026-02-17 | 13F | Brevan Howard Capital Management LP | 0 | -100,00 | 0 | |||||
| 2026-02-12 | 13F | Clark Estates Inc/ny | 75.600 | 0,00 | 1.518 | -22,03 | ||||
| 2025-11-14 | 13F | Full Sail Capital, LLC | 0 | -100,00 | 0 | -100,00 | ||||
| 2026-02-17 | 13F | Capital Fund Management S.a. | Call | 349.900 | 33,65 | 7.026 | 4,18 | |||
| 2026-02-17 | 13F | Signature Equity Partners, LLC | 4 | 0 | ||||||
| 2026-02-12 | 13F | DRW Securities, LLC | 10.526 | 211 | ||||||
| 2026-02-17 | 13F | Capital Fund Management S.a. | Put | 149.800 | 235,12 | 3.008 | 161,25 | |||
| 2026-02-13 | 13F | Aigen Investment Management, Lp | 46.544 | 935 | ||||||
| 2026-02-18 | 13F | Mackenzie Financial Corp | 0 | -100,00 | 0 | |||||
| 2026-01-28 | 13F | Klp Kapitalforvaltning As | 44.000 | 5,01 | 884 | -18,16 | ||||
| 2026-02-17 | 13F | VARCOV Co. | 34.671 | 696 | ||||||
| 2026-02-17 | 13F | Two Sigma Advisers, Lp | 136.600 | -74,11 | 2.743 | -79,82 | ||||
| 2026-01-21 | 13F | Yousif Capital Management, Llc | 68.062 | -3,81 | 1.474 | -19,15 | ||||
| 2026-01-28 | 13F | Hoey Investments, Inc | 22 | 0,00 | 0 | |||||
| 2026-02-17 | 13F | Point72 Asset Management, L.P. | Put | 80.600 | 25,16 | 1.618 | -2,41 | |||
| 2026-01-29 | 13F | Rakuten Securities, Inc. | 0 | -100,00 | 0 | |||||
| 2026-02-13 | 13F | Champlain Investment Partners, LLC | 0 | -100,00 | 0 | |||||
| 2026-02-17 | 13F | Summit Trail Advisors, Llc | 25.536 | 6,54 | 513 | -17,02 | ||||
| 2026-02-17 | 13F | Governors Lane LP | 0 | -100,00 | 0 | |||||
| 2026-02-17 | 13F | Point72 Asset Management, L.P. | Call | 18.000 | 361 | |||||
| 2026-01-20 | 13F | American National Bank | 0 | -100,00 | 0 | |||||
| 2026-02-06 | 13F | Diamond Hill Capital Management Inc | 241.609 | -34,60 | 4.852 | -49,03 | ||||
| 2026-02-17 | 13F | Point72 Asset Management, L.P. | 1.873.211 | -9,69 | 37.614 | -29,61 | ||||
| 2026-01-27 | 13F | WealthCollab, LLC | 200 | -60,00 | 4 | -66,67 | ||||
| 2026-01-26 | 13F | Merit Financial Group, LLC | 35.033 | 92,05 | 703 | 49,89 | ||||
| 2026-02-17 | 13F | Amundi | 58.684 | -72,69 | 1.178 | -79,25 | ||||
| 2026-02-17 | 13F | ExodusPoint Capital Management, LP | 0 | -100,00 | 0 | -100,00 | ||||
| 2026-02-10 | 13F | Daiwa Securities Group Inc. | 0 | -100,00 | 0 | |||||
| 2026-01-22 | 13F | Massachusetts Financial Services Co /ma/ | 699.251 | 2,26 | 14.041 | -20,29 | ||||
| 2026-01-22 | 13F | Yarger Wealth Strategies, Llc | 20.924 | -33,67 | 420 | -48,28 | ||||
| 2026-02-10 | 13F | Sarver Vrooman Wealth Advisors | 2 | 0 | ||||||
| 2025-10-17 | 13F | Bard Financial Services, Inc. | 24.200 | -13,88 | 623 | -25,92 | ||||
| 2026-02-06 | 13F | Addison Advisors LLC | 25 | 1 | ||||||
| 2025-11-14 | 13F | Petrus Trust Company, LTA | 0 | -100,00 | 0 | |||||
| 2026-02-06 | 13F | Leonteq Securities AG | 36.408 | -50,23 | 731 | -61,20 | ||||
| 2026-01-13 | 13F | Stonehage Fleming Financial Services Holdings Ltd | 0 | -100,00 | 0 | |||||
| 2026-02-17 | 13F | Weiss Asset Management LP | 212.075 | 4.258 | ||||||
| 2026-02-13 | 13F | MAI Capital Management | 1.040 | -73,62 | 21 | -80,20 | ||||
| 2026-02-13 | 13F | Kilter Group LLC | 46 | 1 | ||||||
| 2026-02-17 | 13F | Raymond James Financial Inc | 273.763 | -68,88 | 5.497 | -75,74 | ||||
| 2026-02-12 | 13F | Systematic Alpha Investments, LLC | 10.370 | 0,00 | 208 | -22,10 | ||||
| 2026-02-17 | 13F | Canada Pension Plan Investment Board | 3.741.506 | 867,58 | 75.129 | 654,23 | ||||
| 2026-01-30 | 13F/A | M&t Bank Corp | 14.281 | 286 | ||||||
| 2026-02-09 | 13F | Huntington National Bank | 22.182 | -1,30 | 445 | -23,01 | ||||
| 2025-11-14 | 13F | Clark Capital Management Group, Inc. | 0 | -100,00 | 0 | |||||
| 2025-11-14 | 13F | Aristeia Capital Llc | 0 | -100,00 | 0 | |||||
| 2026-01-13 | 13F | Global X Japan Co., Ltd. | 350 | 31,58 | 7 | 16,67 | ||||
| 2026-02-13 | 13F | Wexford Capital Lp | 17.988 | 361 | ||||||
| 2026-02-17 | 13F | Fund 1 Investments, LLC | 336.427 | -72,60 | 6.755 | -78,64 | ||||
| 2026-02-18 | 13F | State of Tennessee, Treasury Department | 84.313 | -14,10 | 1.838 | -27,29 | ||||
| 2026-02-11 | 13F | Los Angeles Capital Management Llc | 930 | -94,23 | 22 | -94,70 | ||||
| 2026-02-17 | 13F | Man Group plc | 164.055 | -65,18 | 3.294 | -72,86 | ||||
| 2025-11-14 | 13F | Texas Permanent School Fund | 0 | -100,00 | 0 | |||||
| 2026-02-03 | 13F | Bokf, Na | 0 | -100,00 | 0 | |||||
| 2026-02-13 | 13F | Police & Firemen's Retirement System of New Jersey | 91.402 | -3,16 | 1.835 | -24,52 | ||||
| 2026-01-29 | 13F | UMA Financial Services, Inc. | 0 | -100,00 | 0 | |||||
| 2025-10-27 | 13F | Mowery & Schoenfeld Wealth Management, LLC | 0 | -100,00 | 0 | |||||
| 2025-11-12 | 13F | Transce3nd, LLC | 0 | -100,00 | 0 | |||||
| 2026-01-23 | 13F | Stephenson National Bank & Trust | 517 | 23,98 | 10 | 0,00 | ||||
| 2026-01-23 | 13F | State of Alaska, Department of Revenue | 48.430 | -4,59 | 1 | -100,00 | ||||
| 2026-04-08 | 13F | Wealth Enhancement Advisory Services, Llc | 201.785 | 46,96 | 3.302 | 8,05 | ||||
| 2026-02-13 | 13F | Rhumbline Advisers | 532.476 | -2,85 | 10.692 | -24,27 | ||||
| 2026-02-17 | 13F | Tremblant Capital Group | 198.861 | -77,26 | 3.993 | -82,28 | ||||
| 2025-11-13 | 13F | Bnp Paribas Arbitrage, Sa | Put | 0 | -100,00 | 0 | -100,00 | |||
| 2026-02-13 | 13F | Walleye Trading LLC | 0 | -100,00 | 0 | -100,00 | ||||
| 2025-11-03 | 13F | Annis Gardner Whiting Capital Advisors, LLC | 0 | -100,00 | 0 | |||||
| 2025-11-14 | 13F | Skopos Labs, Inc. | 0 | -100,00 | 0 | |||||
| 2026-02-13 | 13F | Kestra Advisory Services, LLC | 2.781 | 56 | ||||||
| 2026-02-10 | 13F | Intech Investment Management Llc | 108.766 | 462,56 | 2.184 | 338,55 | ||||
| 2026-02-04 | 13F | Swiss Life Asset Management Ltd | 12.933 | 43,76 | 260 | 12,12 | ||||
| 2026-02-24 | 13F/A | Pacer Advisors, Inc. | 1.877.079 | 41,00 | 37.692 | 9,91 | ||||
| 2026-02-10 | 13F | Eurizon Capital SGR S.p.A. | 2.491 | 50 | ||||||
| 2026-03-17 | 13F/A | Barclays Plc | Call | 0 | -100,00 | 0 | -100,00 | |||
| 2026-02-12 | 13F | Affinity Investment Advisors, Llc | 0 | -100,00 | 0 | |||||
| 2026-02-09 | 13F | Harbour Investments, Inc. | 118 | -38,22 | 2 | -50,00 | ||||
| 2026-02-11 | 13F | Vestcor Inc | 12.285 | -41,37 | 0 | |||||
| 2026-02-05 | 13F | Amalgamated Bank | 94.845 | -1,89 | 2 | -50,00 | ||||
| 2026-02-17 | 13F | Ameriprise Financial Inc | 343.967 | -20,05 | 6.907 | -37,68 | ||||
| 2026-01-28 | 13F | Citizens & Northern Corp | 21.871 | -38,49 | 439 | -52,02 | ||||
| 2026-01-29 | 13F | Comerica Bank | 118.291 | 6,43 | 2.375 | -17,05 | ||||
| 2026-02-12 | 13F | Voya Investment Management Llc | 142.397 | -10,22 | 2.859 | -30,01 | ||||
| 2025-10-15 | 13F | Revisor Wealth Management LLC | 0 | -100,00 | 0 | |||||
| 2026-02-04 | 13F | Securian Asset Management, Inc | 15.026 | -5,19 | 302 | -26,23 | ||||
| 2026-02-13 | 13F | Quarry LP | 487 | 10 | ||||||
| 2025-12-15 | 13F/A | Hudson Bay Capital Management LP | 0 | -100,00 | 0 | -100,00 | ||||
| 2026-02-13 | 13F | Dynamic Technology Lab Private Ltd | 72.409 | 1.454 | ||||||
| 2026-02-17 | 13F | Readystate Asset Management Lp | 40.826 | 820 | ||||||
| 2025-12-15 | 13F/A | Hudson Bay Capital Management LP | Put | 0 | -100,00 | 0 | -100,00 | |||
| 2026-02-11 | 13F | Meeder Asset Management Inc | 2.874 | 28,48 | 58 | 0,00 | ||||
| 2025-11-12 | 13F | Kingsview Wealth Management, LLC | 0 | -100,00 | 0 | |||||
| 2026-02-12 | 13F | Brinker Capital Investments, LLC | 19.047 | 382 | ||||||
| 2026-02-17 | 13F | Lazard Asset Management Llc | 16.628 | -0,07 | 334 | -22,20 | ||||
| 2026-02-17 | 13F | Schonfeld Strategic Advisors LLC | 0 | -100,00 | 0 | |||||
| 2026-01-23 | 13F | Ritholtz Wealth Management | 11.726 | 235 | ||||||
| 2026-02-13 | 13F | Walleye Capital LLC | 1.500 | -99,28 | 30 | -99,44 | ||||
| 2026-02-13 | 13F | Walleye Capital LLC | Call | 258.800 | 1.247,92 | 5.197 | 951,82 | |||
| 2026-02-13 | 13F | Manufacturers Life Insurance Company, The | 0 | -100,00 | 0 | |||||
| 2026-02-04 | 13F | Oregon Public Employees Retirement Fund | 41.000 | -3,76 | 823 | -24,98 | ||||
| 2026-03-06 | 13F | Hsbc Holdings Plc | 312.258 | -57,70 | 6.333 | -66,49 | ||||
| 2025-11-14 | 13F | Point72 Europe (London) LLP | 15.025 | 387 | ||||||
| 2026-02-04 | 13F | Dynamic Wealth Strategies, LLC | 8.290 | 170,30 | 166 | 110,13 | ||||
| 2026-02-10 | 13F/A | Northwestern Mutual Wealth Management Co | 108 | -79,78 | 2 | -84,62 | ||||
| 2026-02-17 | 13F | Summit Global Investments | 0 | -100,00 | 0 | |||||
| 2025-10-31 | 13F | Symphony Financial, Ltd. Co. | 0 | -100,00 | 0 | -100,00 | ||||
| 2026-01-23 | 13F | Assetmark, Inc | 3 | -83,33 | 0 | |||||
| 2026-02-13 | 13F | Walleye Capital LLC | Put | 119.200 | 238,64 | 2.394 | 164,13 | |||
| 2026-02-13 | 13F | Elwood Capital Partners Lp | 0 | -100,00 | 0 | |||||
| 2025-11-07 | 13F | Shell Asset Management Co | 0 | 0 | ||||||
| 2026-02-06 | 13F | Bare Financial Services, Inc | 0 | -100,00 | 0 | |||||
| 2025-10-15 | 13F | Stephens Consulting, LLC | 0 | -100,00 | 0 | |||||
| 2026-02-02 | 13F | Bay Harbor Wealth Management, LLC | 8 | -27,27 | 0 | |||||
| 2026-02-17 | 13F | RMB Capital Management, LLC | 14.223 | 286 | ||||||
| 2026-02-12 | 13F | Marex Group plc | 46.326 | 18,19 | 930 | -7,83 | ||||
| 2026-02-13 | 13F | Cornerstone Financial Management LLC | 25 | 1 | ||||||
| 2026-01-27 | 13F | Institute for Wealth Management, LLC. | 0 | -100,00 | 0 | |||||
| 2026-01-29 | 13F | UBS Group AG | Put | 0 | -100,00 | 0 | -100,00 | |||
| 2026-02-02 | 13F | Qrg Capital Management, Inc. | 11.629 | 3,42 | 234 | -19,38 | ||||
| 2026-02-11 | 13F | GW&K Investment Management, LLC | 314 | 0 | ||||||
| 2026-01-29 | 13F | Cornerstone Investment Partners, LLC | 0 | -100,00 | 0 | |||||
| 2026-02-13 | 13F | Healthcare Of Ontario Pension Plan Trust Fund | 0 | -100,00 | 0 | |||||
| 2026-02-17 | 13F | Susquehanna International Group, Llp | Call | 978.500 | 27,01 | 19.648 | -0,99 | |||
| 2026-02-12 | 13F | California Public Employees Retirement System | 387.427 | -2,70 | 7.780 | -24,16 | ||||
| 2026-02-17 | 13F | Fmr Llc | 16.944.064 | -1,35 | 340.237 | -23,10 | ||||
| 2026-02-17 | 13F | Engineers Gate Manager LP | 96.127 | 900,70 | 1.930 | 681,38 | ||||
| 2026-02-10 | 13F | Measured Wealth Private Client Group, LLC | 435 | -26,64 | 9 | -46,67 | ||||
| 2026-01-09 | 13F | SG Americas Securities, LLC | 466.338 | 725,27 | 9 | 800,00 | ||||
| 2026-02-09 | 13F | Royce & Associates Lp | 573.951 | -50,31 | 11.525 | -61,27 | ||||
| 2026-02-10 | 13F | State of Wyoming | 0 | -100,00 | 0 | |||||
| 2026-02-13 | 13F | Missouri Trust & Investment Co | 40.075 | -13,07 | 805 | -32,27 | ||||
| 2026-02-17 | 13F | Susquehanna International Group, Llp | 214.084 | -72,77 | 4.299 | -78,78 | ||||
| 2026-01-23 | 13F | Private Wealth Management Group, LLC | 34 | 1 | ||||||
| 2026-02-06 | 13F | Banque Cantonale Vaudoise | 10.339 | 0,00 | 208 | |||||
| 2026-02-17 | 13F | Susquehanna International Group, Llp | Put | 1.384.000 | -57,97 | 27.791 | -67,24 | |||
| 2025-10-30 | 13F | Keebeck Alpha, LP | 0 | -100,00 | 0 | |||||
| 2026-02-13 | 13F | Maven Securities LTD | 17.500 | 351 | ||||||
| 2026-01-28 | 13F | Universal- Beteiligungs- und Servicegesellschaft mbH | 117.633 | 342,85 | 2.410 | 252,34 | ||||
| 2026-02-17 | 13F | Lotus Technology Management, LP | 32.573 | 654 | ||||||
| 2026-01-30 | 13F | Turning Point Benefit Group, Inc. | 26 | 420,00 | 1 | |||||
| 2026-02-10 | 13F | Fideuram Asset Management (Ireland) dac | 180 | 7 | ||||||
| 2026-02-12 | 13F | Renaissance Technologies Llc | 277.233 | -89,35 | 5.567 | -91,70 | ||||
| 2026-02-23 | 13F | Virtu Financial LLC | 0 | -100,00 | 0 | |||||
| 2025-11-05 | 13F | Koesten, Hirschmann & Crabtree, INC. | 0 | -100,00 | 0 | |||||
| 2026-02-02 | 13F | Montag A & Associates Inc | 24 | -72,09 | 0 | -100,00 | ||||
| 2026-02-17 | 13F | Grantham, Mayo, Van Otterloo & Co. LLC | 65.053 | -0,20 | 1.306 | -22,22 | ||||
| 2026-02-18 | 13F | Vident Advisory, LLC | 0 | -100,00 | 0 | |||||
| 2026-02-05 | 13F | Td Private Client Wealth Llc | 3.826 | 224,79 | 77 | 153,33 | ||||
| 2026-01-14 | 13F | Spire Wealth Management | 175 | 54,87 | 4 | 50,00 | ||||
| 2026-02-13 | 13F | Sei Investments Co | 337.333 | -29,15 | 6.771 | -44,80 | ||||
| 2026-04-07 | 13F | Farther Finance Advisors, LLC | 12.839 | 13,91 | 248 | 9,73 | ||||
| 2026-02-13 | 13F | JustInvest LLC | 21.509 | 10,93 | 432 | -13,63 | ||||
| 2025-11-12 | 13F | IAG Wealth Partners, LLC | 0 | -100,00 | 0 | |||||
| 2025-11-14 | 13F | Axa S.a. | 0 | -100,00 | 0 | |||||
| 2026-02-12 | 13F | State Board Of Administration Of Florida Retirement System | 188.998 | -8,32 | 3.795 | -28,53 | ||||
| 2026-02-17 | 13F | Parallax Volatility Advisers, L.P. | 35.131 | 705 | ||||||
| 2026-02-03 | 13F | American Assets Inc | 0 | -100,00 | 0 | |||||
| 2026-02-17 | 13F | Vinva Investment Management Ltd | 0 | -100,00 | 0 | |||||
| 2026-04-08 | 13F | NorthCrest Asset Manangement, LLC | 23.949 | 41,88 | 445 | 30,21 | ||||
| 2026-02-13 | 13F | Forest Avenue Capital Management LP | 2.211.826 | 22,85 | 44.413 | -4,23 | ||||
| 2026-02-06 | 13F | Pnc Financial Services Group, Inc. | 58.977 | -19,83 | 1.184 | -37,52 | ||||
| 2025-11-10 | 13F | Kovitz Investment Group Partners, LLC | 0 | -100,00 | 0 | |||||
| 2026-02-05 | 13F | Gamco Investors, Inc. Et Al | 14.914 | 0,42 | 299 | -21,73 | ||||
| 2026-02-13 | 13F | Caitong International Asset Management Co., Ltd | 38 | 1 | ||||||
| 2026-02-13 | 13F | Boston Partners | 11.737 | -99,07 | 236 | -99,28 | ||||
| 2025-10-21 | 13F | Simon Quick Advisors, Llc | 0 | -100,00 | 0 | -100,00 | ||||
| 2026-04-07 | 13F | Retirement Wealth Solutions LLC | 21 | 0 | ||||||
| 2026-02-17 | 13F | Russell Investments Group, Ltd. | 114.717 | -72,29 | 2.304 | -78,41 | ||||
| 2025-11-14 | 13F | Nomura Holdings Inc | Call | 0 | -100,00 | 0 | ||||
| 2026-02-17 | 13F | Gotham Asset Management, LLC | 1.286.893 | 35,27 | 25.841 | 5,44 | ||||
| 2026-02-06 | 13F | Larson Financial Group LLC | 574 | 98,62 | 12 | 57,14 | ||||
| 2025-11-13 | 13F | Wells Fargo & Company/mn | Put | 0 | -100,00 | 0 | -100,00 | |||
| 2026-01-12 | 13F | Kozak & Associates, Inc. | 279 | 1,09 | 6 | 20,00 | ||||
| 2026-02-02 | 13F | Millstone Evans Group, LLC | 63 | 0,00 | 1 | 0,00 | ||||
| 2026-02-17 | 13F | Bank Of America Corp /de/ | 1.625.166 | -52,19 | 32.633 | -62,73 | ||||
| 2026-02-10 | 13F | Connor, Clark & Lunn Investment Management Ltd. | 687.403 | 1.009,59 | 13.803 | 765,39 | ||||
| 2026-02-17 | 13F | Mercer Global Advisors Inc /adv | 161.935 | 39,33 | 3.252 | 8,62 | ||||
| 2026-02-13 | 13F | Diametric Capital, LP | 0 | -100,00 | 0 | |||||
| 2026-02-17 | 13F | Quantitative Investment Management, LLC | 17.195 | 0 | ||||||
| 2026-02-17 | 13F | Jump Financial, LLC | 19.300 | -82,09 | 388 | -86,06 | ||||
| 2026-02-12 | 13F | JBF Capital, Inc. | 13.000 | 30,00 | 261 | 1,56 | ||||
| 2026-02-12 | 13F | Nuveen, LLC | 588.650 | -33,23 | 11.820 | -47,95 | ||||
| 2026-02-17 | 13F | Trexquant Investment LP | 33.948 | 682 | ||||||
| 2026-02-10 | 13F | AdvisorShares Investments LLC | 0 | -100,00 | 0 | -100,00 | ||||
| 2025-10-23 | 13F | Park Avenue Securities Llc | 0 | -100,00 | 0 | |||||
| 2026-01-30 | 13F | Mitsubishi UFJ Trust & Banking Corp | 264.660 | -26,61 | 5.314 | -42,80 | ||||
| 2026-02-13 | 13F | Smartleaf Asset Management LLC | 226 | -47,81 | 5 | -63,64 | ||||
| 2026-02-03 | 13F | Robeco Schweiz AG | 0 | -100,00 | 0 | |||||
| 2026-02-11 | 13F | Winton Capital Group Ltd | 158.133 | 3.175 | ||||||
| 2025-11-06 | 13F | Whipplewood Advisors, LLC | 0 | -100,00 | 0 | |||||
| 2025-11-06 | 13F | Abich Financial Wealth Management LLC | 4.027 | 25,14 | 104 | 0,98 | ||||
| 2026-02-13 | 13F | Resources Management Corp /ct/ /adv | 150 | 0,00 | 0 | |||||
| 2026-01-23 | 13F | Nbt Bank N A /ny | 581 | -27,19 | 12 | -45,00 | ||||
| 2026-02-17 | 13F | Citadel Advisors Llc | Put | 521.800 | -44,62 | 10.478 | -56,84 | |||
| 2026-02-17 | 13F | MIRAE ASSET GLOBAL ETFS HOLDINGS Ltd. | 8.325 | 24,22 | 167 | -2,91 | ||||
| 2026-02-24 | 13F | MidFirst Bank | 2.524 | 0 | ||||||
| 2026-02-05 | 13F | Hills Bank & Trust Co | 0 | -100,00 | 0 | |||||
| 2026-02-05 | 13F | Gabelli Funds Llc | 49.704 | 4,56 | 998 | -18,46 | ||||
| 2026-02-11 | 13F | Capital International Investors | 916.443 | 0,00 | 18.402 | -22,05 | ||||
| 2026-02-17 | 13F | Citadel Advisors Llc | 2.215.472 | 47,70 | 44.487 | 15,13 | ||||
| 2026-01-27 | 13F | Lecap Asset Management Ltd | 55.460 | -4,41 | 1.114 | -25,50 | ||||
| 2026-02-11 | 13F | Empowered Funds, LLC | 24.754 | -60,75 | 497 | -69,40 | ||||
| 2026-02-17 | 13F | Citadel Advisors Llc | Call | 549.800 | 12,71 | 11.040 | -12,14 | |||
| 2026-02-17 | 13F | Balyasny Asset Management Llc | 2.728.353 | 54.785 | ||||||
| 2026-02-13 | 13F | National Bank Of Canada /fi/ | 1 | 0,00 | 0 | |||||
| 2025-11-14 | 13F | Shelton Capital Management | 0 | -100,00 | 0 | -100,00 | ||||
| 2025-11-14 | 13F | Bridgefront Capital, LLC | 0 | -100,00 | 0 | -100,00 | ||||
| 2026-01-21 | 13F | Newbridge Financial Services Group, Inc. | 0 | -100,00 | 0 | |||||
| 2025-11-06 | 13F | Prospera Financial Services Inc | 0 | -100,00 | 0 | |||||
| 2026-02-12 | 13F | Elo Mutual Pension Insurance Co | 36.682 | -31,46 | 737 | -46,59 | ||||
| 2026-01-26 | 13F | Asset Dedication, LLC | 42 | 0,00 | 1 | -100,00 | ||||
| 2026-02-12 | 13F | Federation des caisses Desjardins du Quebec | 67.878 | -16,51 | 1.363 | -34,96 | ||||
| 2026-02-12 | 13F | CIBC Private Wealth Group, LLC | 6.345 | 3,74 | 127 | -19,11 | ||||
| 2026-02-04 | 13F | Bailard, Inc. | 0 | -100,00 | 0 | |||||
| 2026-02-17 | 13F | Limestone Investment Advisors LP | 0 | -100,00 | 0 | |||||
| 2026-01-21 | 13F | Oak Thistle LLC | 18.895 | 379 | ||||||
| 2026-02-12 | 13F | Aristides Capital LLC | 10.378 | -74,42 | 208 | -80,08 | ||||
| 2026-02-17 | 13F | Nokomis Capital, L.L.C. | 59.017 | 1.185 | ||||||
| 2026-01-09 | 13F | Assenagon Asset Management S.A. | 74.644 | 187,51 | 1.499 | 124,25 | ||||
| 2026-02-17 | 13F | Pinnacle Financial Partners, Inc. | 44.492 | 893 | ||||||
| 2026-02-17 | 13F | Captrust Financial Advisors | 56.363 | 56,56 | 1.132 | 22,01 | ||||
| 2026-04-07 | 13F | Signaturefd, Llc | 2.915 | 16,97 | 54 | 8,00 | ||||
| 2026-02-06 | 13F | Global Retirement Partners, LLC | 1.532 | 31 | ||||||
| 2026-01-29 | 13F | State Of Michigan Retirement System | 48.700 | -3,37 | 978 | -24,73 | ||||
| 2025-11-14 | 13F | T. Rowe Price Investment Management, Inc. | 0 | -100,00 | 0 | |||||
| 2026-02-03 | 13F | Gallacher Capital Management LLC | 19.666 | -28,72 | 395 | -44,51 | ||||
| 2026-02-17 | 13F | Cooper Creek Partners Management Llc | 0 | -100,00 | 0 | |||||
| 2026-02-12 | 13F | Quadrant Capital Group Llc | 3.633 | 179,46 | 73 | 118,18 | ||||
| 2026-02-13 | 13F | Ubs Asset Management Americas Inc | 546.893 | -2,11 | 10.982 | -23,70 | ||||
| 2026-02-17 | 13F | New Vernon Capital Holdings II LLC | 0 | -100,00 | 0 | |||||
| 2026-02-17 | 13F | D. E. Shaw & Co., Inc. | Call | 69.700 | 1.400 | |||||
| 2026-02-12 | 13F | South Dakota Investment Council | 1.684.793 | 110,92 | 34 | 65,00 | ||||
| 2026-02-17 | 13F | D. E. Shaw & Co., Inc. | 5.769.235 | 523,64 | 115.846 | 386,14 | ||||
| 2026-02-17 | 13F | D. E. Shaw & Co., Inc. | Put | 485.900 | 651,00 | 9.757 | 485,59 | |||
| 2026-02-06 | 13F | EverSource Wealth Advisors, LLC | 6.053 | -4,35 | 122 | -25,77 | ||||
| 2025-11-14 | 13F | Manchester Capital Management LLC | 0 | -100,00 | 0 | |||||
| 2026-02-02 | 13F | Access Investment Management LLC | 136.105 | 0,00 | 3.506 | 0,00 | ||||
| 2026-01-16 | 13F | Ronald Blue Trust, Inc. | 2.803 | -32,70 | 56 | -47,66 | ||||
| 2026-01-27 | 13F | Zurcher Kantonalbank (Zurich Cantonalbank) | 41.161 | -28,01 | 827 | -43,89 | ||||
| 2026-02-13 | 13F | Blueshift Asset Management, LLC | 110.005 | 159,37 | 2.209 | 102,20 | ||||
| 2026-02-13 | 13F | Ceredex Value Advisors LLC | 0 | -100,00 | 0 | |||||
| 2026-02-13 | 13F | Rafferty Asset Management, LLC | 22.166 | 39,98 | 445 | 9,34 | ||||
| 2026-01-29 | 13F | IMC-Chicago, LLC | 0 | -100,00 | 0 | -100,00 | ||||
| 2026-02-09 | 13F | Quest Partners LLC | 15.126 | -33,51 | 304 | -48,29 | ||||
| 2026-02-10 | 13F | Bank of New York Mellon Corp | 2.521.259 | 36,86 | 50.627 | 6,68 | ||||
| 2026-02-17 | 13F | Maryland State Retirement & Pension System | 10.245 | 0,00 | 206 | -22,05 | ||||
| 2026-02-13 | 13F | Venture Visionary Partners LLC | 21.166 | 425 | ||||||
| 2026-01-22 | 13F | HHM Wealth Advisors, LLC | 1.010 | 0,00 | 20 | -23,08 | ||||
| 2026-02-12 | 13F | MetLife Investment Management, LLC | 100.747 | -7,39 | 2.023 | -27,80 | ||||
| 2026-01-07 | 13F | Massmutual Trust Co Fsb/adv | 173 | -41,16 | 3 | -57,14 | ||||
| 2026-01-30 | 13F | Activest Wealth Management | 1.577 | 32 | ||||||
| 2026-02-12 | 13F | Commonwealth Equity Services, Llc | 10.486 | 211 | ||||||
| 2026-02-05 | 13F | Elyxium Wealth, LLC | 1 | 0 | ||||||
| 2026-02-09 | 13F | Keating Financial Advisory Services, Inc. | 15 | 0 | ||||||
| 2026-02-10 | 13F | Bnp Paribas Arbitrage, Sa | 1.563.965 | -5,47 | 31.404 | -26,31 | ||||
| 2026-02-13 | 13F | Marathon Trading Investment Management LLC | 10.000 | 0,00 | 201 | -22,18 | ||||
| 2026-04-08 | 13F | TOWER TRUST & INVESTMENT Co | 14.870 | -1,07 | 277 | -7,97 | ||||
| 2026-01-29 | 13F | Dunhill Financial, LLC | 13 | 160,00 | 0 | |||||
| 2026-01-27 | 13F | Graphene Investments SAS | 0 | -100,00 | 0 | |||||
| 2026-01-27 | 13F | Krilogy Financial LLC | 28.040 | 153,05 | 601 | 129,39 | ||||
| 2026-02-17 | 13F | Anomaly Capital Management, LP | 0 | -100,00 | 0 | |||||
| 2026-01-28 | 13F | Ruffer LLP | 170.505 | 3.429 | ||||||
| 2026-02-11 | 13F | Simplex Trading, Llc | 37.866 | -76,87 | 760 | 18.900,00 | ||||
| 2026-02-13 | 13F | Arrowstreet Capital, Limited Partnership | 2.070.127 | 66,95 | 41.568 | 30,14 | ||||
| 2026-04-06 | 13F | Versant Capital Management, Inc | 5.729 | 107 | ||||||
| 2026-01-21 | 13F | SJS Investment Consulting Inc. | 1.032 | 21 | ||||||
| 2026-02-12 | 13F | Loomis Sayles & Co L P | 27.412 | -97,27 | 550 | -97,87 | ||||
| 2026-01-30 | 13F | Bogart Wealth, LLC | 0 | -100,00 | 0 | |||||
| 2026-02-12 | 13F | EntryPoint Capital, LLC | 23.535 | 473 | ||||||
| 2026-02-17 | 13F | Twinbeech Capital Lp | 102.039 | 2.049 | ||||||
| 2026-02-11 | 13F | Everett Harris & Co /ca/ | 68.585 | -32,74 | 1.377 | -47,56 | ||||
| 2026-02-18 | 13F | GWM Advisors LLC | 0 | -100,00 | 0 | |||||
| 2026-02-23 | 13F | Kera Capital Partners, Inc. | 13.891 | 68,31 | 303 | 42,45 | ||||
| 2026-02-18 | 13F/A | Fuller & Thaler Asset Management, Inc. | 2.322.222 | -0,96 | 46.630 | -22,80 | ||||
| 2026-02-11 | 13F | Ameritas Investment Partners, Inc. | 77.098 | 1.548 | ||||||
| 2026-02-13 | 13F | Walleye Trading LLC | Put | 116.300 | 12,48 | 2.335 | -12,32 | |||
| 2026-02-17 | 13F | Sciencast Management LP | 68.220 | 1.370 | ||||||
| 2026-02-13 | 13F | Stifel Financial Corp | 10.417 | 209 | ||||||
| 2026-02-11 | 13F | Deutsche Bank Ag\ | 783.954 | 142,78 | 15.742 | 89,24 | ||||
| 2026-02-13 | 13F | Walleye Trading LLC | Call | 158.900 | 48,37 | 3.191 | 15,66 | |||
| 2026-02-13 | 13F | Neuberger Berman Group LLC | 18.150 | 20,18 | 364 | -6,43 | ||||
| 2026-01-29 | 13F | Pictet Asset Management Holding SA | 30.492 | 6,82 | 612 | -16,73 | ||||
| 2026-02-17 | 13F | Capstone Financial Advisors, Inc. | 10.657 | 214 | ||||||
| 2026-02-11 | 13F | Franklin Resources Inc | 303.350 | -67,59 | 6.091 | -74,79 | ||||
| 2026-02-03 | 13F | Crossmark Global Holdings, Inc. | 24.955 | 46,17 | 501 | 14,12 | ||||
| 2026-02-09 | 13F | Legal & General Group Plc | 309.978 | -4,00 | 6.224 | -25,17 | ||||
| 2025-11-14 | 13F | Teza Capital Management LLC | 0 | -100,00 | 0 | -100,00 | ||||
| 2026-01-30 | 13F | New York State Teachers Retirement System | 233.947 | -1,45 | 5 | -33,33 | ||||
| 2026-02-02 | 13F | Equitable Trust Co | 0 | -100,00 | 0 | |||||
| 2026-01-26 | 13F | PDS Planning, Inc | 13.337 | -5,71 | 268 | -26,65 | ||||
| 2026-02-17 | 13F | Clifford Capital Partners Llc | 0 | -100,00 | 0 | |||||
| 2026-02-12 | 13F | Hm Payson & Co | 28 | 0,00 | 1 | |||||
| 2026-02-11 | 13F | Illinois Municipal Retirement Fund | 129.647 | 32,61 | 2.603 | 3,38 | ||||
| 2025-11-14 | 13F | Clearline Capital LP | 0 | -100,00 | 0 | |||||
| 2026-02-03 | 13F | Drucker Wealth 3.0, LLC | 22.640 | 455 | ||||||
| 2026-01-29 | 13F | Nbc Securities, Inc. | 9.278 | -0,73 | 186 | -22,50 | ||||
| 2026-02-17 | 13F | Advisor Group Holdings, Inc. | 32.341 | -25,12 | 649 | -47,91 | ||||
| 2026-02-06 | 13F | Handelsbanken Fonder AB | 67.149 | -2,89 | 1 | 0,00 | ||||
| 2026-02-10 | 13F | Thompson Siegel & Walmsley Llc | 505.177 | 151,64 | 10 | 100,00 | ||||
| 2025-10-24 | 13F | Hemington Wealth Management | 213 | 17,03 | 0 | |||||
| 2025-11-14 | 13F | Point72 Asia (Singapore) Pte. Ltd. | 8.579 | -56,50 | 221 | -62,71 | ||||
| 2026-01-28 | 13F | Old National Bancorp /in/ | 416.106 | -5,17 | 8.355 | -26,08 | ||||
| 2026-02-09 | 13F | Geode Capital Management, Llc | 3.960.475 | 2,87 | 79.542 | -19,81 | ||||
| 2026-02-09 | 13F | Nicolet Bankshares Inc | 0 | -100,00 | 0 | |||||
| 2026-02-13 | 13F | Pinnacle Wealth Planning Services, Inc. | 104 | 2 | ||||||
| 2026-02-13 | 13F | Marshall Wace, Llp | 0 | -100,00 | 0 | |||||
| 2026-02-17 | 13F | Warren Averett Asset Management, LLC | 0 | -100,00 | 0 | |||||
| 2025-11-07 | 13F | Synovus Financial Corp | 56.210 | 1,38 | 1.448 | -12,88 | ||||
| 2025-11-14 | 13F | Sig Brokerage, Lp | 0 | -100,00 | 0 | -100,00 | ||||
| 2026-02-10 | 13F | Bruce G. Allen Investments, LLC | 1.043 | 0,10 | 21 | -23,08 | ||||
| 2026-02-02 | 13F | Fifth Third Bancorp | 714 | -34,91 | 14 | -50,00 | ||||
| 2026-02-20 | 13F/A | Prestige Wealth Management Group LLC | 0 | -100,00 | 0 | |||||
| 2026-02-12 | 13F | Great Lakes Advisors, Llc | 75.432 | -63,45 | 1.515 | -71,52 | ||||
| 2025-11-14 | 13F | Cubist Systematic Strategies, LLC | Put | 13.100 | 32,32 | 337 | 13,85 | |||
| 2026-02-06 | 13F | Covestor Ltd | 364 | -42,31 | 0 | |||||
| 2025-11-14 | 13F | Cubist Systematic Strategies, LLC | Call | 12.200 | -86,70 | 314 | -88,57 | |||
| 2026-02-13 | 13F | Citigroup Inc | 231.153 | 132,80 | 4.642 | 81,50 | ||||
| 2026-02-12 | 13F | Ensign Peak Advisors, Inc | 41.677 | 7,72 | 837 | -16,06 | ||||
| 2026-02-17 | 13F | Guggenheim Capital Llc | 17.831 | 12,68 | 358 | -12,04 | ||||
| 2026-01-26 | 13F | KBC Group NV | 5.405 | 0,00 | 0 | |||||
| 2025-10-22 | 13F | New Century Financial Group, LLC | 0 | -100,00 | 0 | |||||
| 2025-11-14 | 13F | Cubist Systematic Strategies, LLC | 76.213 | 1.854,18 | 1.963 | 1.592,24 | ||||
| 2026-01-27 | 13F | Evergreen Capital Management Llc | 16.986 | 341 | ||||||
| 2026-02-09 | 13F | New Age Alpha Advisors, LLC | 29.494 | 117,59 | 592 | 69,63 | ||||
| 2026-02-13 | 13F | Toroso Investments, LLC | 93.717 | 10,97 | 1.882 | -13,52 | ||||
| 2026-02-11 | 13F | Parallel Advisors, LLC | 1.897 | 42,63 | 38 | 11,76 | ||||
| 2026-02-10 | 13F | CIBC World Markets Inc. | 102.219 | 2.053 | ||||||
| 2026-02-14 | 13F | Rockefeller Capital Management L.P. | 2.847 | -6,72 | 57 | -26,92 | ||||
| 2026-02-12 | 13F | Bank Of Montreal /can/ | 73.942 | -79,02 | 1.485 | -83,65 | ||||
| 2026-04-07 | 13F | Carolina Wealth Advisors, LLC | 94.145 | 4.383,10 | 1.758 | 4.083,33 | ||||
| 2026-02-02 | 13F | Hussman Strategic Advisors, Inc. | 0 | -100,00 | 0 | |||||
| 2026-02-13 | 13F | Barclays Plc | 411.148 | -14,61 | 8.256 | -46,29 | ||||
| 2026-02-13 | 13F | Barclays Plc | Put | 1.103.000 | -71,88 | 22.148 | -78,08 | |||
| 2026-02-17 | 13F | Capital Fund Management S.a. | 49.260 | -82,49 | 989 | -86,35 | ||||
| 2025-11-14 | 13F | Binnacle Investments Inc | 91 | 10,98 | 2 | 0,00 | ||||
| 2026-02-17 | 13F | Bridger Management, Llc | 0 | -100,00 | 0 | |||||
| 2026-01-12 | 13F | Heartwood Wealth Advisors LLC | 0 | -100,00 | 0 | |||||
| 2026-02-13 | 13F | Natixis | 0 | -100,00 | 0 | |||||
| 2026-01-16 | 13F | Louisiana State Employees Retirement System | 57.100 | -3,06 | 1.147 | -24,46 | ||||
| 2026-01-15 | 13F | Vaughan Nelson Investment Management, L.p. | 2.132.245 | 27,40 | 42.815 | -0,69 | ||||
| 2026-04-09 | 13F | Kwmg, Llc | 213.646 | 9,07 | 3.989 | 1,40 | ||||
| 2026-02-13 | 13F | Public Employees Retirement Association Of Colorado | 20.409 | 0,00 | 0 | |||||
| 2026-01-15 | 13F | Retirement Systems of Alabama | 832.016 | 7,73 | 16.707 | -16,03 | ||||
| 2025-11-14 | 13F | Centiva Capital, LP | 0 | -100,00 | 0 | |||||
| 2026-02-12 | 13F | BlackRock, Inc. | 21.148.836 | 0,09 | 424.669 | -21,98 | ||||
| 2026-02-13 | 13F | Gmt Capital Corp | 3.258.800 | -5,99 | 65.437 | -26,72 | ||||
| 2026-02-09 | 13F | Jefferies Financial Group Inc. | Call | 16.000 | 321 | |||||
| 2026-02-09 | 13F | Jefferies Financial Group Inc. | 43.458 | 873 | ||||||
| 2025-11-13 | 13F | Empirical Finance, LLC | 0 | -100,00 | 0 | |||||
| 2026-02-10 | 13F | Norges Bank | 2.764.168 | 55.504 | ||||||
| 2026-02-13 | 13F | Bank Of Nova Scotia | 224.848 | 4.515 | ||||||
| 2026-02-09 | 13F | Arista Wealth Management, LLC | 0 | -100,00 | 0 | |||||
| 2026-02-10 | 13F | Sivia Capital Partners, LLC | 28.715 | 577 | ||||||
| 2026-02-17 | 13F | Voleon Capital Management Lp | 0 | -100,00 | 0 | -100,00 | ||||
| 2026-01-15 | 13F | Allspring Global Investments Holdings, LLC | 0 | -100,00 | 0 | |||||
| 2025-11-14 | 13F | Shellback Capital, LP | 0 | -100,00 | 0 |