Grundlæggende statistik
| Institutionelle aktier (lange) | 71.736.518 - 89,23% (ex 13D/G) - change of -15,85MM shares -18,10% MRQ |
| Institutionel værdi (lang) | $ 10.074.095 USD ($1000) |
Institutionelt ejerskab og aktionærer
TD SYNNEX Corporation (US:SNX) har 568 institutionelle ejere og aktionærer, der har indsendt 13D/G- eller 13F-formularer til Securities Exchange Commission (SEC). Disse institutioner har i alt 71,736,518 aktier. Største aktionærer omfatter Vanguard Group Inc, BlackRock, Inc., Fmr Llc, Brave Warrior Advisors, LLC, Dimensional Fund Advisors Lp, Abrams Bison Investments, Llc, State Street Corp, Jpmorgan Chase & Co, Ninety One UK Ltd, and Lsv Asset Management .
TD SYNNEX Corporation (NYSE:SNX) institutionel ejerskabsstruktur viser aktuelle positioner i virksomheden efter institutioner og fonde, samt seneste ændringer i positionsstørrelse. Større aktionærer kan omfatte individuelle investorer, investeringsforeninger, hedgefonde eller institutioner. Skema 13D angiver, at investoren besidder (eller besidder) mere end 5 % af virksomheden og har til hensigt (eller har til hensigt at) aktivt at forfølge en ændring i forretningsstrategi. Skema 13G indikerer en passiv investering på over 5%.
The share price as of May 1, 2026 is 228,20 / share. Previously, on May 2, 2025, the share price was 114,44 / share. This represents an increase of 99,41% over that period.

Fondens stemningsscore
Fund Sentiment Score (fka Ownership Accumulation Score) finder de aktier, der bliver mest købt af fonde. Det er resultatet af en sofistikeret, multi-faktor kvantitativ model, der identificerer virksomheder med de højeste niveauer af institutionel akkumulering. Scoringsmodellen bruger en kombination af den samlede stigning i oplyste ejere, ændringerne i porteføljeallokeringer i disse ejere og andre målinger. Tallet går fra 0 til 100, hvor højere tal indikerer et højere niveau af akkumulering for sine jævnaldrende, og 50 er gennemsnittet.
Opdateringsfrekvens: Dagligt
Se Ownership Explorer, som giver en liste over højest rangerende virksomheder.
AI+ Ask Fintel’s AI assistant about TD SYNNEX Corporation.
Select a question to share a public post with an AI-crafted answer.
Thinking of good questions…
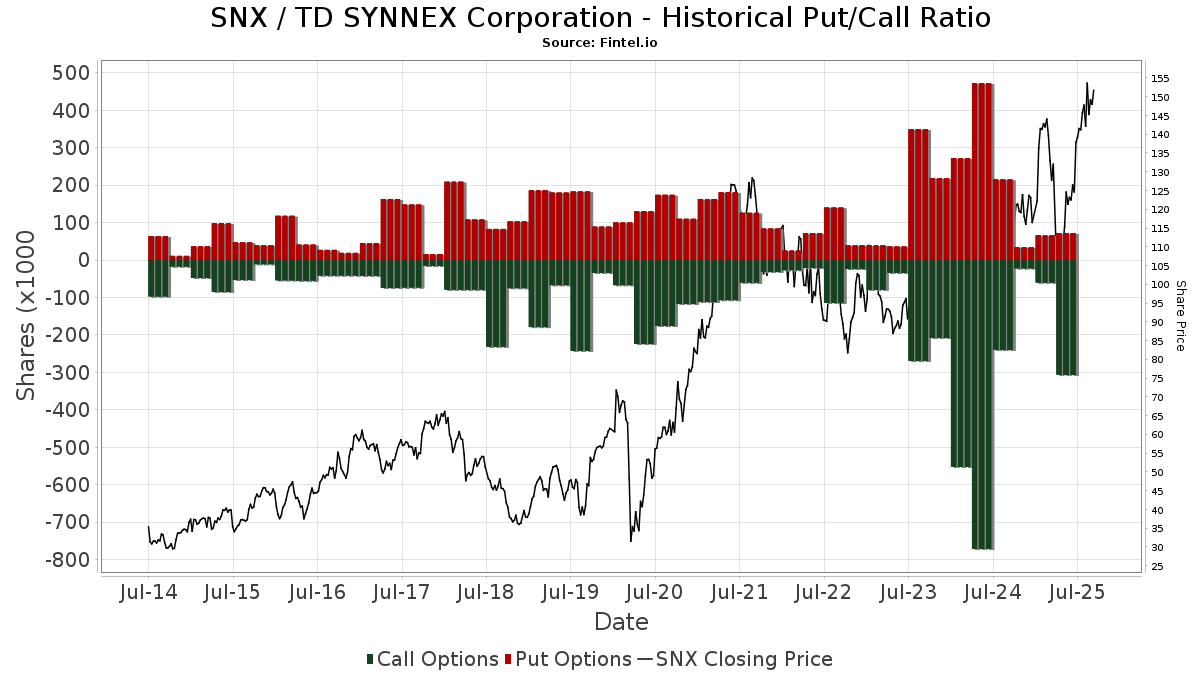
Institutionel Put/Call-forhold
Ud over at indberette standardaktie- og gældsudstedelser skal institutter med mere end 100 mill. aktiver under forvaltning også oplyse deres put- og call-optionsbeholdninger. Da salgsoptioner generelt indikerer negativ stemning, og købsoptioner indikerer positiv stemning, kan vi få en fornemmelse af den overordnede institutionelle stemning ved at plotte forholdet mellem put og kald. Diagrammet til højre viser det historiske put/call-forhold for dette instrument.
Brug af Put/Call Ratio som en indikator for investorernes stemning overvinder en af de vigtigste mangler ved at bruge totalt institutionelt ejerskab, som er, at en betydelig mængde af aktiver under forvaltning investeres passivt for at spore indekser. Passivt forvaltede fonde køber typisk ikke optioner, så indikatoren for put/call-forholdet følger mere nøje følelsen af aktivt forvaltede fonde.
13D/G-arkivering
Vi præsenterer 13D/G ansøgninger separat fra 13F ansøgninger på grund af den forskellige behandling af SEC. 13D/G-ansøgninger kan indgives af grupper af investorer (med én ledende), hvorimod 13F-ansøgninger ikke kan. Dette resulterer i situationer, hvor en investor kan indsende en 13D/G, der rapporterer én værdi for de samlede aktier (der repræsenterer alle de aktier, der ejes af investorgruppen), men derefter indsender en 13F, der rapporterer en anden værdi for de samlede aktier (der udelukkende repræsenterer deres egne) ejendomsret). Det betyder, at aktieejerskab af 13D/G-arkiver og 13F-arkiveringer ofte ikke er direkte sammenlignelige, så vi præsenterer dem separat.
Bemærk: Fra den 16. maj 2021 viser vi ikke længere ejere, der ikke har indsendt en 13D/G inden for det seneste år. Tidligere viste vi den fulde historie af 13D/G-arkiver. Generelt skal enheder, der er forpligtet til at indgive 13D/G-ansøgninger, indgive mindst årligt, før de indsender en afsluttende ansøgning. Dog forlader fonde nogle gange positioner uden at indsende en afsluttende ansøgning (dvs. de afvikler), så visning af den fulde historie resulterede nogle gange i forvirring om det nuværende ejerskab. For at undgå forvirring viser vi nu kun 'aktuelle' ejere - det vil sige - ejere, der har anmeldt inden for det seneste år.
Upgrade to unlock premium data.
| Fil dato | Form | Investor | Forrige Aktier |
Seneste Aktier |
Δ Aktier (Procent) |
Ejendomsret (Procent) |
Δ Ejerskab (Procent) |
|
|---|---|---|---|---|---|---|---|---|
| 2026-04-29 | VANGUARD PORTFOLIO MANAGEMENT LLC | 4,182,115 | 5.18 | |||||
| 2026-03-27 | VANGUARD GROUP INC | 8,274,403 | 0 | -100.00 | 0.00 | -100.00 | ||
| 2026-02-05 | FMR LLC | 6,482,929 | 4,909,593 | -24.27 | 6.00 | -24.05 | ||
| 2026-02-04 | MiTAC Holdings Corp. | 8,796,063 | 3,467,878 | -60.57 | 4.30 | |||
| 2025-10-24 | JPMORGAN CHASE & CO | 4,218,793 | 3,851,860 | -8.70 | 4.70 | -7.84 |
13F og NPORT arkivering
Detaljer om 13F-arkivering er gratis. Detaljer om NP-ansøgninger kræver et premium-medlemskab. Grønne rækker angiver nye positioner. Røde rækker angiver lukkede positioner. Klik på linket ikon for at se den fulde transaktionshistorik.
Opgrader
for at låse premium-data op og eksportere til Excel ![]() .
.
| Fil dato | Kilde | Investor | Type | Gennemsnitlig pris (Øst) |
Aktier | Δ Aktier (%) |
Rapporteret Værdi ($1000) |
Δ Værdi (%) |
Port Alloc (%) |
|
|---|---|---|---|---|---|---|---|---|---|---|
| 2026-02-12 | 13F | Alps Advisors Inc | 125.448 | -5,81 | 18.846 | -13,58 | ||||
| 2026-04-21 | 13F | Foster & Motley Inc | 38.667 | 3,42 | 7 | 20,00 | ||||
| 2026-04-27 | 13F | Turtle Creek Wealth Advisors, LLC | 1.847 | 4,06 | 312 | 16,92 | ||||
| 2026-02-04 | 13F | Versor Investments LP | 0 | -100,00 | 0 | |||||
| 2026-02-11 | 13F | Simplex Trading, Llc | Put | 0 | -100,00 | 0 | ||||
| 2026-02-13 | 13F | Bridgefront Capital, LLC | 0 | -100,00 | 0 | |||||
| 2026-02-12 | 13F | Federation des caisses Desjardins du Quebec | 18.561 | 9,55 | 2.788 | 0,50 | ||||
| 2026-02-17 | 13F | Glenmede Trust Co Na | 0 | -100,00 | 0 | |||||
| 2025-11-13 | 13F | Fuller & Thaler Asset Management, Inc. | 0 | -100,00 | 0 | -100,00 | ||||
| 2026-02-17 | 13F | Shelton Capital Management | 2.499 | -6,47 | 375 | -14,19 | ||||
| 2026-02-11 | 13F | Simplex Trading, Llc | 0 | -100,00 | 0 | -100,00 | ||||
| 2026-01-30 | 13F | Turning Point Benefit Group, Inc. | 2 | 0,00 | 0 | |||||
| 2026-02-13 | 13F | Blueshift Asset Management, LLC | 3.982 | 598 | ||||||
| 2026-04-30 | 13F | Sumitomo Mitsui Trust Holdings, Inc. | 0 | -100,00 | 0 | |||||
| 2026-02-17 | 13F | one8zero8, LLC | 3.750 | 0,00 | 563 | -8,31 | ||||
| 2025-11-07 | 13F | Main Street Group, LTD | 0 | -100,00 | 0 | |||||
| 2026-02-13 | 13F | Martin & Co Inc /tn/ | 30.911 | 3,63 | 4.644 | -4,93 | ||||
| 2025-11-13 | 13F | Quadrature Capital Ltd | 0 | -100,00 | 0 | -100,00 | ||||
| 2026-02-17 | 13F | Laird Norton Trust Company, Llc | 25.969 | 3.901 | ||||||
| 2026-02-13 | 13F | Natixis | 34.655 | 5.206 | ||||||
| 2026-02-13 | 13F | Walleye Capital LLC | Put | 0 | -100,00 | 0 | -100,00 | |||
| 2026-02-13 | 13F | Mml Investors Services, Llc | 3.572 | 22,75 | 537 | 12,61 | ||||
| 2026-02-05 | 13F | High Note Wealth, LLC | 29 | 0,00 | 4 | 0,00 | ||||
| 2026-04-15 | 13F | Badgley Phelps Wealth Managers, LLC | 49.126 | 10,06 | 8.288 | 23,61 | ||||
| 2026-04-20 | 13F | State of Alaska, Department of Revenue | 48.498 | 0,00 | 8 | 14,29 | ||||
| 2026-04-22 | 13F | Parcion Private Wealth LLC | 16.085 | 4,14 | 2.714 | 16,94 | ||||
| 2026-04-24 | 13F | Essex Financial Services, Inc. | 1.957 | 2,95 | 330 | 15,79 | ||||
| 2025-11-14 | 13F | Point72 Europe (London) LLP | 502 | 82 | ||||||
| 2026-02-18 | 13F | Vident Advisory, LLC | 34.926 | 28,22 | 5.247 | 17,62 | ||||
| 2026-02-06 | 13F | Cullen/frost Bankers, Inc. | 424 | 0,00 | 64 | -8,70 | ||||
| 2026-02-12 | 13F | Campbell & CO Investment Adviser LLC | 39.707 | 173,13 | 5.965 | 150,63 | ||||
| 2026-02-17 | 13F | Algert Global Llc | 118.570 | 171,95 | 18 | 142,86 | ||||
| 2026-02-05 | 13F | Elyxium Wealth, LLC | 48 | 7 | ||||||
| 2026-02-13 | 13F | Morgan Stanley | 676.741 | -13,26 | 101.667 | -20,42 | ||||
| 2026-02-13 | 13F | Johnson Investment Counsel Inc | 0 | -100,00 | 0 | |||||
| 2026-02-17 | 13F | Sagewood Asset Management LP | 3.792 | 570 | ||||||
| 2026-04-15 | 13F | Curbstone Financial Management Corp | 2.800 | 0,00 | 472 | 12,38 | ||||
| 2026-02-11 | 13F | Erste Asset Management GmbH | 0 | 0 | ||||||
| 2026-04-06 | 13F | GAMMA Investing LLC | 1.426 | 8,11 | 241 | 21,21 | ||||
| 2026-02-05 | 13F | New York Life Investment Management Llc | 6.504 | -12,02 | 977 | -19,26 | ||||
| 2026-02-17 | 13F | Balyasny Asset Management Llc | 64.838 | 12,92 | 9.741 | 3,59 | ||||
| 2026-02-13 | 13F | Sei Investments Co | 437.181 | 194,80 | 65.674 | 170,43 | ||||
| 2026-02-17 | 13F | Dv Equities, Llc | 0 | 0 | ||||||
| 2026-04-10 | 13F | Abound Wealth Management | 128 | 0,00 | 22 | 10,53 | ||||
| 2026-02-17 | 13F | Ancora Advisors, LLC | 154 | 23 | ||||||
| 2026-04-16 | 13F | Stanley-Laman Group, Ltd. | 24.459 | 4,57 | 4.126 | 17,45 | ||||
| 2026-01-28 | 13F | Geneos Wealth Management Inc. | 0 | -100,00 | 0 | -100,00 | ||||
| 2026-02-13 | 13F | Treasurer of the State of North Carolina | 64.955 | -4,19 | 10 | -18,18 | ||||
| 2026-02-10 | 13F | Rothschild Investment Llc | 1.172 | 41,55 | 176 | 30,37 | ||||
| 2026-01-28 | 13F | Universal- Beteiligungs- und Servicegesellschaft mbH | 67.521 | 44,57 | 10.186 | 33,19 | ||||
| 2026-01-29 | 13F | Sanctuary Advisors, LLC | 5.454 | 2,94 | 819 | -5,54 | ||||
| 2026-04-15 | 13F | Fortitude Family Office, LLC | 72 | 118,18 | 12 | 200,00 | ||||
| 2026-02-11 | 13F | Franklin Resources Inc | 28.232 | 48,25 | 4.241 | 36,02 | ||||
| 2026-04-15 | 13F | Merit Financial Group, LLC | 6.765 | 92,02 | 1.141 | 115,69 | ||||
| 2026-02-09 | 13F | Geode Capital Management, Llc | 1.532.784 | 6,91 | 230.315 | -1,91 | ||||
| 2025-11-14 | 13F | Ilex Capital Partners (UK) LLP | 0 | -100,00 | 0 | |||||
| 2026-04-30 | 13F | Hsbc Holdings Plc | 6.882 | -78,73 | 1.160 | -76,30 | ||||
| 2026-02-13 | 13F | First Trust Advisors Lp | 186.544 | -25,16 | 28.025 | -31,34 | ||||
| 2026-02-06 | 13F | Vestmark Advisory Solutions, Inc. | 13.408 | 2.014 | ||||||
| 2026-02-12 | 13F | Principal Securities, Inc. | 0 | -100,00 | 0 | |||||
| 2026-04-22 | 13F | KG&L Capital Management,LLC | 0 | -100,00 | 0 | |||||
| 2026-04-23 | 13F | Oppenheimer Asset Management Inc. | 6.918 | -17,09 | 1.167 | -6,86 | ||||
| 2026-01-26 | 13F | Cwm, Llc | 7.095 | 474,03 | 1 | |||||
| 2026-02-03 | 13F | Denali Advisors Llc | 2.507 | 377 | ||||||
| 2026-02-13 | 13F | Solstein Capital, LLC | 38 | 0,00 | 6 | -16,67 | ||||
| 2026-02-17 | 13F | Aqr Capital Management Llc | 934.772 | 141,80 | 140.431 | 121,83 | ||||
| 2026-01-30 | 13F | State of New Jersey Common Pension Fund D | 23.135 | -5,89 | 3.476 | -13,66 | ||||
| 2026-02-13 | 13F | Commerce Bank | 3.957 | 193,55 | 594 | 170,00 | ||||
| 2026-02-11 | 13F | O'shaughnessy Asset Management, Llc | 7.942 | 2,57 | 1.193 | -5,84 | ||||
| 2025-11-14 | 13F | Brass Tax Wealth Management, Inc | 1.687 | 0,00 | 276 | 21,05 | ||||
| 2026-02-10 | 13F | Anchor Capital Advisors Llc | 293.565 | -13,77 | 44.102 | -20,89 | ||||
| 2026-02-10 | 13F | Sivia Capital Partners, LLC | 2.745 | 412 | ||||||
| 2026-02-11 | 13F | Brandywine Global Investment Management, LLC | 57.431 | -1,97 | 8.628 | -10,07 | ||||
| 2026-04-08 | 13F | Olistico Wealth, LLC | 12 | 0,00 | 2 | 100,00 | ||||
| 2026-02-12 | 13F | Commonwealth Equity Services, Llc | 5.689 | -12,57 | 855 | 85.300,00 | ||||
| 2026-02-17 | 13F | Aquatic Capital Management LLC | 34.084 | 5.120 | ||||||
| 2026-02-17 | 13F | Utah Retirement Systems | 4.059 | 0,00 | 610 | -8,28 | ||||
| 2026-04-13 | 13F | Wedge Capital Management L L P/nc | 386.903 | -3,29 | 65.274 | 8,60 | ||||
| 2026-02-17 | 13F | XTX Topco Ltd | 3.202 | 481 | ||||||
| 2026-04-29 | 13F | Hughes Financial Services, LLC | 2 | 0 | ||||||
| 2026-02-17 | 13F | California State Teachers Retirement System | 69.877 | -1,53 | 10.498 | -9,66 | ||||
| 2025-11-13 | 13F | Causeway Capital Management Llc | 0 | -100,00 | 0 | -100,00 | ||||
| 2026-02-17 | 13F | Oddo Bhf Asset Management Sas | 0 | -100,00 | 0 | |||||
| 2025-11-12 | 13F | CIBC Bancorp USA Inc. | 1.743 | 285 | ||||||
| 2026-02-17 | 13F | Bank Of America Corp /de/ | 381.603 | 8,86 | 57.328 | -0,13 | ||||
| 2026-02-11 | 13F | Manchester Capital Management LLC | 8 | 1 | ||||||
| 2026-04-17 | 13F | Cidel Asset Management Inc | 1.539 | 260 | ||||||
| 2026-02-10 | 13F | Intech Investment Management Llc | 21.578 | 38,36 | 3.242 | 26,95 | ||||
| 2026-02-13 | 13F | Lord, Abbett & Co. Llc | 465.569 | -5,21 | 70 | -13,75 | ||||
| 2026-02-17 | 13F | Silvercrest Asset Management Group Llc | 725.421 | -3,41 | 108.980 | -11,38 | ||||
| 2026-02-17 | 13F | Trexquant Investment LP | 64.075 | 9.626 | ||||||
| 2026-01-28 | 13F | Quent Long Short Global Small Cap Fund, LP | 1.420 | 213 | ||||||
| 2026-02-17 | 13F | Tower Research Capital LLC (TRC) | 4.896 | 74,30 | 736 | 60,13 | ||||
| 2026-05-01 | 13F | Arizona State Retirement System | 19.816 | -3,25 | 3.343 | 8,68 | ||||
| 2026-01-30 | 13F | NJ State Employees Deferred Compensation Plan | 0 | -100,00 | 0 | |||||
| 2026-05-01 | 13F | Fifth Third Bancorp | 62.705 | 7.009,41 | 10.579 | 7.914,39 | ||||
| 2026-02-17 | 13F | Dark Forest Capital Management Lp | 19.381 | 2.912 | ||||||
| 2026-02-11 | 13F | Deseret Mutual Benefit Administrators | 221 | 0,00 | 33 | -8,33 | ||||
| 2026-04-08 | 13F | NorthCrest Asset Manangement, LLC | 2.407 | 67,39 | 450 | 104,09 | ||||
| 2026-02-10 | 13F | Goldman Sachs Group Inc | 262.413 | 53,76 | 39.422 | 41,06 | ||||
| 2026-02-12 | 13F | Paradigm Capital Management Inc/ny | 81.274 | 0,00 | 12.210 | -8,26 | ||||
| 2026-04-29 | 13F | Police & Firemen's Retirement System of New Jersey | 32.688 | 0,00 | 5.515 | 12,30 | ||||
| 2026-04-24 | 13F | Fulton Bank, N.a. | 3.619 | -1,20 | 611 | 10,91 | ||||
| 2026-04-27 | 13F | HB Wealth Management, LLC | 5.440 | 81,21 | 918 | 103,33 | ||||
| 2026-02-17 | 13F | Engineers Gate Manager LP | 34.738 | 165,03 | 5.219 | 143,15 | ||||
| 2025-11-14 | 13F | Strategic Wealth Partners, Ltd. | 40 | 0,00 | 7 | 20,00 | ||||
| 2026-04-30 | 13F | Cromwell Holdings LLC | 12 | 50,00 | 2 | 100,00 | ||||
| 2026-02-10 | 13F | Thompson Siegel & Walmsley Llc | 351.233 | -4,27 | 53 | -13,33 | ||||
| 2026-02-09 | 13F | Royce & Associates Lp | 63.366 | -11,03 | 9.519 | -18,38 | ||||
| 2026-04-23 | 13F | MQS Management LLC | 0 | -100,00 | 0 | |||||
| 2026-02-17 | 13F | Mercer Global Advisors Inc /adv | 6.490 | 230,45 | 975 | 203,74 | ||||
| 2026-02-17 | 13F | Amundi | 73.703 | 73,37 | 11.072 | 64,96 | ||||
| 2026-04-30 | 13F | Kestra Advisory Services, LLC | 0 | -100,00 | 0 | |||||
| 2026-04-13 | 13F | IFP Advisors, Inc | 423 | 47,39 | 71 | 65,12 | ||||
| 2026-01-23 | 13F | Assetmark, Inc | 980 | -8,07 | 147 | -15,52 | ||||
| 2026-01-08 | 13F | Nordea Investment Management Ab | 504.133 | -20,86 | 76.381 | -27,71 | ||||
| 2026-02-13 | 13F | Boston Partners | 630.396 | -5,79 | 94.743 | -13,61 | ||||
| 2026-04-15 | 13F | Journey Strategic Wealth Llc | 1.783 | 13,21 | 301 | 27,12 | ||||
| 2026-04-30 | 13F | Private Trust Co Na | 907 | 22,24 | 153 | 37,84 | ||||
| 2026-01-26 | 13F | AE Wealth Management LLC | 7.699 | 23,26 | 1.157 | 13,11 | ||||
| 2026-02-10 | 13F | English Capital Management Llc | 36.898 | 0,00 | 5.543 | -8,26 | ||||
| 2026-02-13 | 13F | Umb Bank N A/mo | 828 | -1,19 | 124 | -9,49 | ||||
| 2026-04-29 | 13F | Montag A & Associates Inc | 2.027 | -24,53 | 342 | -15,38 | ||||
| 2026-02-12 | 13F | Andra AP-fonden | 0 | -100,00 | 0 | |||||
| 2026-04-16 | 13F | Beese Fulmer Investment Management, Inc. | 1.826 | 308 | ||||||
| 2026-04-23 | 13F | Forum Financial Management, LP | 0 | -100,00 | 0 | |||||
| 2026-04-24 | 13F | Yousif Capital Management, Llc | 23.850 | -5,07 | 4.024 | 9,47 | ||||
| 2026-04-22 | 13F | Sterling Capital Management LLC | 2.575 | -43,03 | 434 | -36,08 | ||||
| 2026-02-13 | 13F | Public Employees Retirement Association Of Colorado | 5.831 | 0,00 | 1 | |||||
| 2026-02-17 | 13F | Css Llc/il | 8.336 | 6,11 | 1.252 | -2,64 | ||||
| 2026-05-01 | 13F | Hantz Financial Services, Inc. | 1.760 | 52,65 | 0 | |||||
| 2025-11-13 | 13F | Total Investment Management Inc | 0 | -100,00 | 0 | |||||
| 2026-02-17 | 13F | Hancock Whitney Corp | 2.222 | -1,55 | 334 | -9,76 | ||||
| 2026-02-12 | 13F | Voya Investment Management Llc | 29.974 | -16,14 | 4.503 | -23,07 | ||||
| 2026-02-13 | 13F | Goodnow Investment Group, Llc | 0 | -100,00 | 0 | |||||
| 2026-04-30 | 13F | Cedar Mountain Advisors, LLC | 25 | 4 | ||||||
| 2025-12-29 | 13F | Cape Investment Advisory, Inc. | 0 | -100,00 | 0 | |||||
| 2026-05-01 | 13F | Avion Wealth | 3 | 0 | ||||||
| 2026-02-13 | 13F | JustInvest LLC | 10.644 | -4,98 | 1.599 | -12,81 | ||||
| 2026-02-17 | 13F | Guggenheim Capital Llc | 1.689 | -49,31 | 254 | -53,58 | ||||
| 2025-11-14 | 13F | Quantessence Capital LLC | 0 | -100,00 | 0 | |||||
| 2026-04-23 | 13F | Impact Partnership Wealth, LLC | 5.980 | 1.009 | ||||||
| 2026-02-17 | 13F | Occudo Quantitative Strategies Lp | 6.063 | 911 | ||||||
| 2026-02-17 | 13F | Tudor Investment Corp Et Al | 6.604 | 992 | ||||||
| 2026-04-24 | 13F | Profund Advisors Llc | 1.365 | -11,25 | 230 | -0,43 | ||||
| 2026-04-15 | 13F | Activest Wealth Management | 4.571 | 1,29 | 771 | 13,88 | ||||
| 2026-02-13 | 13F | Bridgewater Associates, LP | 107.375 | 100,63 | 16.131 | 84,07 | ||||
| 2026-02-17 | 13F | Sciencast Management LP | 1.889 | 284 | ||||||
| 2026-02-13 | 13F | Rafferty Asset Management, LLC | 0 | -100,00 | 0 | |||||
| 2026-01-28 | 13F | Ruffer LLP | 36.770 | 35,21 | 5.532 | 24,26 | ||||
| 2026-02-13 | 13F | Schroder Investment Management Group | 53.114 | 336,43 | 8.099 | 300,89 | ||||
| 2026-02-02 | 13F | Principal Financial Group Inc | 632.701 | -2,22 | 95.053 | -10,29 | ||||
| 2026-04-08 | 13F | DiNuzzo Private Wealth, Inc. | 17 | 0,00 | 3 | 0,00 | ||||
| 2026-02-13 | 13F | Charles Schwab Investment Management Inc | 597.099 | 2,28 | 89.702 | -6,17 | ||||
| 2026-04-23 | 13F | North Star Investment Management Corp. | 14 | 2 | ||||||
| 2026-02-17 | 13F | Brave Warrior Advisors, LLC | 3.163.239 | -3,42 | 475.213 | -11,40 | ||||
| 2026-02-09 | 13F | Atlantic Trust, LLC | 40 | 14,29 | 6 | 20,00 | ||||
| 2025-11-10 | 13F | Stevens Capital Management Lp | 0 | -100,00 | 0 | |||||
| 2026-02-12 | 13F | Ensign Peak Advisors, Inc | 3.689 | -69,23 | 554 | -71,78 | ||||
| 2026-02-17 | 13F | Captrust Financial Advisors | 10.613 | 21,50 | 1.594 | 11,47 | ||||
| 2026-02-02 | 13F | Danske Bank A/s | 600 | 0,00 | 90 | -8,16 | ||||
| 2026-02-17 | 13F | Optiver Holding B.V. | 0 | -100,00 | 0 | |||||
| 2026-04-02 | 13F | Ares Financial Consulting, LLC | 105 | 377,27 | 20 | 533,33 | ||||
| 2026-01-28 | 13F | CAPROCK Group, Inc. | 1.401 | 210 | ||||||
| 2025-11-17 | 13F | Morningstar Investment Management LLC | 0 | -100,00 | 0 | |||||
| 2026-02-13 | 13F | Verition Fund Management LLC | 13.962 | -25,05 | 2.098 | -31,25 | ||||
| 2026-02-06 | 13F | Tortoise Investment Management, LLC | 0 | -100,00 | 0 | |||||
| 2026-02-10 | 13F | Bank of New York Mellon Corp | 595.125 | -11,17 | 89.406 | -18,50 | ||||
| 2026-02-13 | 13F | Truvestments Capital Llc | 7.000 | 13,20 | 1.052 | 3,85 | ||||
| 2026-02-17 | 13F | Advisory Services Network, LLC | 1.495 | 6,86 | 225 | -2,18 | ||||
| 2026-02-17 | 13F | Twinbeech Capital Lp | 59.000 | 8.864 | ||||||
| 2026-04-30 | 13F | First Horizon Corp | 2.875 | 11,65 | 485 | 25,65 | ||||
| 2026-01-27 | 13F | WealthCollab, LLC | 24 | 0,00 | 4 | 0,00 | ||||
| 2025-11-07 | 13F | Shell Asset Management Co | 99 | -69,82 | 0 | |||||
| 2026-02-06 | 13F | EverSource Wealth Advisors, LLC | 921 | 18,08 | 138 | 8,66 | ||||
| 2026-02-12 | 13F | Jane Street Group, Llc | Call | 23.700 | -59,42 | 3.560 | -62,77 | |||
| 2026-02-10 | 13F | Eurizon Capital SGR S.p.A. | 1.294 | 196 | ||||||
| 2026-02-12 | 13F | Jane Street Group, Llc | 584.751 | 613,29 | 87.847 | 554,40 | ||||
| 2026-02-12 | 13F | Hilton Capital Management, LLC | 20.378 | 10,96 | 3.061 | 1,80 | ||||
| 2026-02-12 | 13F | Bank Of Montreal /can/ | 161.624 | 1.998,74 | 24.281 | 1.825,46 | ||||
| 2026-02-17 | 13F | Aster Capital Management (DIFC) Ltd | 185 | 28 | ||||||
| 2026-02-12 | 13F | Jane Street Group, Llc | Put | 20.200 | 392,68 | 3.035 | 352,16 | |||
| 2026-04-07 | 13F | Signaturefd, Llc | 1.026 | 0,49 | 173 | 13,07 | ||||
| 2026-02-17 | 13F | IHT Wealth Management, LLC | 1.676 | -2,10 | 252 | -10,36 | ||||
| 2026-02-05 | 13F | Qsemble Capital Management, LP | 29.913 | 4.494 | ||||||
| 2026-02-13 | 13F | Arrowstreet Capital, Limited Partnership | 0 | -100,00 | 0 | |||||
| 2026-02-17 | 13F | Susquehanna International Group, Llp | Call | 2.800 | -82,93 | 421 | -84,36 | |||
| 2026-04-20 | 13F | Ronald Blue Trust, Inc. | 656 | 36,67 | 111 | 52,78 | ||||
| 2026-02-11 | 13F | Group One Trading, L.p. | Call | 0 | -100,00 | 0 | ||||
| 2026-04-17 | 13F | Guyasuta Investment Advisors Inc | 5.915 | 0,00 | 998 | 12,27 | ||||
| 2026-02-17 | 13F | Susquehanna International Group, Llp | 9.647 | -89,87 | 1.449 | -90,71 | ||||
| 2026-04-24 | 13F | Key FInancial Inc | 7 | 0,00 | 1 | 0,00 | ||||
| 2026-02-17 | 13F | Susquehanna International Group, Llp | Put | 2.800 | -82,72 | 421 | -84,16 | |||
| 2026-01-29 | 13F | RMG Wealth Management LLC | 25 | 4 | ||||||
| 2026-04-15 | 13F | Exchange Traded Concepts, Llc | 30.378 | 5.125 | ||||||
| 2026-04-30 | 13F | Arista Wealth Management, LLC | 3.288 | 0,00 | 555 | 12,37 | ||||
| 2026-04-16 | 13F | SG Americas Securities, LLC | 125.141 | 65,34 | 21 | 90,91 | ||||
| 2026-04-22 | 13F | Pictet Asset Management Holding SA | 11.585 | 5,96 | 1.955 | 19,00 | ||||
| 2026-02-13 | 13F | State Street Corp | 2.329.784 | -1,81 | 350.003 | -9,92 | ||||
| 2026-04-24 | 13F | Ninety One North America, Inc. | 21.695 | 0,67 | 3.660 | 13,07 | ||||
| 2026-02-13 | 13F | Caitong International Asset Management Co., Ltd | 33 | 5 | ||||||
| 2026-02-13 | 13F | Icon Advisers Inc/co | 20.320 | -4,02 | 3.053 | -11,94 | ||||
| 2026-04-30 | 13F | Costello Asset Management, INC | 100 | 0,00 | 17 | 6,67 | ||||
| 2026-02-06 | 13F | GPS Wealth Strategies Group, LLC | 21 | 0,00 | 3 | 0,00 | ||||
| 2026-02-17 | 13F | Numerai GP LLC | 1.866 | 280 | ||||||
| 2026-02-24 | 13F/A | Pacer Advisors, Inc. | 8.897 | -45,60 | 1.337 | -50,11 | ||||
| 2026-04-20 | 13F | Yorktown Management & Research Co Inc | 2.700 | 0,00 | 456 | 12,35 | ||||
| 2026-02-13 | 13F | Ossiam | 120 | -26,83 | 18 | -30,77 | ||||
| 2026-02-17 | 13F | Boothbay Fund Management, Llc | 1.930 | 290 | ||||||
| 2026-02-17 | 13F | J. Goldman & Co LP | 0 | -100,00 | 0 | |||||
| 2026-02-12 | 13F | Advisors Asset Management, Inc. | 16.249 | 0,19 | 2.441 | -8,06 | ||||
| 2026-02-11 | 13F | MCF Advisors LLC | 85 | 0,00 | 13 | -7,69 | ||||
| 2026-02-12 | 13F | Rossby Financial, LCC | 10 | 2 | ||||||
| 2025-11-03 | 13F | Mirae Asset Global Investments Co., Ltd. | 0 | -100,00 | 0 | |||||
| 2026-04-27 | 13F | Leonteq Securities AG | 4 | 33,33 | 1 | |||||
| 2026-02-17 | 13F | Cresset Asset Management, LLC | 3.445 | -1,43 | 518 | -9,62 | ||||
| 2026-02-13 | 13F | Cynosure Management, Llc | 2.878 | -24,06 | 432 | -30,32 | ||||
| 2026-02-13 | 13F | Colony Group, LLC | 1.622 | 244 | ||||||
| 2026-04-22 | 13F | Motco | 0 | -100,00 | 0 | |||||
| 2026-02-17 | 13F | Lombard Odier Asset Management (USA) Corp | 3.339 | -50,05 | 502 | -54,20 | ||||
| 2026-02-13 | 13F | Transamerica Financial Advisors, Inc. | 7 | 1 | ||||||
| 2026-02-11 | 13F | Cerity Partners LLC | 19.732 | 165,22 | 2.964 | 143,35 | ||||
| 2026-01-06 | 13F | Ransom Advisory, Ltd | 219 | 0,00 | 33 | -8,57 | ||||
| 2026-02-17 | 13F | Verdad Advisers, LP | 0 | -100,00 | 0 | |||||
| 2026-01-27 | 13F | Asset Management One Co., Ltd. | 10.387 | 0,00 | 1.592 | -6,35 | ||||
| 2026-02-17 | 13F | Frontier Capital Management Co Llc | 306.058 | -5,91 | 45.979 | -13,67 | ||||
| 2026-02-13 | 13F | Centiva Capital, LP | 2.937 | 441 | ||||||
| 2025-11-06 | 13F | Ameritas Advisory Services, LLC | 0 | -100,00 | 0 | -100,00 | ||||
| 2026-04-27 | 13F | New York State Teachers Retirement System | 78.201 | -3,32 | 13 | 8,33 | ||||
| 2026-04-30 | 13F | Nuveen, LLC | 1.045.845 | -7,94 | 176.445 | 3,38 | ||||
| 2026-02-17 | 13F | Redwood Investment Management, Llc | 0 | -100,00 | 0 | |||||
| 2026-02-17 | 13F | SageView Advisory Group, LLC | 60 | 9 | ||||||
| 2026-04-13 | 13F | Highland Capital Management, Llc | 3.402 | 49,47 | 574 | 68,04 | ||||
| 2026-01-08 | 13F | Maridea Wealth Management LLC | 0 | -100,00 | 0 | |||||
| 2026-02-04 | 13F | Dogwood Wealth Management LLC | 0 | 0 | ||||||
| 2026-01-28 | 13F | Chicago Partners Investment Group LLC | 1.398 | 214 | ||||||
| 2026-02-12 | 13F | Clark Estates Inc/ny | 17.299 | 0,00 | 2.599 | -8,26 | ||||
| 2026-04-17 | 13F | Krilogy Financial LLC | 1.581 | 330 | ||||||
| 2026-04-07 | 13F | CoreCap Advisors, LLC | 12 | 9,09 | 2 | 100,00 | ||||
| 2026-04-08 | 13F | Wealth Enhancement Advisory Services, Llc | 21.912 | 106,25 | 3.646 | 125,70 | ||||
| 2026-02-17 | 13F | Two Sigma Investments, Lp | 13.849 | 225,63 | 2.081 | 198,85 | ||||
| 2026-02-09 | 13F | Accent Capital Management, LLC | 0 | -100,00 | 0 | |||||
| 2026-04-13 | 13F | Mather Group, Llc. | 69 | 12 | ||||||
| 2026-01-16 | 13F | Longboard Asset Management, LP | 0 | -100,00 | 0 | |||||
| 2026-04-13 | 13F | Artemis Investment Management LLP | 14.185 | 7,36 | 2.393 | 20,61 | ||||
| 2026-02-12 | 13F | Elo Mutual Pension Insurance Co | 21.765 | 22,74 | 3.270 | 12,61 | ||||
| 2026-01-29 | 13F | Quest 10 Wealth Builders, Inc. | 39 | 18,18 | 6 | 0,00 | ||||
| 2026-02-13 | 13F | Parkside Financial Bank & Trust | 76 | 18,75 | 11 | 10,00 | ||||
| 2026-02-17 | 13F | Two Sigma Securities, Llc | 3.336 | 501 | ||||||
| 2026-02-05 | 13F | Baader Bank INC | 3.210 | 482 | ||||||
| 2026-02-11 | 13F | Ameritas Investment Partners, Inc. | 13.880 | 2.085 | ||||||
| 2026-02-13 | 13F | Smartleaf Asset Management LLC | 470 | 97,48 | 72 | 82,05 | ||||
| 2026-02-17 | 13F | United Capital Financial Advisers, Llc | 0 | -100,00 | 0 | |||||
| 2026-02-12 | 13F | California Public Employees Retirement System | 221.699 | -13,85 | 33.306 | -20,97 | ||||
| 2026-03-09 | 13F | EMC Capital Management | 1.191 | -14,99 | 0 | |||||
| 2026-04-13 | 13F | St Germain D J Co Inc | 56 | 0,00 | 9 | 12,50 | ||||
| 2025-11-14 | 13F | Wetherby Asset Management Inc | 25.665 | 1.145,27 | 4.203 | 1.406,09 | ||||
| 2026-04-23 | 13F | Harbor Investment Advisory, Llc | 96 | 0,00 | 16 | 14,29 | ||||
| 2026-04-24 | 13F | Root Financial Partners, LLC | 821 | 177,36 | 139 | 213,64 | ||||
| 2026-04-13 | 13F | Trust Co | 2 | 0,00 | 0 | |||||
| 2026-01-28 | 13F | DekaBank Deutsche Girozentrale | 8.595 | 0,00 | 1 | 0,00 | ||||
| 2026-04-22 | 13F | Pinnacle Bancorp, Inc. | 34 | 0,00 | 6 | 0,00 | ||||
| 2026-04-20 | 13F | Hilton Head Capital Partners, LLC | 215 | -18,25 | 36 | -7,69 | ||||
| 2026-02-13 | 13F | Victory Capital Management Inc | 228.225 | -68,66 | 34.286 | -71,25 | ||||
| 2026-02-12 | 13F | Loomis Sayles & Co L P | 271.671 | -10,44 | 40.813 | -17,83 | ||||
| 2026-03-16 | 13F/A | Rockefeller Capital Management L.P. | 81.239 | -32,92 | 12.205 | -38,46 | ||||
| 2026-04-21 | 13F | Unique Wealth, Llc | 1.333 | 0,00 | 225 | 12,00 | ||||
| 2026-02-18 | 13F/A | Empowered Funds, LLC | 74.753 | -43,84 | 11.230 | -48,47 | ||||
| 2026-04-20 | 13F | Foster Victor Wealth Advisors, LLC | 2.221 | -12,94 | 455 | 18,85 | ||||
| 2026-01-26 | 13F | Thomasville National Bank | 0 | -100,00 | 0 | |||||
| 2026-02-12 | 13F | Xponance, Inc. | 8.966 | -14,16 | 1.347 | -21,29 | ||||
| 2026-02-05 | 13F | Amalgamated Bank | 34.131 | -2,61 | 5 | 0,00 | ||||
| 2026-02-17 | 13F | Abrams Bison Investments, Llc | 2.477.000 | -4,85 | 372.120 | -12,71 | ||||
| 2026-02-05 | 13F | North Dakota State Investment Board | 2.727 | 410 | ||||||
| 2026-04-29 | 13F | Skopos Labs, Inc. | 2.934 | 65,39 | 495 | 82,29 | ||||
| 2026-02-13 | 13F | Kennedy Capital Management, Inc. | 137.877 | -11,36 | 20.713 | -18,68 | ||||
| 2026-02-12 | 13F | Dimensional Fund Advisors Lp | 2.704.033 | -0,55 | 406.240 | -8,76 | ||||
| 2026-02-17 | 13F | Point72 Asset Management, L.P. | 237.324 | 552,11 | 35.653 | 498,31 | ||||
| 2026-04-21 | 13F | GHP Investment Advisors, Inc. | 16.903 | 5,37 | 2.852 | 18,35 | ||||
| 2026-02-17 | 13F | Quantinno Capital Management LP | 50.938 | 18,54 | 7.653 | 8,75 | ||||
| 2026-02-05 | 13F | Gamco Investors, Inc. Et Al | 4.615 | -1,87 | 693 | -10,00 | ||||
| 2026-02-17 | 13F | Jones Financial Companies Lllp | 801 | 3,35 | 120 | -5,51 | ||||
| 2026-01-30 | 13F | Us Bancorp \de\ | 6.042 | -6,43 | 908 | -14,19 | ||||
| 2026-02-09 | 13F | Legal & General Group Plc | 137.152 | -23,38 | 20.604 | -29,70 | ||||
| 2026-02-13 | 13F | Marshall Wace, Llp | 2.324 | 349 | ||||||
| 2026-02-13 | 13F | American Century Companies Inc | 235.503 | -18,10 | 35.380 | -24,86 | ||||
| 2026-02-17 | 13F | Jump Financial, LLC | 132.047 | 19.837 | ||||||
| 2026-02-11 | 13F | Meeder Asset Management Inc | 6.183 | 929 | ||||||
| 2026-02-11 | 13F | Los Angeles Capital Management Llc | 150.030 | 395,34 | 23.322 | 370,30 | ||||
| 2026-04-10 | 13F | Quaker Wealth Management, LLC | 2 | 0,00 | 0 | |||||
| 2026-02-13 | 13F | Financial Network Wealth Advisors LLC | 8 | 0,00 | 1 | 0,00 | ||||
| 2026-02-13 | 13F | Cornerstone Financial Management LLC | 6 | 1 | ||||||
| 2026-02-13 | 13F | Ubs Asset Management Americas Inc | 202.703 | -7,37 | 30.452 | -15,01 | ||||
| 2026-02-09 | 13F | Hartland & Co., LLC | 303 | 158,97 | 46 | 136,84 | ||||
| 2026-04-17 | 13F | CENTRAL TRUST Co | 119 | -3,25 | 20 | 11,11 | ||||
| 2026-02-10 | 13F | Ellevest, Inc. | 1.559 | -7,86 | 234 | -15,52 | ||||
| 2026-02-17 | 13F | Alliancebernstein L.p. | 743.182 | 6,45 | 111.648 | -2,34 | ||||
| 2025-11-07 | 13F | Atticus Wealth Management, Llc | 0 | -100,00 | 0 | |||||
| 2026-04-06 | 13F | Versant Capital Management, Inc | 195 | 12,72 | 33 | 28,00 | ||||
| 2026-04-28 | 13F | Quent Capital, LLC | 740 | -47,89 | 125 | -41,78 | ||||
| 2026-04-30 | 13F | River Road Asset Management, LLC | 281.448 | -4,31 | 47.483 | 7,47 | ||||
| 2026-02-12 | 13F | Ci Investments Inc. | 0 | -100,00 | 0 | |||||
| 2026-04-28 | 13F | Bogart Wealth, LLC | 5 | 1 | ||||||
| 2025-11-06 | 13F | Abich Financial Wealth Management LLC | 0 | -100,00 | 0 | |||||
| 2026-02-11 | 13F | Allianz Asset Management GmbH | 170.368 | 25.594 | ||||||
| 2025-11-04 | 13F | Pineridge Advisors LLC | 20 | -62,96 | 3 | -57,14 | ||||
| 2026-02-10 | 13F | Kesler, Norman & Wride, LLC | 8.520 | 34,07 | 1.280 | 71,68 | ||||
| 2026-02-10 | 13F | Ritter Daniher Financial Advisory LLC / DE | 82 | 0,00 | 12 | -7,69 | ||||
| 2025-11-14 | 13F | Verition Fund Management LLC | Put | 0 | -100,00 | 0 | -100,00 | |||
| 2026-02-09 | 13F | AIA Group Ltd | 0 | -100,00 | 0 | |||||
| 2026-04-17 | 13F | Bell Investment Advisors, Inc | 99 | 0,00 | 17 | 14,29 | ||||
| 2026-04-21 | 13F | One Wealth Advisors, LLC | 1.671 | 282 | ||||||
| 2026-05-01 | 13F | Securian Asset Management, Inc | 5.519 | 0,00 | 931 | 12,30 | ||||
| 2026-02-13 | 13F | Panagora Asset Management Inc | 262.229 | 115,81 | 39.395 | 97,99 | ||||
| 2026-04-27 | 13F | Ethic Inc. | 10.633 | -6,03 | 1.794 | 5,53 | ||||
| 2026-02-17 | 13F | Voloridge Investment Management, Llc | 57.037 | 8.569 | ||||||
| 2026-02-17 | 13F | Northern Trust Corp | 625.950 | -3,66 | 94.036 | -11,62 | ||||
| 2026-02-17 | 13F | Khrom Capital Management Llc | 547.337 | 0,00 | 82.226 | -8,26 | ||||
| 2025-11-14 | 13F | Wolverine Trading, Llc | 3.789 | 629 | ||||||
| 2025-11-14 | 13F | Wolverine Trading, Llc | Call | 4.800 | -70,19 | 797 | -63,30 | |||
| 2025-11-14 | 13F | Wolverine Trading, Llc | Put | 2.600 | -75,00 | 432 | -69,24 | |||
| 2026-02-05 | 13F | Allworth Financial LP | 439 | 134,76 | 66 | 120,00 | ||||
| 2026-02-10 | 13F | Bruce G. Allen Investments, LLC | 8 | 0,00 | 1 | 0,00 | ||||
| 2026-01-29 | 13F | Dunhill Financial, LLC | 2 | 0 | ||||||
| 2025-11-12 | 13F | Transce3nd, LLC | 0 | -100,00 | 0 | |||||
| 2026-02-23 | 13F | Beaird Harris Wealth Management, LLC | 0 | -100,00 | 0 | |||||
| 2026-04-28 | 13F | SBI Securities Co., Ltd. | 119 | 240,00 | 20 | 300,00 | ||||
| 2026-02-13 | 13F | Toroso Investments, LLC | 94.276 | -25,14 | 14.163 | -31,32 | ||||
| 2026-02-13 | 13F | Neuberger Berman Group LLC | 6.131 | 57,57 | 921 | 44,58 | ||||
| 2026-02-14 | 13F | Criteria Caixa, S.a.u. | 0 | -100,00 | 0 | |||||
| 2025-11-04 | 13F/A | Lingohr & Partner Asset Management GmbH | 1.400 | 0 | ||||||
| 2025-11-14 | 13F | Credit Agricole S A | 0 | -100,00 | 0 | -100,00 | ||||
| 2026-04-29 | 13F/A | Salem Investment Counselors Inc | 357 | 60 | ||||||
| 2026-02-19 | 13F | CI Private Wealth, LLC | 36.791 | -11,14 | 5.526 | -18,50 | ||||
| 2025-11-13 | 13F | Entropy Technologies, LP | 0 | -100,00 | 0 | -100,00 | ||||
| 2026-04-23 | 13F | Peregrine Capital Management Llc | 150 | 0,00 | 25 | 13,64 | ||||
| 2026-02-17 | 13F | Public Employees Retirement System Of Ohio | 24.681 | -4,60 | 3.708 | -12,49 | ||||
| 2026-04-22 | 13F | Caldwell Trust Co | 56 | 0,00 | 9 | 12,50 | ||||
| 2026-02-10 | 13F | Baker Avenue Asset Management, LP | 24.732 | 0,43 | 3.715 | -7,86 | ||||
| 2026-02-17 | 13F | Citadel Advisors Llc | Put | 2.200 | -85,53 | 331 | -86,74 | |||
| 2026-04-22 | 13F | Spire Wealth Management | 3 | -96,20 | 1 | -100,00 | ||||
| 2026-04-10 | 13F | Linden Thomas Advisory Services, LLC | 7.988 | 0,66 | 1.348 | 13,00 | ||||
| 2026-02-12 | 13F | South Dakota Investment Council | 55.917 | -11,41 | 8 | -20,00 | ||||
| 2026-01-12 | 13F | Rialto Wealth Management, LLC | 14 | 7,69 | 2 | 0,00 | ||||
| 2026-02-11 | 13F | GW&K Investment Management, LLC | 155.734 | 23 | ||||||
| 2026-02-17 | 13F | Citadel Advisors Llc | Call | 4.800 | -77,98 | 721 | -79,80 | |||
| 2026-02-17 | 13F | Citadel Advisors Llc | 679.921 | 3,28 | 102.145 | -5,25 | ||||
| 2026-02-17 | 13F | RMB Capital Management, LLC | 1.637 | 246 | ||||||
| 2026-02-17 | 13F | Canada Pension Plan Investment Board | 6.800 | 1.022 | ||||||
| 2026-02-06 | 13F | Gsa Capital Partners Llp | 1.672 | 0 | ||||||
| 2026-02-11 | 13F | Rise Advisors, LLC | 0 | -100,00 | 0 | |||||
| 2025-11-07 | 13F | Readystate Asset Management Lp | 0 | -100,00 | 0 | |||||
| 2026-02-13 | 13F/A | Alberta Investment Management Corp | 0 | -100,00 | 0 | |||||
| 2025-11-14 | 13F | DRW Securities, LLC | 0 | -100,00 | 0 | |||||
| 2026-04-06 | 13F | CX Institutional | 13.635 | 1,61 | 2 | 0,00 | ||||
| 2026-02-17 | 13F | MIRAE ASSET GLOBAL ETFS HOLDINGS Ltd. | 24.822 | 0,49 | 3.729 | -7,79 | ||||
| 2026-04-15 | 13F | Bayforest Capital Ltd | 1.439 | -40,07 | 243 | -32,78 | ||||
| 2026-02-17 | 13F | Creative Planning | 22.722 | 21,74 | 3.413 | 11,68 | ||||
| 2026-02-11 | 13F | IMA Wealth, Inc. | 233 | 25,95 | 35 | 16,67 | ||||
| 2026-02-17 | 13F | Susquehanna Portfolio Strategies, LLC | 42.332 | -15,41 | 6.360 | -22,39 | ||||
| 2026-02-17 | 13F | Prelude Capital Management, Llc | 5.384 | 113,91 | 809 | 96,12 | ||||
| 2026-04-30 | 13F | Cambridge Investment Research Advisors, Inc. | 7.771 | -3,06 | 1 | 0,00 | ||||
| 2026-02-03 | 13F | Crossmark Global Holdings, Inc. | 4.135 | -7,02 | 621 | -14,70 | ||||
| 2026-02-09 | 13F | Delta Asset Management Llc/tn | 12 | 0,00 | 2 | 0,00 | ||||
| 2026-04-15 | 13F | Financial Management Professionals, Inc. | 5 | 0,00 | 1 | |||||
| 2026-05-01 | 13F | Rakuten Securities, Inc. | 73 | 630,00 | 12 | 1.100,00 | ||||
| 2026-02-17 | 13F | Parkwood LLC | 142.920 | 7,75 | 21 | 0,00 | ||||
| 2026-05-01 | 13F | Commonwealth Of Pennsylvania Public School Empls Retrmt Sys | 18.787 | -0,88 | 3.170 | 11,31 | ||||
| 2026-02-10 | 13F | Axq Capital, Lp | 6.395 | 961 | ||||||
| 2026-04-21 | 13F | Vise Technologies, Inc. | 8.314 | 0,00 | 1.249 | 0,00 | ||||
| 2026-02-05 | 13F | Northwestern Mutual Investment Management Company, Llc | 16.945 | -0,88 | 2.546 | -9,07 | ||||
| 2026-02-17 | 13F | Susquehanna Fundamental Investments, Llc | 24.591 | -11,37 | 3.694 | -18,69 | ||||
| 2026-02-12 | 13F | Leith Wheeler Investment Counsel Ltd. | 15.030 | -24,54 | 2.258 | -30,79 | ||||
| 2026-02-12 | 13F | Towle & Co | 61.109 | 18,87 | 9.180 | 9,05 | ||||
| 2026-02-10 | 13F | Globeflex Capital L P | 35.224 | 545,36 | 5.292 | 492,50 | ||||
| 2026-02-11 | 13F | Illinois Municipal Retirement Fund | 10.833 | 0,86 | 1.627 | -7,45 | ||||
| 2026-02-17 | 13F | Ionic Capital Management LLC | 9.100 | 0,00 | 1.367 | -8,26 | ||||
| 2026-02-17 | 13F | Freestone Grove Partners LP | 149.254 | 22.422 | ||||||
| 2026-02-17 | 13F | Schonfeld Strategic Advisors LLC | 19.915 | 2.992 | ||||||
| 2026-02-12 | 13F | Swiss National Bank | 144.585 | 0,49 | 21.721 | -7,81 | ||||
| 2026-01-23 | 13F | Ogorek Anthony Joseph /ny/ /adv | 23 | 283,33 | 0 | |||||
| 2026-04-21 | 13F | Robeco Institutional Asset Management B.V. | 41.512 | 6,71 | 7.003 | 19,83 | ||||
| 2025-11-14 | 13F | Bayesian Capital Management, LP | 0 | -100,00 | 0 | |||||
| 2026-02-13 | 13F | Atlas Capital Advisors Llc | 7.139 | 104,91 | 1.072 | 127,12 | ||||
| 2026-04-09 | 13F | Dorato Capital Management | 180 | 0,00 | 36 | 33,33 | ||||
| 2026-02-17 | 13F | Qube Research & Technologies Ltd | 240.250 | 6.522,11 | 36.093 | 5.976,09 | ||||
| 2026-02-13 | 13F | Prudential Financial Inc | 41.999 | 85,99 | 6.310 | 70,65 | ||||
| 2026-02-09 | 13F | Coldstream Capital Management Inc | 16.697 | -5,44 | 2.508 | -13,25 | ||||
| 2026-02-10 | 13F | CIBC Asset Management Inc | 2.800 | 0,00 | 421 | -8,30 | ||||
| 2026-04-29 | 13F | R Squared Ltd | 4.464 | -55,49 | 753 | -50,00 | ||||
| 2026-02-13 | 13F | SRS Capital Advisors, Inc. | 26 | -91,53 | 4 | -94,00 | ||||
| 2025-11-12 | 13F | NewSquare Capital LLC | 0 | -100,00 | 0 | |||||
| 2026-01-29 | 13F | Ashton Thomas Private Wealth, LLC | 2.107 | 3,49 | 317 | -5,11 | ||||
| 2026-04-28 | 13F | LGT Fund Management Co Ltd. | 42.169 | 0,00 | 7.114 | 10,65 | ||||
| 2026-03-05 | 13F/A | Banco Santander, S.A. | 0 | -100,00 | 0 | |||||
| 2026-04-23 | 13F | CBOE Vest Financial, LLC | 16.127 | 407,14 | 2.721 | 470,23 | ||||
| 2026-02-11 | 13F | Picton Mahoney Asset Management | 10 | -99,25 | 2 | |||||
| 2026-02-06 | 13F | Pnc Financial Services Group, Inc. | 8.194 | -9,69 | 1.231 | -17,10 | ||||
| 2026-04-17 | 13F | Brown, Lisle/cummings, Inc. | 16 | 3 | ||||||
| 2026-02-17 | 13F | ISAM Funds (UK) Ltd | 2.398 | 360 | ||||||
| 2026-02-04 | 13F | Swiss Life Asset Management Ltd | 5.244 | 55,56 | 788 | 42,57 | ||||
| 2026-02-17 | 13F | Worldquant Millennium Advisors Llc | 3.069 | 461 | ||||||
| 2026-04-29 | 13F | Klp Kapitalforvaltning As | 23.700 | 50,96 | 3.998 | 69,55 | ||||
| 2026-04-28 | 13F | Everence Capital Management Inc | 2.289 | 36,25 | 0 | |||||
| 2026-02-13 | 13F | Aigen Investment Management, Lp | 13.651 | 2.051 | ||||||
| 2026-02-10 | 13F | Principia Wealth Advisory, LLC | 2 | 0 | ||||||
| 2026-02-17 | 13F | Zurich Insurance Group Ltd/FI | 9.100 | 0,00 | 1.367 | -8,26 | ||||
| 2026-02-02 | 13F | Benjamin Edwards Inc | 1.545 | -3,20 | 232 | -11,11 | ||||
| 2026-02-13 | 13F | Manufacturers Life Insurance Company, The | 0 | -100,00 | 0 | |||||
| 2026-04-16 | 13F | Evolve Private Wealth, Llc | 2.495 | 421 | ||||||
| 2026-04-30 | 13F | Lecap Asset Management Ltd | 0 | -100,00 | 0 | |||||
| 2026-04-20 | 13F | Louisiana State Employees Retirement System | 21.700 | 3,33 | 3.661 | 16,07 | ||||
| 2026-02-10 | 13F | Natixis Advisors, L.p. | 51.613 | -30,97 | 8 | -41,67 | ||||
| 2026-02-11 | 13F | Simplex Trading, Llc | Call | 300 | -66,67 | 45 | ||||
| 2026-02-13 | 13F | Advisory Research Inc | 5.567 | 836 | ||||||
| 2026-02-17 | 13F | MIG Capital, LLC | 27.595 | 0,00 | 4.146 | -8,26 | ||||
| 2026-02-02 | 13F | Mutual Advisors, LLC | 5.607 | 0,00 | 842 | -2,09 | ||||
| 2026-04-21 | 13F | Founders Capital Management | 80 | 13 | ||||||
| 2026-02-17 | 13F | Signature Equity Partners, LLC | 5 | 1 | ||||||
| 2025-11-04 | 13F | IMC-Chicago, LLC | Call | 0 | -100,00 | 0 | -100,00 | |||
| 2026-04-27 | 13F | Truist Financial Corp | 31.345 | 9,40 | 5.288 | 22,86 | ||||
| 2026-02-17 | 13F | Millennium Management Llc | 283.884 | 255,60 | 42.648 | 226,25 | ||||
| 2026-04-28 | 13F | Sage Rhino Capital Llc | 1.271 | 214 | ||||||
| 2026-02-17 | 13F | Scientech Research LLC | 2.122 | 319 | ||||||
| 2026-04-27 | 13F | Td Private Client Wealth Llc | 6 | 1 | ||||||
| 2026-02-13 | 13F | Barclays Plc | 95.487 | -7,31 | 14.345 | -14,96 | ||||
| 2026-02-17 | 13F | Royal Bank Of Canada | 67.472 | -53,59 | 10.136 | -57,43 | ||||
| 2026-02-10 | 13F | Nomura Asset Management Co Ltd | 1.250 | 0,00 | 188 | -8,33 | ||||
| 2026-02-13 | 13F | Dynamic Technology Lab Private Ltd | 16.170 | 136,75 | 2.429 | 117,26 | ||||
| 2026-02-13 | 13F | Mariner, LLC | 17.821 | 2.677 | ||||||
| 2026-02-17 | 13F | Concentric Capital Strategies, LP | 78.194 | -29,01 | 11.747 | -34,87 | ||||
| 2026-04-23 | 13F | Cornerstone Wealth Management, LLC | 2.102 | 3,14 | 355 | 15,69 | ||||
| 2026-04-24 | 13F | UMA Financial Services, Inc. | 14 | 100,00 | 2 | 100,00 | ||||
| 2026-02-17 | 13F | Warren Averett Asset Management, LLC | 6.974 | 54,43 | 1.048 | 41,68 | ||||
| 2026-04-30 | 13F | Mv Capital Management, Inc. | 1 | 0 | ||||||
| 2026-02-17 | 13F | Fmr Llc | 4.909.593 | -24,27 | 737.568 | -30,52 | ||||
| 2026-02-03 | 13F | Strengthening Families & Communities, LLC | 126 | 0,00 | 19 | -10,00 | ||||
| 2026-02-09 | 13F | Quest Partners LLC | 5.170 | 87,25 | 777 | 71,68 | ||||
| 2026-01-15 | 13F | Allspring Global Investments Holdings, LLC | 335.504 | 1,13 | 51.476 | -5,61 | ||||
| 2025-11-14 | 13F | Texas Permanent School Fund | 0 | -100,00 | 0 | |||||
| 2026-02-09 | 13F | Keating Financial Advisory Services, Inc. | 51 | 8 | ||||||
| 2026-02-12 | 13F | Steward Partners Investment Advisory, Llc | 30.691 | 1,71 | 4.611 | -6,70 | ||||
| 2026-02-17 | 13F | Raymond James Financial Inc | 260.781 | -4,32 | 39.177 | -12,22 | ||||
| 2026-04-29 | 13F | WPG Advisers, LLC | 394 | -1,75 | 66 | 10,00 | ||||
| 2026-04-24 | 13F | James Investment Research Inc | 1.877 | 0,11 | 317 | 12,46 | ||||
| 2026-02-17 | 13F | Russell Investments Group, Ltd. | 76.673 | 8,18 | 11.521 | -0,72 | ||||
| 2026-02-06 | 13F | HighTower Advisors, LLC | 4.671 | 9,98 | 702 | 0,86 | ||||
| 2026-02-17 | 13F | Wellington Management Group Llp | 365.622 | -2,00 | 54.927 | -10,10 | ||||
| 2026-02-17 | 13F | Magnetar Financial LLC | 1.554 | 233 | ||||||
| 2025-11-14 | 13F | Verity Asset Management, Inc. | 0 | -100,00 | 0 | |||||
| 2026-04-22 | 13F | Ifrah Financial Services, Inc. | 1.356 | -2,38 | 229 | 9,62 | ||||
| 2026-02-12 | 13F | Callan Family Office, LLC | 7.343 | 135,05 | 1.103 | 115,85 | ||||
| 2026-02-05 | 13F | Atria Investments Llc | 5.849 | -1,78 | 879 | -9,95 | ||||
| 2026-02-17 | 13F | ExodusPoint Capital Management, LP | 0 | -100,00 | 0 | -100,00 | ||||
| 2026-04-21 | 13F | Hennessy Advisors Inc | 241.972 | -9,14 | 40.823 | 2,04 | ||||
| 2026-04-29 | 13F | Sunrise Financial Services, LLC | 14 | 0,00 | 2 | 0,00 | ||||
| 2026-02-04 | 13F | Provident Investment Management, Inc. | 2.751 | 413 | ||||||
| 2026-04-24 | 13F | Ninety One SA (PTY) Ltd | 54.248 | 5,12 | 8.894 | 14,73 | ||||
| 2026-02-11 | 13F | Vestcor Inc | 6.351 | -7,97 | 1 | -100,00 | ||||
| 2026-02-03 | 13F | Navellier & Associates Inc | 1.719 | 0,00 | 258 | -8,19 | ||||
| 2026-02-13 | 13F | Bank Of Nova Scotia | 16.932 | 2.544 | ||||||
| 2026-04-10 | 13F | Waldron Private Wealth LLC | 1.411 | 0,00 | 238 | 12,80 | ||||
| 2026-01-16 | 13F | Marquette Asset Management, LLC | 0 | -100,00 | 0 | -100,00 | ||||
| 2026-01-23 | 13F | Rsm Us Wealth Management Llc | 1.759 | 268 | ||||||
| 2026-02-11 | 13F | J.Safra Asset Management Corp | 0 | -100,00 | 0 | |||||
| 2026-04-21 | 13F | Venturi Wealth Management, LLC | 6.925 | 374,32 | 1.168 | 433,33 | ||||
| 2026-01-30 | 13F | Urban Wealth Management, LLC | 0 | -100,00 | 0 | -100,00 | ||||
| 2026-04-10 | 13F/A | OP Asset Management Ltd | 58.622 | 0,00 | 9.890 | 12,31 | ||||
| 2026-04-16 | 13F | Capital Advisors, Ltd. LLC | 77 | 165,52 | 0 | |||||
| 2026-04-17 | 13F | AdvisorNet Financial, Inc | 6 | 0,00 | 1 | |||||
| 2026-02-17 | 13F | BTG Pactual Asset Management US LLC | 1.364 | 205 | ||||||
| 2026-02-17 | 13F | Cambria Investment Management, L.P. | 5.174 | -1,69 | 777 | -9,76 | ||||
| 2026-02-17 | 13F | DV Trading LLC | 200 | 30 | ||||||
| 2026-02-05 | 13F | Paulson Wealth Management Inc. | 1.943 | -5,08 | 292 | -13,13 | ||||
| 2026-01-22 | 13F | Bartlett & Co. Wealth Management Llc | 227 | 0,00 | 34 | -8,11 | ||||
| 2026-04-22 | 13F | Networth Advisors, LLC | 38 | 111,11 | 6 | 200,00 | ||||
| 2026-02-13 | 13F/A | Ontario Teachers Pension Plan Board | 0 | -100,00 | 0 | |||||
| 2026-04-27 | 13F | Y-Intercept (Hong Kong) Ltd | 2.776 | 468 | ||||||
| 2026-02-17 | 13F | SummitTX Capital, L.P. | 93.619 | 16,24 | 14.064 | 6,64 | ||||
| 2026-01-29 | 13F | Comerica Bank | 64.435 | 74,93 | 9.680 | 60,50 | ||||
| 2026-04-22 | 13F | Janney Montgomery Scott LLC | 8.818 | -22,05 | 1 | 0,00 | ||||
| 2026-02-09 | 13F | Harbour Investments, Inc. | 51 | 8,51 | 8 | 0,00 | ||||
| 2026-02-18 | 13F | EP Wealth Advisors, Inc. | 5.059 | -33,72 | 760 | -26,57 | ||||
| 2026-02-04 | 13F | Schwartz Investment Counsel Inc | 169.500 | 0,00 | 25.464 | -8,26 | ||||
| 2026-04-27 | 13F | Qrg Capital Management, Inc. | 2.738 | 462 | ||||||
| 2026-04-13 | 13F | Mitchell Sinkler & Starr/pa | 2.758 | 49,24 | 465 | 67,87 | ||||
| 2026-04-28 | 13F | Handelsbanken Fonder AB | 23.113 | 2,99 | 4 | 0,00 | ||||
| 2026-04-20 | 13F | BTC Capital Management, Inc. | 3.497 | 16,10 | 590 | 30,02 | ||||
| 2026-02-13 | 13F | Wbi Investments, Inc. | 7.724 | 85,27 | 1.160 | 70,09 | ||||
| 2026-02-09 | 13F | Fisher Asset Management, LLC | 8.276 | 1.243 | ||||||
| 2026-04-24 | 13F | Strs Ohio | 1.826 | -0,16 | 308 | 12,41 | ||||
| 2026-01-29 | 13F | State Of Michigan Retirement System | 17.921 | -1,65 | 2.692 | -9,76 | ||||
| 2026-01-29 | 13F | Teachers Retirement System Of The State Of Kentucky | 24.244 | 0,00 | 4 | 0,00 | ||||
| 2026-02-11 | 13F | Deutsche Bank Ag\ | 18.984 | 12,12 | 2.852 | 2,85 | ||||
| 2026-04-30 | 13F | Teacher Retirement System Of Texas | 64.532 | 9,07 | 10.887 | 22,49 | ||||
| 2026-02-10 | 13F | Envestnet Asset Management Inc | 75.675 | -8,80 | 11.369 | -16,33 | ||||
| 2026-02-17 | 13F | Watershed Asset Management, L.L.C. | 2.945 | 442 | ||||||
| 2026-04-23 | 13F | SJS Investment Consulting Inc. | 201 | 44,60 | 34 | 65,00 | ||||
| 2026-02-11 | 13F | Havemeyer Place LP | 11.118 | 1.670 | ||||||
| 2026-04-17 | 13F | Fifth Third Wealth Advisors LLC | 3.531 | 46,82 | 596 | 64,82 | ||||
| 2026-02-13 | 13F | BNP Paribas Asset Management Holding S.A. | 69.671 | 8.809,34 | 10 | |||||
| 2025-11-17 | 13F | Kestra Investment Management, LLC | 0 | -100,00 | 0 | -100,00 | ||||
| 2026-02-06 | 13F | Lloyd Advisory Services, LLC. | 211 | 32 | ||||||
| 2026-04-30 | 13F | Cookson Peirce & Co Inc | 32.136 | 0,00 | 5.422 | 12,31 | ||||
| 2026-04-06 | 13F | Highline Wealth Partners Llc | 160 | 36,75 | 27 | 52,94 | ||||
| 2026-02-13 | 13F | Brown Advisory Inc | 94.937 | 4,84 | 14.262 | -3,82 | ||||
| 2026-04-13 | 13F | Creative Financial Designs Inc /adv | 0 | -100,00 | 0 | |||||
| 2026-04-21 | 13F | PharVision Advisers, LLC | 0 | -100,00 | 0 | |||||
| 2026-02-10 | 13F | Quantbot Technologies LP | 39.351 | -6,08 | 5.912 | -13,85 | ||||
| 2026-04-14 | 13F | Kozak & Associates, Inc. | 23 | 0,00 | 5 | 33,33 | ||||
| 2026-02-13 | 13F | Kayne Anderson Rudnick Investment Management Llc | 2 | 0,00 | 0 | |||||
| 2026-02-17 | 13F | Delaware Management Holdings, Inc. | 556.603 | 83.618 | ||||||
| 2026-02-12 | 13F | CIBC Private Wealth Group, LLC | 1.977 | 13,43 | 297 | 4,21 | ||||
| 2026-02-13 | 13F | Meixler Investment Management, Ltd. | 4.033 | -9,47 | 606 | -17,01 | ||||
| 2026-04-13 | 13F | True Wealth Design, LLC | 145 | 291,89 | 24 | 380,00 | ||||
| 2026-04-06 | 13F | Karras Company, Inc. | 2.563 | 1,59 | 432 | 13,98 | ||||
| 2026-04-29 | 13F | CVA Family Office, LLC | 104 | 18 | ||||||
| 2025-11-13 | 13F | Banque Cantonale Vaudoise | 0 | -100,00 | 0 | |||||
| 2026-04-20 | 13F | Ritholtz Wealth Management | 5.058 | 120,87 | 853 | 148,69 | ||||
| 2026-02-17 | 13F | Price T Rowe Associates Inc /md/ | 295.931 | 0,91 | 44 | -8,33 | ||||
| 2026-02-12 | 13F | Empirical Finance, LLC | 8.299 | 0,00 | 1.247 | -8,25 | ||||
| 2026-02-13 | 13F | Great West Life Assurance Co /can/ | 46.074 | -20,34 | 7 | -33,33 | ||||
| 2026-02-17 | 13F | Oxford Asset Management Llp | 0 | -100,00 | 0 | -100,00 | ||||
| 2026-02-11 | 13F | EULAV Asset Management | 21.400 | 0,00 | 3.215 | -8,28 | ||||
| 2026-02-12 | 13F | Brown Brothers Harriman & Co | 29 | -87,11 | 4 | -88,89 | ||||
| 2026-02-10 | 13F | Measured Wealth Private Client Group, LLC | 156 | -13,81 | 23 | -20,69 | ||||
| 2026-04-23 | 13F | American National Bank | 159 | 0,00 | 27 | 13,04 | ||||
| 2026-01-28 | 13F | Salomon & Ludwin, LLC | 24 | 0,00 | 4 | 0,00 | ||||
| 2026-01-29 | 13F | UBS Group AG | 160.155 | -18,22 | 24.060 | -24,97 | ||||
| 2026-04-28 | 13F | LGT Financial Advisors LLC | 38 | 0,00 | 6 | 20,00 | ||||
| 2026-05-01 | 13F | Citizens Financial Group Inc/ri | 1.935 | 326 | ||||||
| 2026-02-11 | 13F | Parallel Advisors, LLC | 1.523 | 3,68 | 229 | -5,00 | ||||
| 2026-02-10 | 13F | Norges Bank | 988.876 | 148.559 | ||||||
| 2026-04-17 | 13F | Vermillion Wealth Management, Inc. | 6 | 1 | ||||||
| 2026-02-12 | 13F | BlackRock, Inc. | 7.199.162 | -1,93 | 1.081.530 | -10,02 | ||||
| 2026-02-18 | 13F | State of Tennessee, Treasury Department | 29.016 | -4,10 | 4.604 | -7,09 | ||||
| 2026-04-23 | 13F | Farmers & Merchants Investments Inc | 60 | 0,00 | 10 | 11,11 | ||||
| 2026-02-10 | 13F | New Mexico Educational Retirement Board | 15.202 | 0,00 | 2 | 0,00 | ||||
| 2026-04-21 | 13F | Pallas Capital Advisors LLC | 1.718 | 290 | ||||||
| 2026-02-18 | 13F | GWM Advisors LLC | 0 | -100,00 | 0 | |||||
| 2026-02-12 | 13F | Renaissance Technologies Llc | 142.028 | 82,02 | 21.337 | 66,99 | ||||
| 2026-02-12 | 13F | MetLife Investment Management, LLC | 37.017 | -6,12 | 5.561 | -13,86 | ||||
| 2025-11-14 | 13F | Eqis Capital Management, Inc. | 0 | -100,00 | 0 | |||||
| 2026-02-12 | 13F | JPL Wealth Management, LLC | 0 | -100,00 | 0 | |||||
| 2026-04-24 | 13F | Retirement Systems of Alabama | 91.925 | 1,13 | 15.509 | 13,57 | ||||
| 2026-05-01 | 13F | HFM Investment Advisors, LLC | 7 | 0,00 | 1 | 0,00 | ||||
| 2026-02-13 | 13F | Quarry LP | 319 | -19,44 | 48 | -26,56 | ||||
| 2026-02-13 | 13F | Seneschal Advisors, LLC | 1 | 0,00 | 0 | |||||
| 2026-02-13 | 13F | Edgestream Partners, L.P. | 85.759 | 12.884 | ||||||
| 2026-02-18 | 13F | Mackenzie Financial Corp | 3.753 | -22,14 | 571 | -27,63 | ||||
| 2026-02-12 | 13F/A | Pinebridge Investments Llc | 10.582 | 1.590 | ||||||
| 2026-02-13 | 13F | Glen Eagle Advisors, LLC | 48 | 0,00 | 7 | 0,00 | ||||
| 2026-02-17 | 13F | Janus Henderson Group Plc | 31.602 | -0,55 | 4.745 | -8,73 | ||||
| 2025-11-14 | 13F | Ardsley Advisory Partners Lp | 0 | -100,00 | 0 | |||||
| 2026-02-09 | 13F | Lind Value II ApS | 0 | -100,00 | 0 | |||||
| 2026-04-22 | 13F | Groesbeck Investment Management Corp /nj/ | 1.738 | 0 | ||||||
| 2026-02-12 | 13F | State Board Of Administration Of Florida Retirement System | 47.937 | 12,69 | 7.202 | 3,39 | ||||
| 2026-02-10 | 13F | Savant Capital, LLC | 0 | -100,00 | 0 | |||||
| 2026-02-13 | 13F | MAI Capital Management | 403 | 2,81 | 61 | -6,25 | ||||
| 2026-04-22 | 13F | Uniting Wealth Partners, LLC | 0 | -100,00 | 0 | |||||
| 2026-02-13 | 13F | Ceredex Value Advisors LLC | 198.400 | -24,88 | 29.806 | -31,08 | ||||
| 2026-04-14 | 13F | Bay Harbor Wealth Management, LLC | 15 | 66,67 | 3 | 100,00 | ||||
| 2026-04-20 | 13F | Jfs Wealth Advisors, Llc | 66 | 6,45 | 11 | 22,22 | ||||
| 2026-02-12 | 13F | Wealthspire Advisors, LLC | 0 | -100,00 | 0 | -100,00 | ||||
| 2026-04-14 | 13F | Nbc Securities, Inc. | 2.972 | 3,05 | 501 | 15,70 | ||||
| 2026-02-17 | 13F | Ameriprise Financial Inc | 98.441 | -1,81 | 14.788 | -9,97 | ||||
| 2026-02-10 | 13F | State of Wyoming | 1.536 | 712,70 | 231 | 666,67 | ||||
| 2026-02-20 | 13F | Sunbelt Securities, Inc. | 50 | 0,00 | 8 | -12,50 | ||||
| 2026-02-13 | 13F | Fieldview Capital Management, LLC | 0 | -100,00 | 0 | |||||
| 2026-01-29 | 13F | Vanguard Group Inc | 8.046.004 | -1,52 | 1.208.751 | -9,65 | ||||
| 2026-02-10 | 13F | Bnp Paribas Arbitrage, Sa | 50.690 | 284,42 | 7.615 | 252,71 | ||||
| 2026-04-22 | 13F | Metropolis Capital Ltd | 1.281.307 | 9,51 | 216.169 | 22,98 | ||||
| 2026-02-12 | 13F | Hrt Financial Lp | 61.055 | 9 | ||||||
| 2026-02-09 | 13F | Huntington National Bank | 404 | -1,46 | 61 | -10,45 | ||||
| 2026-02-10 | 13F/A | Northwestern Mutual Wealth Management Co | 3.349 | 1,48 | 503 | -6,85 | ||||
| 2026-02-06 | 13F | Larson Financial Group LLC | 57 | -47,22 | 9 | -52,94 | ||||
| 2026-02-13 | 13F | Walleye Trading LLC | Put | 0 | -100,00 | 0 | ||||
| 2026-02-11 | 13F | Twin Tree Management, LP | Call | 0 | -100,00 | 0 | ||||
| 2026-02-17 | 13F | Brevan Howard Capital Management LP | 6.706 | 1.007 | ||||||
| 2026-02-03 | 13F | Mitsubishi UFJ Kokusai Asset Management Co., Ltd. | 245 | 0,00 | 38 | -7,50 | ||||
| 2026-02-13 | 13F | Walleye Trading LLC | Call | 0 | -100,00 | 0 | ||||
| 2026-02-06 | 13F | Meiji Yasuda Asset Management Co Ltd. | 1.738 | -2,47 | 261 | -10,31 | ||||
| 2026-02-17 | 13F | Maryland State Retirement & Pension System | 3.855 | 0,00 | 579 | -8,24 | ||||
| 2026-02-06 | 13F | Kingdom Financial Group LLC. | 121 | 18 | ||||||
| 2026-04-21 | 13F | Aaron Wealth Advisors LLC | 1.440 | -21,14 | 243 | -11,68 | ||||
| 2026-01-30 | 13F/A | M&t Bank Corp | 6.368 | 78,48 | 956 | 63,70 | ||||
| 2026-02-06 | 13F | Global Retirement Partners, LLC | 1.280 | 435,56 | 192 | 392,31 | ||||
| 2026-04-24 | 13F | Sage Investment Counsel LLC | 9.044 | -0,63 | 1.526 | 11,56 | ||||
| 2026-04-23 | 13F | Fairman Group, LLC | 26 | 0,00 | 4 | 33,33 | ||||
| 2026-02-13 | 13F | Citigroup Inc | 134.008 | 61,26 | 20.132 | 47,94 | ||||
| 2026-02-11 | 13F | Jpmorgan Chase & Co | 2.323.097 | -39,87 | 348.999 | -44,84 | ||||
| 2026-02-17 | 13F | Man Group plc | 0 | -100,00 | 0 | |||||
| 2026-02-12 | 13F | Integrated Quantitative Investments LLC | 1.395 | 210 | ||||||
| 2026-04-29 | 13F | Nilsine Partners, LLC | 1.383 | 312 | ||||||
| 2026-04-30 | 13F | Clear Street Markets Llc | 138 | 23 | ||||||
| 2026-02-05 | 13F | Bessemer Group Inc | 274 | -2,49 | 0 | |||||
| 2026-02-09 | 13F | Jackson Creek Investment Advisors LLC | 2.908 | 0 | ||||||
| 2026-04-07 | 13F | Farther Finance Advisors, LLC | 3.438 | 4,18 | 641 | 29,29 | ||||
| 2026-02-12 | 13F | Federated Hermes, Inc. | 166.881 | -17,45 | 25.071 | -24,26 | ||||
| 2026-05-01 | 13F | Sachetta, LLC | 50 | 194,12 | 8 | 300,00 | ||||
| 2026-02-17 | 13F | State Of Wisconsin Investment Board | 32.559 | -11,93 | 4.891 | -19,21 | ||||
| 2026-04-20 | 13F | Heritage Wealth Management, Inc. | 1.201 | 203 | ||||||
| 2026-02-13 | 13F | Pinnacle Wealth Planning Services, Inc. | 502 | 75 | ||||||
| 2026-04-10 | 13F | Matrix Trust Co | 139 | 5,30 | 0 | |||||
| 2026-04-30 | 13F | Manning & Napier Advisors Llc | 1.272 | 215 | ||||||
| 2026-02-11 | 13F | Inceptionr Llc | 6.493 | 975 | ||||||
| 2026-02-13 | 13F | Alyeska Investment Group, L.P. | 268.465 | -67,59 | 40.331 | -70,26 | ||||
| 2026-02-13 | 13F | Rhumbline Advisers | 206.278 | -3,21 | 30.989 | -11,20 | ||||
| 2026-02-13 | 13F | Walleye Trading LLC | 0 | -100,00 | 0 | |||||
| 2026-04-15 | 13F | Valley National Advisers Inc | 202 | 0,00 | 0 | |||||
| 2026-02-11 | 13F | Lyrical Asset Management Lp | 1.220.385 | -5,42 | 183.338 | -13,23 | ||||
| 2026-02-11 | 13F | Capital World Investors | 0 | -100,00 | 0 | |||||
| 2026-02-13 | 13F | Walleye Capital LLC | 66.562 | 109,43 | 10.000 | 92,14 | ||||
| 2026-02-23 | 13F | Virtu Financial LLC | 2.008 | 25,27 | 0 | |||||
| 2026-02-13 | 13F | Pathstone Holdings, LLC | 19.249 | 6,15 | 2.892 | -2,63 | ||||
| 2026-04-23 | 13F | Private Wealth Management Group, LLC | 15 | 0,00 | 3 | 0,00 | ||||
| 2026-02-12 | 13F | New York State Common Retirement Fund | 38.435 | 0,00 | 5.774 | -8,25 | ||||
| 2026-02-12 | 13F | Colonial Trust Advisors | 250 | 0,00 | 38 | -7,50 | ||||
| 2026-02-12 | 13F | Cloud Capital Management, LLC | 0 | -100,00 | 0 | |||||
| 2026-04-28 | 13F | Whittier Trust Co Of Nevada Inc | 58 | 18,37 | 11 | 57,14 | ||||
| 2026-02-11 | 13F | CenterBook Partners LP | 7.439 | 1.118 | ||||||
| 2026-02-17 | 13F | Polymer Capital Management (US) LLC | 2.579 | 387 | ||||||
| 2025-11-14 | 13F | Peak6 Llc | 0 | -100,00 | 0 | -100,00 | ||||
| 2026-02-13 | 13F | Bragg Financial Advisors, Inc | 314.063 | 0,17 | 47.182 | -8,10 | ||||
| 2026-04-21 | 13F | Wasatch Advisors Inc | 5.020 | 847 | ||||||
| 2025-11-14 | 13F | Peak6 Llc | Put | 0 | -100,00 | 0 | -100,00 | |||
| 2026-02-06 | 13F | Lsv Asset Management | 2.086.604 | 16,05 | 313 | 6,46 | ||||
| 2026-02-09 | 13F | Smithfield Trust Co | 55 | 0,00 | 0 | |||||
| 2026-04-16 | 13F | Polianta Ltd | 9.200 | 0,00 | 2 | 0,00 | ||||
| 2026-04-28 | 13F | WESPAC Advisors, LLC | 1.783 | 301 | ||||||
| 2025-11-14 | 13F | Woodline Partners LP | 0 | -100,00 | 0 | |||||
| 2026-05-01 | 13F | Sawgrass Asset Management Llc | 1.406 | 237 | ||||||
| 2026-02-11 | 13F | LPL Financial LLC | 19.872 | 16,26 | 2.985 | 6,65 | ||||
| 2026-04-20 | 13F | Assenagon Asset Management S.A. | 23.224 | 10,90 | 3.918 | 24,54 | ||||
| 2026-02-05 | 13F | Applied Finance Capital Management, LLC | 0 | -100,00 | 0 | |||||
| 2026-02-06 | 13F | Covestor Ltd | 108 | -90,51 | 0 | |||||
| 2026-04-29 | 13F | Oregon Public Employees Retirement Fund | 15.370 | 1,54 | 2.593 | 14,03 | ||||
| 2026-02-10 | 13F | Mutual Of America Capital Management Llc | 31.520 | -11,01 | 4.735 | -18,35 | ||||
| 2026-04-10 | 13F | Oak Thistle LLC | 0 | -100,00 | 0 | |||||
| 2026-05-01 | 13F | International Assets Investment Management, Llc | 293 | 1.731,25 | 55 | 2.600,00 | ||||
| 2026-02-05 | 13F | Gabelli Funds Llc | 13.477 | -10,34 | 2.025 | -17,76 | ||||
| 2026-04-20 | 13F | Delphi Management Inc /ma/ | 7.922 | -19,79 | 1 | 0,00 | ||||
| 2026-04-30 | 13F | BRYN MAWR TRUST Co | 227 | -2,99 | 38 | 8,57 | ||||
| 2026-02-12 | 13F | Quadrant Capital Group Llc | 7.588 | 0,97 | 1.140 | -7,40 | ||||
| 2026-04-24 | 13F | Ninety One UK Ltd | 2.094.298 | -6,05 | 353.329 | 5,51 | ||||
| 2026-01-07 | 13F | Aventura Private Wealth, LLC | 0 | -100,00 | 0 | |||||
| 2026-02-13 | 13F | Walleye Capital LLC | Call | 0 | -100,00 | 0 | -100,00 | |||
| 2026-02-17 | 13F | Mubadala Investment Co PJSC | 16.486 | 2.477 | ||||||
| 2026-04-24 | 13F | ProShare Advisors LLC | 3.007 | -0,99 | 507 | 11,18 | ||||
| 2026-04-27 | 13F | Albion Financial Group /ut | 6 | 1 | ||||||
| 2026-01-26 | 13F | KBC Group NV | 30.981 | 1.478,25 | 5 | |||||
| 2026-02-13 | 13F | Macquarie Group Ltd | 0 | -100,00 | 0 | |||||
| 2026-04-30 | 13F | Independence Bank of Kentucky | 190 | 0,00 | 32 | 14,29 | ||||
| 2026-02-12 | 13F | denkapparat Operations GmbH | 1.700 | 0,00 | 255 | -8,27 | ||||
| 2026-02-13 | 13F | S&t Bank/pa | 28.932 | -15,69 | 4.346 | -22,66 | ||||
| 2026-02-19 | 13F | Invesco Ltd. | 741.328 | 5,30 | 111.370 | -3,40 | ||||
| 2026-02-17 | 13F | Advisor Group Holdings, Inc. | 5.841 | 234,92 | 878 | 221,25 | ||||
| 2025-11-12 | 13F | Burgundy Asset Management Ltd. | 158.963 | -0,52 | 23.538 | 8,55 | ||||
| 2026-04-30 | 13F | Torren Management, LLC | 76 | -30,91 | 13 | -25,00 | ||||
| 2025-11-14 | 13F | Horizon Investments, LLC | 0 | -100,00 | 0 | |||||
| 2026-02-13 | 13F | Wells Fargo & Company/mn | 313.403 | -2,52 | 47.083 | -10,57 | ||||
| 2026-02-17 | 13F | Cetera Investment Advisers | 12.884 | 17,71 | 1.936 | 7,98 | ||||
| 2026-01-27 | 13F | Zurcher Kantonalbank (Zurich Cantonalbank) | 24.884 | 2,43 | 3.738 | -6,01 | ||||
| 2026-01-30 | 13F | Mitsubishi UFJ Trust & Banking Corp | 46.562 | -12,85 | 6.995 | -20,04 | ||||
| 2026-01-27 | 13F | Evergreen Capital Management Llc | 1.874 | 0,27 | 282 | -8,17 | ||||
| 2026-02-17 | 13F | Wiley Bros.-aintree Capital, Llc | 7.153 | 48,16 | 1.075 | 35,95 | ||||
| 2026-04-30 | 13F | Nisa Investment Advisors, Llc | 6.856 | -37,42 | 1.157 | -29,73 | ||||
| 2026-02-06 | 13F | Prescott Group Capital Management, L.l.c. | 15.000 | 0,00 | 2.253 | -8,27 | ||||
| 2026-02-17 | 13F | DME Capital Management, LP | 56.490 | 44,73 | 8.486 | 32,78 | ||||
| 2026-02-17 | 13F | Gotham Asset Management, LLC | 118.545 | 405,24 | 17.809 | 363,53 | ||||
| 2026-04-13 | 13F | Gateway Investment Advisers Llc | 7.127 | 1.202 | ||||||
| 2026-01-21 | 13F | Stone House Investment Management, LLC | 0 | -100,00 | 0 | |||||
| 2026-02-09 | 13F | Annis Gardner Whiting Capital Advisors, LLC | 236 | 0,00 | 35 | -7,89 | ||||
| 2026-02-13 | 13F | National Bank Of Canada /fi/ | 4.984 | -14,80 | 748 | -21,76 | ||||
| 2026-04-13 | 13F | Massmutual Trust Co Fsb/adv | 125 | -11,97 | 21 | 0,00 | ||||
| 2026-02-13 | 13F | Stifel Financial Corp | 24.862 | 2,17 | 3.735 | -6,28 | ||||
| 2026-02-13 | 13F | Cetera Trust Company, N.A | 2.690 | 0,00 | 404 | -8,18 | ||||
| 2025-11-07 | 13F | Sierra Ocean, Llc | 0 | -100,00 | 0 | -100,00 | ||||
| 2026-04-30 | 13F | Sequoia Financial Advisors, LLC | 5.017 | -4,35 | 846 | 7,50 | ||||
| 2026-05-01 | 13F | Thrivent Financial For Lutherans | 1.020.880 | 1,99 | 172 | 14,67 |
Other Listings
| DE:SUX | 190,00 € |