Grundlæggende statistik
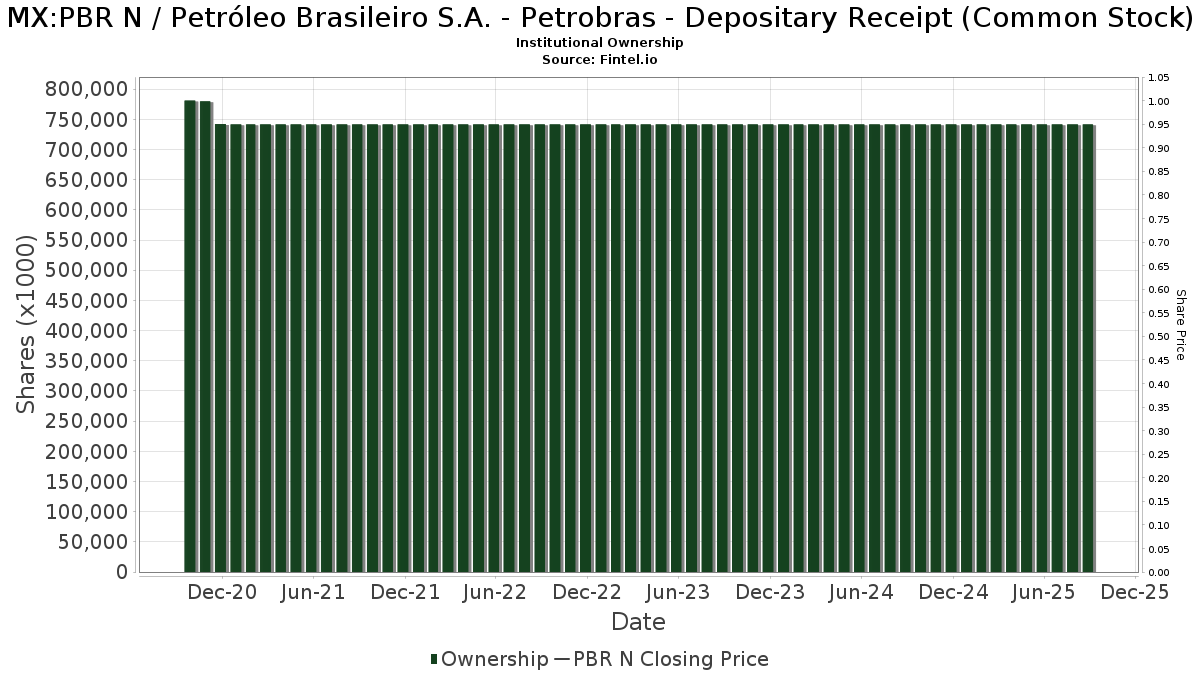
| Institutionelle ejere | 514 total, 482 long only, 1 short only, 31 long/short - change of -3,93% MRQ |
| Gennemsnitlig porteføljeallokering | 0.3220 % - change of -19,00% MRQ |
| Institutionelle aktier (lange) | 586.577.094 (ex 13D/G) - change of -44,38MM shares -5,65% MRQ |
| Institutionel værdi (lang) | $ 7.005.604 USD ($1000) |
Institutionelt ejerskab og aktionærer
Petróleo Brasileiro S.A. - Petrobras - Depositary Receipt (Common Stock) (MX:PBR N) har 514 institutionelle ejere og aktionærer, der har indsendt 13D/G- eller 13F-formularer til Securities Exchange Commission (SEC). Disse institutioner har i alt 586,577,094 aktier. Største aktionærer omfatter GQG Partners LLC, Capital International Investors, Baillie Gifford & Co, Invesco Ltd., Schroder Investment Management Group, Lazard Asset Management Llc, Itau Unibanco Holding S.A., ARGA Investment Management, LP, Fisher Asset Management, LLC, and Bank Of America Corp /de/ .
Petróleo Brasileiro S.A. - Petrobras - Depositary Receipt (Common Stock) (BMV:PBR N) institutionel ejerskabsstruktur viser aktuelle positioner i virksomheden efter institutioner og fonde, samt seneste ændringer i positionsstørrelse. Større aktionærer kan omfatte individuelle investorer, investeringsforeninger, hedgefonde eller institutioner. Skema 13D angiver, at investoren besidder (eller besidder) mere end 5 % af virksomheden og har til hensigt (eller har til hensigt at) aktivt at forfølge en ændring i forretningsstrategi. Skema 13G indikerer en passiv investering på over 5%.
Fondens stemningsscore
Fund Sentiment Score (fka Ownership Accumulation Score) finder de aktier, der bliver mest købt af fonde. Det er resultatet af en sofistikeret, multi-faktor kvantitativ model, der identificerer virksomheder med de højeste niveauer af institutionel akkumulering. Scoringsmodellen bruger en kombination af den samlede stigning i oplyste ejere, ændringerne i porteføljeallokeringer i disse ejere og andre målinger. Tallet går fra 0 til 100, hvor højere tal indikerer et højere niveau af akkumulering for sine jævnaldrende, og 50 er gennemsnittet.
Opdateringsfrekvens: Dagligt
Se Ownership Explorer, som giver en liste over højest rangerende virksomheder.
AI+ Ask Fintel’s AI assistant about Petróleo Brasileiro S.A. - Petrobras - Depositary Receipt (Common Stock).
Select a question to share a public post with an AI-crafted answer.
Thinking of good questions…
13F og NPORT arkivering
Detaljer om 13F-arkivering er gratis. Detaljer om NP-ansøgninger kræver et premium-medlemskab. Grønne rækker angiver nye positioner. Røde rækker angiver lukkede positioner. Klik på linket ikon for at se den fulde transaktionshistorik.
Opgrader
for at låse premium-data op og eksportere til Excel ![]() .
.
| Fil dato | Kilde | Investor | Type | Gennemsnitlig pris (Øst) |
Aktier | Δ Aktier (%) |
Rapporteret Værdi ($1000) |
Δ Værdi (%) |
Port Alloc (%) |
|
|---|---|---|---|---|---|---|---|---|---|---|
| 2025-11-05 | 13F | Wellington Shields Capital Management, LLC | 0 | -100,00 | 0 | -100,00 | ||||
| 2026-02-17 | 13F | Citadel Advisors Llc | Put | 1.703.300 | 22,67 | 20.184 | 14,83 | |||
| 2026-04-16 | 13F | SG Americas Securities, LLC | Put | 115.000 | 0 | |||||
| 2026-04-07 | 13F | Comprehensive Financial Planning, Inc./PA | 100 | 0,00 | 2 | 100,00 | ||||
| 2026-01-22 | 13F | V-Square Quantitative Management LLC | 6.489 | 77 | ||||||
| 2026-02-17 | 13F | Optiver Holding B.V. | 2.223.170 | -12,33 | 26.345 | -17,94 | ||||
| 2026-02-05 | 13F | Park Square Financial Group, LLC | 513 | 7 | ||||||
| 2026-02-17 | 13F | Optiver Holding B.V. | Call | 7.063.400 | -9,11 | 83.701 | -14,92 | |||
| 2026-04-23 | 13F | Intrua Financial, LLC | 28.789 | 0,01 | 597 | 75,07 | ||||
| 2026-01-20 | 13F | Ascent Group, LLC | 14.014 | -22,26 | 166 | -27,19 | ||||
| 2026-02-14 | 13F | Silver Grove Financial Group, Inc. | 2.000 | 24 | ||||||
| 2026-02-17 | 13F | Hilltop Holdings Inc. | 12.146 | -4,29 | 144 | -10,62 | ||||
| 2025-11-14 | 13F | Turim 21 Investimentos Ltda. | 0 | -100,00 | 0 | |||||
| 2026-04-14 | 13F | Nbc Securities, Inc. | Put | 0 | -100,00 | 0 | -100,00 | |||
| 2026-01-26 | 13F | Moran Wealth Management, LLC | 535.044 | 17,99 | 6.340 | 10,43 | ||||
| 2026-02-17 | 13F | First Manhattan Co | 0 | -100,00 | 0 | |||||
| 2026-02-02 | 13F | Qrg Capital Management, Inc. | 36.280 | 1,08 | 430 | -5,51 | ||||
| 2026-02-11 | 13F | X-Square Capital, LLC | 11.463 | -46,59 | 0 | |||||
| 2025-11-17 | 13F | Perritt Capital Management Inc | 0 | -100,00 | 0 | -100,00 | ||||
| 2026-02-10 | 13F/A | Northwestern Mutual Wealth Management Co | 79.081 | -28,17 | 937 | -32,74 | ||||
| 2026-02-10 | 13F | KERR FINANCIAL PLANNING Corp | 14 | 0 | ||||||
| 2026-02-17 | 13F | Citadel Advisors Llc | 70.241 | 80,18 | 832 | 68,76 | ||||
| 2026-02-13 | 13F | Venture Visionary Partners LLC | 264.118 | 6,93 | 3.130 | 0,06 | ||||
| 2026-02-13 | 13F | Ieq Capital, Llc | 57.671 | 23,82 | 683 | 15,96 | ||||
| 2026-02-17 | 13F | Optiver Holding B.V. | Put | 10.087.400 | 27.920,56 | 119.536 | 28.025,88 | |||
| 2026-04-10 | 13F | Naviter Wealth, LLC | 22.726 | -6,18 | 472 | 59,66 | ||||
| 2026-04-14 | 13F | Prospera Financial Services Inc | 17.118 | -29,37 | 355 | 23,69 | ||||
| 2026-01-21 | 13F | Newbridge Financial Services Group, Inc. | 1.725 | 6,15 | 20 | 0,00 | ||||
| 2026-02-17 | 13F | Citadel Advisors Llc | Call | 1.312.600 | -32,80 | 15.554 | -37,10 | |||
| 2026-02-06 | 13F | Gsa Capital Partners Llp | 0 | -100,00 | 0 | |||||
| 2026-04-20 | 13F | 25 Llc | 11.813 | -24,49 | 245 | 32,43 | ||||
| 2026-02-13 | 13F | Walleye Trading LLC | Call | 369.200 | 341,10 | 4.375 | 313,13 | |||
| 2026-01-15 | 13F | Allspring Global Investments Holdings, LLC | 1.395.841 | 5,63 | 16.638 | -0,23 | ||||
| 2026-01-28 | 13F | DekaBank Deutsche Girozentrale | 30.000 | 0,00 | 1 | |||||
| 2026-02-13 | 13F | Walleye Trading LLC | Put | 197.900 | 380,34 | 2.345 | 350,10 | |||
| 2025-10-30 | 13F | Simplicity Wealth,LLC | 0 | -100,00 | 0 | -100,00 | ||||
| 2026-02-06 | 13F | EverSource Wealth Advisors, LLC | 2.059 | -11,29 | 24 | -17,24 | ||||
| 2026-02-12 | 13F | Scotia Capital Inc. | 0 | -100,00 | 0 | |||||
| 2025-11-13 | 13F | Riggs Asset Managment Co. Inc. | 0 | -100,00 | 0 | |||||
| 2026-02-12 | 13F | Marex Group plc | 122.937 | 198,22 | 1.457 | 288,27 | ||||
| 2026-02-13 | 13F | Flow Traders U.s. Llc | 22.715 | 87,60 | 0 | |||||
| 2026-02-12 | 13F | StoneX Group Inc. | 15.442 | 185 | ||||||
| 2025-10-31 | 13F | Whittier Trust Co | 0 | -100,00 | 0 | -100,00 | ||||
| 2026-04-20 | 13F | Contravisory Investment Management, Inc. | 17.875 | 371 | ||||||
| 2026-01-23 | 13F | Westside Investment Management, Inc. | 745 | 5,67 | 9 | 0,00 | ||||
| 2026-02-17 | 13F | one8zero8, LLC | 70.273 | 17.468,25 | 833 | 20.700,00 | ||||
| 2026-02-17 | 13F | Advisory Services Network, LLC | 29.984 | 2.507,30 | 355 | 2.630,77 | ||||
| 2026-04-24 | 13F | Root Financial Partners, LLC | 61 | 1 | ||||||
| 2026-02-06 | 13F | Payden & Rygel | 10.210 | 0,00 | 0 | |||||
| 2026-02-09 | 13F | Mondrian Investment Partners LTD | 12.655.094 | 14,09 | 149.963 | 6,79 | ||||
| 2026-01-30 | 13F | Camden Capital, LLC | 250.000 | 0,00 | 2.962 | -6,41 | ||||
| 2026-02-02 | 13F | Ping Capital Management, Inc. | 392.100 | 46,31 | 4.646 | 36,97 | ||||
| 2025-11-14 | 13F | Consultiva Wealth Management, Corp. | 0 | -100,00 | 0 | |||||
| 2026-04-22 | 13F | Janney Montgomery Scott LLC | 50.084 | 51,93 | 1 | |||||
| 2026-02-17 | 13F | Masters Capital Management Llc | 0 | -100,00 | 0 | |||||
| 2026-02-13 | 13F | First National Bank Of Omaha | 347.795 | 4.125 | ||||||
| 2026-04-21 | 13F | Foster & Motley Inc | 41.685 | -30,79 | 1 | |||||
| 2026-02-20 | 13F | Larch Capital Partners Llc | 632.032 | 7.714 | ||||||
| 2026-02-13 | 13F | Clear Street Group Inc. | 41.348 | 490 | ||||||
| 2026-04-16 | 13F | SG Americas Securities, LLC | Call | 10.000 | 0 | |||||
| 2026-02-04 | 13F | Pensionmark Financial Group, Llc | 19.365 | 26,39 | 186 | -4,15 | ||||
| 2026-02-11 | 13F | Group One Trading, L.p. | Put | 2.344.500 | 4.931,12 | 27.782 | 4.951,27 | |||
| 2026-04-21 | 13F | Creative Capital Management Investments LLC | 100 | 2 | ||||||
| 2026-02-11 | 13F | Group One Trading, L.p. | 1.535.545 | 9,35 | 18.196 | 2,36 | ||||
| 2026-02-13 | 13F | Wealth Alliance | 48.125 | -6,43 | 570 | -12,44 | ||||
| 2026-02-17 | 13F | Public Employees Retirement System Of Ohio | 1.645.932 | 1,62 | 19.504 | -4,88 | ||||
| 2026-04-23 | 13F | Ameliora Wealth Management Ltd. | 1.400 | -65,00 | 29 | -38,30 | ||||
| 2026-02-11 | 13F | Group One Trading, L.p. | Call | 17.100 | -98,75 | 193 | -98,89 | |||
| 2026-02-13 | 13F | Resources Investment Advisors, LLC. | 10.874 | -10,73 | 129 | -16,88 | ||||
| 2026-02-17 | 13F | Banco Bilbao Vizcaya Argentaria, S.a. | 0 | -100,00 | 0 | |||||
| 2026-04-15 | 13F | Radnor Capital Management, LLC | 10.450 | -35,89 | 217 | 11,92 | ||||
| 2026-02-06 | 13F | Lsv Asset Management | 22.000 | 0,00 | 0 | |||||
| 2026-02-04 | 13F | HighPoint Advisor Group LLC | 0 | -100,00 | 0 | |||||
| 2026-02-13 | 13F | Sei Investments Co | 3.172.343 | 8,12 | 37.592 | 1,21 | ||||
| 2025-11-05 | 13F | Fullcircle Wealth Llc | 0 | -100,00 | 0 | |||||
| 2026-02-11 | 13F | Ameraudi Asset Management, Inc. | 13.850 | 0,00 | 164 | -6,29 | ||||
| 2026-04-06 | 13F | Versant Capital Management, Inc | 48 | 1 | ||||||
| 2026-02-03 | 13F | We Are One Seven, LLC | 56.274 | 10,62 | 667 | 3,42 | ||||
| 2026-02-18 | 13F/A | Empowered Funds, LLC | 17.079 | 39,53 | 202 | 31,17 | ||||
| 2026-04-24 | 13F | Sumitomo Mitsui DS Asset Management Company, Ltd | 11.000 | 0,00 | 228 | 75,38 | ||||
| 2026-02-17 | 13F | Advisor Group Holdings, Inc. | 194.642 | -32,39 | 2.306 | -36,07 | ||||
| 2026-02-11 | 13F | Simplex Trading, Llc | Call | 0 | -100,00 | 0 | ||||
| 2026-02-13 | 13F | Dodge & Cox | 31.200 | -4,59 | 370 | -10,65 | ||||
| 2026-02-11 | 13F | Simplex Trading, Llc | 0 | -100,00 | 0 | |||||
| 2026-01-28 | 13F | Retirement Planning Co of New England, Inc. | 48.376 | 15,46 | 573 | 8,11 | ||||
| 2026-02-09 | 13F | Huntington National Bank | 5.695 | -2,50 | 67 | -8,22 | ||||
| 2026-02-11 | 13F | Simplex Trading, Llc | Put | 0 | -100,00 | 0 | ||||
| 2026-02-12 | 13F | SWAN Capital LLC | 350 | 0,00 | 4 | 0,00 | ||||
| 2026-01-22 | 13F | Massachusetts Financial Services Co /ma/ | 9.664.426 | -11,90 | 114.523 | -17,54 | ||||
| 2026-01-26 | 13F | Ckw Financial Group | 59 | 0,00 | 0 | |||||
| 2026-02-11 | 13F | Capital International Investors | 30.637.308 | 51,58 | 363.052 | 41,88 | ||||
| 2026-04-22 | 13F | Pictet Asset Management Holding SA | 230.202 | 4.777 | ||||||
| 2026-04-22 | 13F | Caldwell Trust Co | 115 | 0,00 | 2 | 100,00 | ||||
| 2026-02-03 | 13F | Anfield Capital Management, LLC | 7.322 | 0,00 | 87 | -6,52 | ||||
| 2026-02-12 | 13F | Hollencrest Capital Management | 28 | 0,00 | 0 | |||||
| 2026-02-19 | 13F | Atomi Financial Group, Inc. | 48.415 | -3,30 | 574 | -9,48 | ||||
| 2026-02-17 | 13F | Brevan Howard Capital Management LP | 0 | -100,00 | 0 | |||||
| 2026-02-13 | 13F | Rhumbline Advisers | 99.156 | -8,08 | 1.175 | -13,99 | ||||
| 2026-02-18 | 13F | Beacon Pointe Advisors, LLC | 23.289 | -36,52 | 276 | -40,73 | ||||
| 2026-03-31 | 13F/A | Henson-Edgewater Management, LLC | 40.050 | 475 | ||||||
| 2026-04-15 | 13F | Nations Financial Group Inc, /ia/ /adv | 39.459 | 819 | ||||||
| 2026-02-04 | 13F | Summit Wealth Group Llc / Co | 0 | -100,00 | 0 | |||||
| 2026-02-17 | 13F | Farringdon Capital, Ltd. | 49.661 | -69,32 | 588 | -71,29 | ||||
| 2026-02-13 | 13F | Macquarie Group Ltd | 0 | -100,00 | 0 | |||||
| 2026-02-11 | 13F | Fore Capital, LLC | 80.000 | 948 | ||||||
| 2026-02-13 | 13F | Transamerica Financial Advisors, Inc. | 1.797 | 21 | ||||||
| 2026-02-17 | 13F | Voloridge Investment Management, Llc | 1.633.914 | -31,71 | 19.362 | -36,08 | ||||
| 2026-04-23 | 13F | SJS Investment Consulting Inc. | 512 | -22,31 | 11 | 42,86 | ||||
| 2026-04-24 | 13F | TT International Asset Management LTD | 1.070.534 | 22.214 | ||||||
| 2026-02-10 | 13F | Acadian Asset Management Llc | 57.234 | 141,76 | 1 | |||||
| 2026-02-17 | 13F | Fearnley Asset Management As | 399.595 | 17.590 | ||||||
| 2026-02-12 | 13F | CoreCommodity Management, LLC | 12.064 | 0,00 | 143 | -6,58 | ||||
| 2026-04-21 | 13F | GHP Investment Advisors, Inc. | 2.164 | 0,00 | 45 | 76,00 | ||||
| 2026-04-20 | 13F | North of South Capital LLP | 227.683 | -14,36 | 4.724 | 49,97 | ||||
| 2026-02-11 | 13F | Accuvest Global Advisors | 27.250 | 323 | ||||||
| 2026-02-17 | 13F | Stokes Family Office, LLC | 10.271 | 2,71 | 122 | -3,97 | ||||
| 2026-02-17 | 13F | Qube Research & Technologies Ltd | 909.787 | -30,13 | 10.781 | -34,60 | ||||
| 2026-02-02 | 13F | Chung Wu Investment Group, LLC | 3.000 | 0,00 | 36 | -5,41 | ||||
| 2026-02-17 | 13F | Capital Fund Management S.a. | 176.798 | 95,17 | 2.095 | 82,81 | ||||
| 2026-02-13 | 13F | Y-Intercept (Hong Kong) Ltd | 1.654.678 | 7,28 | 19.608 | 0,41 | ||||
| 2026-04-13 | 13F | Salem Investment Counselors Inc | 456.331 | -9,25 | 9.469 | 58,81 | ||||
| 2025-11-14 | 13F | AXA Investment Managers S.A. | 144.159 | 1.825 | ||||||
| 2026-03-03 | 13F/A | Caitong International Asset Management Co., Ltd | 192 | -76,44 | 2 | -80,00 | ||||
| 2026-02-04 | 13F | Legacy Financial Advisors, Inc. | 0 | -100,00 | 0 | |||||
| 2026-02-17 | 13F | Cetera Investment Advisers | 434.723 | -4,76 | 5.151 | -10,85 | ||||
| 2026-02-12 | 13F | Campbell & CO Investment Adviser LLC | 63.510 | -48,50 | 753 | -51,83 | ||||
| 2026-02-13 | 13F | Cohen & Steers, Inc. | 289.410 | 51,97 | 3 | 50,00 | ||||
| 2026-02-13 | 13F | Capula Management Ltd | 164.470 | 1.949 | ||||||
| 2026-02-13 | 13F | Walleye Capital LLC | Call | 93.500 | 734,82 | 1.108 | 685,11 | |||
| 2026-02-13 | 13F | Walleye Capital LLC | Put | 99.300 | 204,60 | 1.177 | 185,44 | |||
| 2026-02-13 | 13F | Walleye Capital LLC | 154.783 | 19,77 | 1.834 | 12,10 | ||||
| 2025-11-14 | 13F | Point72 Europe (London) LLP | 945.166 | -26,23 | 11.966 | -25,34 | ||||
| 2026-04-16 | 13F | Ellsworth Advisors, LLC | 451.308 | -1,55 | 9.365 | 62,01 | ||||
| 2026-02-13 | 13F | Integrated Wealth Concepts LLC | 57.199 | -7,31 | 678 | -13,32 | ||||
| 2026-02-13 | 13F | SRS Capital Advisors, Inc. | 9.241 | 47,31 | 110 | 37,97 | ||||
| 2026-02-17 | 13F | Cape Investment Advisory, Inc. | 229 | 3 | ||||||
| 2026-02-04 | 13F | Nwam Llc | 25.811 | -4,82 | 370 | 16,72 | ||||
| 2026-02-05 | 13F | Elyxium Wealth, LLC | 1.525 | 18 | ||||||
| 2026-01-30 | 13F | R Squared Ltd | 43.842 | 10,28 | 520 | 3,18 | ||||
| 2026-04-06 | 13F | GAMMA Investing LLC | 2.685 | 183,83 | 56 | 400,00 | ||||
| 2026-02-13 | 13F | BNP Paribas Asset Management Holding S.A. | 154.320 | 2 | ||||||
| 2026-04-07 | 13F | U.S. Capital Wealth Advisors, LLC | 15.121 | 6,49 | 314 | 86,31 | ||||
| 2026-02-11 | 13F | Erste Asset Management GmbH | 0 | 0 | ||||||
| 2026-02-12 | 13F | ICICI Prudential Asset Management Co Ltd | 0 | -100,00 | 0 | |||||
| 2026-02-05 | 13F | Stephens Inc /ar/ | 41.714 | 494 | ||||||
| 2026-02-11 | 13F | Parallel Advisors, LLC | 22.125 | -5,60 | 262 | -11,49 | ||||
| 2026-04-14 | 13F | Nbc Securities, Inc. | 1.008 | -5,17 | 21 | 66,67 | ||||
| 2026-02-17 | 13F | Tower Research Capital LLC (TRC) | 819 | 8,76 | 10 | 0,00 | ||||
| 2026-02-13 | 13F | Kestra Advisory Services, LLC | 0 | -100,00 | 0 | |||||
| 2026-02-10 | 13F | Goldman Sachs Group Inc | Put | 2.295.000 | 70,63 | 27.196 | 59,72 | |||
| 2026-02-13 | 13F | Colony Group, LLC | 43.544 | 30,83 | 519 | 23,28 | ||||
| 2026-02-17 | 13F | Virtus Investment Advisers, Inc. | 0 | -100,00 | 0 | |||||
| 2026-02-06 | 13F | HighTower Advisors, LLC | 123.418 | 19,92 | 1.463 | 12,29 | ||||
| 2026-02-10 | 13F | Goldman Sachs Group Inc | Call | 2.070.000 | 0,00 | 24.530 | -6,40 | |||
| 2026-02-17 | 13F | Laird Norton Trust Company, Llc | 52.156 | 637 | ||||||
| 2026-02-10 | 13F | Goldman Sachs Group Inc | 13.016.686 | 93,94 | 154.248 | 81,54 | ||||
| 2026-02-12 | 13F | Steward Partners Investment Advisory, Llc | 96.646 | -17,70 | 1.145 | -22,95 | ||||
| 2026-01-13 | 13F | Kathmere Capital Management, LLC | 35.496 | -11,13 | 421 | -16,83 | ||||
| 2026-02-11 | 13F | Ramirez Asset Management, Inc. | 87 | 1 | ||||||
| 2026-02-13 | 13F | Natixis | 160.063 | 83,04 | 1.897 | 71,27 | ||||
| 2026-02-17 | 13F | Cresset Asset Management, LLC | 0 | -100,00 | 0 | |||||
| 2026-02-17 | 13F | Capital Fund Management S.a. | Call | 345.100 | -0,35 | 4.089 | -6,73 | |||
| 2026-02-13 | 13F | Evelyn Partners Investment Management LLP | 650 | 0,00 | 8 | -12,50 | ||||
| 2026-02-06 | 13F | Pnc Financial Services Group, Inc. | 56.034 | 35,66 | 664 | 27,20 | ||||
| 2026-02-11 | 13F | Cerity Partners LLC | 67.744 | 67,43 | 803 | 56,64 | ||||
| 2025-11-12 | 13F | Quantbot Technologies LP | 0 | -100,00 | 0 | -100,00 | ||||
| 2026-01-28 | 13F | Geneos Wealth Management Inc. | 2.000 | 0,00 | 24 | -8,00 | ||||
| 2026-02-17 | 13F | Capital Fund Management S.a. | Put | 200.300 | 9,16 | 2.374 | 2,15 | |||
| 2026-02-09 | 13F | Harbour Investments, Inc. | 1.256 | 0,00 | 15 | -6,67 | ||||
| 2026-02-12 | 13F | JBF Capital, Inc. | 62.000 | 3,33 | 699 | -1,55 | ||||
| 2026-04-24 | 13F | Deltec Asset Management Llc | 0 | -100,00 | 0 | |||||
| 2026-02-17 | 13F | Jump Financial, LLC | 774.182 | 389,99 | 9.174 | 358,70 | ||||
| 2026-03-16 | 13F/A | Rockefeller Capital Management L.P. | 23.986 | 42,86 | 284 | 33,96 | ||||
| 2026-02-04 | 13F | D'Orazio & Associates, Inc. | 12.498 | -14,43 | 148 | -19,57 | ||||
| 2026-02-12 | 13F | BlackRock, Inc. | 11.573.196 | 3,67 | 137.142 | -2,96 | ||||
| 2026-04-13 | 13F | Wolff Wiese Magana Llc | 5.000 | 0,00 | 104 | 74,58 | ||||
| 2026-02-11 | 13F | Capital Wealth Planning, LLC | 257.372 | 37,62 | 3.068 | 29,57 | ||||
| 2026-02-05 | 13F | May Hill Capital, LLC | 0 | -100,00 | 0 | |||||
| 2026-03-06 | 13F | Hsbc Holdings Plc | Call | 0 | -100,00 | 0 | ||||
| 2026-03-06 | 13F | Hsbc Holdings Plc | Put | 0 | -100,00 | 0 | ||||
| 2026-02-13 | 13F | Vontobel Holding Ltd. | 85.551 | 98,69 | 1.014 | 85,87 | ||||
| 2025-11-13 | 13F | Eisler Capital Management Ltd. | 0 | -100,00 | 0 | -100,00 | ||||
| 2026-01-27 | 13F | BankPlus Trust Department | 44.000 | 521 | ||||||
| 2025-10-30 | 13F | Twin Peaks Wealth Advisors, LLC | 0 | -100,00 | 0 | |||||
| 2026-02-17 | 13F | SageView Advisory Group, LLC | 725 | 9 | ||||||
| 2026-01-16 | 13F | Standard Life Aberdeen plc | 608.893 | 112,85 | 7.215 | 96,27 | ||||
| 2026-02-13 | 13F | Inspire Advisors, LLC | 11.502 | 0,75 | 136 | -5,56 | ||||
| 2026-02-13 | 13F | Citigroup Inc | 1.738.958 | 80,30 | 20.607 | 68,76 | ||||
| 2026-02-13 | 13F | Citigroup Inc | Call | 977.800 | 14,31 | 11.587 | 6,99 | |||
| 2025-11-13 | 13F | Total Investment Management Inc | 0 | -100,00 | 0 | |||||
| 2026-01-22 | 13F | Lesa Sroufe & Co | 288.600 | -8,09 | 3 | 0,00 | ||||
| 2026-02-13 | 13F | Citigroup Inc | Put | 2.435.000 | 14,32 | 28.855 | 7,01 | |||
| 2026-02-17 | 13F | Quantitative Investment Management, LLC | 0 | -100,00 | 0 | |||||
| 2026-01-30 | 13F | Sigma Planning Corp | 27.179 | -3,36 | 325 | -9,22 | ||||
| 2026-04-21 | 13F | Financial Consulate, Inc | 337 | 648,89 | 7 | |||||
| 2026-01-30 | 13F | ARGA Investment Management, LP | 18.975.177 | 0,89 | 224.856 | -5,57 | ||||
| 2026-04-21 | 13F | Vise Technologies, Inc. | 44.031 | 0,00 | 522 | 0,00 | ||||
| 2026-01-23 | 13F | Nbt Bank N A /ny | 2.000 | 0,00 | 24 | -8,00 | ||||
| 2026-04-16 | 13F | Connective Portfolio Management, LLC | 140.200 | 2.909 | ||||||
| 2026-01-07 | 13F | St. Louis Financial Planners Asset Management, LLC | 0 | -100,00 | 0 | |||||
| 2025-10-30 | 13F | Mizuho Securities Co. Ltd. | 0 | -100,00 | 0 | |||||
| 2026-04-15 | 13F | Hatch Cove Capital, Llc | 974.600 | 20.223 | ||||||
| 2026-02-12 | 13F | Provida Pension Fund Administrator | 0 | -100,00 | 0 | |||||
| 2026-04-15 | 13F | City Holding Co | 6.773 | 0,00 | 141 | 75,00 | ||||
| 2026-02-10 | 13F | State of Wyoming | 59.672 | 1,93 | 707 | -4,59 | ||||
| 2026-02-11 | 13F | Winton Capital Group Ltd | 86.000 | 1.019 | ||||||
| 2026-02-12 | 13F | Groupe la Francaise | 0 | -100,00 | 0 | |||||
| 2026-02-11 | 13F | Longfellow Investment Management Co Llc | 182.307 | -13,28 | 2.160 | -18,83 | ||||
| 2026-02-17 | 13F | Signature Equity Partners, LLC | 227 | 3 | ||||||
| 2026-02-13 | 13F | Verition Fund Management LLC | 0 | -100,00 | 0 | -100,00 | ||||
| 2026-02-09 | 13F/A | Fideuram - Intesa Sanpaolo Private Banking S.p.a. | 282.562 | 3.348 | ||||||
| 2026-02-13 | 13F | Stifel Financial Corp | 248.079 | 32,71 | 2.940 | 24,22 | ||||
| 2026-01-20 | 13F | Stratos Wealth Advisors, LLC | 0 | -100,00 | 0 | |||||
| 2026-02-18 | 13F | EP Wealth Advisors, Inc. | 0 | -100,00 | 0 | |||||
| 2026-04-14 | 13F | Shrier Wealth Management, Llc | 40.243 | -16,34 | 835 | 46,49 | ||||
| 2026-02-12 | 13F | Principal Securities, Inc. | 36.379 | 27,78 | 431 | 19,72 | ||||
| 2025-11-14 | 13F | Sofos Investments, Inc. | 0 | -100,00 | 0 | |||||
| 2026-02-06 | 13F | Profund Advisors Llc | 92.364 | 10,34 | 1.095 | 3,31 | ||||
| 2026-02-05 | 13F | Bessemer Group Inc | 13.746 | -1,11 | 0 | |||||
| 2026-02-05 | 13F | Allworth Financial LP | 12.248 | 0,60 | 145 | -5,84 | ||||
| 2025-11-14 | 13F | Binnacle Investments Inc | 634 | -5,65 | 8 | 0,00 | ||||
| 2026-02-09 | 13F | Beck Bode, LLC | Call | 0 | -100,00 | 0 | -100,00 | |||
| 2026-01-15 | 13F | Lodestone Wealth Management LLC | 1 | 0 | ||||||
| 2026-02-11 | 13F | West Family Investments, Inc. | 21.406 | -22,13 | 254 | -27,30 | ||||
| 2026-02-17 | 13F | Tudor Investment Corp Et Al | Put | 22.500 | -34,21 | 267 | -38,43 | |||
| 2026-02-17 | 13F | Tudor Investment Corp Et Al | Call | 35.500 | 85,86 | 421 | 74,27 | |||
| 2026-04-15 | 13F | FNY Investment Advisers, LLC | 760 | -93,35 | 0 | |||||
| 2026-02-13 | 13F | Verition Fund Management LLC | Put | 500.600 | 0,00 | 5.932 | -6,39 | |||
| 2026-02-12 | 13F | Renaissance Technologies Llc | 9.555.200 | -9,41 | 113.229 | -15,20 | ||||
| 2026-01-30 | 13F | Cullinan Associates Inc | 33.200 | 0,00 | 393 | -6,43 | ||||
| 2026-04-23 | 13F | Comprehensive Money Management Services LLC | 19.850 | -4,22 | 412 | 67,76 | ||||
| 2026-04-24 | 13F | Keybank National Association/oh | 16.221 | 337 | ||||||
| 2026-03-26 | 13F | Alexander Labrunerie & Co., Inc. | 10.050 | 0,00 | 119 | -6,30 | ||||
| 2026-04-09 | 13F | Nelson, Van Denburg & Campbell Wealth Management Group, LLC | 16.149 | 3,27 | 335 | 81,08 | ||||
| 2026-02-13 | 13F | Cloverfields Capital Group, Lp | 226.694 | 1,53 | 2.686 | -4,95 | ||||
| 2026-02-09 | 13F | Todd Asset Management Llc | 3.059.639 | -2,47 | 36.257 | -8,71 | ||||
| 2026-02-11 | 13F | Metis Global Partners, LLC | 111.668 | 1,76 | 1.323 | -4,75 | ||||
| 2026-02-12 | 13F | Federation des caisses Desjardins du Quebec | 23.150 | -79,13 | 274 | -80,48 | ||||
| 2026-02-17 | 13F | Old West Investment Management, LLC | 78.040 | 925 | ||||||
| 2026-02-06 | 13F | New Millennium Group LLC | 13.246 | 185,23 | 157 | 168,97 | ||||
| 2026-02-10 | 13F | Nomura Asset Management Co Ltd | 29.762 | -50,96 | 353 | -54,17 | ||||
| 2026-02-17 | 13F | Nomura Holdings Inc | 94.508 | 28,22 | 1.120 | 19,94 | ||||
| 2026-01-23 | 13F | Rsm Us Wealth Management Llc | 11.377 | -18,26 | 135 | -23,86 | ||||
| 2026-02-17 | 13F | Nomura Holdings Inc | Put | 95.000 | 0,00 | 1.126 | -6,41 | |||
| 2026-04-17 | 13F | AdvisorNet Financial, Inc | 268 | -84,84 | 6 | -75,00 | ||||
| 2026-04-24 | 13F | Yousif Capital Management, Llc | 24.063 | 0,00 | 499 | 62,01 | ||||
| 2026-02-10 | 13F | Connor, Clark & Lunn Investment Management Ltd. | 120.783 | 1.431 | ||||||
| 2026-02-13 | 13F | Barclays Plc | Put | 0 | -100,00 | 0 | -100,00 | |||
| 2026-02-11 | 13F | J.Safra Asset Management Corp | 27.797 | 98,59 | 329 | 85,88 | ||||
| 2026-02-10 | 13F | Bank of New York Mellon Corp | 92.146 | 0,20 | 1.092 | -6,27 | ||||
| 2026-04-13 | 13F | IFP Advisors, Inc | 1.003 | 0,00 | 21 | 81,82 | ||||
| 2026-01-30 | 13F | Pekin Hardy Strauss, Inc. | 42.352 | 32,96 | 502 | 24,32 | ||||
| 2026-02-12 | 13F | Barings Llc | 73.545 | 0,00 | 872 | -6,44 | ||||
| 2026-02-13 | 13F | Pinnacle Wealth Planning Services, Inc. | 2.159 | 26 | ||||||
| 2026-02-17 | 13F | SummitTX Capital, L.P. | 64.220 | 340,38 | 761 | 313,59 | ||||
| 2026-02-24 | 13F | DGS Capital Management, LLC | 24.067 | -47,83 | 285 | -51,20 | ||||
| 2026-02-02 | 13F | Oppenheimer & Co Inc | 0 | -100,00 | 0 | |||||
| 2026-04-06 | 13F | Highline Wealth Partners Llc | 1.102 | 4,65 | 23 | 83,33 | ||||
| 2026-02-11 | 13F | Capital International Sarl | 39.177 | 0,00 | 464 | -6,26 | ||||
| 2026-02-17 | 13F | Sagefield Capital LP | 433.731 | 354,04 | 5.140 | 325,06 | ||||
| 2026-01-29 | 13F | RMG Wealth Management LLC | 10 | 0,00 | 0 | |||||
| 2026-02-13 | 13F | Umb Bank N A/mo | 0 | -100,00 | 0 | -100,00 | ||||
| 2026-01-21 | 13F | Westfuller Advisors, LLC | 6.888 | -0,88 | 84 | -5,62 | ||||
| 2026-02-17 | 13F | Schonfeld Strategic Advisors LLC | 116.030 | -50,80 | 1.375 | -53,97 | ||||
| 2026-02-13 | 13F/A | Virtus ETF Advisers LLC | 0 | -100,00 | 0 | |||||
| 2026-02-09 | 13F | Employees Retirement System of Texas | 65.509 | -69,83 | 1 | -100,00 | ||||
| 2026-02-17 | 13F | Abel Hall, LLC | 20.500 | 0,00 | 243 | -6,56 | ||||
| 2025-11-06 | 13F | Ameritas Advisory Services, LLC | 0 | -100,00 | 0 | -100,00 | ||||
| 2026-02-05 | 13F | Tucker Asset Management Llc | 50 | 1 | ||||||
| 2026-04-24 | 13F | Medallion Wealth Advisors, LLC | 263 | 0,00 | 5 | 66,67 | ||||
| 2026-02-05 | 13F | Td Private Client Wealth Llc | 21.902 | -1,82 | 260 | -8,16 | ||||
| 2026-01-26 | 13F | SeaBridge Investment Advisors LLC | 0 | -100,00 | 0 | -100,00 | ||||
| 2026-04-14 | 13F | Banque Pictet & Cie Sa | 37.000 | 768 | ||||||
| 2026-04-24 | 13F | Strs Ohio | 27.687 | -13,20 | 575 | 51,85 | ||||
| 2026-02-17 | 13F | Wiley Bros.-aintree Capital, Llc | 31.298 | 36,15 | 371 | 26,28 | ||||
| 2026-02-05 | 13F | Blume Capital Management, Inc. | 300 | 0,00 | 4 | 0,00 | ||||
| 2026-02-06 | 13F | Kilter Group LLC | 0 | -100,00 | 0 | |||||
| 2026-02-02 | 13F | Fifth Third Bancorp | 43.162 | -6,25 | 511 | -12,20 | ||||
| 2026-01-27 | 13F | Regions Financial Corp | 53.799 | -2,01 | 638 | -8,35 | ||||
| 2026-02-17 | 13F | Warren Averett Asset Management, LLC | 14.735 | 25,00 | 175 | 16,78 | ||||
| 2026-04-23 | 13F | CWM Advisors, LLC | 7.062 | 8,85 | 147 | 92,11 | ||||
| 2026-02-09 | 13F | Fisher Asset Management, LLC | 13.982.981 | -2,18 | 165.698 | -8,44 | ||||
| 2026-02-13 | 13F | VPR Management LLC | 132.846 | 0,00 | 1.574 | -6,37 | ||||
| 2026-02-17 | 13F | Ameriprise Financial Inc | 3.775.081 | 7,19 | 44.742 | 0,34 | ||||
| 2026-04-07 | 13F | Park Avenue Securities Llc | 21.580 | 9,33 | 0 | |||||
| 2026-02-12 | 13F | Advisors Asset Management, Inc. | 179.867 | 13,45 | 2.131 | 6,18 | ||||
| 2026-04-13 | 13F | Artemis Investment Management LLP | 4.619.431 | 129,90 | 95.853 | 302,57 | ||||
| 2026-02-10 | 13F | Avestar Capital, LLC | 14.523 | -40,31 | 172 | -44,16 | ||||
| 2025-12-08 | 13F | NWF Advisory Services Inc. | 10.195 | -2,90 | 163 | 3,18 | ||||
| 2026-01-29 | 13F | Sava Infond d.o.o. | 23.000 | 0,00 | 273 | -6,53 | ||||
| 2026-04-16 | 13F | Diversified Trust Co | 55.021 | 1.142 | ||||||
| 2026-01-21 | 13F | Provident Living Financial Services, Inc. | 88.360 | 1.047 | ||||||
| 2026-02-17 | 13F | Wellington Management Group Llp | 935.559 | 40,12 | 11.086 | 31,15 | ||||
| 2026-01-08 | 13F | Tuttle Tactical Management LLC | 23.055 | 273 | ||||||
| 2026-02-17 | 13F | Redwood Park Advisors LLC | 6.818 | 60,50 | 81 | 50,94 | ||||
| 2025-11-14 | 13F | Wetherby Asset Management Inc | 38.247 | -4,98 | 484 | -3,78 | ||||
| 2026-02-13 | 13F | Blueshift Asset Management, LLC | 0 | -100,00 | 0 | |||||
| 2026-02-20 | 13F | Sunbelt Securities, Inc. | 6 | 0,00 | 0 | |||||
| 2026-02-10 | 13F | Natixis Advisors, L.p. | 1.231.385 | -6,68 | 15 | -12,50 | ||||
| 2026-01-27 | 13F | Zurcher Kantonalbank (Zurich Cantonalbank) | 58.400 | -2,33 | 692 | -8,47 | ||||
| 2026-02-13 | 13F | Aigen Investment Management, Lp | 0 | -100,00 | 0 | |||||
| 2025-11-14 | 13F | Mount Yale Investment Advisors, LLC | 0 | -100,00 | 0 | -100,00 | ||||
| 2026-03-31 | 13F/A | Barclays Plc | Call | 0 | -100,00 | 0 | -100,00 | |||
| 2026-02-18 | 13F | GWM Advisors LLC | 12.668 | -5,09 | 150 | -10,71 | ||||
| 2026-02-17 | 13F | EFG International AG | 36.790 | 436 | ||||||
| 2026-02-12 | 13F | Sprott Inc. | 0 | -100,00 | 0 | |||||
| 2026-02-05 | 13F | Atria Investments Llc | 25.140 | 0,89 | 298 | -5,71 | ||||
| 2026-02-20 | 13F/A | CMT Capital Markets Trading GmbH | 31.702 | -79,09 | 0 | -100,00 | ||||
| 2026-04-21 | 13F | Drum Hill Capital, LLC | 132.360 | 0,54 | 2.746 | 76,03 | ||||
| 2026-02-13 | 13F | Nfj Investment Group, Llc | 130 | 0,00 | 2 | 0,00 | ||||
| 2026-02-17 | 13F | Delaware Management Holdings, Inc. | 1.759.423 | 20.849 | ||||||
| 2025-11-14 | 13F | XTX Topco Ltd | 0 | -100,00 | 0 | -100,00 | ||||
| 2026-02-13 | 13F | Absolute Gestao de Investimentos Ltda. | 72.841 | 863 | ||||||
| 2026-02-17 | 13F | Rwc Asset Advisors (us) Llc | 0 | -100,00 | 0 | |||||
| 2026-02-12 | 13F | Rossby Financial, LCC | 11.798 | 9,16 | 140 | 2,21 | ||||
| 2026-02-12 | 13F | Skopos Labs, Inc. | 52.920 | 132,02 | 613 | 117,38 | ||||
| 2026-02-13 | 13F | Candriam Luxembourg S.C.A. | 25.741 | 0,00 | 305 | -6,15 | ||||
| 2026-04-20 | 13F | Obermeyer Wood Investment Counsel, Lllp | 18.423 | 0,00 | 382 | 75,23 | ||||
| 2026-02-03 | 13F | Lumbard & Kellner, LLC | 707.365 | 39,29 | 8.382 | 30,38 | ||||
| 2026-04-23 | 13F | Harbor Investment Advisory, Llc | 2.620 | 54 | ||||||
| 2026-04-09 | 13F | Moody National Bank Trust Division | 10.050 | 209 | ||||||
| 2025-10-30 | 13F | Migdal Insurance & Financial Holdings Ltd. | 0 | -100,00 | 0 | |||||
| 2025-11-14 | 13F | Parallax Volatility Advisers, L.P. | 0 | -100,00 | 0 | -100,00 | ||||
| 2026-01-28 | 13F | WPG Advisers, LLC | 144 | 0,00 | 2 | 0,00 | ||||
| 2026-02-13 | 13F | MAI Capital Management | 3.945 | -15,78 | 47 | -22,03 | ||||
| 2025-11-14 | 13F | Vennlight Capital Management, LP | 0 | -100,00 | 0 | -100,00 | ||||
| 2026-04-14 | 13F | Perpetual Ltd | 3.297.257 | -0,48 | 68.418 | 74,26 | ||||
| 2025-11-13 | 13F | Contrarian Capital Management, L.l.c. | 0 | -100,00 | 0 | -100,00 | ||||
| 2026-01-08 | 13F | Brave Asset Management Inc | 0 | -100,00 | 0 | |||||
| 2026-02-17 | 13F | Moneda S.A. Administradora General de Fondos | 394.281 | -12,12 | 4.672 | -10,53 | ||||
| 2026-04-24 | 13F | UMA Financial Services, Inc. | 65 | 0,00 | 1 | |||||
| 2026-02-13 | 13F | Itau Unibanco Holding S.A. | 19.828.159 | 146,57 | 234.171 | 130,02 | ||||
| 2026-02-19 | 13F | Invesco Ltd. | 27.974.691 | 55,29 | 331.500 | 45,35 | ||||
| 2026-01-29 | 13F | UBS Group AG | 4.673.458 | 20,75 | 55.380 | 13,03 | ||||
| 2026-02-03 | 13F | International Assets Investment Management, Llc | 21.749 | 88,56 | 258 | 77,24 | ||||
| 2026-02-10 | 13F | Channing Global Advisors, Llc | 0 | -100,00 | 0 | |||||
| 2026-02-17 | 13F | Strategic Investment Advisors / MI | 13.741 | -18,31 | 163 | -23,58 | ||||
| 2026-02-09 | 13F | Fidelis Capital Partners, LLC | 0 | -100,00 | 0 | |||||
| 2026-02-10 | 13F | Eurizon Capital SGR S.p.A. | 83.759 | 992 | ||||||
| 2026-04-06 | 13F | Rosenberg Matthew Hamilton | 1.447 | 0,00 | 30 | 76,47 | ||||
| 2026-02-12 | 13F | New York State Common Retirement Fund | 2.579.822 | -4,54 | 30.571 | -10,65 | ||||
| 2026-01-27 | 13F | WealthCollab, LLC | 1.301 | -1,74 | 15 | -6,25 | ||||
| 2026-02-13 | 13F | NLB Skladi, upravljanje premozenja, d.o.o. | 312.384 | 3.702 | ||||||
| 2025-11-14 | 13F | Credit Agricole S A | 0 | -100,00 | 0 | |||||
| 2025-11-14 | 13F | Axa S.a. | 0 | -100,00 | 0 | |||||
| 2026-04-20 | 13F | Kestra Private Wealth Services, Llc | 0 | -100,00 | 0 | |||||
| 2026-02-03 | 13F | NewEdge Wealth, LLC | 16.083 | -13,81 | 191 | -15,93 | ||||
| 2026-02-11 | 13F | BI Asset Management Fondsmaeglerselskab A/S | 0 | -100,00 | 0 | |||||
| 2026-01-07 | 13F | Sagespring Wealth Partners, Llc | 10.241 | -5,86 | 121 | -11,68 | ||||
| 2026-04-17 | 13F | Baker Ellis Asset Management LLC | 12.000 | -33,33 | 249 | 16,90 | ||||
| 2026-02-17 | 13F | Massar Capital Management, LP | 0 | -100,00 | 0 | |||||
| 2026-02-06 | 13F | Global Retirement Partners, LLC | 18.998 | -75,05 | 225 | -76,66 | ||||
| 2026-01-29 | 13F | UBS Group AG | Put | 3.530.900 | -2,75 | 41.841 | -8,98 | |||
| 2026-01-29 | 13F | UBS Group AG | Call | 10.211.190 | 8,05 | 121.003 | 1,13 | |||
| 2026-02-12 | 13F | Hudock, Inc. | 15.498 | 0,73 | 184 | -5,67 | ||||
| 2026-02-17 | 13F | Lazard Asset Management Llc | 23.170.764 | 7,42 | 274.574 | 0,55 | ||||
| 2026-01-15 | 13F | Nisa Investment Advisors, Llc | 1.500 | -31,82 | 19 | -35,71 | ||||
| 2026-04-15 | 13F | Seacrest Wealth Management, Llc | 45.847 | -30,86 | 951 | 24,31 | ||||
| 2026-02-17 | 13F | Price T Rowe Associates Inc /md/ | 10.389.475 | 51,54 | 123 | 43,02 | ||||
| 2026-02-13 | 13F | JustInvest LLC | 13.470 | 10,23 | 160 | 3,25 | ||||
| 2026-03-26 | 13F | Leonteq Securities AG | Call | 0 | -100,00 | 0 | ||||
| 2026-02-13 | 13F | Mml Investors Services, Llc | 57.806 | -4,66 | 685 | -10,69 | ||||
| 2026-04-16 | 13F | SG Americas Securities, LLC | 784.417 | 1.604,03 | 16 | |||||
| 2026-04-20 | 13F | Longview Financial Advisors, Inc. | 1.095 | 23 | ||||||
| 2026-02-17 | 13F | Snowden Capital Advisors LLC | 13.607 | 162 | ||||||
| 2026-02-17 | 13F | Engineers Gate Manager LP | 189.726 | -0,10 | 2.248 | -6,49 | ||||
| 2026-02-13 | 13F | Hudson Portfolio Management LLC | 39.650 | 26,88 | 470 | 18,73 | ||||
| 2026-02-17 | 13F | Jones Financial Companies Lllp | 24.509 | 7,42 | 290 | -2,68 | ||||
| 2026-02-18 | 13F | Mackenzie Financial Corp | 381.560 | -65,19 | 4.516 | -67,45 | ||||
| 2026-01-29 | 13F | Teachers Retirement System Of The State Of Kentucky | 1.969.030 | 0,00 | 23 | -4,17 | ||||
| 2026-02-17 | 13F | Royal Bank Of Canada | Put | 261.000 | 3.093 | |||||
| 2025-11-07 | 13F | Sierra Ocean, Llc | 0 | -100,00 | 0 | -100,00 | ||||
| 2026-02-17 | 13F | Royal Bank Of Canada | Call | 25.000 | 0,00 | 296 | -6,62 | |||
| 2025-11-04 | 13F | High Note Wealth, LLC | 0 | -100,00 | 0 | |||||
| 2026-02-17 | 13F | Royal Bank Of Canada | 512.246 | 20,54 | 6.070 | 12,83 | ||||
| 2026-04-14 | 13F | Sanchez Gaunt Capital Management, LLC | 27.873 | 578 | ||||||
| 2026-02-02 | 13F | Principal Financial Group Inc | 137.994 | 18,22 | 1.635 | 10,70 | ||||
| 2026-02-13 | 13F | Cullen Capital Management, LLC | 2.271.269 | 44,09 | 26.915 | 34,87 | ||||
| 2026-02-17 | 13F | Northern Trust Corp | 1.724.470 | -9,98 | 20.435 | -15,75 | ||||
| 2026-02-17 | 13F | Limestone Investment Advisors LP | 88.461 | 24,57 | 1.048 | 16,70 | ||||
| 2026-04-15 | 13F | Bayforest Capital Ltd | 0 | -100,00 | 0 | |||||
| 2026-02-13 | 13F | FORA Capital, LLC | 0 | -100,00 | 0 | |||||
| 2026-04-14 | 13F | Corecam Pte. Ltd. | 0 | -100,00 | 0 | |||||
| 2025-11-13 | 13F | Eisler Capital Management Ltd. | Put | 600.000 | 0,00 | 7.740 | 3,12 | |||
| 2025-11-13 | 13F | Eisler Capital Management Ltd. | Call | 300.000 | 0,00 | 3.870 | 3,12 | |||
| 2026-02-12 | 13F | Jane Street Group, Llc | Put | 3.317.500 | 216,77 | 39.312 | 196,52 | |||
| 2026-02-12 | 13F | Jane Street Group, Llc | Call | 985.600 | 96,14 | 11.679 | 83,60 | |||
| 2025-11-25 | 13F | Briaud Financial Planning, Inc | 0 | -100,00 | 0 | |||||
| 2026-02-17 | 13F | Private Advisor Group, LLC | 159.116 | -3,92 | 1.886 | -10,07 | ||||
| 2026-02-12 | 13F | Jane Street Group, Llc | 1.455.710 | -28,43 | 17.250 | -33,01 | ||||
| 2026-02-13 | 13F | Hurley Capital, LLC | Call | 45 | 0,00 | 8 | -33,33 | |||
| 2026-02-13 | 13F | Wells Fargo & Company/mn | 1.157.480 | 24,40 | 13.716 | 16,44 | ||||
| 2026-02-17 | 13F | Parkwood LLC | 760.484 | 28,13 | 9 | 28,57 | ||||
| 2025-11-03 | 13F | Ballentine Partners, LLC | 0 | -100,00 | 0 | -100,00 | ||||
| 2026-04-24 | 13F | USS Investment Management Ltd | 894.094 | 0,00 | 18.548 | 75,14 | ||||
| 2026-02-02 | 13F | Sachetta, LLC | 0 | -100,00 | 0 | |||||
| 2026-04-16 | 13F | Everstar Asset Management, LLC | 26.794 | 103,34 | 556 | 255,77 | ||||
| 2026-04-20 | 13F | TrueMark Investments, LLC | 332.600 | 14,03 | 6.901 | 99,68 | ||||
| 2025-11-12 | 13F | Victory Capital Management Inc | 0 | -100,00 | 0 | -100,00 | ||||
| 2026-02-17 | 13F | Parvin Asset Management, LLC | 12.325 | 54,06 | 146 | 44,55 | ||||
| 2026-02-20 | 13F/A | Capital Markets Trading UK LLP | 440.351 | 99,01 | 5 | 150,00 | ||||
| 2026-01-29 | 13F | Sanctuary Advisors, LLC | 109.739 | 5,86 | 1.300 | -0,91 | ||||
| 2026-02-02 | 13F | Horizon Investments, LLC | 55 | 1 | ||||||
| 2026-02-11 | 13F | Capital International Inc /ca/ | 1.942.862 | 100,73 | 23.023 | 87,89 | ||||
| 2026-02-13 | 13F | Segall Bryant & Hamill, Llc | 36.200 | 0,00 | 429 | -6,55 | ||||
| 2026-02-13 | 13F | Squarepoint Ops LLC | Put | 218.000 | -65,93 | 2.583 | -68,11 | |||
| 2026-02-13 | 13F | Squarepoint Ops LLC | 657.453 | 93,54 | 7.791 | 81,16 | ||||
| 2025-11-14 | 13F | Cubist Systematic Strategies, LLC | Call | 354.800 | 5,97 | 4.492 | 7,23 | |||
| 2025-11-14 | 13F | Cubist Systematic Strategies, LLC | 1.932.399 | 508,33 | 24.464 | 515,76 | ||||
| 2026-02-17 | 13F | Kerrisdale Advisers, LLC | 111.126 | 0,00 | 1.317 | -6,40 | ||||
| 2026-04-17 | 13F | United Advisor Group, LLC | 19.934 | 2,57 | 414 | 79,57 | ||||
| 2026-02-03 | 13F | Wesbanco Bank Inc | 0 | -100,00 | 0 | |||||
| 2026-02-17 | 13F | Balyasny Asset Management Llc | 122.559 | 1.452 | ||||||
| 2026-02-17 | 13F | Balyasny Asset Management Llc | Call | 209.300 | 8,61 | 2.480 | 1,68 | |||
| 2026-02-18 | 13F | Caitlin John, LLC | 0 | -100,00 | 0 | |||||
| 2026-02-04 | 13F | Altman Advisors, Inc. | 122.811 | -6,46 | 1.455 | -12,45 | ||||
| 2026-02-11 | 13F | Franklin Resources Inc | 635.707 | -24,35 | 7.533 | -29,19 | ||||
| 2026-02-05 | 13F | Cambridge Investment Research Advisors, Inc. | 165.484 | -6,96 | 2 | -50,00 | ||||
| 2026-02-17 | 13F | Balyasny Asset Management Llc | Put | 64.000 | -34,09 | 758 | -38,32 | |||
| 2026-02-17 | 13F | Millennium Management Llc | Call | 429.300 | 1,35 | 5.087 | -5,13 | |||
| 2026-02-17 | 13F | Millennium Management Llc | 204.714 | -46,03 | 2.426 | -49,50 | ||||
| 2026-02-11 | 13F | Fox Run Management, L.l.c. | 46.842 | -9,79 | 555 | -15,53 | ||||
| 2026-02-17 | 13F | Millennium Management Llc | Put | 25.200 | -74,85 | 299 | -76,50 | |||
| 2026-01-30 | 13F/A | M&t Bank Corp | 21.581 | 0,00 | 256 | -6,59 | ||||
| 2026-02-06 | 13F/A | Rathbone Brothers plc | 0 | -100,00 | 0 | -100,00 | ||||
| 2026-02-09 | 13F | Beck Bode, LLC | 1.232.786 | -0,59 | 14.609 | -6,96 | ||||
| 2026-01-30 | 13F | Mitsubishi UFJ Trust & Banking Corp | 320.149 | -37,26 | 3.794 | -41,28 | ||||
| 2026-02-23 | 13F | Virtu Financial LLC | 41.883 | 0 | ||||||
| 2026-01-15 | 13F | Frank, Rimerman Advisors LLC | 35.055 | -15,67 | 415 | -21,10 | ||||
| 2025-11-05 | 13F | Wellington Shields & Co., LLC | 0 | -100,00 | 0 | |||||
| 2026-02-05 | 13F | Gabelli Funds Llc | 35.000 | 0,00 | 415 | -6,55 | ||||
| 2026-01-27 | 13F | Checchi Capital Advisers, LLC | 23.434 | -3,74 | 278 | -10,06 | ||||
| 2026-01-29 | 13F | Rakuten Securities, Inc. | 149.213 | 41,55 | 1.768 | 32,53 | ||||
| 2026-02-06 | 13F | Abn Amro Investment Solutions | 42.100 | 312,75 | 499 | 286,05 | ||||
| 2026-02-12 | 13F | JPL Wealth Management, LLC | 0 | -100,00 | 0 | |||||
| 2026-04-20 | 13F | Jfs Wealth Advisors, Llc | 508 | 0,00 | 11 | 66,67 | ||||
| 2026-01-23 | 13F | Tyche Wealth Partners LLC | 23.963 | -6,82 | 284 | -12,92 | ||||
| 2026-02-17 | 13F | Clear Street Markets Llc | 10.900 | 0,93 | 129 | -5,15 | ||||
| 2026-02-10 | 13F | NINE MASTS CAPITAL Ltd | 410.245 | 4.861 | ||||||
| 2025-10-28 | 13F | MAS Advisors LLC | 34.542 | 19,01 | 437 | 20,39 | ||||
| 2026-02-04 | 13F | Oxbow Advisors, LLC | 418.136 | 4.955 | ||||||
| 2026-02-10 | 13F | Hazlett, Burt & Watson, Inc. | 974 | 0,00 | 0 | |||||
| 2026-01-27 | 13F | Fundamenta Capital S.A. | 1.355.652 | 16.064 | ||||||
| 2026-02-13 | 13F | Banco Santander, S.A. | 434.136 | 196,57 | 5.145 | 177,60 | ||||
| 2026-02-02 | 13F | Truist Financial Corp | 32.726 | 2,60 | 388 | -3,97 | ||||
| 2026-01-23 | 13F | Assetmark, Inc | 1.174.976 | 8,71 | 13.923 | 1,75 | ||||
| 2026-01-15 | 13F | Victory Financial Group, Llc | 21.048 | -0,01 | 249 | -6,39 | ||||
| 2026-02-17 | 13F | Advisor Group Holdings, Inc. | Call | 2 | 0 | |||||
| 2026-02-03 | 13F | Horrell Capital Management, Inc. | 500 | 0,00 | 6 | -16,67 | ||||
| 2026-02-17 | 13F | Two Sigma Advisers, Lp | 145.700 | 250,24 | 1.727 | 228,14 | ||||
| 2025-11-04 | 13F | Centric Wealth Management | 0 | -100,00 | 0 | -100,00 | ||||
| 2026-02-09 | 13F | Cypress Capital Management LLC (WY) | 4 | 0,00 | 0 | |||||
| 2026-02-11 | 13F | IMA Wealth, Inc. | 118 | 1 | ||||||
| 2026-01-14 | 13F | ORG Partners LLC | 52.283 | 2.273,26 | 619 | 2.192,59 | ||||
| 2025-11-03 | 13F | Kapitalo Investimentos Ltda | 0 | -100,00 | 0 | |||||
| 2026-04-21 | 13F | Robeco Institutional Asset Management B.V. | 7.831.368 | 30,24 | 162.501 | 128,05 | ||||
| 2026-04-08 | 13F | Miracle Mile Advisors, LLC | 11.925 | 247 | ||||||
| 2026-02-17 | 13F | Aqr Capital Management Llc | 132.396 | 27,47 | 1.569 | 19,33 | ||||
| 2026-02-12 | 13F | Quadrant Capital Group Llc | 20.624 | -46,32 | 244 | -49,79 | ||||
| 2025-11-17 | 13F | FSA Wealth Management LLC | 68 | 0,00 | 1 | |||||
| 2025-11-14 | 13F | Gotham Asset Management, LLC | 0 | -100,00 | 0 | |||||
| 2026-01-21 | 13F | Prime Capital Investment Advisors, LLC | 93.798 | -1,29 | 1.112 | -7,57 | ||||
| 2026-02-12 | 13F | Tocqueville Asset Management L.p. | 25.675 | -7,56 | 304 | -13,39 | ||||
| 2026-02-05 | 13F | Thrivent Financial For Lutherans | 170.304 | 9,44 | 2 | 100,00 | ||||
| 2026-02-17 | 13F | Capstone Investment Advisors, Llc | 0 | -100,00 | 0 | -100,00 | ||||
| 2026-04-21 | 13F | Founders Capital Management | 5.000 | 0,00 | 104 | 74,58 | ||||
| 2026-01-21 | 13F | Step Capital Management Pte. Ltd. | 60.000 | 676 | ||||||
| 2026-01-29 | 13F | DecisionPoint Financial, LLC | 0 | -100,00 | 0 | |||||
| 2026-02-10 | 13F | CIBC World Markets Inc. | 67.577 | 38,46 | 801 | 29,66 | ||||
| 2026-02-17 | 13F | D. E. Shaw & Co., Inc. | Put | 525.000 | 62,74 | 6.221 | 52,33 | |||
| 2026-04-17 | 13F | Verde Servicos Internacionais S.A. | 2.400 | 0,00 | 0 | |||||
| 2026-02-17 | 13F | D. E. Shaw & Co., Inc. | 300.303 | -93,80 | 3.559 | -94,20 | ||||
| 2026-02-17 | 13F | D. E. Shaw & Co., Inc. | Call | 235.000 | -69,35 | 2.785 | -71,32 | |||
| 2026-02-17 | 13F | Janus Henderson Group Plc | 282.958 | 3.352 | ||||||
| 2026-02-05 | 13F | DnB Asset Management AS | 1.837.813 | 21.778 | ||||||
| 2026-04-15 | 13F | Nepsis, Inc. | 481.439 | 9.990 | ||||||
| 2026-02-20 | 13F/A | CMT Capital Markets Trading GmbH | Put | 779.900 | -29,76 | 9 | -35,71 | |||
| 2026-01-28 | 13F | Old National Bancorp /in/ | 0 | -100,00 | 0 | |||||
| 2026-02-20 | 13F/A | CMT Capital Markets Trading GmbH | Call | 1.269.400 | -18,95 | 15 | -21,05 | |||
| 2026-02-05 | 13F | Sapient Capital Llc | 0 | -100,00 | 0 | |||||
| 2026-02-17 | 13F | Blair William & Co/il | 10.861 | 1.314,19 | 129 | 1.322,22 | ||||
| 2026-02-03 | 13F | Sequoia Financial Advisors, LLC | 22.507 | 15,49 | 267 | 8,13 | ||||
| 2026-02-06 | 13F | Leonteq Securities AG | Put | 600.000 | 200,00 | 7.110 | 180,81 | |||
| 2026-02-06 | 13F | Leonteq Securities AG | 215.413 | -63,77 | 2.553 | -66,10 | ||||
| 2026-04-21 | 13F | Hennessy Advisors Inc | 441.600 | 18,71 | 9.163 | 107,87 | ||||
| 2026-02-03 | 13F | Crossmark Global Holdings, Inc. | 66.312 | -21,21 | 786 | -26,29 | ||||
| 2026-02-10 | 13F | Ted Buchan & Co | 191.403 | -25,04 | 2.268 | -29,83 | ||||
| 2025-11-10 | 13F | Kovitz Investment Group Partners, LLC | 0 | -100,00 | 0 | |||||
| 2026-02-17 | 13F | Dark Forest Capital Management Lp | 0 | -100,00 | 0 | -100,00 | ||||
| 2026-04-24 | 13F | James Investment Research Inc | 23.219 | 0,00 | 482 | 74,91 | ||||
| 2026-02-17 | 13F | Susquehanna International Group, Llp | 2.323.782 | 87,14 | 27.537 | 75,17 | ||||
| 2026-02-17 | 13F | Susquehanna International Group, Llp | Put | 9.523.000 | -2,44 | 112.848 | -8,68 | |||
| 2026-02-17 | 13F | Point72 Asset Management, L.P. | 4.895.056 | 9,02 | 58.006 | 2,05 | ||||
| 2026-02-17 | 13F | PACK Private Wealth, LLC | 10.767 | -21,18 | 128 | -26,16 | ||||
| 2026-02-05 | 13F | Financial Security Advisor, Inc. | 0 | -100,00 | 0 | |||||
| 2026-02-17 | 13F | Point72 Asset Management, L.P. | Put | 372.100 | 135,36 | 4.409 | 120,34 | |||
| 2026-02-17 | 13F | Susquehanna International Group, Llp | Call | 8.866.200 | 57,85 | 105.064 | 47,75 | |||
| 2026-02-17 | 13F | Point72 Asset Management, L.P. | Call | 939.500 | 268,58 | 11.133 | 245,00 | |||
| 2026-02-06 | 13F | Larson Financial Group LLC | 3.487 | -12,82 | 41 | -18,00 | ||||
| 2026-02-10 | 13F | Daiwa Securities Group Inc. | 157.123 | 182,10 | 2 | -66,67 | ||||
| 2026-02-13 | 13F | Thornburg Investment Management Inc | 344.876 | -0,42 | 4.087 | -6,80 | ||||
| 2026-04-20 | 13F | Banque Cantonale Vaudoise | 204.211 | 4.237 | ||||||
| 2026-04-14 | 13F | American State Bank (Iowa) | 0 | -100,00 | 0 | |||||
| 2026-01-28 | 13F | B. Metzler seel. Sohn & Co. AG | 220.671 | -42,27 | 2.615 | -45,98 | ||||
| 2026-02-19 | 13F/A | Axxcess Wealth Management, Llc | 18.055 | -2,75 | 214 | -9,36 | ||||
| 2026-04-15 | 13F | Cranbrook Wealth Management, LLC | 600 | 0,00 | 12 | 71,43 | ||||
| 2026-02-13 | 13F | Morgan Stanley | 12.087.833 | 23,65 | 143.241 | 15,74 | ||||
| 2026-02-13 | 13F | Level Four Advisory Services, Llc | 27.255 | -34,12 | 323 | -38,43 | ||||
| 2026-02-13 | 13F | HITE Hedge Asset Management LLC | 45.725 | -51,91 | 542 | -55,03 | ||||
| 2026-01-15 | 13F | J. Safra Sarasin Holding AG | 106.000 | 0,00 | 1.256 | -6,34 | ||||
| 2026-04-20 | 13F | Ronald Blue Trust, Inc. | 33.625 | 24,32 | 698 | 117,81 | ||||
| 2025-11-14 | 13F | Jain Global LLC | 0 | -100,00 | 0 | |||||
| 2026-04-13 | 13F | True Wealth Design, LLC | 563 | 160,65 | 12 | 450,00 | ||||
| 2026-02-12 | 13F | Commonwealth Equity Services, Llc | 134.046 | -10,39 | 1.588 | 158.700,00 | ||||
| 2026-01-27 | 13F | TD Waterhouse Canada Inc. | 849 | 30,82 | 10 | 25,00 | ||||
| 2026-02-13 | 13F | Pathstone Holdings, LLC | 27.694 | -8,32 | 328 | -14,14 | ||||
| 2026-01-27 | 13F | Evergreen Capital Management Llc | 39.541 | -38,02 | 476 | -41,43 | ||||
| 2026-01-21 | 13F | Flagship Harbor Advisors, Llc | 1.209 | 14 | ||||||
| 2025-11-14 | 13F | Peak6 Llc | Call | 0 | -100,00 | 0 | ||||
| 2026-04-08 | 13F | Legacy Wealth Asset Management, LLC | 41.045 | 1,26 | 852 | 77,29 | ||||
| 2026-02-12 | 13F | Earnest Partners Llc | 5.335.330 | 9,50 | 63.224 | 2,49 | ||||
| 2026-02-06 | 13F | Ignite Planners, LLC | 0 | -100,00 | 0 | |||||
| 2025-11-14 | 13F | Graham Capital Management, L.P. | 0 | -100,00 | 0 | -100,00 | ||||
| 2025-10-30 | 13F | Ridgewood Investments LLC | Call | 0 | -100,00 | 0 | -100,00 | |||
| 2026-01-30 | 13F | State of New Jersey Common Pension Fund D | 706.825 | -8,73 | 8.376 | -14,57 | ||||
| 2026-01-08 | 13F | Traveka Wealth, LLC | 0 | -100,00 | 0 | |||||
| 2026-02-17 | 13F/A | RBF Capital, LLC | 100.000 | -16,67 | 1.185 | -21,99 | ||||
| 2026-01-23 | 13F | Baillie Gifford & Co | 29.523.522 | -7,99 | 349.854 | -13,88 | ||||
| 2026-02-17 | 13F | Man Group plc | 598.768 | 344,18 | 7.095 | 315,89 | ||||
| 2026-02-17 | 13F | Bank Of America Corp /de/ | 13.767.405 | 61,61 | 163.144 | 51,27 | ||||
| 2026-02-09 | 13F | Hartland & Co., LLC | 2.330 | 273,40 | 28 | 285,71 | ||||
| 2026-02-17 | 13F | United Capital Financial Advisers, Llc | 19.234 | 7,96 | 228 | 0,89 | ||||
| 2026-04-23 | 13F | Element Squared LLC | 120.245 | 2.495 | ||||||
| 2026-04-23 | 13F | Oppenheimer Asset Management Inc. | 335.512 | 331,75 | 6.962 | 695,54 | ||||
| 2026-02-04 | 13F | Abc Arbitrage Sa | 25.949 | -86,80 | 307 | -87,67 | ||||
| 2026-04-03 | 13F | Ridgewood Investments LLC | 26.270 | -64,93 | 545 | -16,79 | ||||
| 2026-04-07 | 13F | Farther Finance Advisors, LLC | 36.786 | 6,75 | 739 | 80,88 | ||||
| 2026-04-23 | 13F | J.w. Cole Advisors, Inc. | 13.542 | 6,87 | 281 | 177,23 | ||||
| 2025-12-18 | 13F | Danske Bank A/s | 0 | -100,00 | 0 | |||||
| 2026-02-13 | 13F | Neuberger Berman Group LLC | 103.826 | -19,03 | 1.230 | -24,21 | ||||
| 2026-04-20 | 13F | LVW Advisors, LLC | 22.305 | 463 | ||||||
| 2026-02-17 | 13F | Russell Investments Group, Ltd. | 613.801 | -50,31 | 7.274 | -53,49 | ||||
| 2026-03-06 | 13F | Hsbc Holdings Plc | 1.283.495 | 9,91 | 15.208 | 10,18 | ||||
| 2026-04-15 | 13F | Journey Strategic Wealth Llc | 37.402 | -56,64 | 776 | -24,07 | ||||
| 2026-04-22 | 13F | Spire Wealth Management | 6.564 | -6,70 | 136 | 63,86 | ||||
| 2026-01-29 | 13F | Aprio Wealth Management, LLC | 19.928 | 8,26 | 236 | 1,29 | ||||
| 2026-02-10 | 13F | Bnp Paribas Arbitrage, Sa | Call | 11.231 | 34,55 | 13.309 | 25,94 | |||
| 2026-02-17 | 13F | Limestone Investment Advisors LP | Put | 0 | -100,00 | 0 | ||||
| 2026-02-10 | 13F | Bnp Paribas Arbitrage, Sa | 580.110 | 196,37 | 6.874 | 177,40 | ||||
| 2026-02-02 | 13F | Advisors Preferred, LLC | 20.609 | -89,50 | 246 | -90,10 | ||||
| 2026-04-15 | 13F | Atwood & Palmer Inc | 327 | 0,00 | 7 | 100,00 | ||||
| 2026-02-05 | 13F | Bank Julius Baer & Co. Ltd, Zurich | 163.600 | -3,76 | 1.939 | -9,94 | ||||
| 2026-02-09 | 13F | IPG Investment Advisors LLC | 185.185 | -51,28 | 2.260 | -53,92 | ||||
| 2026-02-10 | 13F | Bnp Paribas Arbitrage, Sa | Put | 11.042 | 5,95 | 13.085 | -0,83 | |||
| 2026-02-13 | 13F | American Century Companies Inc | 3.423.333 | 13,42 | 40.566 | 6,16 | ||||
| 2026-02-04 | 13F | Fourth Dimension Wealth, LLC | 600 | 0,00 | 7 | 0,00 | ||||
| 2026-02-17 | 13F | Creative Planning | 185.973 | 32,84 | 2.204 | 24,32 | ||||
| 2026-02-13 | 13F | Toroso Investments, LLC | 135.675 | 42,66 | 1.608 | 33,47 | ||||
| 2026-02-03 | 13F | Plan Group Financial, LLC | 0 | -100,00 | 0 | |||||
| 2026-04-07 | 13F | CoreCap Advisors, LLC | 211 | -54,23 | 4 | -20,00 | ||||
| 2026-02-18 | 13F/A | Robotti Robert | 50.000 | 0,00 | 592 | -6,48 | ||||
| 2026-02-17 | 13F | Quadrature Capital Ltd | 372.338 | 59,87 | 4.412 | 49,71 | ||||
| 2026-02-11 | 13F | LPL Financial LLC | 462.738 | 33,21 | 5.483 | 24,70 | ||||
| 2026-01-26 | 13F | Mirae Asset Global Investments Co., Ltd. | 105.031 | 3,04 | 1.245 | -3,57 | ||||
| 2026-02-12 | 13F | CIBC Private Wealth Group, LLC | 765 | 6,55 | 9 | 0,00 | ||||
| 2026-04-21 | 13F | PharVision Advisers, LLC | 0 | -100,00 | 0 | |||||
| 2025-11-21 | 13F | Bell Investment Advisors, Inc | 0 | -100,00 | 0 | -100,00 | ||||
| 2026-04-13 | 13F | Fiduciary Financial Group, Llc | 24.704 | 513 | ||||||
| 2026-02-05 | 13F | Baader Bank INC | 0 | -100,00 | 0 | |||||
| 2026-02-12 | 13F | Sagil Capital Llp | 611.224 | 7.243 | ||||||
| 2026-02-12 | 13F | Sagil Capital Llp | Call | 350.000 | 4.148 | |||||
| 2025-10-31 | 13F | Whittier Trust Co Of Nevada Inc | 0 | -100,00 | 0 | |||||
| 2026-02-11 | 13F | Deutsche Bank Ag\ | 6.661 | 9,52 | 79 | 2,63 | ||||
| 2026-04-15 | 13F | Generali Investments CEE, investicni spolecnost, a.s. | 110.600 | -26,07 | 2.295 | 29,46 | ||||
| 2026-04-16 | 13F | Annex Advisory Services, LLC | 2.132.353 | 1,13 | 44.246 | 77,08 | ||||
| 2026-02-17 | 13F | Grantham, Mayo, Van Otterloo & Co. LLC | 24.048 | -16,46 | 285 | -21,98 | ||||
| 2026-02-13 | 13F | Maven Securities LTD | 54.818 | 650 | ||||||
| 2026-02-17 | 13F | Breakout Capital Partners, LP | 1.182.589 | 0,84 | 14.014 | -5,61 | ||||
| 2026-02-12 | 13F | Ci Investments Inc. | 582.509 | -64,77 | 6.903 | 34.410,00 | ||||
| 2026-02-13 | 13F | GQG Partners LLC | 136.003.212 | -35,83 | 1.611.638 | -39,94 | ||||
| 2026-02-13 | 13F | Parkside Financial Bank & Trust | 4.544 | 264,10 | 54 | 253,33 | ||||
| 2026-02-13 | 13F | PCM Encore, LLC | 20.028 | 237 | ||||||
| 2026-02-17 | 13F | Limestone Investment Advisors LP | Call | 0 | -100,00 | 0 | ||||
| 2026-04-10 | 13F | Abound Wealth Management | 17 | -29,17 | 0 | |||||
| 2026-01-29 | 13F | Quest 10 Wealth Builders, Inc. | 0 | -100,00 | 0 | |||||
| 2026-04-07 | 13F | Signaturefd, Llc | 32.095 | 3,41 | 666 | 81,20 | ||||
| 2026-02-13 | 13F | Smartleaf Asset Management LLC | 712 | 0,00 | 8 | -11,11 | ||||
| 2026-04-22 | 13F | Union Bancaire Privee, UBP SA | 33.757 | -23,40 | 702 | 41,25 | ||||
| 2026-02-10 | 13F | Rothschild Investment Llc | 450 | 0,00 | 5 | 0,00 | ||||
| 2025-11-14 | 13F | Hrt Financial Lp | 0 | -100,00 | 0 | |||||
| 2025-11-14 | 13F | Wood Tarver Financial Group, LLC | 0 | -100,00 | 0 | |||||
| 2026-02-10 | 13F | Envestnet Asset Management Inc | 1.004.074 | -7,63 | 11.898 | -13,54 | ||||
| 2026-02-18 | 13F | Vident Advisory, LLC | 116.497 | -9,16 | 1.380 | -14,97 | ||||
| 2026-02-13 | 13F | Centiva Capital, LP | 0 | -100,00 | 0 | |||||
| 2026-02-10 | 13F | Bnp Paribas | 4.240 | 0,00 | 50 | -5,66 | ||||
| 2026-02-12 | 13F | DRW Securities, LLC | 203.796 | 207,50 | 2.415 | 188,41 | ||||
| 2025-11-14 | 13F | Wolverine Trading, Llc | Put | 396.600 | 366,59 | 5.096 | 384,41 | |||
| 2026-04-24 | 13F | Raiffeisen Bank International AG | 90.000 | 0,00 | 1.873 | 75,45 | ||||
| 2026-01-20 | 13F | SOA Wealth Advisors, LLC. | 600 | 0,00 | 7 | 0,00 | ||||
| 2026-02-12 | 13F | Brinker Capital Investments, LLC | 101.951 | 9,54 | 1.208 | 2,55 | ||||
| 2026-04-16 | 13F | Franchise GP Ltd | 852.338 | 17.686 | ||||||
| 2026-02-12 | 13F/A | Pinebridge Investments Llc | 161.949 | 1.919 | ||||||
| 2026-02-12 | 13F | Dimensional Fund Advisors Lp | 3.184.306 | 1,60 | 37.734 | -5,00 | ||||
| 2026-02-14 | 13F | Whipplewood Advisors, LLC | 177 | 2 | ||||||
| 2025-11-14 | 13F | Wolverine Trading, Llc | 106.785 | 53,29 | 1.372 | 59,16 | ||||
| 2026-02-09 | 13F | Hantz Financial Services, Inc. | 40.130 | -5,89 | 0 | |||||
| 2025-11-14 | 13F | Wolverine Trading, Llc | Call | 195.700 | -28,45 | 2.515 | -25,73 | |||
| 2026-02-03 | 13F | McIlrath & Eck, LLC | 11.287 | 134 | ||||||
| 2026-02-11 | 13F | First Command Advisory Services, Inc. | 134 | 2 | ||||||
| 2026-02-12 | 13F | Resurgent Financial Advisors LLC | 15.526 | -0,60 | 184 | -7,11 | ||||
| 2026-04-21 | 13F | Poehling Capital Management, LLC | 240.944 | 0,79 | 5.000 | 76,52 | ||||
| 2026-02-09 | 13F | Morningstar Investment Management LLC | 214.987 | -30,04 | 3 | -33,33 | ||||
| 2026-02-17 | 13F | Two Sigma Securities, Llc | 20.194 | -47,36 | 239 | -50,72 | ||||
| 2026-02-13 | 13F | National Bank Of Canada /fi/ | 546 | -68,29 | 6 | -71,43 | ||||
| 2025-11-12 | 13F | HAP Trading, LLC | Put | 18.300 | 5 | |||||
| 2026-02-17 | 13F | Mercer Global Advisors Inc /adv | 13.178 | -19,60 | 156 | -24,64 | ||||
| 2026-02-20 | 13F/A | Capital Markets Trading UK LLP | Put | 1.654.300 | 20,72 | 20 | 11,76 | |||
| 2026-02-20 | 13F/A | Capital Markets Trading UK LLP | Call | 1.600.000 | 61,23 | 19 | 58,33 | |||
| 2025-11-06 | 13F | Midwest Trust Co | 0 | -100,00 | 0 | |||||
| 2025-11-12 | 13F | HAP Trading, LLC | Call | 14.100 | 7 | |||||
| 2026-02-10 | 13F | Savant Capital, LLC | 15.699 | 4,49 | 186 | -2,11 | ||||
| 2026-04-15 | 13F | DAVENPORT & Co LLC | 33.822 | 702 | ||||||
| 2026-02-13 | 13F | Mariner, LLC | 81.131 | 110,24 | 961 | 96,93 | ||||
| 2026-01-28 | 13F | Eagle Global Advisors Llc | 0 | -100,00 | 0 | |||||
| 2026-02-17 | 13F | Raymond James Financial Inc | 503.374 | 11,84 | 5.965 | 4,69 | ||||
| 2026-02-13 | 13F | Schroder Investment Management Group | 23.380.819 | -17,03 | 277.063 | -22,34 | ||||
| 2026-02-12 | 13F | Qtron Investments LLC | 0 | -100,00 | 0 | |||||
| 2026-02-17 | 13F | Trexquant Investment LP | 656.749 | -34,65 | 7.782 | -38,84 | ||||
| 2025-11-14 | 13F | PineBridge Investments, L.P. | 202.110 | 0,00 | 2.559 | 1,19 | ||||
| 2026-02-12 | 13F | Brown Brothers Harriman & Co | 586 | 75,45 | 7 | 50,00 | ||||
| 2026-02-04 | 13F | LRI Investments, LLC | 1.000 | 0,00 | 12 | -8,33 | ||||
| 2025-10-27 | 13F | Kiker Wealth Management, LLC | 0 | -100,00 | 0 | -100,00 | ||||
| 2026-04-17 | 13F | HHM Wealth Advisors, LLC | 500 | 0,00 | 10 | 100,00 | ||||
| 2026-01-29 | 13F | Vanguard Group Inc | 1.221.885 | 5,68 | 14.479 | -1,08 | ||||
| 2025-11-13 | 13F | Diametric Capital, LP | 0 | -100,00 | 0 | |||||
| 2026-02-13 | 13F | Marshall Wace, Llp | 0 | -100,00 | 0 | |||||
| 2026-02-19 | 13F | CI Private Wealth, LLC | 48.623 | -17,10 | 563 | -24,26 | ||||
| 2026-04-22 | 13F | Stone House Investment Management, LLC | 4.500 | 93 | ||||||
| 2026-02-17 | 13F | Quantinno Capital Management LP | 138.736 | 64,04 | 1.644 | 53,64 | ||||
| 2026-01-27 | 13F | Krilogy Financial LLC | 0 | -100,00 | 0 | |||||
| 2026-02-11 | 13F | RWC Asset Management LLP | 494.705 | -46,48 | 5.862 | -49,90 | ||||
| 2026-02-12 | 13F | Bank Of Montreal /can/ | 49.454 | -30,65 | 586 | -35,03 | ||||
| 2026-04-22 | 13F | Advocate Investing Services LLC | 12.546 | 1,18 | 260 | 78,08 | ||||
| 2026-01-23 | 13F | Lester Murray Antman dba SimplyRich | 34.094 | 17,70 | 0 | |||||
| 2026-02-17 | 13F | LMR Partners LLP | 175.000 | 2.074 | ||||||
| 2026-04-08 | 13F | Wealth Enhancement Advisory Services, Llc | 40.649 | -49,07 | 836 | -9,53 | ||||
| 2026-04-14 | 13F | Opal Wealth Advisors, LLC | 4.167 | 86 | ||||||
| 2026-02-17 | 13F | LMR Partners LLP | Call | 40.700 | 482 | |||||
| 2026-02-17 | 13F | LMR Partners LLP | Put | 188.900 | 2.238 | |||||
| 2026-02-17 | 13F | Aspen Grove Capital, LLC | 0 | -100,00 | 0 | |||||
| 2026-04-22 | 13F | Samalin Investment Counsel, LLC | 0 | -100,00 | 0 | |||||
| 2026-02-06 | 13F | Cullen/frost Bankers, Inc. | 578 | 1,76 | 7 | -14,29 | ||||
| 2026-02-13 | 13F | SPX Equities Gestao de Recursos Ltda | 4.887.558 | -38,26 | 57.918 | -42,21 | ||||
| 2026-04-15 | 13F | Archford Capital Strategies, LLC | 10.679 | -87,99 | 222 | -79,01 | ||||
| 2026-02-12 | 13F | BRYN MAWR TRUST Co | 0 | -100,00 | 0 | -100,00 | ||||
| 2026-02-12 | 13F | Wealthspire Advisors, LLC | 0 | -100,00 | 0 | |||||
| 2026-01-28 | 13F | CAPROCK Group, Inc. | 104.497 | -5,18 | 1.272 | -10,55 | ||||
| 2025-11-14 | 13F | Cubist Systematic Strategies, LLC | Put | 118.300 | -50,56 | 1.498 | -49,98 | |||
| 2026-02-06 | 13F | Kingdom Financial Group LLC. | 0 | 0 | ||||||
| 2026-02-13 | 13F | Allie Family Office LLC | 13.860 | 0,00 | 164 | -6,82 | ||||
| 2026-02-17 | 13F | Guggenheim Capital Llc | 148.453 | 7,88 | 1.759 | 0,98 | ||||
| 2026-04-21 | 13F | Abbington Investment Group | 539.232 | 74,19 | 11.189 | 205,04 | ||||
| 2026-04-09 | 13F | Park Place Capital Corp | 884 | 0,00 | 18 | 80,00 | ||||
| 2026-02-17 | 13F | Opal Capital Llc | 291.680 | 3.456 | ||||||
| 2026-01-30 | 13F | Bogart Wealth, LLC | 350 | 0,00 | 4 | 0,00 | ||||
| 2026-02-11 | 13F | O'shaughnessy Asset Management, Llc | 936.025 | -6,75 | 11.092 | -12,72 | ||||
| 2026-02-13 | 13F | Edgestream Partners, L.P. | 18.791 | 223 | ||||||
| 2026-02-13 | 13F | Ubs Asset Management Americas Inc | 995 | 12 | ||||||
| 2026-02-17 | 13F | Ancora Advisors, LLC | 836 | 77,12 | 10 | 80,00 | ||||
| 2026-02-17 | 13F | Evergreen Quality Fund GP, Ltd. | 472.600 | 5.600 | ||||||
| 2026-01-14 | 13F | Net Worth Advisory Group | 13.942 | 4,49 | 165 | -1,79 | ||||
| 2026-02-11 | 13F | Jpmorgan Chase & Co | 12.624.850 | 41,02 | 149.604 | 32,00 | ||||
| 2026-02-11 | 13F | Jpmorgan Chase & Co | Call | 3.050.000 | 154,17 | 36.142 | 137,90 | |||
| 2026-04-20 | 13F | Ritholtz Wealth Management | 203.059 | 10,42 | 4.213 | 93,35 | ||||
| 2026-01-28 | 13F | Financial Perspectives, Inc | 1.764 | 0,00 | 21 | -9,09 | ||||
| 2026-02-09 | 13F | Arista Wealth Management, LLC | 0 | -100,00 | 0 | |||||
| 2026-02-11 | 13F | Jpmorgan Chase & Co | Put | 4.766.800 | 128,35 | 56.487 | 113,74 | |||
| 2026-01-29 | 13F | IMC-Chicago, LLC | 81.351 | -47,91 | 964 | -51,24 | ||||
| 2026-02-13 | 13F | Arkadios Wealth Advisors | 26.579 | 6,32 | 315 | -0,63 | ||||
| 2026-01-29 | 13F | IMC-Chicago, LLC | Put | 283.300 | -24,35 | 3.357 | -29,19 | |||
| 2026-01-29 | 13F | IMC-Chicago, LLC | Call | 253.700 | 508,39 | 3.006 | 470,40 | |||
| 2026-02-13 | 13F | Barclays Plc | 1.326.699 | 114,83 | 15.721 | 101,09 | ||||
| 2026-04-23 | 13F | MQS Management LLC | 24.304 | 44,92 | 504 | 154,55 | ||||
| 2026-02-04 | 13F | Colonial River Wealth Management, LLC | 18.055 | -2,75 | 214 | -9,36 | ||||
| 2026-02-17 | 13F | Amundi | 441.659 | 5.234 | ||||||
| 2026-04-21 | 13F | Aaron Wealth Advisors LLC | 18.292 | 380 | ||||||
| 2026-01-30 | 13F | Us Bancorp \de\ | 30.696 | -20,25 | 364 | -25,46 | ||||
| 2026-04-03 | 13F | Investors Research Corp | 1.034 | 0,00 | 21 | 75,00 | ||||
| 2026-01-26 | 13F | Cwm, Llc | 9.212 | -17,77 | 0 | |||||
| 2026-02-17 | 13F | Zacks Investment Management | 10.323 | 0,00 | 122 | -6,15 | ||||
| 2026-01-30 | 13F | Archer Investment Corp | 0 | -100,00 | 0 | |||||
| 2026-01-30 | 13F | Glenorchy Capital Ltd | 47.161 | 8,12 | 559 | 1,09 | ||||
| 2026-02-13 | 13F | State Street Corp | 5.485.921 | -2,73 | 66.958 | -6,76 | ||||
| 2026-02-02 | 13F | Robertson Stephens Wealth Management, LLC | 36.506 | 143,28 | 444 | 133,16 | ||||
| 2026-01-28 | 13F | N.E.W. Advisory Services LLC | 400 | 0,00 | 5 | -20,00 | ||||
| 2026-01-29 | 13F | Nbc Securities, Inc. | Call | 0 | -100,00 | 0 | ||||
| 2026-02-17 | 13F | MIRAE ASSET GLOBAL ETFS HOLDINGS Ltd. | 81.175 | 18,26 | 962 | 10,71 | ||||
| 2026-04-24 | 13F | Key FInancial Inc | 0 | -100,00 | 0 | |||||
| 2026-04-17 | 13F | Sovereign Financial Group, Inc. | 10.012 | -5,70 | 208 | 65,60 | ||||
| 2026-02-13 | 13F | Walleye Trading LLC | 0 | -100,00 | 0 | -100,00 | ||||
| 2026-02-17 | 13F | Fmr Llc | 4.173.476 | -86,29 | 49.456 | -87,17 | ||||
| 2026-04-15 | 13F | Activest Wealth Management | 14.464 | 16,65 | 300 | 105,48 | ||||
| 2026-02-17 | 13F | Aquatic Capital Management LLC | 0 | -100,00 | 0 | |||||
| 2026-02-12 | 13F | Insigneo Advisory Services, Llc | 157.519 | -25,34 | 1.867 | -30,11 |