Grundlæggende statistik
| Institutionelle aktier (lange) | 123.093.521 - 104,84% (ex 13D/G) - change of -18,55MM shares -13,10% MRQ |
| Institutionel værdi (lang) | $ 16.287.383 USD ($1000) |
Institutionelt ejerskab og aktionærer
XPO, Inc. (US:XPO) har 628 institutionelle ejere og aktionærer, der har indsendt 13D/G- eller 13F-formularer til Securities Exchange Commission (SEC). Disse institutioner har i alt 123,093,521 aktier. Største aktionærer omfatter BlackRock, Inc., MFN Partners Management, LP, Capital Research Global Investors, Vanguard Group Inc, Capital World Investors, Invesco Ltd., Durable Capital Partners LP, Orbis Allan Gray Ltd, State Street Corp, and Clearbridge Investments, LLC .
XPO, Inc. (NYSE:XPO) institutionel ejerskabsstruktur viser aktuelle positioner i virksomheden efter institutioner og fonde, samt seneste ændringer i positionsstørrelse. Større aktionærer kan omfatte individuelle investorer, investeringsforeninger, hedgefonde eller institutioner. Skema 13D angiver, at investoren besidder (eller besidder) mere end 5 % af virksomheden og har til hensigt (eller har til hensigt at) aktivt at forfølge en ændring i forretningsstrategi. Skema 13G indikerer en passiv investering på over 5%.
The share price as of May 1, 2026 is 215,28 / share. Previously, on May 5, 2025, the share price was 109,29 / share. This represents an increase of 96,98% over that period.

Fondens stemningsscore
Fund Sentiment Score (fka Ownership Accumulation Score) finder de aktier, der bliver mest købt af fonde. Det er resultatet af en sofistikeret, multi-faktor kvantitativ model, der identificerer virksomheder med de højeste niveauer af institutionel akkumulering. Scoringsmodellen bruger en kombination af den samlede stigning i oplyste ejere, ændringerne i porteføljeallokeringer i disse ejere og andre målinger. Tallet går fra 0 til 100, hvor højere tal indikerer et højere niveau af akkumulering for sine jævnaldrende, og 50 er gennemsnittet.
Opdateringsfrekvens: Dagligt
Se Ownership Explorer, som giver en liste over højest rangerende virksomheder.
AI+ Ask Fintel’s AI assistant about XPO, Inc..
Select a question to share a public post with an AI-crafted answer.
Thinking of good questions…
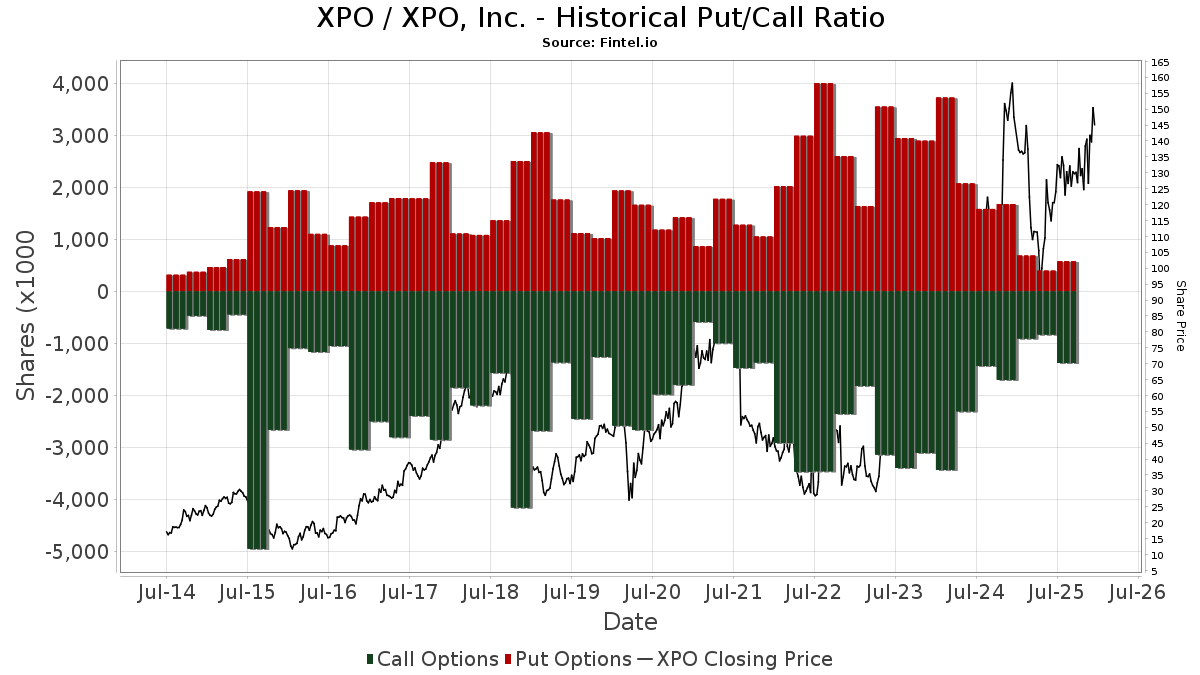
Institutionel Put/Call-forhold
Ud over at indberette standardaktie- og gældsudstedelser skal institutter med mere end 100 mill. aktiver under forvaltning også oplyse deres put- og call-optionsbeholdninger. Da salgsoptioner generelt indikerer negativ stemning, og købsoptioner indikerer positiv stemning, kan vi få en fornemmelse af den overordnede institutionelle stemning ved at plotte forholdet mellem put og kald. Diagrammet til højre viser det historiske put/call-forhold for dette instrument.
Brug af Put/Call Ratio som en indikator for investorernes stemning overvinder en af de vigtigste mangler ved at bruge totalt institutionelt ejerskab, som er, at en betydelig mængde af aktiver under forvaltning investeres passivt for at spore indekser. Passivt forvaltede fonde køber typisk ikke optioner, så indikatoren for put/call-forholdet følger mere nøje følelsen af aktivt forvaltede fonde.
13D/G-arkivering
Vi præsenterer 13D/G ansøgninger separat fra 13F ansøgninger på grund af den forskellige behandling af SEC. 13D/G-ansøgninger kan indgives af grupper af investorer (med én ledende), hvorimod 13F-ansøgninger ikke kan. Dette resulterer i situationer, hvor en investor kan indsende en 13D/G, der rapporterer én værdi for de samlede aktier (der repræsenterer alle de aktier, der ejes af investorgruppen), men derefter indsender en 13F, der rapporterer en anden værdi for de samlede aktier (der udelukkende repræsenterer deres egne) ejendomsret). Det betyder, at aktieejerskab af 13D/G-arkiver og 13F-arkiveringer ofte ikke er direkte sammenlignelige, så vi præsenterer dem separat.
Bemærk: Fra den 16. maj 2021 viser vi ikke længere ejere, der ikke har indsendt en 13D/G inden for det seneste år. Tidligere viste vi den fulde historie af 13D/G-arkiver. Generelt skal enheder, der er forpligtet til at indgive 13D/G-ansøgninger, indgive mindst årligt, før de indsender en afsluttende ansøgning. Dog forlader fonde nogle gange positioner uden at indsende en afsluttende ansøgning (dvs. de afvikler), så visning af den fulde historie resulterede nogle gange i forvirring om det nuværende ejerskab. For at undgå forvirring viser vi nu kun 'aktuelle' ejere - det vil sige - ejere, der har anmeldt inden for det seneste år.
Upgrade to unlock premium data.
| Fil dato | Form | Investor | Forrige Aktier |
Seneste Aktier |
Δ Aktier (Procent) |
Ejendomsret (Procent) |
Δ Ejerskab (Procent) |
|
|---|---|---|---|---|---|---|---|---|
| 2026-04-30 | VANGUARD CAPITAL MANAGEMENT LLC | 5,952,283 | 5.08 | |||||
| 2026-03-27 | VANGUARD GROUP INC | 10,923,106 | 0 | -100.00 | 0.00 | -100.00 | ||
| 2026-02-12 | Capital Research Global Investors | 13,810,938 | 11,157,329 | -19.21 | 9.50 | -20.17 | ||
| 2025-11-13 | Capital World Investors | 9,757,662 | 10,985,317 | 12.58 | 9.30 | 12.05 | ||
| 2025-11-06 | Invesco Ltd. | 6,267,881 | 5.30 | |||||
| 2025-07-17 | BlackRock, Inc. | 11,812,633 | 10,418,923 | -11.80 | 8.80 | -12.87 |
13F og NPORT arkivering
Detaljer om 13F-arkivering er gratis. Detaljer om NP-ansøgninger kræver et premium-medlemskab. Grønne rækker angiver nye positioner. Røde rækker angiver lukkede positioner. Klik på linket ikon for at se den fulde transaktionshistorik.
Opgrader
for at låse premium-data op og eksportere til Excel ![]() .
.
| Fil dato | Kilde | Investor | Type | Gennemsnitlig pris (Øst) |
Aktier | Δ Aktier (%) |
Rapporteret Værdi ($1000) |
Δ Værdi (%) |
Port Alloc (%) |
|
|---|---|---|---|---|---|---|---|---|---|---|
| 2026-02-06 | 13F | Covestor Ltd | 104 | 0,97 | 0 | |||||
| 2026-02-12 | 13F | Ensign Peak Advisors, Inc | 6.391 | -69,77 | 869 | -68,23 | ||||
| 2026-02-13 | 13F | Great West Life Assurance Co /can/ | 67.901 | -19,95 | 9 | -10,00 | ||||
| 2026-02-17 | 13F | Raymond James Financial Inc | 836.866 | -3,60 | 114.684 | 2,20 | ||||
| 2026-02-02 | 13F | Danske Bank A/s | 900 | 0,00 | 122 | 5,17 | ||||
| 2026-04-24 | 13F | Yousif Capital Management, Llc | 34.980 | -4,96 | 6.805 | 26,75 | ||||
| 2026-02-09 | 13F | Arnhold LLC | 131.100 | 0,00 | 17.818 | 5,13 | ||||
| 2026-02-09 | 13F | Cooke & Bieler Lp | 933.703 | -0,00 | 126.900 | 5,13 | ||||
| 2026-02-17 | 13F | Dv Equities, Llc | 500 | 68 | ||||||
| 2026-04-21 | 13F | Tenon Financial LLC | 5.844 | 0,00 | 1.137 | 43,07 | ||||
| 2026-02-14 | 13F | Rockefeller Capital Management L.P. | 2.507 | 9,67 | 341 | 15,25 | ||||
| 2026-02-17 | 13F | Two Sigma Advisers, Lp | 15.900 | -79,11 | 2.161 | -78,04 | ||||
| 2026-04-08 | 13F | Gilman Hill Asset Management, LLC | 33.784 | -26,58 | 6.573 | 5,10 | ||||
| 2026-02-06 | 13F | Pnc Financial Services Group, Inc. | 10.814 | -2,40 | 1.470 | 2,58 | ||||
| 2026-04-23 | 13F | Farmers & Merchants Investments Inc | 341 | 0,00 | 66 | 43,48 | ||||
| 2026-02-17 | 13F | Kemnay Advisory Services Inc. | 844 | 115 | ||||||
| 2026-04-17 | 13F | Anchyra Partners Llc | 5.573 | 0,09 | 1.084 | 43,39 | ||||
| 2026-04-07 | 13F | Retirement Wealth Solutions LLC | 43 | 0,00 | 8 | 60,00 | ||||
| 2026-02-13 | 13F | Sargent Investment Group, LLC | 17.460 | -11,06 | 2.373 | -6,50 | ||||
| 2026-04-02 | 13F | Aspect Partners, LLC | 14 | 0,00 | 3 | 100,00 | ||||
| 2026-01-12 | 13F | Traynor Capital Management, Inc. | 37.984 | -0,11 | 5.162 | 5,03 | ||||
| 2025-11-14 | 13F | South Street Advisors LLC | 0 | -100,00 | 0 | -100,00 | ||||
| 2026-01-29 | 13F | Vanguard Group Inc | 10.525.258 | -1,52 | 1.430.488 | 3,53 | ||||
| 2026-04-08 | 13F | DiNuzzo Private Wealth, Inc. | 20 | 0,00 | 4 | 50,00 | ||||
| 2026-02-13 | 13F | Cornerstone Financial Management LLC | 6 | 1 | ||||||
| 2026-02-13 | 13F | Walleye Capital LLC | 0 | -100,00 | 0 | -100,00 | ||||
| 2025-11-14 | 13F | Interval Partners, LP | 0 | -100,00 | 0 | -100,00 | ||||
| 2026-02-13 | 13F | Bridgewater Associates, LP | 33.209 | 4.513 | ||||||
| 2026-04-08 | 13F | NorthCrest Asset Manangement, LLC | 2.769 | -34,52 | 555 | -9,46 | ||||
| 2026-02-09 | 13F | Wellington Shields Capital Management, LLC | 700 | 95 | ||||||
| 2026-04-21 | 13F | OneAscent Family Office, LLC | 1.662 | 0,00 | 323 | 43,56 | ||||
| 2026-02-17 | 13F | Perennial Investment Advisors, LLC | 2.688 | 1,51 | 365 | 6,73 | ||||
| 2026-04-22 | 13F | Spire Wealth Management | 27.321 | 13.560,50 | 5.315 | 19.585,19 | ||||
| 2026-04-29 | 13F | Sigma Investment Counselors Inc | 6.259 | 0,00 | 1.218 | 43,18 | ||||
| 2026-04-20 | 13F | Jfs Wealth Advisors, Llc | 268 | 1,90 | 52 | 48,57 | ||||
| 2026-04-30 | 13F | Cromwell Holdings LLC | 21 | 40,00 | 4 | 100,00 | ||||
| 2026-02-12 | 13F | Castleark Management Llc | 54.269 | 155,76 | 7.376 | 168,96 | ||||
| 2026-02-12 | 13F | State Board Of Administration Of Florida Retirement System | 96.138 | -3,25 | 13.066 | 1,72 | ||||
| 2026-04-17 | 13F | Vermillion Wealth Management, Inc. | 8 | 2 | ||||||
| 2026-05-01 | 13F | Securian Asset Management, Inc | 8.655 | 1,17 | 1.684 | 44,84 | ||||
| 2026-04-09 | 13F | Secure Asset Management, LLC | 1.328 | -10,75 | 258 | 27,72 | ||||
| 2026-02-13 | 13F | Alamea Verwaltungs GmbH | 2.617 | 388 | ||||||
| 2025-11-05 | 13F | Optimize Financial Inc | 0 | -100,00 | 0 | |||||
| 2026-02-12 | 13F | MFN Partners Management, LP | 11.425.369 | 0,00 | 1.552.822 | 5,14 | ||||
| 2026-02-13 | 13F | Truvestments Capital Llc | 43 | 0,00 | 6 | 0,00 | ||||
| 2026-02-12 | 13F | Hrt Financial Lp | 3.967 | 1 | ||||||
| 2026-02-17 | 13F | Silvercrest Asset Management Group Llc | 2.934 | 1,91 | 399 | 6,99 | ||||
| 2026-02-10 | 13F | Anchor Capital Advisors Llc | 2.920 | 0,00 | 397 | 5,04 | ||||
| 2026-02-13 | 13F | Pinnacle Wealth Planning Services, Inc. | 54 | 7 | ||||||
| 2026-04-29 | 13F | Envestnet Portfolio Solutions, Inc. | 12.671 | 3,40 | 2.465 | 48,05 | ||||
| 2026-02-18 | 13F | State of Tennessee, Treasury Department | 45.659 | -4,11 | 6.763 | 9,86 | ||||
| 2026-02-19 | 13F | Invesco Ltd. | 6.237.886 | -0,48 | 847.791 | 4,63 | ||||
| 2026-02-17 | 13F | Polar Capital Holdings Plc | 61.700 | 8.386 | ||||||
| 2026-02-17 | 13F | Point72 Asset Management, L.P. | Put | 6.700 | 911 | |||||
| 2026-02-10 | 13F | Bruce G. Allen Investments, LLC | 16 | 0,00 | 2 | 0,00 | ||||
| 2026-02-17 | 13F | Point72 Asset Management, L.P. | Call | 7.500 | 1.019 | |||||
| 2026-04-24 | 13F | Profund Advisors Llc | 2.930 | 11,83 | 570 | 60,11 | ||||
| 2026-01-21 | 13F | Future Financial Wealth Managment LLC | 0 | -100,00 | 0 | |||||
| 2026-04-28 | 13F | Quent Capital, LLC | 706 | 0,00 | 137 | 44,21 | ||||
| 2026-02-17 | 13F | Orbis Allan Gray Ltd | 3.652.589 | 15,83 | 496.423 | 21,78 | ||||
| 2026-01-27 | 13F | TD Waterhouse Canada Inc. | 110 | -18,52 | 15 | -17,65 | ||||
| 2026-04-07 | 13F | Park Avenue Securities Llc | 1.878 | 0 | ||||||
| 2026-02-02 | 13F | Wolverine Asset Management Llc | Put | 11.500 | 0,00 | 1.563 | 5,11 | |||
| 2026-04-30 | 13F | Core Alternative Capital | 505 | 0,00 | 98 | 44,12 | ||||
| 2026-02-10 | 13F | Norges Bank | 1.503.231 | 204.304 | ||||||
| 2026-02-13 | 13F | Pathstone Holdings, LLC | 21.178 | -2,53 | 2.878 | 2,49 | ||||
| 2026-04-08 | 13F | Arlington Trust Co LLC | 51 | 10 | ||||||
| 2026-04-20 | 13F | Ritholtz Wealth Management | 1.358 | 264 | ||||||
| 2026-02-11 | 13F | Syon Capital Llc | 1.960 | 266 | ||||||
| 2025-11-05 | 13F | Anderson Financial Strategies, LLC | 0 | -100,00 | 0 | |||||
| 2026-02-13 | 13F | Charles Schwab Investment Management Inc | 881.961 | 0,98 | 119.867 | 6,17 | ||||
| 2026-04-20 | 13F | Kestra Private Wealth Services, Llc | 1.522 | 296 | ||||||
| 2026-02-11 | 13F | Vestcor Inc | 10.700 | 0,00 | 1 | 0,00 | ||||
| 2026-04-15 | 13F | Douglas Lane & Associates, LLC | 244.499 | -4,82 | 47.567 | 36,25 | ||||
| 2026-04-22 | 13F | Ariston Services Group | 0 | -100,00 | 428 | 43,29 | ||||
| 2026-02-12 | 13F | New York State Common Retirement Fund | 60.254 | 0,00 | 8.189 | 5,14 | ||||
| 2026-01-30 | 13F/A | M&t Bank Corp | 5.246 | 43,84 | 713 | 51,38 | ||||
| 2026-02-11 | 13F | Zions Bancorporation, National Association /ut/ | 113 | 15 | ||||||
| 2026-04-17 | 13F | Webster Bank, N. A. | 5.155 | 0,00 | 1.003 | 43,14 | ||||
| 2026-02-17 | 13F | Advisor Group Holdings, Inc. | 10.902 | -5,15 | 1.482 | 0,14 | ||||
| 2026-02-09 | 13F | Atlantic Trust, LLC | 23 | 0,00 | 3 | 50,00 | ||||
| 2026-02-17 | 13F | Qube Research & Technologies Ltd | Call | 6.000 | -66,29 | 815 | -64,58 | |||
| 2026-02-17 | 13F | Qube Research & Technologies Ltd | 53.673 | 7.295 | ||||||
| 2026-02-18 | 13F | Greenstone Partners & Co., LLC | 193.703 | 0,48 | 26.326 | 8,13 | ||||
| 2025-11-12 | 13F | Transce3nd, LLC | 0 | -100,00 | 0 | |||||
| 2026-03-03 | 13F/A | Caitong International Asset Management Co., Ltd | 802 | 80.100,00 | 109 | |||||
| 2026-02-17 | 13F | Optiver Holding B.V. | 0 | -100,00 | 0 | |||||
| 2026-04-28 | 13F | K.J. Harrison & Partners Inc | 28.000 | 0,00 | 5.447 | 43,15 | ||||
| 2026-04-30 | 13F | Nisa Investment Advisors, Llc | 6.691 | 120,39 | 1.302 | 215,78 | ||||
| 2026-02-17 | 13F | Qube Research & Technologies Ltd | Put | 6.300 | -33,68 | 856 | -30,29 | |||
| 2026-02-13 | 13F | Schroder Investment Management Group | 33.000 | -24,15 | 4.544 | -18,00 | ||||
| 2026-02-17 | 13F/A | RBF Capital, LLC | 29.000 | 0,00 | 3.941 | 5,15 | ||||
| 2026-03-02 | 13F | Reflection Asset Management | 109 | 15 | ||||||
| 2026-02-17 | 13F | Polymer Capital Management (US) LLC | 0 | -100,00 | 0 | |||||
| 2026-02-17 | 13F | Durable Capital Partners LP | 3.949.100 | -8,82 | 536.722 | -4,14 | ||||
| 2026-04-08 | 13F | Olistico Wealth, LLC | 30 | 0,00 | 6 | 25,00 | ||||
| 2026-02-10 | 13F | Envestnet Asset Management Inc | 109.517 | 12,17 | 14.873 | 17,85 | ||||
| 2026-04-17 | 13F | Murphy & Mullick Capital Management Corp | 636 | 0,00 | 124 | 43,02 | ||||
| 2026-02-12 | 13F | Federated Hermes, Inc. | 275.168 | -0,45 | 37.398 | 4,67 | ||||
| 2026-02-17 | 13F | State Of Wisconsin Investment Board | 100.102 | 10,77 | 13.605 | 16,45 | ||||
| 2026-04-13 | 13F | Loring Wolcott & Coolidge Fiduciary Advisors Llp/ma | 4.320 | 0,00 | 919 | 43,37 | ||||
| 2026-02-17 | 13F | Blair William & Co/il | 4.927 | 1,44 | 670 | 6,70 | ||||
| 2026-02-13 | 13F | Glen Eagle Advisors, LLC | 35 | 0,00 | 5 | 0,00 | ||||
| 2026-01-27 | 13F | Zurcher Kantonalbank (Zurich Cantonalbank) | 36.298 | 12,11 | 4.933 | 17,87 | ||||
| 2026-02-05 | 13F | Elyxium Wealth, LLC | 205 | 28 | ||||||
| 2026-02-17 | 13F | Russell Investments Group, Ltd. | 73.049 | 4,39 | 9.928 | 9,76 | ||||
| 2026-04-14 | 13F | Bay Harbor Wealth Management, LLC | 16 | 45,45 | 3 | 200,00 | ||||
| 2026-04-22 | 13F | Quintet Private Bank (Europe) S.A. | 4.700 | 0,00 | 914 | 43,26 | ||||
| 2026-04-28 | 13F | Golden State Equity Partners | 689 | 134 | ||||||
| 2026-02-02 | 13F | Horizon Investments, LLC | 568 | 88,08 | 77 | 97,44 | ||||
| 2025-11-13 | 13F | Kennedy Capital Management, Inc. | 0 | -100,00 | 0 | |||||
| 2026-02-10 | 13F | State of Wyoming | 1.501 | 55,22 | 204 | 63,20 | ||||
| 2026-02-13 | 13F | Edgestream Partners, L.P. | 2.085 | 283 | ||||||
| 2026-02-13 | 13F | Stifel Financial Corp | 41.252 | 16,35 | 5.607 | 22,32 | ||||
| 2026-04-24 | 13F | Retirement Systems of Alabama | 216.377 | 1,28 | 42.096 | 44,98 | ||||
| 2026-02-12 | 13F | Steward Partners Investment Advisory, Llc | 1.451 | 28,29 | 197 | 34,93 | ||||
| 2026-01-16 | 13F | FNY Investment Advisers, LLC | 0 | -100,00 | 0 | |||||
| 2026-04-24 | 13F | Root Financial Partners, LLC | 362 | 21,07 | 70 | 75,00 | ||||
| 2026-02-17 | 13F | Wiley Bros.-aintree Capital, Llc | 4.946 | 91,63 | 672 | 101,80 | ||||
| 2026-04-23 | 13F | Moss Adams Wealth Advisors LLC | 1.253 | 244 | ||||||
| 2026-04-21 | 13F | Paradigm Financial Partners, Llc | 1.534 | -35,76 | 298 | -8,02 | ||||
| 2026-02-10 | 13F | New Mexico Educational Retirement Board | 23.500 | 0,00 | 3 | 0,00 | ||||
| 2026-02-17 | 13F | Sherbrooke Park Advisers Llc | 1.527 | -67,40 | 208 | -65,79 | ||||
| 2026-04-21 | 13F | Pallas Capital Advisors LLC | 2.077 | -1,05 | 404 | 41,75 | ||||
| 2026-02-06 | 13F | EverSource Wealth Advisors, LLC | 363 | -15,38 | 49 | -10,91 | ||||
| 2026-04-06 | 13F | Versant Capital Management, Inc | 220 | 10,55 | 43 | 55,56 | ||||
| 2026-02-12 | 13F | Ci Investments Inc. | 28.500 | 14.666,84 | 3.874 | |||||
| 2026-02-17 | 13F | Susquehanna International Group, Llp | Put | 205.300 | 55,77 | 27.902 | 63,77 | |||
| 2026-04-13 | 13F | Massmutual Trust Co Fsb/adv | 372 | 2,48 | 72 | 46,94 | ||||
| 2026-02-17 | 13F | Susquehanna International Group, Llp | Call | 328.700 | 503,12 | 44.674 | 534,11 | |||
| 2026-02-17 | 13F | Snowden Capital Advisors LLC | 1.892 | -9,47 | 257 | -4,81 | ||||
| 2026-04-22 | 13F | Tred Avon Family Wealth, Llc | 3.135 | -19,51 | 610 | 15,12 | ||||
| 2026-02-17 | 13F | Susquehanna International Group, Llp | 90.025 | -55,14 | 12.235 | -52,84 | ||||
| 2026-01-26 | 13F | Cwm, Llc | 1.447 | 7,34 | 0 | |||||
| 2026-02-11 | 13F | Ameritas Investment Partners, Inc. | 21.513 | 2.924 | ||||||
| 2026-02-12 | 13F | JBF Capital, Inc. | 6.000 | 0,00 | 815 | 5,16 | ||||
| 2026-02-17 | 13F | Woodline Partners LP | 0 | -100,00 | 0 | |||||
| 2025-11-13 | 13F | Bank Of Montreal /can/ | Call | 0 | -100,00 | 0 | -100,00 | |||
| 2026-02-12 | 13F | Swiss National Bank | 232.200 | 1,66 | 31.558 | 6,89 | ||||
| 2026-02-17 | 13F | Maryland State Retirement & Pension System | 5.821 | 0,00 | 791 | 5,19 | ||||
| 2026-02-13 | 13F | Seneschal Advisors, LLC | 2 | 0,00 | 0 | |||||
| 2026-04-23 | 13F | Forum Financial Management, LP | 0 | -100,00 | 0 | |||||
| 2025-11-12 | 13F | Neo Ivy Capital Management | 0 | -100,00 | 0 | |||||
| 2026-02-11 | 13F | Rise Advisors, LLC | 0 | -100,00 | 0 | |||||
| 2026-02-17 | 13F | First Manhattan Co | 2.028 | 0,00 | 276 | 4,96 | ||||
| 2026-02-06 | 13F | HighTower Advisors, LLC | 10.408 | 1,17 | 1.415 | 6,40 | ||||
| 2026-02-10 | 13F | CIBC World Markets Inc. | 1.744 | 237 | ||||||
| 2025-11-06 | 13F | Bryce Point Capital, LLC | 0 | -100,00 | 0 | |||||
| 2026-04-29 | 13F | Oregon Public Employees Retirement Fund | 24.061 | 2,44 | 4.681 | 46,65 | ||||
| 2026-02-17 | 13F | Two Sigma Investments, Lp | 195.709 | -19,34 | 26.599 | -15,20 | ||||
| 2026-02-17 | 13F | Royal Bank Of Canada | 226.891 | -28,57 | 30.837 | -24,91 | ||||
| 2026-04-24 | 13F | Private Advisor Group, LLC | 2.498 | 6,52 | 486 | 52,52 | ||||
| 2026-01-29 | 13F | IMC-Chicago, LLC | 0 | -100,00 | 0 | -100,00 | ||||
| 2026-02-11 | 13F | Deutsche Bank Ag\ | 12.469 | -1,03 | 1.695 | 4,05 | ||||
| 2026-04-28 | 13F | Whittier Trust Co Of Nevada Inc | 837 | 1,58 | 172 | 37,90 | ||||
| 2026-04-23 | 13F | Private Wealth Management Group, LLC | 56 | 0,00 | 11 | 42,86 | ||||
| 2026-04-30 | 13F | BRYN MAWR TRUST Co | 1.000 | -68,25 | 195 | -54,67 | ||||
| 2026-02-11 | 13F | Capital Group Investment Management Pte. Ltd. | 5.778 | -25,82 | 785 | -21,97 | ||||
| 2026-02-03 | 13F | Cassaday & Co Wealth Management LLC | 2.002 | 0,00 | 272 | 5,43 | ||||
| 2026-02-13 | 13F | State Street Corp | 3.510.137 | -0,49 | 477.063 | 4,63 | ||||
| 2026-04-24 | 13F | ProShare Advisors LLC | 4.942 | -0,14 | 961 | 43,01 | ||||
| 2026-02-17 | 13F | Brevan Howard Capital Management LP | 0 | -100,00 | 0 | |||||
| 2026-02-20 | 13F | Dorsey Wright & Associates | 0 | -100,00 | 220 | 4,76 | ||||
| 2026-02-17 | 13F | Advisory Services Network, LLC | 0 | -100,00 | 0 | |||||
| 2026-02-04 | 13F | Advisor OS, LLC | 3.125 | 0,19 | 425 | 5,21 | ||||
| 2026-02-13 | 13F | Rice Hall James & Associates, Llc | 219.176 | -1,98 | 29.788 | 3,06 | ||||
| 2026-02-11 | 13F | Tiaa Trust, National Association | 6.253 | 5,66 | 850 | 10,98 | ||||
| 2025-11-14 | 13F | Wolverine Trading, Llc | Put | 13.900 | -29,80 | 1.770 | -29,87 | |||
| 2026-04-22 | 13F | BWM Planning, LLC | 1.105 | 215 | ||||||
| 2026-02-17 | 13F | Caisse De Depot Et Placement Du Quebec | 165.895 | 183,81 | 22.547 | 198,39 | ||||
| 2026-02-11 | 13F | Simplex Trading, Llc | Put | 10.000 | -41,86 | 1.359 | 67.850,00 | |||
| 2026-04-15 | 13F | Fortitude Family Office, LLC | 91 | 160,00 | 18 | 325,00 | ||||
| 2026-04-30 | 13F | Sequoia Financial Advisors, LLC | 3.427 | -4,59 | 667 | 36,48 | ||||
| 2026-01-28 | 13F | Diversified Enterprises, LLC | 1.521 | 207 | ||||||
| 2026-02-23 | 13F | Virtu Financial LLC | 16.298 | 2 | ||||||
| 2026-02-11 | 13F | Simplex Trading, Llc | Call | 11.800 | -35,16 | 1.604 | 80.050,00 | |||
| 2025-11-14 | 13F | Wolverine Trading, Llc | 3.070 | -14,27 | 391 | -14,47 | ||||
| 2026-05-01 | 13F/A | Lodestone Wealth Management LLC | 0 | -100,00 | 0 | |||||
| 2025-11-14 | 13F | Wolverine Trading, Llc | Call | 17.600 | -20,72 | 2.241 | -20,81 | |||
| 2026-02-04 | 13F | Atlantic Union Bankshares Corp | 192 | 0,00 | 26 | 8,33 | ||||
| 2026-02-13 | 13F | Walleye Trading LLC | Put | 23.000 | 76,92 | 3.126 | 86,01 | |||
| 2026-02-11 | 13F | Capital Research Global Investors | 11.157.329 | -20,40 | 1.516.434 | -16,30 | ||||
| 2026-02-13 | 13F | Walleye Trading LLC | Call | 39.100 | 637,74 | 5.314 | 675,77 | |||
| 2026-02-17 | 13F | Tudor Investment Corp Et Al | Call | 6.100 | 829 | |||||
| 2026-02-17 | 13F | Tudor Investment Corp Et Al | Put | 2.800 | 381 | |||||
| 2026-02-18 | 13F | First Citizens Bank & Trust Co | 11.378 | 2,05 | 1.546 | 7,29 | ||||
| 2026-04-10 | 13F | Quaker Wealth Management, LLC | 2 | 0,00 | 0 | |||||
| 2026-02-17 | 13F | Tudor Investment Corp Et Al | 115.784 | 275,58 | 15.736 | 294,88 | ||||
| 2026-02-17 | 13F | Lombard Odier Asset Management (USA) Corp | 18.559 | 8,32 | 2.522 | 13,91 | ||||
| 2026-02-13 | 13F | Walleye Trading LLC | 7.813 | -63,87 | 1.062 | -62,04 | ||||
| 2026-01-29 | 13F | Sanctuary Advisors, LLC | 2.050 | 19,39 | 279 | 25,79 | ||||
| 2026-02-03 | 13F | Maxi Investments CY Ltd | 8.525 | -59,21 | 1 | -50,00 | ||||
| 2026-02-27 | 13F | Groupama Asset Managment | 648.476 | -1,12 | 88.134 | 3,96 | ||||
| 2026-01-27 | 13F | Brighton Jones Llc | 0 | -100,00 | 0 | |||||
| 2026-04-13 | 13F | CGC Financial Services, LLC | 25 | 0,00 | 5 | 33,33 | ||||
| 2026-04-28 | 13F | Abel Hall, LLC | 1.126 | 219 | ||||||
| 2026-02-13 | 13F | Quarry LP | 0 | -100,00 | 0 | |||||
| 2026-02-17 | 13F | Creative Planning | 11.864 | 7,55 | 1.612 | 13,12 | ||||
| 2025-11-14 | 13F | Duquesne Family Office LLC | 0 | -100,00 | 0 | |||||
| 2026-02-04 | 13F | First Eagle Investment Management, LLC | 3.711 | -4,48 | 504 | 0,40 | ||||
| 2026-04-14 | 13F | RD Lewis Holdings, Inc. | 2.074 | 2,47 | 439 | 27,99 | ||||
| 2026-02-13 | 13F | Mariner, LLC | 2.628 | 40,69 | 357 | 48,13 | ||||
| 2025-11-14 | 13F | SummitTX Capital, L.P. | 0 | -100,00 | 0 | |||||
| 2026-04-20 | 13F | Ronald Blue Trust, Inc. | 342 | -25,16 | 67 | 6,45 | ||||
| 2026-02-11 | 13F | Capital World Investors | 10.473.404 | -3,57 | 1.423.443 | 1,39 | ||||
| 2026-02-13 | 13F | Visionary Wealth Advisors | 2.777 | 377 | ||||||
| 2025-12-16 | 13F | Garde Capital, Inc. | 0 | -100,00 | 0 | |||||
| 2026-02-13 | 13F | MAI Capital Management | 416 | -21,36 | 57 | -17,65 | ||||
| 2026-02-13 | 13F | First Trust Advisors Lp | 48.459 | -32,77 | 6.586 | -29,31 | ||||
| 2026-05-01 | 13F | International Assets Investment Management, Llc | 295 | -1,67 | 59 | 45,00 | ||||
| 2026-04-14 | 13F | Thurston, Springer, Miller, Herd & Titak, Inc. | 67 | 0,00 | 13 | 44,44 | ||||
| 2026-04-20 | 13F | State of Alaska, Department of Revenue | 11.702 | 1,65 | 2 | 100,00 | ||||
| 2026-05-01 | 13F | American Trust | 3.173 | -7,03 | 617 | 33,26 | ||||
| 2026-02-11 | 13F | Motley Fool Asset Management LLC | 1.860 | -2,97 | 253 | 2,02 | ||||
| 2026-02-17 | 13F | Alphadyne Asset Management, LLC | Call | 2.900 | 394 | |||||
| 2026-02-17 | 13F | Alphadyne Asset Management, LLC | Put | 900 | 122 | |||||
| 2025-11-14 | 13F | Greenstone Partners, L.P. | 190.422 | 24.616 | ||||||
| 2026-04-29 | 13F | American Capital Advisory, LLC | 2 | 0,00 | 0 | |||||
| 2026-02-03 | 13F | Patten & Patten Inc/tn | 0 | -100,00 | 0 | |||||
| 2026-04-22 | 13F | Sterling Capital Management LLC | 3.239 | -41,81 | 630 | -16,67 | ||||
| 2026-04-29 | 13F/A | Salem Investment Counselors Inc | 1.077 | 210 | ||||||
| 2025-11-14 | 13F | WealthTrak Capital Management LLC | 0 | -100,00 | 0 | |||||
| 2025-11-04 | 13F | Pineridge Advisors LLC | 0 | -100,00 | 0 | |||||
| 2026-02-12 | 13F | Brown Brothers Harriman & Co | 315 | 43 | ||||||
| 2026-02-17 | 13F | Frontier Capital Management Co Llc | 720.353 | -35,20 | 97.903 | -31,87 | ||||
| 2026-04-15 | 13F | Merit Financial Group, LLC | 2.023 | -36,96 | 394 | -9,86 | ||||
| 2026-04-29 | 13F | Police & Firemen's Retirement System of New Jersey | 48.887 | 0,71 | 9.511 | 44,16 | ||||
| 2026-01-14 | 13F | ORG Partners LLC | 117 | 134,00 | 16 | 150,00 | ||||
| 2026-02-10 | 13F | Baker Avenue Asset Management, LP | 16.999 | 0,73 | 2.310 | 5,91 | ||||
| 2026-02-17 | 13F | Engineers Gate Manager LP | 0 | -100,00 | 0 | |||||
| 2026-04-27 | 13F | Ethic Inc. | 3.138 | -53,98 | 610 | -34,13 | ||||
| 2026-02-12 | 13F | Wealthspire Advisors, LLC | 0 | -100,00 | 0 | |||||
| 2026-02-13 | 13F | Rafferty Asset Management, LLC | 4.019 | 1,18 | 546 | 6,43 | ||||
| 2026-01-28 | 13F | Universal- Beteiligungs- und Servicegesellschaft mbH | 24.871 | 8,11 | 3.380 | 13,69 | ||||
| 2025-11-14 | 13F | Boothbay Fund Management, Llc | 0 | -100,00 | 0 | -100,00 | ||||
| 2026-04-16 | 13F | Uhlmann Price Securities, Llc | 2.900 | 540 | ||||||
| 2026-02-13 | 13F | SRS Capital Advisors, Inc. | 3.378 | -56,34 | 459 | -54,10 | ||||
| 2026-02-05 | 13F | Plante Moran Financial Advisors, LLC | 72 | 0,00 | 10 | 0,00 | ||||
| 2025-11-14 | 13F | Bayesian Capital Management, LP | 0 | -100,00 | 0 | -100,00 | ||||
| 2026-02-13 | 13F | Walleye Capital LLC | Call | 13.800 | 91,67 | 1.876 | 101,61 | |||
| 2026-02-13 | 13F | Walleye Capital LLC | Put | 9.400 | 135,00 | 1.278 | 147,00 | |||
| 2026-01-22 | 13F | Massachusetts Financial Services Co /ma/ | 239.738 | -5,86 | 32.583 | -1,03 | ||||
| 2026-02-12 | 13F | South Dakota Investment Council | 11.906 | -8,46 | 2 | 0,00 | ||||
| 2026-02-13 | 13F | Williams Jones Wealth Management, LLC. | 2.325 | 0,00 | 316 | 5,00 | ||||
| 2026-01-26 | 13F | AE Wealth Management LLC | 2.984 | 25,70 | 405 | 32,35 | ||||
| 2026-02-10 | 13F | Bridges Investment Management Inc | 7.176 | -14,98 | 975 | -10,63 | ||||
| 2026-02-17 | 13F | Public Employees Retirement System Of Ohio | 76.261 | 1,41 | 10.365 | 6,63 | ||||
| 2025-11-14 | 13F | Mount Yale Investment Advisors, LLC | 0 | -100,00 | 0 | -100,00 | ||||
| 2026-02-09 | 13F | Putnam Fl Investment Management Co | 3.645 | 0,00 | 495 | 5,10 | ||||
| 2026-02-13 | 13F | Verition Fund Management LLC | Call | 8.700 | -73,39 | 1.182 | -72,04 | |||
| 2026-02-13 | 13F | Verition Fund Management LLC | 24.057 | -65,88 | 3.270 | -64,13 | ||||
| 2026-04-21 | 13F | Tritonpoint Wealth, Llc | 95.172 | -2,39 | 18.516 | 39,73 | ||||
| 2026-05-01 | 13F | Thrivent Financial For Lutherans | 26.394 | -0,15 | 5 | 66,67 | ||||
| 2026-02-06 | 13F | Jag Capital Management, Llc | 4.455 | 605 | ||||||
| 2026-02-13 | 13F | Rhumbline Advisers | 293.905 | -5,09 | 39.945 | -0,21 | ||||
| 2026-02-17 | 13F | GCM Grosvenor Holdings, LLC | 0 | -100,00 | 0 | |||||
| 2026-02-13 | 13F | Nicholas Investment Partners, LP | 63.679 | 0,00 | 8.655 | 5,14 | ||||
| 2026-04-28 | 13F | DGS Capital Management, LLC | 1.314 | 256 | ||||||
| 2026-02-09 | 13F | Huntington National Bank | 5.616 | 7,32 | 763 | 12,87 | ||||
| 2026-02-13 | 13F | Umb Bank N A/mo | 1.483 | 4,44 | 202 | 9,84 | ||||
| 2026-04-30 | 13F | Private Trust Co Na | 510 | 25,00 | 99 | 80,00 | ||||
| 2026-02-10 | 13F/A | Northwestern Mutual Wealth Management Co | 3.208 | 145,82 | 436 | 158,93 | ||||
| 2026-02-17 | 13F | United Capital Financial Advisers, Llc | 6.456 | 1,37 | 877 | 6,56 | ||||
| 2026-02-05 | 13F | North Dakota State Investment Board | 4.036 | 549 | ||||||
| 2026-04-14 | 13F | Perpetual Ltd | 5.159 | -5,99 | 1.004 | 34,63 | ||||
| 2026-02-11 | 13F | Meeder Asset Management Inc | 74 | 236,36 | 10 | 400,00 | ||||
| 2026-02-11 | 13F | Group One Trading, L.p. | Put | 51.800 | 709,38 | 7.040 | 751,27 | |||
| 2026-02-18 | 13F | Vident Advisory, LLC | 5.433 | -5,53 | 738 | -0,67 | ||||
| 2026-02-11 | 13F | Group One Trading, L.p. | 1.413 | 382,25 | 192 | 418,92 | ||||
| 2026-02-11 | 13F | Group One Trading, L.p. | Call | 3.300 | 26,92 | 449 | 33,33 | |||
| 2026-04-10 | 13F | Abound Wealth Management | 1 | 0,00 | 0 | |||||
| 2026-04-24 | 13F | Bayban | 19 | 0,00 | 4 | 50,00 | ||||
| 2026-02-06 | 13F | Larson Financial Group LLC | 475 | 8,45 | 65 | 14,29 | ||||
| 2026-02-13 | 13F | Victory Capital Management Inc | 40.521 | -1,63 | 5.507 | 3,42 | ||||
| 2026-02-02 | 13F | Wolverine Asset Management Llc | 2.614 | 0,00 | 355 | 5,34 | ||||
| 2026-02-17 | 13F | Laird Norton Trust Company, Llc | 2.069 | 281 | ||||||
| 2026-02-17 | 13F | Ameriprise Financial Inc | 489.147 | -5,04 | 66.480 | -0,16 | ||||
| 2026-02-17 | 13F | HighVista Strategies LLC | 12.723 | -39,64 | 1.729 | -36,55 | ||||
| 2026-02-17 | 13F | Summit Trail Advisors, Llc | 8.106 | 22,86 | 1.102 | 29,23 | ||||
| 2026-04-15 | 13F | Bayforest Capital Ltd | 1.377 | 49,84 | 268 | 115,32 | ||||
| 2026-02-06 | 13F | Tortoise Investment Management, LLC | 0 | -100,00 | 0 | |||||
| 2026-02-17 | 13F | Lagoda Investment Management, L.P. | 68.665 | -4,57 | 9.332 | 0,34 | ||||
| 2026-01-30 | 13F | Turning Point Benefit Group, Inc. | 35 | 5 | ||||||
| 2026-02-10 | 13F | Thoroughbred Financial Services, Llc | 11.165 | 0,00 | 2 | 0,00 | ||||
| 2026-02-02 | 13F | Principal Financial Group Inc | 308.511 | -3,15 | 41.930 | 1,82 | ||||
| 2026-02-13 | 13F | Resources Management Corp /ct/ /adv | 9.532 | -0,37 | 1 | 0,00 | ||||
| 2025-11-12 | 13F | CIBC Bancorp USA Inc. | 5.015 | 648 | ||||||
| 2026-04-16 | 13F | Fortem Financial Group, Llc | 1.366 | 266 | ||||||
| 2026-02-05 | 13F | New York Life Investment Management Llc | 10.511 | -10,58 | 1.429 | -5,99 | ||||
| 2026-02-11 | 13F | Havemeyer Place LP | 5.437 | 739 | ||||||
| 2026-02-12 | 13F | Federation des caisses Desjardins du Quebec | 9.249 | 15,67 | 1.257 | 21,68 | ||||
| 2026-02-17 | 13F | Cetera Investment Advisers | 12.923 | 8,38 | 1.756 | 13,95 | ||||
| 2026-02-17 | 13F | California State Teachers Retirement System | 111.450 | 0,47 | 15.147 | 5,63 | ||||
| 2026-04-13 | 13F | Creative Financial Designs Inc /adv | 91 | 8,33 | 18 | 54,55 | ||||
| 2026-02-11 | 13F | United Financial Planning Group LLC | 2 | 0 | ||||||
| 2026-04-30 | 13F | First Horizon Corp | 6 | -62,50 | 1 | -50,00 | ||||
| 2026-02-17 | 13F | Jain Global LLC | 152.165 | 280,62 | 20.681 | 300,23 | ||||
| 2026-05-01 | 13F | Gables Capital Management Inc. | 2.711 | -0,29 | 527 | 42,82 | ||||
| 2026-01-29 | 13F | DecisionPoint Financial, LLC | 2 | 0,00 | 0 | |||||
| 2026-02-17 | 13F | Captrust Financial Advisors | 10.229 | 36,75 | 1.390 | 43,89 | ||||
| 2026-04-17 | 13F | AdvisorNet Financial, Inc | 1 | 0 | ||||||
| 2026-01-29 | 13F | Dunhill Financial, LLC | 2 | 0 | ||||||
| 2026-04-30 | 13F | Cambridge Investment Research Advisors, Inc. | 9.666 | -0,92 | 2 | 0,00 | ||||
| 2026-02-03 | 13F | Mitsubishi UFJ Kokusai Asset Management Co., Ltd. | 177 | 0,00 | 25 | 9,09 | ||||
| 2026-04-22 | 13F | Motco | 44 | -10,20 | 9 | 33,33 | ||||
| 2026-02-17 | 13F | Mercer Global Advisors Inc /adv | 7.135 | -13,30 | 970 | -8,84 | ||||
| 2026-04-22 | 13F | Apollon Wealth Management, LLC | 1.354 | 263 | ||||||
| 2026-04-27 | 13F | PFG Investments, LLC | 2.517 | -8,84 | 490 | 30,40 | ||||
| 2026-01-30 | 13F | State of New Jersey Common Pension Fund D | 40.465 | -0,30 | 5.500 | 4,82 | ||||
| 2026-04-09 | 13F | Everhart Financial Group, Inc. | 1.205 | 234 | ||||||
| 2026-02-17 | 13F | Millennium Management Llc | Call | 11.700 | -89,36 | 1.590 | -88,82 | |||
| 2026-04-22 | 13F | Promethium Advisors,llc | 4.762 | -1,24 | 926 | 41,37 | ||||
| 2026-04-24 | 13F | Essex Financial Services, Inc. | 2.474 | -19,54 | 481 | 15,35 | ||||
| 2026-02-17 | 13F | Millennium Management Llc | Put | 22.200 | 13,85 | 3.017 | 19,72 | |||
| 2026-02-10 | 13F | Cercano Management LLC | 1.945.996 | 0,00 | 264.480 | 5,14 | ||||
| 2026-02-13 | 13F | Commerce Bank | 2.764 | 22,79 | 376 | 29,31 | ||||
| 2026-02-17 | 13F | Advisor Group Holdings, Inc. | Put | 0 | -100,00 | 0 | ||||
| 2026-04-16 | 13F | SG Americas Securities, LLC | 8.465 | -67,30 | 2 | -66,67 | ||||
| 2026-02-12 | 13F | Renaissance Technologies Llc | 103.120 | 194,46 | 14.015 | 209,59 | ||||
| 2026-02-17 | 13F | Millennium Management Llc | 7.819 | -97,05 | 1.063 | -96,90 | ||||
| 2026-04-14 | 13F | Moisand Fitzgerald Tamayo, LLC | 10 | 0,00 | 2 | 0,00 | ||||
| 2026-02-17 | 13F | Fmr Llc | 2.906.278 | 39,26 | 394.992 | 46,42 | ||||
| 2026-04-13 | 13F | True Wealth Design, LLC | 14 | 27,27 | 3 | 100,00 | ||||
| 2026-02-13 | 13F | Public Employees Retirement Association Of Colorado | 11.741 | 0,00 | 2 | 0,00 | ||||
| 2025-11-14 | 13F | Adage Capital Partners Gp, L.l.c. | 0 | -100,00 | 0 | |||||
| 2026-02-17 | 13F | Algert Global Llc | 47.578 | 4,09 | 6 | 20,00 | ||||
| 2026-04-13 | 13F | Wolff Wiese Magana Llc | 16 | 0,00 | 3 | 50,00 | ||||
| 2026-05-01 | 13F | Signature Resources Capital Management, LLC | 96 | -10,28 | 19 | 28,57 | ||||
| 2026-04-27 | 13F | HB Wealth Management, LLC | 3.002 | 9,12 | 584 | 56,57 | ||||
| 2026-04-17 | 13F | Brown, Lisle/cummings, Inc. | 15 | 3 | ||||||
| 2026-02-13 | 13F | Hudson Bay Capital Management LP | 76.900 | -2,76 | 10.451 | 2,24 | ||||
| 2026-02-12 | 13F | Voya Investment Management Llc | 12.284 | -7,97 | 1.670 | -3,25 | ||||
| 2026-02-13 | 13F | Acumen Wealth Advisors, LLC | 2 | 0 | ||||||
| 2026-01-13 | 13F | Guerra Pan Advisors, Llc | 5.911 | 0,00 | 803 | 5,10 | ||||
| 2026-02-13 | 13F | Blueshift Asset Management, LLC | 3.273 | 445 | ||||||
| 2026-02-17 | 13F | Trexquant Investment LP | 9.615 | -85,71 | 1.307 | -84,98 | ||||
| 2025-11-14 | 13F | Ilex Capital Partners (UK) LLP | 0 | -100,00 | 0 | |||||
| 2026-04-15 | 13F | Journey Strategic Wealth Llc | 1.931 | 22,29 | 376 | 75,23 | ||||
| 2026-02-17 | 13F | Occudo Quantitative Strategies Lp | 0 | -100,00 | 0 | |||||
| 2025-11-14 | 13F | LMR Partners LLP | Call | 0 | -100,00 | 0 | -100,00 | |||
| 2026-04-17 | 13F | Fifth Third Wealth Advisors LLC | 10.927 | 6,21 | 2.126 | 52,00 | ||||
| 2026-02-05 | 13F | Bessemer Group Inc | 1.121.419 | 228.761,02 | 152 | |||||
| 2026-02-17 | 13F | Amundi | 6.330 | 860 | ||||||
| 2026-04-23 | 13F | Oppenheimer Asset Management Inc. | 2.653 | 5,19 | 516 | 50,88 | ||||
| 2025-11-14 | 13F | LMR Partners LLP | Put | 0 | -100,00 | 0 | -100,00 | |||
| 2026-02-13 | 13F | Cynosure Management, Llc | 0 | -100,00 | 0 | -100,00 | ||||
| 2026-04-23 | 13F | iA Global Asset Management Inc. | 34.880 | -61,71 | 7 | -50,00 | ||||
| 2025-11-14 | 13F | Challenger Wealth Management | 0 | -100,00 | 0 | |||||
| 2026-04-30 | 13F | Kestra Advisory Services, LLC | 3.924 | 467,87 | 763 | 720,43 | ||||
| 2026-01-29 | 13F | UBS Group AG | Put | 56.500 | 1.722,58 | 7.679 | 1.819,50 | |||
| 2026-02-13 | 13F | JustInvest LLC | 13.785 | 3,79 | 1.874 | 9,15 | ||||
| 2026-01-29 | 13F | UBS Group AG | Call | 269.300 | 4.464,41 | 36.601 | 4.703,15 | |||
| 2026-01-23 | 13F | Optima Capital Llc | 8 | 1 | ||||||
| 2026-01-29 | 13F | UBS Group AG | 1.172.758 | 39,55 | 159.390 | 46,72 | ||||
| 2026-02-11 | 13F | Clearbridge Investments, LLC | 2.970.231 | 9,67 | 403.684 | 15,31 | ||||
| 2025-11-14 | 13F | Capstone Investment Advisors, Llc | 0 | -100,00 | 0 | |||||
| 2026-02-11 | 13F | Manchester Capital Management LLC | 7 | 1 | ||||||
| 2026-02-13 | 13F | 1832 Asset Management L.P. | 73.000 | 9.921 | ||||||
| 2026-04-27 | 13F | Koshinski Asset Management, Inc. | 1.553 | -7,56 | 302 | 32,46 | ||||
| 2026-02-11 | 13F | X-Square Capital, LLC | 23.083 | -4,13 | 3 | 0,00 | ||||
| 2026-02-13 | 13F | Findlay Park Partners LLP | 1.415.100 | -5,05 | 192.326 | -0,18 | ||||
| 2026-02-13 | 13F | Morgan Stanley | 1.193.780 | -20,47 | 162.247 | -16,39 | ||||
| 2026-02-17 | 13F | One Madison Group Llc | 363.866 | -9,03 | 49.453 | -4,36 | ||||
| 2026-04-17 | 13F | Halbert Hargrove Global Advisors, Llc | 119 | 0,00 | 23 | 43,75 | ||||
| 2026-02-17 | 13F | Shelton Capital Management | 3.874 | -4,51 | 527 | 0,38 | ||||
| 2026-02-13 | 13F | Barclays Plc | Put | 927.000 | 692,31 | 125.989 | 733,03 | |||
| 2026-03-24 | 13F | Armis Advisers, LLC | 7.009 | -61,06 | 1.275 | -48,81 | ||||
| 2026-02-13 | 13F | Barclays Plc | 166.120 | 3,58 | 22.577 | 8,90 | ||||
| 2026-02-13 | 13F | Barclays Plc | Call | 17.000 | 0,00 | 2.310 | 5,14 | |||
| 2026-02-09 | 13F | Redmond Asset Management, LLC | 54.890 | -27,58 | 7.460 | -23,86 | ||||
| 2026-02-17 | 13F | Guggenheim Capital Llc | 10.909 | 26,20 | 1.483 | 32,68 | ||||
| 2026-02-06 | 13F/A | Rathbone Brothers plc | 12.225 | 0,00 | 1.661 | 5,13 | ||||
| 2026-02-17 | 13F | D1 Capital Partners L.P. | 2.035.042 | -18,78 | 276.583 | -14,61 | ||||
| 2026-04-07 | 13F | Central Pacific Bank - Trust Division | 2.997 | 583 | ||||||
| 2026-04-29 | 13F | CVA Family Office, LLC | 151 | 906,67 | 29 | 1.350,00 | ||||
| 2026-04-23 | 13F | Harbor Investment Advisory, Llc | 98 | 0,00 | 19 | 46,15 | ||||
| 2026-02-17 | 13F | Advisor Group Holdings, Inc. | Call | 1 | 0,00 | 4 | 0,00 | |||
| 2026-04-10 | 13F | Sterling Manor Financial, LLC | 1.195 | 232 | ||||||
| 2026-02-13 | 13F | Sei Investments Co | 179.383 | 0,35 | 24.380 | 5,51 | ||||
| 2026-04-29 | 13F | Nicholas Hoffman & Company, LLC. | 4.727 | 0,00 | 920 | 43,15 | ||||
| 2026-02-12 | 13F | Rossby Financial, LCC | 51 | 218,75 | 7 | 200,00 | ||||
| 2026-02-17 | 13F | FIL Ltd | 1.367.517 | -3,74 | 185.859 | 1,20 | ||||
| 2026-02-13 | 13F | Treasurer of the State of North Carolina | 48.026 | -6,83 | 7 | 0,00 | ||||
| 2026-02-06 | 13F | Cullen/frost Bankers, Inc. | 718 | -5,15 | 98 | 0,00 | ||||
| 2026-02-11 | 13F | Greykasell Wealth Strategies, Inc. | 60 | 0,00 | 8 | 14,29 | ||||
| 2026-02-12 | 13F | MetLife Investment Management, LLC | 87.894 | -3,34 | 11.946 | 1,62 | ||||
| 2026-02-17 | 13F | Farringdon Capital, Ltd. | 5.653 | 768 | ||||||
| 2026-02-17 | 13F | Janus Henderson Group Plc | 51.702 | 1,96 | 7.026 | 7,14 | ||||
| 2026-02-17 | 13F | Utah Retirement Systems | 6.113 | 0,00 | 831 | 5,06 | ||||
| 2026-02-12 | 13F | Penserra Capital Management LLC | 630 | -0,63 | 0 | |||||
| 2026-02-17 | 13F | Odyssean, LLC | 5.369 | 730 | ||||||
| 2026-02-17 | 13F | T. Rowe Price Investment Management, Inc. | 1.939.475 | -34,41 | 264 | -31,15 | ||||
| 2026-05-01 | 13F | Supplemental Annuity Collective Trust of NJ | 0 | -100,00 | 0 | |||||
| 2026-04-28 | 13F | Cherokee Insurance Co | 5.000 | 0,00 | 973 | 43,15 | ||||
| 2026-02-09 | 13F | Legal & General Group Plc | 184.467 | -2,20 | 25.071 | 2,82 | ||||
| 2026-02-12 | 13F | JPL Wealth Management, LLC | 0 | -100,00 | 0 | |||||
| 2026-04-27 | 13F | DSG Capital Advisors, LLC | 1.220 | 237 | ||||||
| 2026-04-29 | 13F | Resonant Capital Advisors, LLC | 4.193 | 2,34 | 816 | 46,58 | ||||
| 2026-02-13 | 13F | Squarepoint Ops LLC | 0 | -100,00 | 0 | -100,00 | ||||
| 2026-02-11 | 13F | Janney Capital Management LLC | 3.772 | 1,73 | 1 | |||||
| 2026-04-22 | 13F | Pictet Asset Management Holding SA | 18.638 | 7,57 | 3.626 | 54,04 | ||||
| 2026-02-03 | 13F | Legacy Wealth Managment, LLC/ID | 76 | 10 | ||||||
| 2026-02-17 | 13F | Sig Brokerage, Lp | Call | 0 | -100,00 | 0 | ||||
| 2026-02-12 | 13F | Cloud Capital Management, LLC | 0 | -100,00 | 0 | |||||
| 2026-04-29 | 13F | R Squared Ltd | 2.260 | 440 | ||||||
| 2026-04-28 | 13F | Handelsbanken Fonder AB | 37.000 | 9,14 | 7 | 75,00 | ||||
| 2026-02-12 | 13F | Dimensional Fund Advisors Lp | 1.190.895 | 1,02 | 161.868 | 6,23 | ||||
| 2026-05-01 | 13F | Sachetta, LLC | 32 | 0,00 | 6 | 50,00 | ||||
| 2026-05-01 | 13F | Hantz Financial Services, Inc. | 6.806 | 61,74 | 1 | |||||
| 2026-04-14 | 13F | Nbc Securities, Inc. | 8 | 0,00 | 2 | 0,00 | ||||
| 2026-01-27 | 13F | Seeds Investor Llc | 2.019 | 274 | ||||||
| 2026-04-06 | 13F | GAMMA Investing LLC | 3.535 | 37,33 | 688 | 96,85 | ||||
| 2026-04-09 | 13F | Nelson, Van Denburg & Campbell Wealth Management Group, LLC | 2.194 | -71,51 | 427 | -59,27 | ||||
| 2026-04-30 | 13F | Whipplewood Advisors, LLC | 6 | 1 | ||||||
| 2026-02-10 | 13F | Argent Trust Co | 3.365 | -12,94 | 457 | -8,42 | ||||
| 2026-02-09 | 13F | Kingsview Wealth Management, LLC | 4.964 | 0,06 | 675 | 5,15 | ||||
| 2026-02-12 | 13F | Principal Securities, Inc. | 2.427 | -18,17 | 330 | -14,10 | ||||
| 2025-11-14 | 13F | Candelo Capital Management LP | 0 | -100,00 | 0 | -100,00 | ||||
| 2025-11-14 | 13F | Freestone Grove Partners LP | 0 | -100,00 | 0 | -100,00 | ||||
| 2026-04-30 | 13F | Teacher Retirement System Of Texas | 12.432 | 219,51 | 2.419 | 357,95 | ||||
| 2026-04-28 | 13F | Whittier Trust Co | 79 | 0,00 | 16 | 45,45 | ||||
| 2026-02-13 | 13F | American Century Companies Inc | 260.077 | 725,46 | 35.347 | 768,05 | ||||
| 2026-02-13 | 13F | Transamerica Financial Advisors, Inc. | 48 | 7 | ||||||
| 2026-02-09 | 13F | Hartland & Co., LLC | 484 | 142,00 | 66 | 160,00 | ||||
| 2026-04-20 | 13F | Louisiana State Employees Retirement System | 34.000 | 4,62 | 6.615 | 49,74 | ||||
| 2025-11-14 | 13F | Teza Capital Management LLC | 0 | -100,00 | 0 | -100,00 | ||||
| 2026-01-29 | 13F | Calamos Advisors LLC | 13.973 | 247,85 | 1.899 | 265,90 | ||||
| 2026-02-13 | 13F | Verition Fund Management LLC | Put | 0 | -100,00 | 0 | -100,00 | |||
| 2026-04-28 | 13F | Sage Rhino Capital Llc | 1.296 | -16,87 | 252 | 19,43 | ||||
| 2026-04-23 | 13F | Marquette Asset Management, LLC | 11 | 0,00 | 2 | 100,00 | ||||
| 2026-02-12 | 13F | Quadrant Capital Group Llc | 11.339 | 1,19 | 1.541 | 6,42 | ||||
| 2026-04-27 | 13F | Qrg Capital Management, Inc. | 6.119 | 21,00 | 1.190 | 73,22 | ||||
| 2026-02-13 | 13F | Corient IA LLC | 1.500 | 204 | ||||||
| 2026-02-05 | 13F | Requisite Capital Management, LLC | 0 | -100,00 | 0 | |||||
| 2026-02-17 | 13F | Canada Pension Plan Investment Board | 1.900 | 258 | ||||||
| 2026-02-13 | 13F | Marshall Wace, Llp | 9.674 | 1.315 | ||||||
| 2026-04-29 | 13F | Fishman Jay A Ltd/mi | 284.261 | -4,72 | 55.303 | 36,39 | ||||
| 2026-02-17 | 13F | Steadfast Capital Management Lp | 127.000 | 17.261 | ||||||
| 2026-02-13 | 13F | Brown Advisory Inc | 8.671 | -1,00 | 1.178 | 4,06 | ||||
| 2026-02-17 | 13F | Alliancebernstein L.p. | 165.904 | -33,99 | 22.548 | -30,60 | ||||
| 2026-04-24 | 13F | Strs Ohio | 26.842 | -37,21 | 5.222 | -10,11 | ||||
| 2026-02-09 | 13F | Geode Capital Management, Llc | 2.117.422 | 1,08 | 287.841 | 6,28 | ||||
| 2026-04-24 | 13F | Key FInancial Inc | 68 | 0,00 | 13 | 44,44 | ||||
| 2026-02-17 | 13F | Delaware Management Holdings, Inc. | 146.513 | 19.913 | ||||||
| 2026-02-11 | 13F | Winton Capital Group Ltd | 35.010 | 4.758 | ||||||
| 2026-04-14 | 13F | Zrc Wealth Management, Llc | 8 | 60,00 | 2 | |||||
| 2025-11-07 | 13F | Readystate Asset Management Lp | 0 | -100,00 | 0 | |||||
| 2026-02-17 | 13F | DV Trading LLC | 56 | 8 | ||||||
| 2026-02-13 | 13F | Kayne Anderson Rudnick Investment Management Llc | 5 | 0,00 | 1 | |||||
| 2026-02-03 | 13F | NewEdge Wealth, LLC | 2.271 | 32,42 | 309 | 29,96 | ||||
| 2025-11-12 | 13F | NewSquare Capital LLC | 0 | -100,00 | 0 | |||||
| 2026-02-17 | 13F | Wealth Watch Advisors, INC | 29 | 0,00 | 4 | 0,00 | ||||
| 2026-02-17 | 13F | Cresset Asset Management, LLC | 4.119 | 0,00 | 560 | 5,08 | ||||
| 2025-11-17 | 13F | Laurion Capital Management LP | 0 | -100,00 | 0 | -100,00 | ||||
| 2026-04-30 | 13F | Torren Management, LLC | 13 | -95,20 | 3 | -94,44 | ||||
| 2026-04-13 | 13F | Mather Group, Llc. | 19 | 4 | ||||||
| 2026-02-17 | 13F | Hancock Whitney Corp | 18.825 | -1,13 | 2.559 | 3,94 | ||||
| 2026-04-15 | 13F | Exchange Traded Concepts, Llc | 1.015 | 197 | ||||||
| 2026-04-10 | 13F/A | OP Asset Management Ltd | 2.792 | -62,63 | 543 | -46,50 | ||||
| 2026-02-13 | 13F | Wells Fargo & Company/mn | 436.841 | 7,12 | 59.371 | 12,62 | ||||
| 2026-01-22 | 13F | Richardson Financial Services Inc. | 965 | 0,00 | 131 | 5,65 | ||||
| 2026-04-23 | 13F | Oppenheimer & Co Inc | 61.556 | -0,94 | 11.976 | 41,80 | ||||
| 2026-02-13 | 13F | Manufacturers Life Insurance Company, The | 0 | -100,00 | 0 | |||||
| 2026-04-15 | 13F | City Holding Co | 6.815 | -2,85 | 1.326 | 39,03 | ||||
| 2026-02-10 | 13F | Private Wealth Asset Management, LLC | 2 | 0,00 | 0 | |||||
| 2026-02-11 | 13F | Primecap Management Co/ca/ | 569.634 | -3,05 | 77.419 | 1,93 | ||||
| 2026-02-05 | 13F | Amalgamated Bank | 53.926 | -0,90 | 7 | 0,00 | ||||
| 2026-02-13 | 13F | Macquarie Group Ltd | 0 | -100,00 | 0 | |||||
| 2026-02-17 | 13F | Aster Capital Management (DIFC) Ltd | 1.020 | 139 | ||||||
| 2025-11-12 | 13F | Forge First Asset Management Inc. | 0 | -100,00 | 0 | |||||
| 2026-04-28 | 13F | Steigerwald, Gordon & Koch Inc. | 45 | 0,00 | 9 | 33,33 | ||||
| 2026-04-13 | 13F | IFP Advisors, Inc | 370 | 0,00 | 72 | 42,00 | ||||
| 2026-01-29 | 13F | State Of Michigan Retirement System | 27.742 | -1,07 | 3.770 | 4,03 | ||||
| 2026-02-09 | 13F | Wellington Shields & Co., LLC | 1.000 | 136 | ||||||
| 2026-02-17 | 13F | Price T Rowe Associates Inc /md/ | 164.907 | 3,60 | 22 | 10,00 | ||||
| 2026-04-22 | 13F | Bravera Wealth | 99 | 19 | ||||||
| 2026-04-23 | 13F | Embree Financial Group | 2.583 | 0,23 | 503 | 43,43 | ||||
| 2026-04-15 | 13F | Retireful, LLC | 5.736 | 1.116 | ||||||
| 2025-11-14 | 13F | Binnacle Investments Inc | 22 | 0,00 | 3 | 0,00 | ||||
| 2026-04-29 | 13F | Cary Street Partner Investment Advisory Llc | 140 | 27 | ||||||
| 2026-04-29 | 13F | Cary Street Partners Financial Llc | 912 | 177 | ||||||
| 2026-02-12 | 13F | Commonwealth Equity Services, Llc | 13.013 | -0,19 | 1.769 | 176.700,00 | ||||
| 2026-02-19 | 13F | CI Private Wealth, LLC | 9.043 | 116,08 | 862 | 59,63 | ||||
| 2026-02-17 | 13F | Hood River Capital Management LLC | 1.148.950 | 1,86 | 156.154 | 7,09 | ||||
| 2026-04-22 | 13F | Patriot Financial Group Insurance Agency, LLC | 1.574 | 306 | ||||||
| 2026-02-17 | 13F | Holt Capital Advisors, L.L.C. dba Holt Capital Partners, L.P. | 19.765 | -1,25 | 2.686 | 3,83 | ||||
| 2026-04-27 | 13F | New York State Teachers Retirement System | 102.222 | -4,61 | 20 | 35,71 | ||||
| 2026-02-10 | 13F | Bnp Paribas Arbitrage, Sa | 439.175 | 28,41 | 59.688 | 35,01 | ||||
| 2026-02-11 | 13F | Parallel Advisors, LLC | 372 | 9,09 | 51 | 13,64 | ||||
| 2026-02-17 | 13F | Fred Alger Management, Llc | 3.996 | -33,78 | 543 | -30,38 | ||||
| 2026-02-17 | 13F | Aureus Asset Management, LLC | 10.000 | 0,00 | 1.359 | 5,19 | ||||
| 2026-04-17 | 13F | CENTRAL TRUST Co | 0 | -100,00 | 0 | |||||
| 2026-04-29 | 13F | Agman Capital Llc | 34.960 | -15,95 | 6.801 | 20,33 | ||||
| 2026-01-26 | 13F | Grandview Asset Management LLC | 3.117 | -10,28 | 424 | -5,79 | ||||
| 2026-02-06 | 13F | Bare Financial Services, Inc | 55 | 7,84 | 7 | 16,67 | ||||
| 2026-04-16 | 13F | First Community Trust Na | 146 | -70,80 | 28 | -58,21 | ||||
| 2026-02-13 | 13F | Greenline Wealth Management LLC | 35 | 5 | ||||||
| 2026-02-13 | 13F | Thornburg Investment Management Inc | 84.488 | -0,67 | 11.483 | 4,43 | ||||
| 2026-02-17 | 13F | Aqr Capital Management Llc | 34.437 | -1,05 | 4.680 | 5,93 | ||||
| 2026-04-27 | 13F | Greenleaf Trust | 6.957 | 0,22 | 1.353 | 43,48 | ||||
| 2025-11-12 | 13F | Catalyst Funds Management Pty Ltd | 0 | -100,00 | 0 | |||||
| 2026-02-13 | 13F | Toroso Investments, LLC | 5.187 | 28,30 | 705 | 34,87 | ||||
| 2026-02-13 | 13F | Channing Capital Management, LLC | 73.564 | -16,74 | 9.998 | -12,46 | ||||
| 2026-01-27 | 13F | Regions Financial Corp | 4.805 | -2,71 | 653 | 2,35 | ||||
| 2026-04-28 | 13F | Bogart Wealth, LLC | 108 | 4,85 | 21 | 61,54 | ||||
| 2026-02-17 | 13F | Balyasny Asset Management Llc | 47.498 | 6.455 | ||||||
| 2026-04-27 | 13F | Leonteq Securities AG | 32 | -93,73 | 6 | -91,30 | ||||
| 2026-02-13 | 13F | Neuberger Berman Group LLC | 11.159 | 2,86 | 1.517 | 8,13 | ||||
| 2026-02-11 | 13F | Wellspring Financial Advisors, LLC | 2.717 | 369 | ||||||
| 2026-02-13 | 13F | Hauser Family AG | 0 | -100,00 | 0 | |||||
| 2026-02-10 | 13F | Td Asset Management Inc | 207.800 | -3,97 | 28.242 | 0,96 | ||||
| 2026-01-23 | 13F | Legacy Bridge, LLC | 90 | 0,00 | 12 | 9,09 | ||||
| 2026-02-13 | 13F | Forest Avenue Capital Management LP | 467.057 | -5,14 | 63.478 | -0,27 | ||||
| 2025-11-14 | 13F | Cartenna Capital, LP | 0 | -100,00 | 0 | |||||
| 2026-01-29 | 13F | Teachers Retirement System Of The State Of Kentucky | 34.860 | 0,00 | 5 | 0,00 | ||||
| 2025-11-07 | 13F | Shell Asset Management Co | 1.227 | -60,11 | 0 | |||||
| 2025-11-07 | 13F | Alberta Investment Management Corp | 0 | -100,00 | 0 | |||||
| 2026-05-01 | 13F | Fifth Third Bancorp | 33.884 | 3.005,77 | 6.592 | 4.353,38 | ||||
| 2026-02-12 | 13F | BlackRock, Inc. | 11.644.620 | 0,21 | 1.582.620 | 5,35 | ||||
| 2026-04-17 | 13F | Bell Investment Advisors, Inc | 72 | 2,86 | 14 | 55,56 | ||||
| 2026-02-13 | 13F | Citigroup Inc | 66.213 | -59,10 | 8.999 | -57,00 | ||||
| 2026-02-17 | 13F | Tower Research Capital LLC (TRC) | 4.173 | -27,65 | 567 | -23,89 | ||||
| 2026-02-11 | 13F | Twin Tree Management, LP | Put | 8.600 | 1.169 | |||||
| 2026-02-13 | 13F | Bridgefront Capital, LLC | 6.344 | 862 | ||||||
| 2026-02-17 | 13F | Rakuten Investment Management, Inc. | 0 | -100,00 | 0 | |||||
| 2026-02-06 | 13F | Global Retirement Partners, LLC | 3.516 | 24,20 | 478 | 30,68 | ||||
| 2025-11-13 | 13F | C M Bidwell & Associates Ltd | 0 | -100,00 | 0 | |||||
| 2026-02-11 | 13F | Capital International Ltd /ca/ | 26.319 | -26,85 | 3.577 | -23,09 | ||||
| 2026-02-12 | 13F | Xponance, Inc. | 14.164 | -13,44 | 1.925 | -8,98 | ||||
| 2026-02-13 | 13F | Brant Point Investment Management Llc | 10.000 | 100,00 | 1.359 | 110,37 | ||||
| 2025-11-13 | 13F | Maplelane Capital, Llc | 0 | -100,00 | 0 | |||||
| 2026-02-18 | 13F | GWM Advisors LLC | 0 | -100,00 | 0 | |||||
| 2026-02-10 | 13F | Intech Investment Management Llc | 59.082 | 2,12 | 8.030 | 7,37 | ||||
| 2026-04-28 | 13F | Flagship Harbor Advisors, Llc | 6.802 | -4,22 | 1.323 | 37,10 | ||||
| 2026-04-21 | 13F | GHP Investment Advisors, Inc. | 1 | 0 | ||||||
| 2026-04-24 | 13F | Capital Asset Advisory Services LLC | 959 | 219 | ||||||
| 2026-01-27 | 13F | Proffitt & Goodson Inc | 0 | -100,00 | 0 | |||||
| 2025-11-14 | 13F | Texas Permanent School Fund | 0 | -100,00 | 0 | |||||
| 2026-01-30 | 13F | WoodTrust Financial Corp | 1.565 | 0,00 | 0 | |||||
| 2026-02-11 | 13F | Capital International Sarl | 45.303 | -25,88 | 6.157 | -22,07 | ||||
| 2026-02-13 | 13F | Mml Investors Services, Llc | 3.348 | 31,14 | 455 | 37,58 | ||||
| 2026-04-22 | 13F | Border to Coast Pensions Partnership Ltd | 184.721 | 36 | ||||||
| 2026-01-22 | 13F | Ofi Invest Asset Management | 6.148 | 0,00 | 711 | 5,18 | ||||
| 2026-01-29 | 13F | RMG Wealth Management LLC | 200 | 0,00 | 30 | 11,11 | ||||
| 2026-02-11 | 13F | O'shaughnessy Asset Management, Llc | 9.573 | 8,28 | 1.301 | 13,92 | ||||
| 2026-02-06 | 13F | Addison Advisors LLC | 1.075 | 0,00 | 146 | 5,80 | ||||
| 2026-05-01 | 13F | Commonwealth Of Pennsylvania Public School Empls Retrmt Sys | 29.352 | -0,07 | 5.710 | 43,04 | ||||
| 2026-02-13 | 13F | Southeastern Asset Management Inc/tn/ | 13.012 | -18,57 | 1.768 | -14,38 | ||||
| 2026-02-17 | 13F | Dark Forest Capital Management Lp | 4.871 | 662 | ||||||
| 2026-04-07 | 13F | Farther Finance Advisors, LLC | 724 | 25,48 | 144 | 83,33 | ||||
| 2026-02-13 | 13F | BNP Paribas Asset Management Holding S.A. | 1.675 | 34,54 | 0 | |||||
| 2026-02-17 | 13F | XTX Topco Ltd | 24.204 | 224,32 | 3.290 | 241,18 | ||||
| 2026-02-12 | 13F | Brinker Capital Investments, LLC | 2.934 | 26,19 | 399 | 32,67 | ||||
| 2026-02-11 | 13F | LPL Financial LLC | 72.125 | 10,71 | 9.803 | 16,40 | ||||
| 2026-05-01 | 13F | Strategic Investment Solutions, Inc. /IL | 100 | 0,00 | 19 | 46,15 | ||||
| 2025-11-04 | 13F | Guerra Advisors Inc | 136 | 18 | ||||||
| 2026-01-23 | 13F | Assetmark, Inc | 190 | 7,95 | 26 | 13,64 | ||||
| 2026-02-06 | 13F | Legato Capital Management LLC | 3.056 | 16,24 | 415 | 22,42 | ||||
| 2026-02-11 | 13F | Walter & Keenan Financial Consulting Co /mi/ /adv | 5.219 | 0,48 | 709 | 5,66 | ||||
| 2026-02-12 | 13F | California Public Employees Retirement System | 164.500 | 8,27 | 22.357 | 13,84 | ||||
| 2026-01-12 | 13F | Rialto Wealth Management, LLC | 15 | 15,38 | 2 | 100,00 | ||||
| 2026-02-19 | 13F | Atomi Financial Group, Inc. | 2.320 | 12,51 | 315 | 18,42 | ||||
| 2026-01-23 | 13F | Westside Investment Management, Inc. | 208 | 4,00 | 28 | 12,00 | ||||
| 2026-02-11 | 13F | Prestige Wealth Management Group LLC | 8 | 0,00 | 1 | 0,00 | ||||
| 2026-02-13 | 13F | Vontobel Holding Ltd. | 0 | -100,00 | 0 | |||||
| 2026-02-12 | 13F | Northwest & Ethical Investments L.P. | 7.665 | -9,82 | 1.055 | -2,50 | ||||
| 2026-02-17 | 13F | Agf Management Ltd | 6.400 | 0,00 | 870 | 5,08 | ||||
| 2026-04-29 | 13F | Skopos Labs, Inc. | 7.297 | 79,64 | 1.420 | 151,60 | ||||
| 2026-02-11 | 13F | Westfield Capital Management Co Lp | 724.214 | 4,25 | 98.428 | 9,60 | ||||
| 2026-02-04 | 13F | Pacer Advisors, Inc. | 19.850 | 26,26 | 2.698 | 32,73 | ||||
| 2026-02-05 | 13F | Paulson Wealth Management Inc. | 1.493 | -9,62 | 203 | -5,16 | ||||
| 2026-02-10 | 13F | Bank of New York Mellon Corp | 710.580 | -1,26 | 96.575 | 3,81 | ||||
| 2026-02-17 | 13F | Ancora Advisors, LLC | 75 | 10 | ||||||
| 2026-02-17 | 13F | Bank Of America Corp /de/ | 426.237 | -41,06 | 57.930 | -38,03 | ||||
| 2026-02-13 | 13F | Okabena Investment Services Inc | 0 | -100,00 | 0 | |||||
| 2026-04-21 | 13F | Pinnacle Associates Ltd | 4.844 | -15,87 | 942 | 20,46 | ||||
| 2026-02-12 | 13F | CIBC Private Wealth Group, LLC | 4.420 | -9,11 | 601 | -4,46 | ||||
| 2026-01-26 | 13F | KBC Group NV | 3.546 | 10,26 | 0 | |||||
| 2026-01-29 | 13F | Comerica Bank | 33.982 | -84,67 | 4.619 | -83,88 | ||||
| 2026-02-17 | 13F | Perbak Capital Partners LLP | 4.484 | 609 | ||||||
| 2025-11-14 | 13F | Colony Group, LLC | 0 | -100,00 | 0 | -100,00 | ||||
| 2026-02-13 | 13F | Milford Funds Ltd | 180.029 | 24.468 | ||||||
| 2026-04-27 | 13F | Truist Financial Corp | 4.898 | -4,43 | 953 | 36,78 | ||||
| 2026-04-28 | 13F | Stephens Inc /ar/ | 3.169 | 14,40 | 617 | 63,83 | ||||
| 2026-02-04 | 13F | Independent Advisor Alliance | 17.702 | -2,93 | 2.406 | 2,04 | ||||
| 2026-02-17 | 13F | Gotham Asset Management, LLC | 77.084 | 71,70 | 10.476 | 80,53 | ||||
| 2026-04-21 | 13F | Red Tortoise LLC | 17 | 0,00 | 3 | 50,00 | ||||
| 2026-02-02 | 13F | Cornerstone Planning Group LLC | 5 | -96,45 | 1 | -100,00 | ||||
| 2026-02-06 | 13F | Partners Group Holding AG | 41.877 | -9,97 | 5.692 | -5,36 | ||||
| 2026-02-05 | 13F | Legacy Financial Group LLC | 1.935 | -2,42 | 347 | 35,55 | ||||
| 2026-02-09 | 13F | Smithfield Trust Co | 75 | 0,00 | 0 | |||||
| 2026-02-13 | 13F | National Bank Of Canada /fi/ | 121.240 | 1,48 | 16.474 | 6,67 | ||||
| 2026-02-17 | 13F | Holocene Advisors, LP | 1.215.870 | 235,49 | 165.249 | 252,73 | ||||
| 2026-02-17 | 13F | Holocene Advisors, LP | Call | 520.000 | -13,33 | 70.673 | -8,88 | |||
| 2026-02-12 | 13F | Jane Street Group, Llc | 118.761 | -43,94 | 16.141 | -41,06 | ||||
| 2026-01-20 | 13F | Wall Street Access Asset Management, LLC | 40 | 0,00 | 5 | 0,00 | ||||
| 2026-02-12 | 13F | Jane Street Group, Llc | Put | 385.400 | 2.194,05 | 52.380 | 2.312,67 | |||
| 2025-11-13 | 13F | Jump Financial, LLC | 0 | -100,00 | 0 | |||||
| 2026-02-12 | 13F | Jane Street Group, Llc | Call | 73.200 | 65,24 | 9.949 | 73,73 | |||
| 2026-04-23 | 13F | MQS Management LLC | 0 | -100,00 | 0 | |||||
| 2026-04-22 | 13F | Wiser Advisor Group LLC | 387 | 0,00 | 75 | 44,23 | ||||
| 2026-02-13 | 13F | Ostrum Asset Management | 4.700 | 12,98 | 639 | 18,81 | ||||
| 2026-04-06 | 13F | Washington Trust Advisors, Inc. | 22 | 37,50 | 4 | 100,00 | ||||
| 2026-04-29 | 13F | Hughes Financial Services, LLC | 6 | 50,00 | 1 | |||||
| 2026-04-21 | 13F | Nemes Rush Group LLC | 7.842 | -0,58 | 1.526 | 42,26 | ||||
| 2026-04-30 | 13F | LRI Investments, LLC | 120 | 73,91 | 23 | 155,56 | ||||
| 2026-02-11 | 13F | Los Angeles Capital Management Llc | 497 | 68 | ||||||
| 2026-01-28 | 13F | Mystic Asset Management, Inc. | 5.700 | 0,00 | 775 | 5,16 | ||||
| 2025-11-14 | 13F | Strategic Wealth Partners, Ltd. | 759 | 0,00 | 98 | 3,16 | ||||
| 2026-02-17 | 13F | Game Creek Capital, LP | 34.000 | -2,86 | 4.621 | 2,12 | ||||
| 2025-11-14 | 13F | Cubist Systematic Strategies, LLC | Put | 6.700 | -20,24 | 866 | -18,30 | |||
| 2025-11-14 | 13F | Cubist Systematic Strategies, LLC | Call | 7.500 | -25,74 | 970 | -24,00 | |||
| 2026-04-29 | 13F | Klp Kapitalforvaltning As | 26.400 | 2,33 | 5.136 | 46,49 | ||||
| 2026-01-27 | 13F | Evergreen Capital Management Llc | 4.504 | 58,98 | 612 | 67,21 | ||||
| 2026-02-09 | 13F | Harbour Investments, Inc. | 91 | 1,11 | 12 | 9,09 | ||||
| 2026-04-21 | 13F | Vise Technologies, Inc. | 3.478 | 0,00 | 473 | 0,00 | ||||
| 2026-01-30 | 13F | Catalytic Wealth RIA, LLC | 0 | -100,00 | 0 | |||||
| 2026-02-13 | 13F | Prudential Financial Inc | 6.877 | -39,76 | 935 | -36,68 | ||||
| 2026-02-10 | 13F | Godfrey Financial Associates, Inc. | 23 | 3 | ||||||
| 2025-11-13 | 13F | Eisler Capital Management Ltd. | 54.576 | -52,52 | 7.058 | -51,40 | ||||
| 2026-01-15 | 13F | Allspring Global Investments Holdings, LLC | 85.427 | -1,50 | 11.856 | 7,70 | ||||
| 2026-02-06 | 13F | Meiji Yasuda Asset Management Co Ltd. | 2.694 | -1,54 | 366 | 3,68 | ||||
| 2025-11-14 | 13F | Quantessence Capital LLC | 0 | -100,00 | 0 | |||||
| 2026-04-21 | 13F | Pflug Koory, LLC | 70 | 0,00 | 14 | 44,44 | ||||
| 2026-02-11 | 13F | Inceptionr Llc | 3.010 | -20,07 | 409 | -15,84 | ||||
| 2026-02-17 | 13F | Jones Financial Companies Lllp | 9.465 | 2,15 | 1.286 | 10,20 | ||||
| 2026-04-22 | 13F | Portus Wealth Advisors, LLC | 20 | 4 | ||||||
| 2026-02-10 | 13F | CIBC Asset Management Inc | 3.594 | 0,00 | 488 | 5,17 | ||||
| 2026-04-07 | 13F | Signaturefd, Llc | 924 | 5,00 | 180 | 50,42 | ||||
| 2026-02-05 | 13F | Allworth Financial LP | 810 | 10,05 | 110 | 15,79 | ||||
| 2026-02-17 | 13F | Signature Equity Partners, LLC | 11 | 1 | ||||||
| 2026-02-04 | 13F | Ameritas Advisory Services, LLC | 0 | -100,00 | 0 | |||||
| 2026-02-13 | 13F | Hurley Capital, LLC | Put | 5 | 1 | |||||
| 2026-04-15 | 13F | Financial Management Professionals, Inc. | 3 | 0,00 | 1 | |||||
| 2026-04-27 | 13F | V-Square Quantitative Management LLC | 374 | 19,11 | 73 | 71,43 | ||||
| 2026-04-16 | 13F | Toth Financial Advisory Corp | 200 | 0,00 | 39 | 40,74 | ||||
| 2026-02-13 | 13F | Entropy Technologies, LP | 5.450 | 741 | ||||||
| 2026-02-03 | 13F | Ballast, Inc. | 4.173 | 0,00 | 567 | 5,19 | ||||
| 2025-11-13 | 13F | Capital Fund Management S.a. | 0 | -100,00 | 0 | -100,00 | ||||
| 2026-02-10 | 13F | Nomura Asset Management Co Ltd | 500 | 0,00 | 68 | 4,69 | ||||
| 2026-04-16 | 13F | Vaughan Nelson Investment Management, L.p. | 173.964 | -9,49 | 33.845 | 29,57 | ||||
| 2026-02-17 | 13F | Schonfeld Strategic Advisors LLC | 98.821 | 35,21 | 13.431 | 42,15 | ||||
| 2026-02-09 | 13F | Coldstream Capital Management Inc | 2.609 | 7,06 | 355 | 12,38 | ||||
| 2026-02-17 | 13F | Parallax Volatility Advisers, L.P. | Call | 45.000 | 6.116 | |||||
| 2026-02-17 | 13F | Parallax Volatility Advisers, L.P. | Put | 200.000 | 27.182 | |||||
| 2026-04-02 | 13F | Ares Financial Consulting, LLC | 89 | 18 | ||||||
| 2026-02-13 | 13F | Fieldview Capital Management, LLC | 1.662 | 226 | ||||||
| 2026-04-21 | 13F | Econ Financial Services Corp | 0 | -100,00 | 0 | |||||
| 2026-04-30 | 13F | Mv Capital Management, Inc. | 4 | 33,33 | 1 | |||||
| 2026-02-09 | 13F | Waratah Capital Advisors Ltd. | 2.433 | -97,65 | 331 | -97,53 | ||||
| 2026-02-11 | 13F | First American Trust, Fsb | 1.688 | 229 | ||||||
| 2026-02-11 | 13F | Fox Run Management, L.l.c. | 10.037 | 33,84 | 1.364 | 40,76 | ||||
| 2026-04-29 | 13F | Rocky Mountain Advisers, Llc | 290 | 0,00 | 56 | 43,59 | ||||
| 2026-04-22 | 13F | Janney Montgomery Scott LLC | 43.524 | 7,28 | 8 | 60,00 | ||||
| 2026-02-17 | 13F | Westwood Holdings Group Inc | 171.055 | -6,19 | 23.248 | -1,37 | ||||
| 2026-04-20 | 13F | Heritage Wealth Management, Inc. | 0 | -100,00 | 0 | |||||
| 2026-04-28 | 13F | Life Planning Partners, Inc | 6.385 | 0,00 | 1.242 | 43,25 | ||||
| 2026-02-10 | 13F | Mutual Of America Capital Management Llc | 48.853 | -10,17 | 6.640 | -5,56 | ||||
| 2026-02-09 | 13F | Emerald Advisers, Llc | 3.565 | 56,91 | 485 | 65,19 | ||||
| 2026-02-17 | 13F | Citadel Advisors Llc | Call | 214.600 | -14,47 | 29.166 | -10,07 | |||
| 2025-11-14 | 13F | Atom Investors LP | 0 | -100,00 | 0 | |||||
| 2026-02-12 | 13F | Bank Of Montreal /can/ | 63.771 | -11,92 | 8.667 | -7,38 | ||||
| 2026-01-30 | 13F | Archer Investment Corp | 1.286 | 37,98 | 175 | 45,00 | ||||
| 2026-02-17 | 13F | Citadel Advisors Llc | Put | 81.900 | 88,71 | 11.131 | 98,41 | |||
| 2026-02-13 | 13F | Squarepoint Ops LLC | Call | 2.300 | 0,00 | 313 | 5,05 | |||
| 2026-02-17 | 13F | Citadel Advisors Llc | 517.762 | 772,23 | 70.369 | 817,10 | ||||
| 2026-02-05 | 13F | Atria Investments Llc | 2.403 | 50,75 | 327 | 58,25 | ||||
| 2026-04-24 | 13F | UMA Financial Services, Inc. | 8 | 100,00 | 2 | |||||
| 2026-02-10 | 13F | Natixis Advisors, L.p. | 49.839 | 33,38 | 7 | 50,00 | ||||
| 2026-02-13 | 13F | Formula Growth Ltd | 23.000 | 0,00 | 3.126 | 5,11 | ||||
| 2026-04-02 | 13F | Marex Group plc | 0 | 0 | ||||||
| 2026-02-13 | 13F | Smartleaf Asset Management LLC | 494 | 13,82 | 68 | 23,64 | ||||
| 2026-04-27 | 13F | Td Private Client Wealth Llc | 151 | 788,24 | 29 | 1.350,00 | ||||
| 2026-01-29 | 13F | Middleton & Co Inc/ma | 7.450 | 0,00 | 1.013 | 5,09 | ||||
| 2026-02-13 | 13F | Baird Financial Group, Inc. | 217.132 | 72,11 | 29.510 | 80,95 | ||||
| 2026-02-17 | 13F | Wellington Management Group Llp | 603.376 | 82.005 | ||||||
| 2026-02-05 | 13F | DnB Asset Management AS | 7.084 | -36,69 | 963 | -33,47 | ||||
| 2026-02-12 | 13F | Advisors Asset Management, Inc. | 8.384 | -0,98 | 1.139 | 4,11 | ||||
| 2026-01-23 | 13F | Rsm Us Wealth Management Llc | 4.733 | 0,30 | 652 | 6,72 | ||||
| 2026-02-17 | 13F | Graham Capital Management, L.P. | 9.400 | -40,51 | 1.278 | -37,46 | ||||
| 2026-02-04 | 13F | Swiss Life Asset Management Ltd | 5.659 | 4,24 | 769 | 9,70 | ||||
| 2026-02-11 | 13F | Empowered Funds, LLC | 2.997 | -8,66 | 407 | -4,01 | ||||
| 2025-11-14 | 13F | J. Goldman & Co LP | 0 | -100,00 | 0 | -100,00 | ||||
| 2026-02-17 | 13F | D. E. Shaw & Co., Inc. | Put | 10.000 | 0,00 | 1.359 | 5,19 | |||
| 2026-04-23 | 13F | SJS Investment Consulting Inc. | 22 | 15,79 | 4 | 100,00 | ||||
| 2026-04-13 | 13F | Gateway Investment Advisers Llc | 9.680 | -53,65 | 1.883 | -33,65 | ||||
| 2026-05-01 | 13F | Arizona State Retirement System | 32.263 | -0,73 | 6.277 | 42,09 | ||||
| 2026-02-17 | 13F | Northern Trust Corp | 952.167 | -3,00 | 129.409 | 1,99 | ||||
| 2026-02-11 | 13F | Jpmorgan Chase & Co | 331.354 | -58,01 | 45.034 | -55,85 | ||||
| 2026-02-11 | 13F | Jpmorgan Chase & Co | Call | 89.700 | 96,28 | 12.191 | 106,38 | |||
| 2026-02-11 | 13F | Jpmorgan Chase & Co | Put | 89.700 | 96,28 | 12.191 | 106,38 | |||
| 2026-02-11 | 13F | IMA Wealth, Inc. | 7.226 | -1,20 | 982 | 3,92 | ||||
| 2026-04-08 | 13F | Wealth Enhancement Advisory Services, Llc | 8.145 | -49,61 | 1.078 | -56,13 | ||||
| 2026-02-17 | 13F | Voleon Capital Management Lp | 0 | -100,00 | 0 | |||||
| 2026-01-29 | 13F | Ashton Thomas Private Wealth, LLC | 8.911 | -2,01 | 1.211 | 3,06 | ||||
| 2026-04-28 | 13F | SBI Securities Co., Ltd. | 6 | -62,50 | 1 | -50,00 | ||||
| 2026-05-01 | 13F | Citizens Financial Group Inc/ri | 23.530 | -2,09 | 4.578 | 40,14 | ||||
| 2026-01-08 | 13F | Chesapeake Asset Management Llc | 300 | 0,00 | 41 | 5,26 | ||||
| 2026-02-13 | 13F | Cetera Trust Company, N.A | 35 | 0,00 | 5 | 0,00 | ||||
| 2026-04-21 | 13F | E&G Advisors, LP | 0 | -100,00 | 0 | |||||
| 2026-04-22 | 13F | Barnes Dennig Private Wealth Management LLC | 862 | 168 | ||||||
| 2026-02-09 | 13F | Lisanti Capital Growth, LLC | 6.240 | -0,48 | 848 | 4,69 | ||||
| 2026-02-12 | 13F | Johnson Financial Group, Inc. | 151 | 0,00 | 21 | 5,26 | ||||
| 2026-02-09 | 13F | Keating Financial Advisory Services, Inc. | 112 | 15 | ||||||
| 2026-04-09 | 13F | Wedmont Private Capital | 2.177 | 19,75 | 461 | 76,25 | ||||
| 2026-03-12 | 13F/A | Peak6 Llc | Put | 56.000 | 413,76 | 7.611 | 440,10 | |||
| 2026-03-12 | 13F/A | Peak6 Llc | Call | 112.700 | 51,07 | 15.317 | 58,84 | |||
| 2026-05-01 | 13F | Avion Wealth | 12 | 33,33 | 0 | |||||
| 2026-04-15 | 13F | Norden Group Llc | 1.126 | 219 | ||||||
| 2025-11-17 | 13F | Sender Co & Partners, Inc. | 0 | -100,00 | 0 | |||||
| 2026-02-13 | 13F | Aigen Investment Management, Lp | 0 | -100,00 | 0 | -100,00 | ||||
| 2026-04-24 | 13F | Keybank National Association/oh | 2.029 | -11,82 | 395 | 26,28 | ||||
| 2026-02-09 | 13F | Quest Partners LLC | 1.080 | -64,27 | 147 | -62,56 | ||||
| 2026-02-10 | 13F | Goldman Sachs Group Inc | 554.245 | 77,44 | 75.327 | 86,55 | ||||
| 2026-02-03 | 13F | Crossmark Global Holdings, Inc. | 6.990 | 4,78 | 950 | 10,21 | ||||
| 2026-02-11 | 13F | Cerity Partners LLC | 4.246 | 9,89 | 577 | 15,63 | ||||
| 2026-05-01 | 13F | HFM Investment Advisors, LLC | 7 | 0,00 | 1 | |||||
| 2026-02-10 | 13F | Principia Wealth Advisory, LLC | 10 | 11,11 | 1 | 0,00 | ||||
| 2026-04-27 | 13F | Y-Intercept (Hong Kong) Ltd | 18.300 | 24,20 | 3.560 | 77,82 | ||||
| 2026-04-30 | 13F | Hsbc Holdings Plc | 18.341 | 29,03 | 3.525 | 82,12 | ||||
| 2026-02-10 | 13F | Axq Capital, Lp | 7.566 | 1.028 | ||||||
| 2026-01-30 | 13F | Georgetown University | 0 | -100,00 | 0 | |||||
| 2026-01-13 | 13F | Dakota Wealth Management | 14.641 | 23,28 | 1.990 | 29,58 | ||||
| 2026-02-10 | 13F | Lido Advisors, LLC | 1.962 | 20,22 | 256 | 21,43 | ||||
| 2026-02-13 | 13F | Parkside Financial Bank & Trust | 303 | -30,98 | 41 | -26,79 | ||||
| 2026-04-29 | 13F | WPG Advisers, LLC | 18 | 0,00 | 4 | 50,00 | ||||
| 2026-04-30 | 13F | Nuveen, LLC | 230.739 | -0,20 | 44.890 | 42,87 | ||||
| 2026-02-10 | 13F | Rothschild Investment Llc | 33 | 43,48 | 4 | 100,00 | ||||
| 2026-04-08 | 13F | Oliver Luxxe Assets LLC | 24.160 | 1,29 | 4.700 | 45,02 | ||||
| 2025-12-15 | 13F | CTC Alternative Strategies, Ltd. | 0 | -100,00 | 0 | |||||
| 2026-04-16 | 13F | Capital Advisors, Ltd. LLC | 14 | 0,00 | 0 | |||||
| 2026-01-29 | 13F | IMC-Chicago, LLC | Put | 270.800 | 268,94 | 36.804 | 287,90 | |||
| 2026-01-29 | 13F | IMC-Chicago, LLC | Call | 53.200 | -5,67 | 7.230 | -0,82 | |||
| 2026-02-04 | 13F | Virginia Retirement Systems Et Al | 5.499 | 27,91 | 747 | 34,59 | ||||
| 2026-02-11 | 13F | Picton Mahoney Asset Management | 183.573 | 20,94 | 24.949 | 131.210,53 | ||||
| 2026-04-30 | 13F | SkyOak Wealth, LLC | 1.625 | 0,00 | 316 | 43,64 | ||||
| 2026-04-23 | 13F | McMillan Office, Inc. | 83 | 0,00 | 16 | 45,45 | ||||
| 2026-01-30 | 13F | Sigma Planning Corp | 9.685 | -3,63 | 1.316 | 1,23 | ||||
| 2026-02-13 | 13F | Ubs Asset Management Americas Inc | 297.614 | -2,88 | 40.449 | 2,11 | ||||
| 2026-01-30 | 13F | Us Bancorp \de\ | 21.270 | -4,99 | 2.891 | -0,10 | ||||
| 2026-04-07 | 13F | CoreCap Advisors, LLC | 2 | 0,00 | 0 | |||||
| 2026-02-17 | 13F | Hawk Ridge Capital Management Lp | 193.988 | -27,99 | 26.365 | -24,29 | ||||
| 2026-02-09 | 13F | Frazier Financial Advisors, LLC | 17 | 2 | ||||||
| 2026-04-17 | 13F | Defined Wealth Management, Llc | 1.292 | 251 | ||||||
| 2026-02-05 | 13F | Northwestern Mutual Investment Management Company, Llc | 26.263 | 0,05 | 3.569 | 5,19 | ||||
| 2026-02-10 | 13F | Empirical Capital Management, LLC | 37.000 | -26,00 | 5 | -16,67 | ||||
| 2026-02-11 | 13F | Capital International Inc /ca/ | 14.314 | -27,05 | 1.945 | -23,30 | ||||
| 2026-04-28 | 13F | Everence Capital Management Inc | 3.265 | 8,47 | 1 | |||||
| 2026-02-17 | 13F | Quantinno Capital Management LP | 31.807 | 26,83 | 4.323 | 33,35 | ||||
| 2026-04-24 | 13F | Vision Financial Markets Llc | 50 | 0,00 | 10 | 50,00 | ||||
| 2026-04-30 | 13F | Stablepoint Partners, LLC | 3.097 | -3,46 | 603 | 38,39 | ||||
| 2026-02-13 | 13F | Gallo Partners, LP | 23.684 | -22,45 | 3.219 | -18,49 | ||||
| 2026-02-12 | 13F | Tocqueville Asset Management L.p. | 93.107 | 0,00 | 12.654 | 5,14 | ||||
| 2026-02-10 | 13F | Cercano Management LLC | Put | 0 | -100,00 | 0 | -100,00 | |||
| 2026-02-11 | 13F | SOUTH STATE Corp | 15 | 0,00 | 2 | 100,00 | ||||
| 2026-02-17 | 13F | SageView Advisory Group, LLC | 3.883 | -8,89 | 528 | -4,18 | ||||
| 2026-02-12 | 13F | Callan Family Office, LLC | 1.542 | 210 | ||||||
| 2026-02-05 | 13F | Tucker Asset Management Llc | 37 | 5 | ||||||
| 2025-11-14 | 13F | Alight Capital Management LP | 0 | -100,00 | 0 | |||||
| 2026-02-17 | 13F | Concentric Capital Strategies, LP | 0 | -100,00 | 0 | |||||
| 2026-02-11 | 13F | Twin Tree Management, LP | 0 | -100,00 | 0 | -100,00 |