Grundlæggende statistik
| Institutionelle ejere | 358 total, 358 long only, 0 short only, 0 long/short - change of 2,87% MRQ |
| Gennemsnitlig porteføljeallokering | 0.4980 % - change of -24,41% MRQ |
| Institutionelle aktier (lange) | 86.236.585 (ex 13D/G) - change of 1,76MM shares 2,08% MRQ |
| Institutionel værdi (lang) | $ 3.155.490 USD ($1000) |
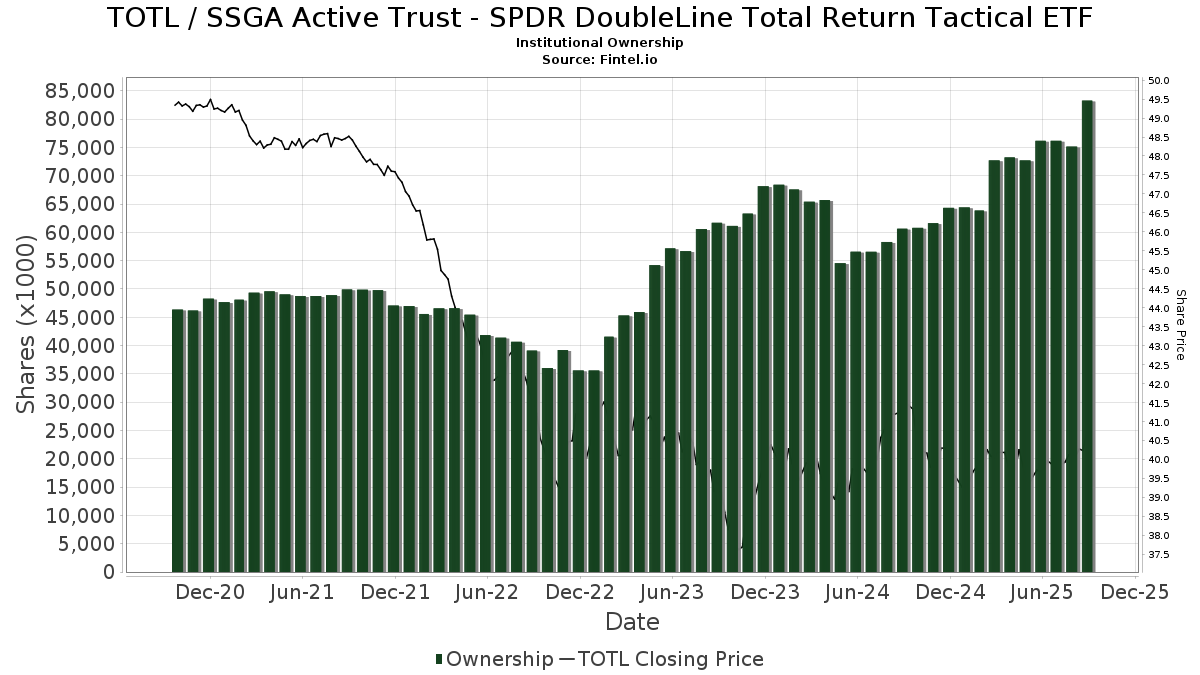
Institutionelt ejerskab og aktionærer
SPDR Series Trust - State Street DoubleLine Total Return Tactical ETF (US:TOTL) har 358 institutionelle ejere og aktionærer, der har indsendt 13D/G- eller 13F-formularer til Securities Exchange Commission (SEC). Disse institutioner har i alt 86,236,585 aktier. Største aktionærer omfatter Fmr Llc, Morgan Stanley, Signature Estate & Investment Advisors Llc, Cwm, Llc, LPL Financial LLC, Envestnet Asset Management Inc, Tectonic Advisors Llc, UBS Group AG, Bank Of America Corp /de/, and Advisor Group Holdings, Inc. .
SPDR Series Trust - State Street DoubleLine Total Return Tactical ETF (ARCA:TOTL) institutionel ejerskabsstruktur viser aktuelle positioner i virksomheden efter institutioner og fonde, samt seneste ændringer i positionsstørrelse. Større aktionærer kan omfatte individuelle investorer, investeringsforeninger, hedgefonde eller institutioner. Skema 13D angiver, at investoren besidder (eller besidder) mere end 5 % af virksomheden og har til hensigt (eller har til hensigt at) aktivt at forfølge en ændring i forretningsstrategi. Skema 13G indikerer en passiv investering på over 5%.
The share price as of April 24, 2026 is 39,92 / share. Previously, on April 28, 2025, the share price was 40,14 / share. This represents a decline of 0,55% over that period.
Fondens stemningsscore
Fund Sentiment Score (fka Ownership Accumulation Score) finder de aktier, der bliver mest købt af fonde. Det er resultatet af en sofistikeret, multi-faktor kvantitativ model, der identificerer virksomheder med de højeste niveauer af institutionel akkumulering. Scoringsmodellen bruger en kombination af den samlede stigning i oplyste ejere, ændringerne i porteføljeallokeringer i disse ejere og andre målinger. Tallet går fra 0 til 100, hvor højere tal indikerer et højere niveau af akkumulering for sine jævnaldrende, og 50 er gennemsnittet.
Opdateringsfrekvens: Dagligt
Se Ownership Explorer, som giver en liste over højest rangerende virksomheder.
AI+ Ask Fintel’s AI assistant about SPDR Series Trust - State Street DoubleLine Total Return Tactical ETF.
Select a question to share a public post with an AI-crafted answer.
Thinking of good questions…
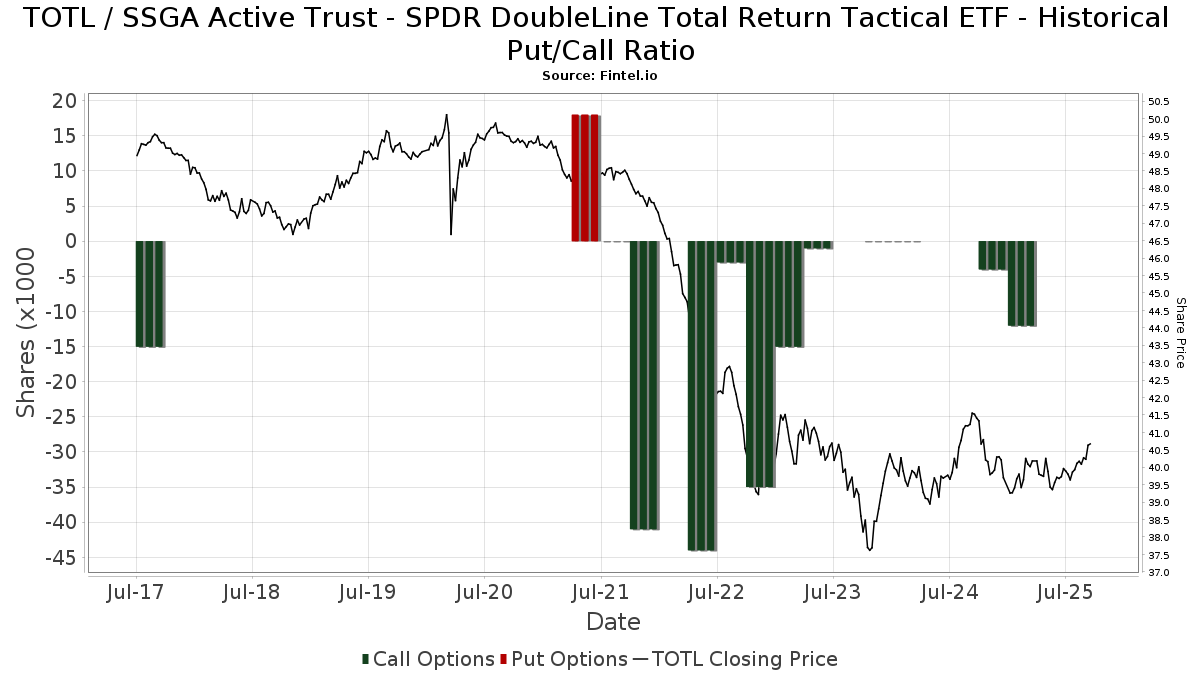
Institutionel Put/Call-forhold
Ud over at indberette standardaktie- og gældsudstedelser skal institutter med mere end 100 mill. aktiver under forvaltning også oplyse deres put- og call-optionsbeholdninger. Da salgsoptioner generelt indikerer negativ stemning, og købsoptioner indikerer positiv stemning, kan vi få en fornemmelse af den overordnede institutionelle stemning ved at plotte forholdet mellem put og kald. Diagrammet til højre viser det historiske put/call-forhold for dette instrument.
Brug af Put/Call Ratio som en indikator for investorernes stemning overvinder en af de vigtigste mangler ved at bruge totalt institutionelt ejerskab, som er, at en betydelig mængde af aktiver under forvaltning investeres passivt for at spore indekser. Passivt forvaltede fonde køber typisk ikke optioner, så indikatoren for put/call-forholdet følger mere nøje følelsen af aktivt forvaltede fonde.
13D/G-arkivering
Vi præsenterer 13D/G ansøgninger separat fra 13F ansøgninger på grund af den forskellige behandling af SEC. 13D/G-ansøgninger kan indgives af grupper af investorer (med én ledende), hvorimod 13F-ansøgninger ikke kan. Dette resulterer i situationer, hvor en investor kan indsende en 13D/G, der rapporterer én værdi for de samlede aktier (der repræsenterer alle de aktier, der ejes af investorgruppen), men derefter indsender en 13F, der rapporterer en anden værdi for de samlede aktier (der udelukkende repræsenterer deres egne) ejendomsret). Det betyder, at aktieejerskab af 13D/G-arkiver og 13F-arkiveringer ofte ikke er direkte sammenlignelige, så vi præsenterer dem separat.
Bemærk: Fra den 16. maj 2021 viser vi ikke længere ejere, der ikke har indsendt en 13D/G inden for det seneste år. Tidligere viste vi den fulde historie af 13D/G-arkiver. Generelt skal enheder, der er forpligtet til at indgive 13D/G-ansøgninger, indgive mindst årligt, før de indsender en afsluttende ansøgning. Dog forlader fonde nogle gange positioner uden at indsende en afsluttende ansøgning (dvs. de afvikler), så visning af den fulde historie resulterede nogle gange i forvirring om det nuværende ejerskab. For at undgå forvirring viser vi nu kun 'aktuelle' ejere - det vil sige - ejere, der har anmeldt inden for det seneste år.
Upgrade to unlock premium data.
13F og NPORT arkivering
Detaljer om 13F-arkivering er gratis. Detaljer om NP-ansøgninger kræver et premium-medlemskab. Grønne rækker angiver nye positioner. Røde rækker angiver lukkede positioner. Klik på linket ikon for at se den fulde transaktionshistorik.
Opgrader
for at låse premium-data op og eksportere til Excel ![]() .
.
| Fil dato | Kilde | Investor | Type | Gennemsnitlig pris (Øst) |
Aktier | Δ Aktier (%) |
Rapporteret Værdi ($1000) |
Δ Værdi (%) |
Port Alloc (%) |
|
|---|---|---|---|---|---|---|---|---|---|---|
| 2026-01-30 | 13F | Strategic Blueprint, LLC | 0 | -100,00 | 0 | |||||
| 2026-02-12 | 13F | Financial Engines Advisors L.L.C. | 7.115 | -7,81 | 286 | -8,63 | ||||
| 2026-02-17 | 13F | RMB Capital Management, LLC | 233.521 | -4,71 | 9.399 | -5,46 | ||||
| 2026-01-20 | 13F | Aspiriant, Llc | 11.272 | 454 | ||||||
| 2026-02-02 | 13F | Heritage Financial Services, LLC | 10.521 | 0,00 | 423 | -0,70 | ||||
| 2026-02-13 | 13F | First National Bank Of Omaha | 9.893 | 399 | ||||||
| 2025-11-14 | 13F | Eqis Capital Management, Inc. | 0 | -100,00 | 0 | |||||
| 2026-01-21 | 13F | Jefferson Bridge Capital, LLC | 26.422 | 1.063 | ||||||
| 2026-02-03 | 13F | Anfield Capital Management, LLC | 404 | 0,00 | 16 | 0,00 | ||||
| 2026-04-23 | 13F | Signature Securities Group Corporation | 14.044 | -2,33 | 558 | -3,63 | ||||
| 2026-04-17 | 13F | Tectonic Advisors Llc | 2.540.874 | 3,62 | 100.949 | 2,28 | ||||
| 2026-04-22 | 13F | Pinnacle Bancorp, Inc. | 1.583 | 0,00 | 63 | -1,59 | ||||
| 2025-11-14 | 13F | Citadel Advisors Llc | 0 | -100,00 | 0 | -100,00 | ||||
| 2026-02-19 | 13F | CI Private Wealth, LLC | 1.007.579 | 63,67 | 40.090 | 60,52 | ||||
| 2026-02-04 | 13F | Heritage Wealth Management, Inc. /CA/ | 70.926 | 6,09 | 2.855 | 5,24 | ||||
| 2026-04-22 | 13F | Motco | 26.556 | -1,01 | 1.055 | -2,22 | ||||
| 2026-01-23 | 13F | Private Wealth Management Group, LLC | 0 | -100,00 | 0 | |||||
| 2026-02-10 | 13F | Verus Capital Partners, Llc | 5.157 | -31,41 | 208 | -32,13 | ||||
| 2026-04-10 | 13F | Marshall Financial Group LLC | 36.456 | 2,13 | 1.448 | 0,84 | ||||
| 2026-04-21 | 13F | ADG Wealth Management Group, LLC | 96.976 | 1.575,18 | 4.410 | 1.792,70 | ||||
| 2026-02-17 | 13F | Laird Norton Trust Company, Llc | 12.787 | 515 | ||||||
| 2026-02-12 | 13F | Litman Gregory Asset Management LLC | 175.958 | -8,81 | 7.082 | -9,53 | ||||
| 2026-01-12 | 13F | KWB Wealth | 0 | -100,00 | 0 | |||||
| 2026-04-09 | 13F | Pacifica Partners Inc. | 885 | -18,88 | 35 | -18,60 | ||||
| 2026-01-21 | 13F | Woodmont Investment Counsel Llc | 378.080 | 15.218 | ||||||
| 2026-02-12 | 13F | Jane Street Group, Llc | 41.087 | 1.654 | ||||||
| 2026-02-13 | 13F | SYM FINANCIAL Corp | 7.743 | 0,72 | 312 | 0,00 | ||||
| 2026-04-13 | 13F | Hudson Capital Management LLC | 5.520 | 219 | ||||||
| 2026-02-04 | 13F | Atlantic Union Bankshares Corp | 274 | 705,88 | 11 | 1.000,00 | ||||
| 2026-04-21 | 13F | Paradigm Financial Partners, Llc | 0 | -100,00 | 0 | |||||
| 2026-02-12 | 13F | Brinker Capital Investments, LLC | 98.177 | -22,27 | 3.952 | -22,89 | ||||
| 2026-04-07 | 13F | U.S. Capital Wealth Advisors, LLC | 7.367 | -8,12 | 293 | -9,32 | ||||
| 2026-01-29 | 13F | Concurrent Investment Advisors, LLC | 582.684 | 31,12 | 23.453 | 30,09 | ||||
| 2026-01-28 | 13F | Bedel Financial Consulting, Inc. | 228.099 | 9,66 | 9.181 | 8,78 | ||||
| 2026-04-03 | 13F | Investors Research Corp | 822 | 0,00 | 33 | -3,03 | ||||
| 2026-02-11 | 13F | Napier Financial, LLC | 112.603 | 4.532 | ||||||
| 2026-04-24 | 13F | Essex Financial Services, Inc. | 6.870 | 0,73 | 273 | -0,73 | ||||
| 2026-02-05 | 13F | Allworth Financial LP | 4.186 | 1,85 | 169 | 1,20 | ||||
| 2026-02-17 | 13F | Royal Bank Of Canada | 1.174.085 | 13,13 | 47.257 | 12,24 | ||||
| 2026-02-11 | 13F | Wealthgarden F.s. Llc | 5.851 | 236 | ||||||
| 2026-02-13 | 13F | Smartleaf Asset Management LLC | 92.277 | 3,71 | 3.722 | 3,10 | ||||
| 2026-04-15 | 13F | Northbridge Financial Group, Llc | 9.593 | -6,31 | 382 | -7,52 | ||||
| 2026-01-26 | 13F | Private Trust Co Na | 19.488 | 11,01 | 784 | 10,11 | ||||
| 2026-04-14 | 13F | Austin Wealth Management, LLC | 262.695 | -32,76 | 10.408 | -33,89 | ||||
| 2026-04-08 | 13F | Wealth Enhancement Trust Services, Inc. | 23.179 | -0,78 | 921 | -2,13 | ||||
| 2026-02-13 | 13F | Mml Investors Services, Llc | 13.200 | -26,81 | 531 | -27,36 | ||||
| 2026-01-28 | 13F | HB Wealth Management, LLC | 108.013 | -10,64 | 4.348 | -11,34 | ||||
| 2025-11-14 | 13F | Virtu Financial LLC | 0 | -100,00 | 0 | |||||
| 2026-02-12 | 13F | Hollencrest Capital Management | 41.620 | -3,22 | 1.675 | -3,96 | ||||
| 2026-02-17 | 13F | Creative Planning | 17.991 | -9,39 | 724 | -10,06 | ||||
| 2026-02-13 | 13F | Mariner, LLC | 243.649 | 23,51 | 9.807 | 22,53 | ||||
| 2026-02-17 | 13F | Tower Research Capital LLC (TRC) | 45 | 2 | ||||||
| 2026-01-20 | 13F | Stratos Wealth Partners, LTD. | 6.912 | 278 | ||||||
| 2026-02-10 | 13F | Savant Capital, LLC | 6.558 | -13,80 | 264 | -14,61 | ||||
| 2026-02-13 | 13F | Arkadios Wealth Advisors | 17.811 | 1,63 | 717 | 0,85 | ||||
| 2026-01-29 | 13F | Sanctuary Advisors, LLC | 57.145 | -7,30 | 2.300 | -8,04 | ||||
| 2025-11-12 | 13F | Cobblestone Capital Advisors Llc /ny/ | 29.568 | -5,61 | 1.200 | -4,54 | ||||
| 2026-01-27 | 13F | BankPlus Trust Department | 28 | 0,00 | 1 | 0,00 | ||||
| 2026-04-23 | 13F | J.w. Cole Advisors, Inc. | 6.349 | 252 | ||||||
| 2026-02-04 | 13F | Fourth Dimension Wealth, LLC | 1.242 | -0,08 | 50 | -2,00 | ||||
| 2026-02-13 | 13F | Jacobi Capital Management LLC | 55.973 | -0,76 | 2.253 | -1,57 | ||||
| 2025-11-14 | 13F | Wood Tarver Financial Group, LLC | 0 | -100,00 | 0 | |||||
| 2026-02-13 | 13F | Capital Financial Group Inc\co\ /adv | 79.205 | 3.188 | ||||||
| 2026-02-17 | 13F | Perennial Investment Advisors, LLC | 21.606 | -9,42 | 870 | -10,13 | ||||
| 2026-02-05 | 13F | 1620 Investment Advisors, Inc. | 39.087 | -7,73 | 1.573 | -8,44 | ||||
| 2026-02-06 | 13F | Tortoise Investment Management, LLC | 0 | -100,00 | 0 | |||||
| 2026-02-11 | 13F | Clifford Swan Investment Counsel Llc | 7.675 | 0,00 | 309 | -0,96 | ||||
| 2026-02-17 | 13F | IHT Wealth Management, LLC | 6.102 | 18,44 | 246 | 17,22 | ||||
| 2026-04-15 | 13F | Merit Financial Group, LLC | 24.064 | -44,80 | 956 | -45,50 | ||||
| 2026-04-15 | 13F | Weatherly Asset Management L. P. | 656.496 | 4,19 | 26.083 | 2,84 | ||||
| 2026-02-02 | 13F | Dudley Capital Management, Llc | 16.265 | -31,95 | 655 | -32,51 | ||||
| 2026-04-13 | 13F | LexAurum Advisors, LLC | 9.583 | -0,52 | 381 | -2,56 | ||||
| 2025-11-12 | 13F | NewSquare Capital LLC | 0 | -100,00 | 0 | |||||
| 2026-02-13 | 13F | Advyzon Investment Management, LLC | 50.125 | 31,61 | 2.018 | 30,55 | ||||
| 2026-01-29 | 13F | M Wealth Management, LLC | 274.389 | 0,38 | 11.044 | -0,41 | ||||
| 2026-01-30 | 13F | SK Wealth Management, LLC | 37.077 | -46,17 | 1.494 | -46,36 | ||||
| 2026-02-13 | 13F | Motiv8 Investments LLC | 1.338 | 0 | ||||||
| 2025-11-12 | 13F | Park Square Financial Group, LLC | 0 | -100,00 | 0 | |||||
| 2026-04-24 | 13F | United Community Bank | 1.000 | 40 | ||||||
| 2026-02-10 | 13F | Calton & Associates, Inc. | 13.969 | 0,63 | 562 | -0,18 | ||||
| 2026-02-10 | 13F | Root Financial Partners, LLC | 0 | -100,00 | 0 | |||||
| 2026-02-17 | 13F | Jones Financial Companies Lllp | 128.587 | 29,61 | 5.176 | 28,76 | ||||
| 2026-04-24 | 13F | Bellevue Asset Management, Llc | 90 | -97,52 | 4 | |||||
| 2026-02-17 | 13F | Aqr Capital Management Llc | 404.543 | 5,63 | 16.283 | 4,80 | ||||
| 2026-04-15 | 13F | DAVENPORT & Co LLC | 11.742 | 19,29 | 467 | 17,68 | ||||
| 2026-01-16 | 13F | Worth Financial Advisory Group, LLC | 31.029 | 1.249 | ||||||
| 2026-02-10 | 13F | Rothschild Investment Llc | 85 | 0,00 | 3 | 0,00 | ||||
| 2026-02-09 | 13F | LongView Asset Management LLC | 5.361 | 0,22 | 216 | -0,92 | ||||
| 2026-01-23 | 13F | Assetmark, Inc | 136.252 | 46,56 | 5.484 | 45,43 | ||||
| 2026-02-04 | 13F | LRI Investments, LLC | 66 | 0,00 | 3 | 0,00 | ||||
| 2026-04-15 | 13F | Signature Estate & Investment Advisors Llc | 5.644.596 | 3,74 | 224.260 | 2,40 | ||||
| 2026-02-17 | 13F | Private Advisor Group, LLC | 266.951 | 14,40 | 10.745 | 13,49 | ||||
| 2026-02-12 | 13F | Commonwealth Equity Services, Llc | 113.157 | 18,14 | 4.555 | 151.700,00 | ||||
| 2026-04-15 | 13F | Valley National Advisers Inc | 4.508 | -3,72 | 0 | |||||
| 2026-01-21 | 13F | Sound Income Strategies, LLC | 132 | 5 | ||||||
| 2026-01-30 | 13F | Citizens Financial Group Inc/ri | 10.397 | 0,49 | 418 | -0,24 | ||||
| 2026-04-17 | 13F | Webster Bank, N. A. | 30.513 | 2,35 | 1.212 | 1,08 | ||||
| 2026-01-30 | 13F | Us Bancorp \de\ | 1.688 | 2,37 | 68 | 1,52 | ||||
| 2026-02-17 | 13F | Claro Advisors LLC | 0 | -100,00 | 0 | |||||
| 2026-04-16 | 13F | Johnson Bixby & Associates, LLC | 86.521 | -14,41 | 3.437 | -15,51 | ||||
| 2026-04-09 | 13F | McNamara Financial Services, Inc. | 15.314 | 13,34 | 608 | 11,97 | ||||
| 2026-01-26 | 13F | AE Wealth Management LLC | 10.667 | 3.491,58 | 429 | 3.475,00 | ||||
| 2026-01-26 | 13F | Cwm, Llc | 4.740.178 | 10,67 | 191 | 9,83 | ||||
| 2026-02-05 | 13F | BlueChip Wealth Advisors LLC | 20.524 | 164,11 | 826 | 162,22 | ||||
| 2026-01-26 | 13F | Northwest Capital Management Inc | 3.672 | 0,00 | 148 | -0,68 | ||||
| 2026-02-17 | 13F | Gladstone Institutional Advisory LLC | 9.761 | 393 | ||||||
| 2025-11-12 | 13F | Transce3nd, LLC | 0 | -100,00 | 0 | |||||
| 2026-04-15 | 13F | Lighthouse Financial Services Inc /adv | 506.805 | 4,16 | 20.216 | 3,23 | ||||
| 2026-02-05 | 13F | AlphaCore Capital LLC | 110.770 | 6,12 | 4.459 | 5,29 | ||||
| 2026-02-05 | 13F | Western Wealth Management, LLC | 17.049 | 8,80 | 686 | 8,03 | ||||
| 2026-02-18 | 13F | Financial Advisory Service, Inc. | 421.309 | 10,75 | 16.958 | 9,87 | ||||
| 2026-02-17 | 13F | Ballast Financial Advisors LLC | 10.771 | 434 | ||||||
| 2026-04-24 | 13F | Capital Asset Advisory Services LLC | 46.070 | -16,32 | 1.843 | -17,03 | ||||
| 2026-02-11 | 13F | MCF Advisors LLC | 4.950 | 1,87 | 199 | 1,02 | ||||
| 2026-04-13 | 13F | John W. Brooker & Co., CPAs | 73.066 | -3,77 | 2.903 | -5,04 | ||||
| 2026-04-21 | 13F | Trilogy Capital Inc. | 18.115 | 0,02 | 720 | -1,24 | ||||
| 2026-02-13 | 13F | Citigroup Inc | 1.707 | 0,00 | 69 | -1,45 | ||||
| 2026-02-17 | 13F | Fmr Llc | 13.819.781 | 0,02 | 556.246 | -0,77 | ||||
| 2026-02-10 | 13F | Envestnet Asset Management Inc | 3.748.797 | -1,63 | 150.889 | -2,40 | ||||
| 2026-02-14 | 13F | Rockefeller Capital Management L.P. | 41.932 | 13,09 | 1.688 | 12,17 | ||||
| 2025-11-14 | 13F | Wetherby Asset Management Inc | 12.787 | 0,00 | 519 | 1,17 | ||||
| 2026-02-17 | 13F | Raymond James Financial Inc | 635.691 | 0,91 | 25.587 | 0,11 | ||||
| 2026-04-15 | 13F | ARS Wealth Advisors Group, LLC | 50.253 | 1.997 | ||||||
| 2026-02-13 | 13F | Ariadne Wealth Management, LP | 42.334 | 111,92 | 1.712 | 112,02 | ||||
| 2026-02-05 | 13F | Atria Investments Llc | 8.443 | 1,00 | 340 | 0,00 | ||||
| 2026-02-13 | 13F | Williams Jones Wealth Management, LLC. | 13.350 | -0,19 | 537 | -0,92 | ||||
| 2026-02-17 | 13F | Advisor Group Holdings, Inc. | 1.791.611 | -2,01 | 72.118 | -2,70 | ||||
| 2026-02-06 | 13F | HighTower Advisors, LLC | 668.143 | 1,76 | 26.893 | 0,96 | ||||
| 2026-02-13 | 13F | Golden State Wealth Management, LLC | 68 | 0,00 | 3 | 0,00 | ||||
| 2026-02-12 | 13F | Alaethes Wealth LLC | 13.188 | 21,36 | 531 | 20,45 | ||||
| 2026-02-12 | 13F | Summit Financial, LLC | 8.878 | 357 | ||||||
| 2026-04-24 | 13F | Patten Group, Inc. | 7.494 | 1,75 | 298 | 0,34 | ||||
| 2026-04-07 | 13F | Eastern Bank | 2.635 | 0,00 | 105 | -1,89 | ||||
| 2026-04-10 | 13F | DKM Wealth Management, Inc. | 6.076 | 0,00 | 241 | -1,23 | ||||
| 2026-04-22 | 13F | Continuum Advisory, LLC | 8.814 | 0,28 | 350 | -0,85 | ||||
| 2026-02-10 | 13F | Waterloo Capital, L.P. | 8.399 | -5,12 | 338 | -5,85 | ||||
| 2026-02-10 | 13F | Lido Advisors, LLC | 82.165 | 6,22 | 3.320 | 5,77 | ||||
| 2026-01-28 | 13F | Cornerstone Advisory, LLC | 8.636 | 348 | ||||||
| 2026-01-23 | 13F | Peak Financial Management, Inc. | 33.530 | -4,39 | 1.350 | -5,13 | ||||
| 2026-04-17 | 13F | Paragon Capital Management Inc | 96.608 | -3,18 | 3.838 | -4,43 | ||||
| 2026-02-12 | 13F | Great Valley Advisor Group, Inc. | 34.975 | -3,09 | 1.408 | -3,89 | ||||
| 2026-02-13 | 13F | Colony Group, LLC | 356.828 | 6,01 | 14.344 | 5,05 | ||||
| 2026-02-10 | 13F | Beckerman Institutional, LLC | 16.442 | -1,23 | 662 | -2,07 | ||||
| 2026-02-04 | 13F | Money Concepts Capital Corp | 6.907 | 5,82 | 278 | 5,30 | ||||
| 2026-02-09 | 13F | Unified Investment Management | 15.845 | 6,02 | 638 | 5,12 | ||||
| 2025-11-14 | 13F | SRS Capital Advisors, Inc. | 0 | -100,00 | 0 | |||||
| 2026-02-10 | 13F | Cherry Tree Wealth Management, LLC | 8.092 | 14,10 | 326 | 13,24 | ||||
| 2026-02-11 | 13F | Cerity Partners LLC | 116.996 | 24,58 | 4.709 | 23,60 | ||||
| 2026-02-17 | 13F | Bitterroot Capital Advisors Llc | 10.059 | 405 | ||||||
| 2026-02-17 | 13F | Redwood Park Advisors LLC | 90.061 | 11,38 | 3.625 | 10,49 | ||||
| 2026-02-13 | 13F | Transamerica Financial Advisors, Inc. | 109.312 | -3,84 | 4.400 | -4,60 | ||||
| 2026-02-11 | 13F | Aufman Associates Inc | 7.725 | 3,40 | 311 | 2,31 | ||||
| 2026-04-10 | 13F | Abound Wealth Management | 0 | -100,00 | 0 | |||||
| 2026-02-09 | 13F | Summit Asset Management, LLC | 108.826 | -35,62 | 4.380 | -36,12 | ||||
| 2026-01-29 | 13F | Quest 10 Wealth Builders, Inc. | 113 | 0,00 | 5 | 0,00 | ||||
| 2026-04-23 | 13F | Intrua Financial, LLC | 0 | -100,00 | 0 | |||||
| 2026-01-29 | 13F | Comerica Bank | 79.507 | -12,61 | 3.200 | -13,28 | ||||
| 2026-02-12 | 13F | Saiph Capital, LLC | 0 | -100,00 | 0 | |||||
| 2026-01-20 | 13F | Ethos Financial Group, LLC | 120.055 | 99,79 | 4.832 | 98,28 | ||||
| 2026-04-13 | 13F | Bank of New Hampshire | 43.041 | 1.710 | ||||||
| 2026-02-17 | 13F | SageView Advisory Group, LLC | 2.090 | 84 | ||||||
| 2026-04-08 | 13F | Sharkey, Howes & Javer | 153.949 | -32,89 | 6.116 | -33,76 | ||||
| 2026-04-17 | 13F | Cornell Pochily Investment Advisors, Inc. | 8.829 | -8,22 | 351 | -9,56 | ||||
| 2026-02-13 | 13F | Visionary Wealth Advisors | 131.778 | 28,42 | 5.304 | 27,41 | ||||
| 2026-04-22 | 13F | Janney Montgomery Scott LLC | 956.335 | 213,83 | 38 | 208,33 | ||||
| 2026-02-06 | 13F | GPS Wealth Strategies Group, LLC | 312 | -87,79 | 13 | -88,35 | ||||
| 2026-02-06 | 13F | New Millennium Group LLC | 920 | -6,03 | 37 | -5,13 | ||||
| 2026-04-23 | 13F | Oppenheimer & Co Inc | 10.350 | -2,18 | 411 | -3,29 | ||||
| 2025-11-14 | 13F | Flow Traders U.s. Llc | 0 | -100,00 | 0 | |||||
| 2025-11-14 | 13F | Sofos Investments, Inc. | 0 | -100,00 | 0 | |||||
| 2026-02-04 | 13F | Pensionmark Financial Group, Llc | 10.127 | 72 | ||||||
| 2026-01-23 | 13F | Lunt Capital Management, Inc. | 108.057 | -2,42 | 4.349 | -3,18 | ||||
| 2026-02-10 | 13F | Vista Private Wealth Partners. LLC | 397.961 | 0,00 | 15.962 | 0,00 | ||||
| 2026-02-17 | 13F | Equitable Holdings, Inc. | 27.932 | -24,69 | 1.124 | -25,27 | ||||
| 2025-10-27 | 13F | Exencial Wealth Advisors, Llc | 0 | -100,00 | 0 | |||||
| 2026-02-17 | 13F | Two Sigma Securities, Llc | 6.489 | 261 | ||||||
| 2026-04-13 | 13F | Pettinga Financial Advisors, LLC | 5.738 | 228 | ||||||
| 2026-02-17 | 13F | Hilltop Holdings Inc. | 6.459 | -14,89 | 260 | -15,64 | ||||
| 2026-04-13 | 13F | Mather Group, Llc. | 2.134 | 85 | ||||||
| 2026-02-09 | 13F | Hartland & Co., LLC | 13.442 | 9,64 | 541 | 8,85 | ||||
| 2026-02-13 | 13F | Centaurus Financial, Inc. | 2.588 | 0 | ||||||
| 2026-01-27 | 13F | PFG Advisors | 17.385 | 8,55 | 700 | 7,70 | ||||
| 2025-11-14 | 13F | WNY Asset Management, LLC | 9.716 | -28,82 | 394 | -27,97 | ||||
| 2026-02-18 | 13F | Beacon Pointe Advisors, LLC | 203.223 | 173,53 | 8.180 | 171,37 | ||||
| 2026-02-05 | 13F | Financial Strategies Group, Inc. | 7.815 | -0,66 | 315 | -0,63 | ||||
| 2026-02-12 | 13F | Steward Partners Investment Advisory, Llc | 323.183 | 3,64 | 13.008 | 2,83 | ||||
| 2026-02-06 | 13F | Axxcess Wealth Management, Llc | 77.988 | 2,16 | 3.139 | 1,36 | ||||
| 2026-02-12 | 13F | Bank Of Montreal /can/ | 535 | 0,00 | 22 | 0,00 | ||||
| 2026-01-26 | 13F | PFG Investments, LLC | 31.644 | 2,44 | 1.274 | 1,60 | ||||
| 2026-01-28 | 13F | Kingswood Wealth Advisors, Llc | 10.800 | 0,00 | 435 | -0,91 | ||||
| 2025-11-12 | 13F | Level Four Advisory Services, Llc | 0 | -100,00 | 0 | |||||
| 2026-01-26 | 13F | Valmark Advisers, Inc. | 21.012 | 17,23 | 846 | 16,23 | ||||
| 2026-01-28 | 13F | Chicago Partners Investment Group LLC | 14.406 | 1,31 | 580 | 0,00 | ||||
| 2026-02-10 | 13F | Tidemark, LLC | 921 | 0,00 | 37 | 0,00 | ||||
| 2026-02-09 | 13F | Diversified Portfolios, Inc. | 175.789 | 4,27 | 7.076 | 3,45 | ||||
| 2026-04-13 | 13F | Bouchey Financial Group Ltd | 35.389 | -1,04 | 1.408 | -2,15 | ||||
| 2026-02-06 | 13F | Pnc Financial Services Group, Inc. | 3.283 | -16,53 | 132 | -16,98 | ||||
| 2026-04-16 | 13F | Blue Zone Wealth Advisors, LLC | 11.963 | 2,12 | 475 | 0,85 | ||||
| 2026-02-02 | 13F | Sachetta, LLC | 20.355 | -4,12 | 819 | -4,88 | ||||
| 2026-04-21 | 13F | GHP Investment Advisors, Inc. | 1.109 | 121,80 | 44 | 120,00 | ||||
| 2026-04-08 | 13F | Wealth Enhancement Advisory Services, Llc | 1.202.762 | -43,20 | 47.702 | -44,14 | ||||
| 2026-01-23 | 13F | Westside Investment Management, Inc. | 4.800 | 0,00 | 193 | -0,52 | ||||
| 2026-04-07 | 13F | Howard Financial Services, Ltd. | 536.169 | 1,91 | 21.302 | 0,60 | ||||
| 2026-02-06 | 13F | Bare Financial Services, Inc | 0 | -100,00 | 0 | |||||
| 2026-04-17 | 13F/A | Founders Financial Securities Llc | 14.934 | -6,49 | 594 | -7,48 | ||||
| 2026-04-21 | 13F | Pinnacle Wealth Management Advisory Group, LLC | 337.663 | 8,36 | 13.415 | 6,96 | ||||
| 2026-04-10 | 13F | Finivi Inc. | 264.473 | 14,64 | 10.508 | 13,16 | ||||
| 2026-01-27 | 13F | Greatmark Investment Partners, Inc. | 23.975 | 3,01 | 965 | 2,12 | ||||
| 2026-02-13 | 13F | Aptus Capital Advisors, LLC | 917 | 0,00 | 37 | -2,70 | ||||
| 2026-02-17 | 13F | Quantinno Capital Management LP | 5.257 | 212 | ||||||
| 2026-02-18 | 13F | Onyx Bridge Wealth Group LLC | 0 | -100,00 | 0 | |||||
| 2026-02-13 | 13F | Bay Colony Advisory Group, Inc d/b/a Bay Colony Advisors | 0 | -100,00 | 0 | -100,00 | ||||
| 2026-02-17 | 13F | Asset One Wealth Management LLC | 12.443 | 499 | ||||||
| 2026-02-11 | 13F | Symphony Financial, Ltd. Co. | 21.052 | 131,98 | 849 | 131,06 | ||||
| 2026-04-08 | 13F | Spinnaker Investment Group, LLC | 10.501 | -39,96 | 417 | -40,68 | ||||
| 2026-02-03 | 13F | Koshinski Asset Management, Inc. | 118.131 | -47,84 | 4.755 | -48,26 | ||||
| 2026-01-08 | 13F | Signet Financial Management, Llc | 6.296 | 16,51 | 253 | 15,53 | ||||
| 2026-02-17 | 13F | North Capital, Inc. | 0 | -100,00 | 0 | |||||
| 2026-04-22 | 13F | Vicus Capital | 319.644 | 5,55 | 12.699 | 4,18 | ||||
| 2026-01-26 | 13F | Northwest Financial Advisors | 0 | -100,00 | 0 | |||||
| 2026-01-26 | 13F | Consolidated Portfolio Review Corp | 0 | -100,00 | 0 | -100,00 | ||||
| 2026-04-17 | 13F | PMG Wealth Management, Inc. | 7.850 | -93,38 | 311 | -93,51 | ||||
| 2026-02-26 | 13F | TD Capital Management LLC | 130 | 2,36 | 5 | 0,00 | ||||
| 2026-02-04 | 13F | First Foundation Advisors | 26.036 | 0,00 | 1.048 | -0,85 | ||||
| 2026-01-21 | 13F | Newbridge Financial Services Group, Inc. | 2.955 | 1,86 | 119 | 0,85 | ||||
| 2026-01-22 | 13F | True North Advisors, LLC | 21.439 | 230,95 | 863 | 229,01 | ||||
| 2026-02-09 | 13F | Harbour Investments, Inc. | 112.437 | -4,34 | 4.526 | -5,10 | ||||
| 2026-02-10 | 13F | WCG Wealth Advisors LLC | 690.443 | 6,68 | 27.790 | 5,84 | ||||
| 2026-02-17 | 13F | Cape Investment Advisory, Inc. | 1.581 | 64 | ||||||
| 2026-04-07 | 13F | CoreCap Advisors, LLC | 1.478 | -0,07 | 59 | -1,69 | ||||
| 2026-02-05 | 13F | WJ Wealth Management, LLC | 10.210 | -19,26 | 411 | -20,08 | ||||
| 2026-02-13 | 13F | Laraway Financial Inc | 4.142 | -3,45 | 167 | -4,60 | ||||
| 2026-04-17 | 13F | BCS Wealth Management | 21.314 | -44,97 | 847 | -45,70 | ||||
| 2026-02-17 | 13F | Strategic Investment Advisors / MI | 5.524 | 222 | ||||||
| 2026-02-09 | 13F | Strategic Financial Concepts, LLC | 9.422 | 379 | ||||||
| 2026-01-15 | 13F | Jaffetilchin Investment Partners, LLC | 222.459 | 36,49 | 8.954 | 35,41 | ||||
| 2026-02-24 | 13F | Barnes Wealth Management Group, Inc | 10.624 | -8,39 | 428 | -9,15 | ||||
| 2026-02-20 | 13F | Sunbelt Securities, Inc. | 731 | 1,81 | 29 | 0,00 | ||||
| 2026-01-28 | 13F | Geneos Wealth Management Inc. | 69.486 | 6,58 | 2.797 | 5,75 | ||||
| 2026-02-10 | 13F | Godfrey Financial Associates, Inc. | 185 | 7 | ||||||
| 2026-02-11 | 13F | LPL Financial LLC | 3.849.612 | 8,15 | 154.947 | 7,30 | ||||
| 2026-04-15 | 13F | Redhawk Wealth Advisors, Inc. | 0 | -100,00 | 0 | |||||
| 2026-04-17 | 13F | Visionary Horizons, LLC | 153.999 | 48,04 | 6.118 | 46,15 | ||||
| 2026-01-29 | 13F | UBS Group AG | 2.042.902 | 15,83 | 82.227 | 14,91 | ||||
| 2026-02-13 | 13F | Lifeworks Advisors, LLC | 36.519 | 1,61 | 1.470 | 0,75 | ||||
| 2026-01-21 | 13F | MBL Wealth, LLC | 29.575 | -22,45 | 1.190 | -23,08 | ||||
| 2026-01-23 | 13F | Diversify Advisory Services, LLC | 9.021 | -3,15 | 363 | -3,46 | ||||
| 2026-04-20 | 13F | Leeward Financial Partners, LLC | 58.778 | -1,38 | 2.335 | -2,63 | ||||
| 2026-02-13 | 13F | Morgan Stanley | 6.604.998 | 16,04 | 265.851 | 15,13 | ||||
| 2025-11-13 | 13F | Van Hulzen Asset Management, LLC | 0 | -100,00 | 0 | |||||
| 2026-02-17 | 13F | VestGen Advisors, LLC | 20.751 | -65,31 | 835 | -65,58 | ||||
| 2026-02-11 | 13F | Jpmorgan Chase & Co | 138.070 | 158,33 | 5.557 | 156,32 | ||||
| 2026-02-04 | 13F | Ameritas Advisory Services, LLC | 0 | -100,00 | 0 | |||||
| 2026-02-17 | 13F | Stadion Money Management, LLC | 0 | -100,00 | 0 | |||||
| 2026-04-21 | 13F | Vise Technologies, Inc. | 6.478 | 0,00 | 261 | 0,00 | ||||
| 2026-02-09 | 13F | Green Square Capital Advisors Llc | 10.000 | 402 | ||||||
| 2026-02-10 | 13F | Bnp Paribas Arbitrage, Sa | 20 | -20,00 | 1 | -100,00 | ||||
| 2026-02-17 | 13F | Cetera Investment Advisers | 476.648 | 10,41 | 19.185 | 9,53 | ||||
| 2026-01-30 | 13F | Archer Investment Corp | 1.587 | -4,05 | 64 | -5,97 | ||||
| 2025-11-10 | 13F | Transatlantique Private Wealth Llc | 0 | -100,00 | 0 | |||||
| 2026-02-12 | 13F | Wealthspire Advisors, LLC | 0 | -100,00 | 0 | |||||
| 2026-04-08 | 13F | Selby Wealth Management, LLC | 47.396 | -1,06 | 1.883 | -2,33 | ||||
| 2026-02-05 | 13F | Pinnacle Financial Group, LLC / IL | 90.083 | 21,73 | 3.626 | 20,75 | ||||
| 2026-02-13 | 13F | Stifel Financial Corp | 77.138 | 5,74 | 3.105 | 4,90 | ||||
| 2026-01-20 | 13F | SOA Wealth Advisors, LLC. | 201 | 0,00 | 8 | 0,00 | ||||
| 2026-02-11 | 13F | Janney Capital Management LLC | 674.136 | -5,01 | 27 | -3,57 | ||||
| 2026-02-13 | 13F | National Bank Of Canada /fi/ | 0 | -100,00 | 0 | |||||
| 2026-02-02 | 13F | Mutual Advisors, LLC | 26.683 | 44,87 | 1.074 | 43,39 | ||||
| 2026-02-17 | 13F | Susquehanna International Group, Llp | 0 | -100,00 | 0 | |||||
| 2026-04-07 | 13F | Farther Finance Advisors, LLC | 23.472 | -21,80 | 929 | -23,10 | ||||
| 2026-04-24 | 13F | American Institute for Advanced Investment Management, LLP | 22.762 | 21,40 | 904 | 19,89 | ||||
| 2026-02-13 | 13F | Wells Fargo & Company/mn | 1.699.340 | 4,82 | 68.398 | 3,99 | ||||
| 2026-02-06 | 13F | Envestnet Portfolio Solutions, Inc. | 361.167 | 1,60 | 14.537 | 0,79 | ||||
| 2026-04-14 | 13F | Nbc Securities, Inc. | 35.134 | -3,47 | 1.396 | -4,71 | ||||
| 2026-01-30 | 13F | Caldwell Securities, Inc | 1.171 | 0,00 | 47 | 0,00 | ||||
| 2026-02-18 | 13F | GWM Advisors LLC | 315.864 | 18,07 | 12.714 | 17,14 | ||||
| 2026-04-16 | 13F | Center For Asset Management LLC | 5.654 | 225 | ||||||
| 2026-04-16 | 13F | Brookstone Capital Management | 313.792 | 4,98 | 12.467 | 3,62 | ||||
| 2026-02-06 | 13F | Keystone Financial Group | 155.362 | 2.205,76 | 6.253 | 2.190,48 | ||||
| 2026-01-21 | 13F | Prime Capital Investment Advisors, LLC | 110.414 | 1,24 | 4.444 | 0,45 | ||||
| 2026-02-10 | 13F | Fortis Advisors, LLC | 54.612 | 1,88 | 2.198 | 1,10 | ||||
| 2026-02-03 | 13F | SBI Securities Co., Ltd. | 2.392 | -50,93 | 96 | -51,27 | ||||
| 2026-02-17 | 13F | Citadel Advisors Llc | Call | 0 | -100,00 | 0 | ||||
| 2026-01-29 | 13F | Verdence Capital Advisors LLC | 11.649 | 0,02 | 469 | -1,47 | ||||
| 2026-02-03 | 13F | Cheviot Value Management, LLC | 1.269.271 | 17,47 | 51.152 | 16,00 | ||||
| 2026-02-19 | 13F | Mcguire Capital Advisors Inc | 3.435 | 138 | ||||||
| 2026-04-24 | 13F | Keybank National Association/oh | 13.661 | 0,00 | 543 | -1,28 | ||||
| 2026-02-12 | 13F | Connecticut Wealth Management, LLC | 0 | -100,00 | 0 | |||||
| 2026-02-12 | 13F | Principal Securities, Inc. | 0 | -100,00 | 0 | -100,00 | ||||
| 2026-02-17 | 13F | Qube Research & Technologies Ltd | 3.922 | 383,60 | 158 | 390,63 | ||||
| 2026-01-27 | 13F | Journey Advisory Group, LLC | 196.353 | 2,49 | 7.903 | 1,69 | ||||
| 2026-01-26 | 13F | San Luis Wealth Advisors LLC | 657.598 | 9,88 | 26.468 | 9,02 | ||||
| 2026-04-23 | 13F | Cornerstone Wealth Management, LLC | 267.823 | 20,28 | 10.641 | 18,72 | ||||
| 2026-02-09 | 13F | Collaborative Wealth Managment Inc. | 9.295 | -18,13 | 374 | -18,70 | ||||
| 2026-02-11 | 13F | Franklin Resources Inc | 0 | -100,00 | 0 | |||||
| 2026-02-17 | 13F | Warren Averett Asset Management, LLC | 141.148 | 5,32 | 5.681 | 4,49 | ||||
| 2026-02-12 | 13F | Triumph Capital Management | 4.951 | 420,61 | 199 | 423,68 | ||||
| 2026-01-22 | 13F | Richardson Financial Services Inc. | 7.302 | 33,25 | 294 | 31,98 | ||||
| 2026-04-24 | 13F | Crux Wealth Advisors | 13.052 | 0,80 | 519 | -0,58 | ||||
| 2026-02-13 | 13F | Baird Financial Group, Inc. | 32.868 | 4,81 | 1.323 | 3,93 | ||||
| 2026-02-10 | 13F | Principia Wealth Advisory, LLC | 14.882 | 59,08 | 599 | 58,05 | ||||
| 2026-04-09 | 13F | Elmwood Wealth Management, Inc. | 175.201 | 11,15 | 6.961 | 9,71 | ||||
| 2026-04-21 | 13F | Stapp Wealth Management, Pllc | 0 | -100,00 | 0 | |||||
| 2026-04-24 | 13F | Medallion Wealth Advisors, LLC | 54.854 | 5,76 | 2.179 | 4,41 | ||||
| 2026-04-06 | 13F | Versant Capital Management, Inc | 16 | 0,00 | 1 | |||||
| 2026-02-10 | 13F | Colton Groome Financial Advisors, Llc | 7.583 | -5,40 | 305 | -6,15 | ||||
| 2026-02-04 | 13F | Strategic Family Wealth Counselors, L.L.C. | 32.139 | -3,91 | 1.290 | -4,87 | ||||
| 2026-02-11 | 13F | M Holdings Securities, Inc. | 13.033 | 1 | ||||||
| 2026-02-09 | 13F | Kestra Investment Management, LLC | 1.548.613 | 1,40 | 62.332 | 0,60 | ||||
| 2026-02-17 | 13F | Signature Equity Partners, LLC | 5.486 | 221 | ||||||
| 2026-04-16 | 13F | Capital Advisors, Ltd. LLC | 57.854 | 29,85 | 2 | 100,00 | ||||
| 2026-01-21 | 13F | BIP Wealth, LLC | 7.136 | 287 | ||||||
| 2026-04-16 | 13F | Thompson Davis & Co., Inc. | 5.250 | 209 | ||||||
| 2026-04-09 | 13F | Nelson, Van Denburg & Campbell Wealth Management Group, LLC | 135.199 | 5.371 | ||||||
| 2026-02-13 | 13F | Entrewealth, Llc | 100.944 | 16,92 | 4.067 | 16,13 | ||||
| 2026-04-07 | 13F | Cooper Financial Group | 34.789 | -1,09 | 1.382 | -2,33 | ||||
| 2026-02-09 | 13F | Barry Investment Advisors, LLC | 0 | -100,00 | 0 | |||||
| 2025-11-06 | 13F | Financial Advocates Investment Management | 0 | -100,00 | 0 | |||||
| 2026-04-15 | 13F | Paragon Capital Management Ltd | 13.829 | -0,95 | 549 | -2,14 | ||||
| 2026-02-17 | 13F | Ameriflex Group, Inc. | 4.797 | -26,85 | 193 | -27,44 | ||||
| 2026-02-11 | 13F | Premier Private Wealth Management LLC | 103.209 | 4.141 | ||||||
| 2026-02-10 | 13F | Vantus Wealth LLC | 11.990 | 483 | ||||||
| 2025-11-14 | 13F | Leo Wealth, LLC | 0 | -100,00 | 0 | -100,00 | ||||
| 2026-02-06 | 13F | Larson Financial Group LLC | 701 | 1,89 | 28 | 3,70 | ||||
| 2026-04-16 | 13F | Westmount Partners, LLC | 12.834 | 6,59 | 510 | 5,17 | ||||
| 2026-04-24 | 13F | Deltec Asset Management Llc | 5.400 | 0,00 | 215 | -1,38 | ||||
| 2026-02-17 | 13F | Perritt Capital Management Inc | 0 | -100,00 | 0 | |||||
| 2026-02-06 | 13F | EverSource Wealth Advisors, LLC | 877 | -93,16 | 35 | -93,27 | ||||
| 2025-11-17 | 13F | Kestra Private Wealth Services, Llc | 0 | -100,00 | 0 | -100,00 | ||||
| 2026-02-13 | 13F | Change Path, LLC | 84.607 | 3,97 | 3.405 | 3,15 | ||||
| 2026-01-26 | 13F | Lionsbridge Wealth Management LLC | 59.964 | 4,30 | 2.414 | 3,47 | ||||
| 2026-02-10 | 13F | Castlekeep Investment Advisors Llc | 33.630 | 1.354 | ||||||
| 2026-04-13 | 13F | Chris Bulman Inc | 5.553 | -1,10 | 221 | -2,65 | ||||
| 2026-02-05 | 13F | Edge Financial Advisors LLC | 0 | -100,00 | 0 | |||||
| 2026-02-02 | 13F | Addison Capital Co | 9.974 | -38,20 | 401 | -38,69 | ||||
| 2026-01-21 | 13F | Paladin Advisory Group, LLC | 1.306 | 0,00 | 53 | 0,00 | ||||
| 2026-02-13 | 13F | Boston Family Office Llc | 5.000 | 0 | ||||||
| 2026-02-10 | 13F | Goldman Sachs Group Inc | 47.135 | 1.897 | ||||||
| 2026-02-17 | 13F | Captrust Financial Advisors | 471.243 | -9,49 | 18.968 | -10,21 | ||||
| 2026-04-08 | 13F | First Heartland Consultants, Inc. | 8.064 | 13,79 | 320 | 12,28 | ||||
| 2026-02-14 | 13F | Pointe Capital Management LLC | 33.648 | 6,51 | 1.354 | 5,70 | ||||
| 2026-02-17 | 13F | Bank Of America Corp /de/ | 1.986.965 | 2,13 | 79.975 | 1,32 | ||||
| 2026-04-24 | 13F | Family Capital Trust Co | 89.744 | 0,00 | 3.612 | 0,00 | ||||
| 2026-02-10 | 13F | Bank of New York Mellon Corp | 798.208 | -1,59 | 32.128 | -2,37 | ||||
| 2026-02-13 | 13F | Glen Eagle Advisors, LLC | 49.151 | 5,69 | 1.978 | 4,88 | ||||
| 2026-02-05 | 13F | Macroview Investment Management Llc | 11.687 | 7,26 | 470 | 6,33 | ||||
| 2026-04-10 | 13F | Cerro Pacific Wealth Advisors LLC | 224.720 | 14,48 | 8.928 | 13,00 | ||||
| 2026-02-17 | 13F | Pinnacle Family Advisors, LLC | 14.004 | 564 | ||||||
| 2026-02-17 | 13F | Mercer Global Advisors Inc /adv | 10.533 | 368 | ||||||
| 2026-02-14 | 13F | American Trust | 8.764 | -0,51 | 353 | -1,40 | ||||
| 2026-02-05 | 13F | Thrivent Financial For Lutherans | 669.671 | -14,22 | 27 | -12,90 | ||||
| 2025-11-13 | 13F | Richard W. Paul & Associates, LLC | 0 | -100,00 | 0 | |||||
| 2026-02-05 | 13F | Cambridge Investment Research Advisors, Inc. | 407.789 | -1,17 | 16 | 0,00 | ||||
| 2026-02-06 | 13F | Cullen/frost Bankers, Inc. | 46 | -87,47 | 2 | -92,86 | ||||
| 2025-11-13 | 13F | Eldridge Investment Advisors, Inc. | 0 | -100,00 | 0 | |||||
| 2026-01-06 | 13F | Canal Capital Management, LLC | 381.783 | 4,81 | 15.367 | 3,99 | ||||
| 2026-02-12 | 13F | Insigneo Advisory Services, Llc | 7.548 | 304 | ||||||
| 2026-02-10 | 13F | Gw Henssler & Associates Ltd | 5.811 | -2,29 | 234 | -3,32 | ||||
| 2026-02-12 | 13F | Helium Advisors LLC | 10.437 | 78,69 | 420 | 77,97 | ||||
| 2026-02-11 | 13F | Gateway Wealth Partners, LLC | 6.232 | 0,53 | 251 | -0,40 | ||||
| 2026-02-11 | 13F | Tiaa Trust, National Association | 9.722 | 59,77 | 391 | 58,94 | ||||
| 2026-02-03 | 13F | Crossmark Global Holdings, Inc. | 0 | -100,00 | 0 | |||||
| 2026-02-03 | 13F | RWM Asset Management, LLC | 425.508 | 4,43 | 17.156 | 3,79 | ||||
| 2026-01-23 | 13F | Curtis Advisory Group, LLC | 11.444 | 3,73 | 461 | 2,91 | ||||
| 2026-02-12 | 13F | BRYN MAWR TRUST Co | 0 | -100,00 | 0 | -100,00 | ||||
| 2026-02-24 | 13F | MidFirst Bank | 47 | 2 | ||||||
| 2026-02-02 | 13F | Horizon Investments, LLC | 847.744 | 1,53 | 34.122 | 1,56 | ||||
| 2026-02-10 | 13F | Eq Llc | 0 | -100,00 | 0 | |||||
| 2026-02-11 | 13F | Prestige Wealth Management Group LLC | 2.540 | -32,09 | 102 | -32,45 | ||||
| 2026-02-11 | 13F | Capital Analysts, Inc. | 2.703 | -97,51 | 0 | -100,00 | ||||
| 2026-02-13 | 13F | MAI Capital Management | 295.894 | 17,76 | 11.910 | 16,84 | ||||
| 2026-02-12 | 13F | Renaissance Technologies Llc | 7.500 | -89,44 | 302 | -89,55 | ||||
| 2026-02-17 | 13F | Advisory Services Network, LLC | 0 | -100,00 | 0 | |||||
| 2026-04-22 | 13F | Lam Group, Inc. | 155 | 6 | ||||||
| 2026-01-27 | 13F | TD Waterhouse Canada Inc. | 1.600 | 0,00 | 64 | 0,00 | ||||
| 2026-02-04 | 13F | Independent Advisor Alliance | 0 | -100,00 | 0 | |||||
| 2026-02-05 | 13F | Rossmore Private Capital | 0 | -100,00 | 0 | |||||
| 2026-04-10 | 13F | Ballew Advisors, Inc | 273.058 | 3,38 | 10.868 | 2,05 | ||||
| 2026-02-05 | 13F | Wakefield Asset Management LLLP | 82.087 | -6,28 | 3.304 | -7,01 | ||||
| 2026-01-27 | 13F | Tranquilli Financial Advisor LLC | 40.857 | -1,55 | 1.644 | -2,32 | ||||
| 2026-02-17 | 13F | Fwl Investment Management, Llc | 5.480 | 14,79 | 221 | 13,99 | ||||
| 2026-04-06 | 13F | Washington Trust Advisors, Inc. | 795 | 0,00 | 32 | 0,00 | ||||
| 2026-04-21 | 13F | Pinnacle Associates Ltd | 606.616 | 5,03 | 24.101 | 3,67 | ||||
| 2026-02-12 | 13F | Betterment LLC | 6.185 | 7,60 | 0 | |||||
| 2026-01-22 | 13F | Carlton Hofferkamp & Jenks Wealth Management, LLC | 19.189 | -1,17 | 772 | -2,40 | ||||
| 2026-02-11 | 13F | All Terrain Financial Advisors, LLC | 53.917 | 1,80 | 2.170 | 1,02 | ||||
| 2026-02-17 | 13F | Citadel Advisors Llc | Put | 0 | -100,00 | 0 | ||||
| 2026-04-20 | 13F | Independent Wealth Network Inc. | 15.654 | 622 | ||||||
| 2026-01-21 | 13F | Flagship Harbor Advisors, Llc | 20.172 | -0,96 | 812 | -1,82 | ||||
| 2026-02-03 | 13F | Alpha Cubed Investments, LLC | 90.132 | -8,21 | 3.628 | -8,94 | ||||
| 2026-01-16 | 13F | Beaumont Financial Advisors, LLC | 8.858 | 0,00 | 357 | -0,84 | ||||
| 2026-01-21 | 13F | V2 Financial group LLC | 165.978 | 12,74 | 6.681 | 11,86 | ||||
| 2026-02-13 | 13F | Wilkerson Advisory Group LLC | 46 | 2 | ||||||
| 2026-02-13 | 13F | Kestra Advisory Services, LLC | 0 | -100,00 | 0 | |||||
| 2026-02-10 | 13F | CIBC World Markets Inc. | 17.779 | -0,77 | 716 | -1,52 | ||||
| 2026-04-23 | 13F | McElhenny Sheffield Capital Management, LLC | 6.537 | -56,31 | 260 | -56,98 | ||||
| 2026-01-16 | 13F | M3 Advisory Group, LLC | 0 | -100,00 | 0 | |||||
| 2026-01-30 | 13F | Jackson Hole Capital Partners, LLC | 17.706 | 0,00 | 713 | -0,84 | ||||
| 2026-02-13 | 13F | Pinnacle Wealth Planning Services, Inc. | 552 | 22 | ||||||
| 2026-04-22 | 13F | Qp Wealth Management, Llc | 5.770 | -80,38 | 229 | -80,64 | ||||
| 2026-02-06 | 13F | Global Retirement Partners, LLC | 13.748 | 13,23 | 553 | 12,40 | ||||
| 2026-01-30 | 13F | Smart Portfolios, LLC | 9.188 | -2,31 | 370 | -3,15 | ||||
| 2026-02-13 | 13F | 1 North Wealth Services Llc | 351.883 | 1,46 | 14.163 | 0,66 | ||||
| 2026-02-05 | 13F | Atlas Wealth LLC | 46.781 | 28,71 | 1.883 | 27,68 | ||||
| 2026-02-06 | 13F | Morling Financial Advisors, LLC | 1.011.006 | 7,32 | 40.693 | 6,47 | ||||
| 2026-02-17 | 13F | Main Street Financial Solutions, LLC | 493.688 | 2,17 | 19.871 | 1,36 | ||||
| 2026-02-05 | 13F | USAdvisors Wealth Management, LLC | 86.190 | 14,12 | 3 | 0,00 | ||||
| 2026-02-11 | 13F | Parallel Advisors, LLC | 635 | 23,54 | 26 | 25,00 | ||||
| 2026-04-13 | 13F | IFP Advisors, Inc | 5.343 | -11,82 | 212 | -12,76 | ||||
| 2026-04-23 | 13F | Inman Jager Wealth Management, LLC | 168.226 | -0,30 | 6.684 | -1,59 | ||||
| 2026-04-16 | 13F | Freedom Financial Partners LLC | 140.883 | 2,67 | 5.597 | 1,36 | ||||
| 2026-02-13 | 13F | Strathmore Capital Advisors, Inc. | 24.320 | -3,87 | 979 | -4,68 | ||||
| 2026-01-15 | 13F | Capital Advisors Inc/ok | 1.430.907 | 2,65 | 57.594 | 1,84 | ||||
| 2026-02-10 | 13F/A | Northwestern Mutual Wealth Management Co | 103.824 | 8,14 | 4.179 | 7,27 | ||||
| 2026-02-09 | 13F | Endowment Wealth Management, Inc. | 6.542 | -25,87 | 263 | -26,54 | ||||
| 2026-02-02 | 13F | Truist Financial Corp | 198.798 | 3,81 | 8.002 | 2,99 |