Grundlæggende statistik
| Institutionelle aktier (lange) | 121.860.331 - 98,89% (ex 13D/G) - change of -26,54MM shares -17,88% MRQ |
| Institutionel værdi (lang) | $ 12.773.733 USD ($1000) |
Institutionelt ejerskab og aktionærer
Sun Communities, Inc. (US:SUI) har 527 institutionelle ejere og aktionærer, der har indsendt 13D/G- eller 13F-formularer til Securities Exchange Commission (SEC). Disse institutioner har i alt 121,860,331 aktier. Største aktionærer omfatter Vanguard Group Inc, Dodge & Cox, BlackRock, Inc., Cohen & Steers, Inc., Norges Bank, Price T Rowe Associates Inc /md/, State Street Corp, Wellington Management Group Llp, Fmr Llc, and Geode Capital Management, Llc .
Sun Communities, Inc. (NYSE:SUI) institutionel ejerskabsstruktur viser aktuelle positioner i virksomheden efter institutioner og fonde, samt seneste ændringer i positionsstørrelse. Større aktionærer kan omfatte individuelle investorer, investeringsforeninger, hedgefonde eller institutioner. Skema 13D angiver, at investoren besidder (eller besidder) mere end 5 % af virksomheden og har til hensigt (eller har til hensigt at) aktivt at forfølge en ændring i forretningsstrategi. Skema 13G indikerer en passiv investering på over 5%.
The share price as of April 28, 2026 is 128,24 / share. Previously, on April 29, 2025, the share price was 123,27 / share. This represents an increase of 4,03% over that period.

Fondens stemningsscore
Fund Sentiment Score (fka Ownership Accumulation Score) finder de aktier, der bliver mest købt af fonde. Det er resultatet af en sofistikeret, multi-faktor kvantitativ model, der identificerer virksomheder med de højeste niveauer af institutionel akkumulering. Scoringsmodellen bruger en kombination af den samlede stigning i oplyste ejere, ændringerne i porteføljeallokeringer i disse ejere og andre målinger. Tallet går fra 0 til 100, hvor højere tal indikerer et højere niveau af akkumulering for sine jævnaldrende, og 50 er gennemsnittet.
Opdateringsfrekvens: Dagligt
Se Ownership Explorer, som giver en liste over højest rangerende virksomheder.
AI+ Ask Fintel’s AI assistant about Sun Communities, Inc..
Select a question to share a public post with an AI-crafted answer.
Thinking of good questions…
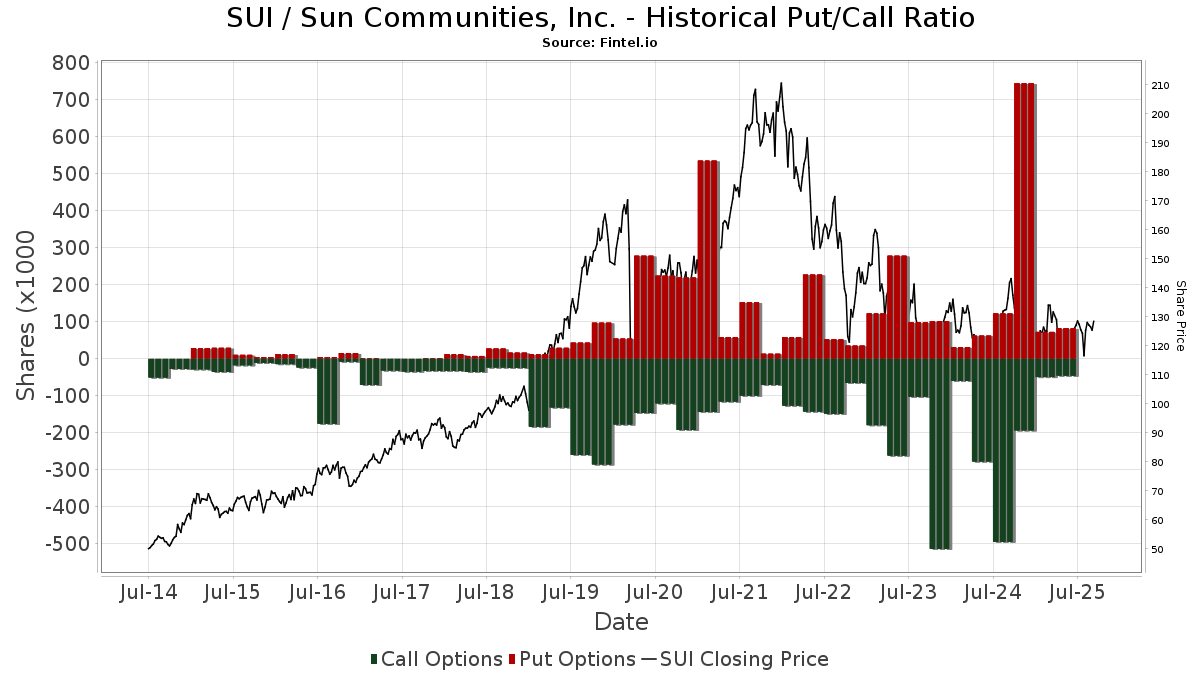
Institutionel Put/Call-forhold
Ud over at indberette standardaktie- og gældsudstedelser skal institutter med mere end 100 mill. aktiver under forvaltning også oplyse deres put- og call-optionsbeholdninger. Da salgsoptioner generelt indikerer negativ stemning, og købsoptioner indikerer positiv stemning, kan vi få en fornemmelse af den overordnede institutionelle stemning ved at plotte forholdet mellem put og kald. Diagrammet til højre viser det historiske put/call-forhold for dette instrument.
Brug af Put/Call Ratio som en indikator for investorernes stemning overvinder en af de vigtigste mangler ved at bruge totalt institutionelt ejerskab, som er, at en betydelig mængde af aktiver under forvaltning investeres passivt for at spore indekser. Passivt forvaltede fonde køber typisk ikke optioner, så indikatoren for put/call-forholdet følger mere nøje følelsen af aktivt forvaltede fonde.
13D/G-arkivering
Vi præsenterer 13D/G ansøgninger separat fra 13F ansøgninger på grund af den forskellige behandling af SEC. 13D/G-ansøgninger kan indgives af grupper af investorer (med én ledende), hvorimod 13F-ansøgninger ikke kan. Dette resulterer i situationer, hvor en investor kan indsende en 13D/G, der rapporterer én værdi for de samlede aktier (der repræsenterer alle de aktier, der ejes af investorgruppen), men derefter indsender en 13F, der rapporterer en anden værdi for de samlede aktier (der udelukkende repræsenterer deres egne) ejendomsret). Det betyder, at aktieejerskab af 13D/G-arkiver og 13F-arkiveringer ofte ikke er direkte sammenlignelige, så vi præsenterer dem separat.
Bemærk: Fra den 16. maj 2021 viser vi ikke længere ejere, der ikke har indsendt en 13D/G inden for det seneste år. Tidligere viste vi den fulde historie af 13D/G-arkiver. Generelt skal enheder, der er forpligtet til at indgive 13D/G-ansøgninger, indgive mindst årligt, før de indsender en afsluttende ansøgning. Dog forlader fonde nogle gange positioner uden at indsende en afsluttende ansøgning (dvs. de afvikler), så visning af den fulde historie resulterede nogle gange i forvirring om det nuværende ejerskab. For at undgå forvirring viser vi nu kun 'aktuelle' ejere - det vil sige - ejere, der har anmeldt inden for det seneste år.
Upgrade to unlock premium data.
| Fil dato | Form | Investor | Forrige Aktier |
Seneste Aktier |
Δ Aktier (Procent) |
Ejendomsret (Procent) |
Δ Ejerskab (Procent) |
|
|---|---|---|---|---|---|---|---|---|
| 2026-02-17 | PRICE T ROWE ASSOCIATES INC /MD/ | 7,046,062 | 5,560,089 | -21.09 | 4.50 | -18.18 | ||
| 2026-01-28 | NORGES BANK | 7,328,481 | 6,079,930 | -17.04 | 4.90 | -16.67 | ||
| 2025-11-14 | COHEN & STEERS, INC. | 16,620,758 | 11,183,297 | -32.71 | 8.94 | -31.49 | ||
| 2025-11-05 | FMR LLC | 7,909,794 | 5,269,273 | -33.38 | 4.20 | -32.26 | ||
| 2025-08-13 | DODGE & COX | 12,814,380 | 14,198,760 | 10.80 | 11.10 | 9.90 | ||
| 2025-04-17 | BlackRock, Inc. | 11,087,456 | 9,936,327 | -10.38 | 7.80 | -12.36 |
13F og NPORT arkivering
Detaljer om 13F-arkivering er gratis. Detaljer om NP-ansøgninger kræver et premium-medlemskab. Grønne rækker angiver nye positioner. Røde rækker angiver lukkede positioner. Klik på linket ikon for at se den fulde transaktionshistorik.
Opgrader
for at låse premium-data op og eksportere til Excel ![]() .
.
| Fil dato | Kilde | Investor | Type | Gennemsnitlig pris (Øst) |
Aktier | Δ Aktier (%) |
Rapporteret Værdi ($1000) |
Δ Værdi (%) |
Port Alloc (%) |
|
|---|---|---|---|---|---|---|---|---|---|---|
| 2026-02-12 | 13F | Federation des caisses Desjardins du Quebec | 19.101 | 58,26 | 2.366 | 52,06 | ||||
| 2026-02-13 | 13F | Mariner, LLC | 17.254 | 23,74 | 2.141 | 19,08 | ||||
| 2026-02-17 | 13F | MIRAE ASSET GLOBAL ETFS HOLDINGS Ltd. | 1.151 | 5,89 | 143 | 1,43 | ||||
| 2026-02-10 | 13F | Cbre Clarion Securities Llc | 262.148 | 0,00 | 32.483 | -3,95 | ||||
| 2025-11-14 | 13F | Snowden Capital Advisors LLC | 0 | -100,00 | 0 | |||||
| 2026-01-16 | 13F | Standard Life Aberdeen plc | 210.110 | 0,15 | 26.035 | -3,88 | ||||
| 2026-02-10 | 13F | Lasalle Investment Management Securities Llc | 53.134 | 0,00 | 6.584 | -3,95 | ||||
| 2026-04-23 | 13F | iA Global Asset Management Inc. | 4.433 | -6,61 | 1 | |||||
| 2026-02-12 | 13F | Brinker Capital Investments, LLC | 8.681 | -5,92 | 1.076 | -9,66 | ||||
| 2025-11-14 | 13F | AXA Investment Managers S.A. | 186.760 | 24.092 | ||||||
| 2026-02-05 | 13F | Bank Julius Baer & Co. Ltd, Zurich | 566 | 0,00 | 70 | -4,11 | ||||
| 2026-02-05 | 13F | Allworth Financial LP | 430 | 141,57 | 53 | 140,91 | ||||
| 2026-02-17 | 13F | Lantern Wealth Advisors, LLC | 2.800 | 0,00 | 347 | -4,16 | ||||
| 2026-02-13 | 13F | First National Bank Of Omaha | 17.341 | -4,46 | 2.149 | -8,24 | ||||
| 2026-04-24 | 13F | Root Financial Partners, LLC | 36 | 500,00 | 5 | |||||
| 2026-04-02 | 13F | MJT & Associates Financial Advisory Group, Inc. | 26 | 3 | ||||||
| 2026-04-14 | 13F | West Branch Capital LLC | 0 | -100,00 | 0 | |||||
| 2025-11-14 | 13F | Adage Capital Partners Gp, L.l.c. | 0 | -100,00 | 0 | |||||
| 2026-04-27 | 13F | Fideuram - Intesa Sanpaolo Private Banking S.p.a. | 1.996 | -26,59 | 251 | -25,30 | ||||
| 2026-02-13 | 13F | Capula Management Ltd | 21.451 | 2.658 | ||||||
| 2026-02-13 | 13F | Victory Capital Management Inc | 60.159 | -8,55 | 7.454 | -12,15 | ||||
| 2026-02-17 | 13F | Boothbay Fund Management, Llc | 0 | -100,00 | 0 | |||||
| 2026-01-23 | 13F | Penn Mutual Asset Management, LLC | 0 | -100,00 | 0 | |||||
| 2026-01-23 | 13F | Avion Wealth | 0 | -100,00 | 0 | |||||
| 2026-01-26 | 13F | Mirae Asset Global Investments Co., Ltd. | 6.142 | -4,30 | 761 | -7,98 | ||||
| 2026-02-13 | 13F | 1832 Asset Management L.P. | 62.645 | 1,69 | 7.762 | -2,33 | ||||
| 2026-02-10 | 13F | Presima Inc. | 36.178 | -57,84 | 4.483 | -59,51 | ||||
| 2026-02-11 | 13F | Capital International Investors | 882.808 | 0,11 | 109.389 | -3,84 | ||||
| 2026-04-16 | 13F | SG Americas Securities, LLC | 198.193 | 91,17 | 25 | 100,00 | ||||
| 2026-04-07 | 13F | Blueline Advisors Llc | 169 | 2,42 | 21 | 5,00 | ||||
| 2026-02-13 | 13F | Hudson Bay Capital Management LP | 126.426 | 15.665 | ||||||
| 2026-04-24 | 13F | Private Advisor Group, LLC | 0 | -100,00 | 0 | |||||
| 2026-04-27 | 13F | Canal Capital Management, LLC | 3.403 | 0,65 | 429 | 2,39 | ||||
| 2026-02-10 | 13F | Quantbot Technologies LP | 13.532 | 1.677 | ||||||
| 2026-02-10 | 13F | National Pension Service | 5.914 | 58,68 | 733 | 52,50 | ||||
| 2026-04-20 | 13F | State of Alaska, Department of Revenue | 61.156 | 0,95 | 8 | 0,00 | ||||
| 2026-01-12 | 13F | Abound Wealth Management | 0 | -100,00 | 0 | |||||
| 2026-02-17 | 13F | Summit Trail Advisors, Llc | 9.405 | -7,26 | 1.175 | -10,44 | ||||
| 2026-02-13 | 13F | Natixis | 38.426 | 8,54 | 4.761 | 4,27 | ||||
| 2026-02-12 | 13F | Campbell & CO Investment Adviser LLC | 6.027 | 747 | ||||||
| 2026-01-15 | 13F | Nisa Investment Advisors, Llc | 14.308 | -24,94 | 1.794 | -27,79 | ||||
| 2026-02-18 | 13F | Vident Advisory, LLC | 4.951 | -18,39 | 614 | -21,61 | ||||
| 2026-02-13 | 13F | Mml Investors Services, Llc | 4.437 | 6,51 | 550 | 2,23 | ||||
| 2026-02-13 | 13F | First Trust Advisors Lp | 307.169 | 0,39 | 38.061 | -3,57 | ||||
| 2026-02-17 | 13F | United Capital Financial Advisers, Llc | 2.397 | -5,78 | 297 | -9,45 | ||||
| 2026-02-05 | 13F | Commerzbank Aktiengesellschaft /fi | 8.378 | 0,00 | 1 | 0,00 | ||||
| 2026-02-11 | 13F | O'shaughnessy Asset Management, Llc | 2.172 | -23,20 | 269 | -26,10 | ||||
| 2026-01-30 | 13F | Safe Harbor Family Capital, LLC | 2.343 | 290 | ||||||
| 2026-04-06 | 13F | CX Institutional | 137 | 372,41 | 0 | |||||
| 2026-02-17 | 13F | Redwood Investment Management, Llc | 19.395 | 2 | ||||||
| 2026-02-02 | 13F | Davis Selected Advisers | 42.840 | -2,53 | 5.308 | -6,37 | ||||
| 2026-02-17 | 13F | Canada Pension Plan Investment Board | 1.030.991 | 0,00 | 127.750 | -3,95 | ||||
| 2026-02-05 | 13F | Cambridge Investment Research Advisors, Inc. | 5.047 | -2,10 | 1 | |||||
| 2026-02-13 | 13F | Ontario Teachers Pension Plan Board | 0 | -100,00 | 0 | |||||
| 2026-02-13 | 13F | Cohen & Steers, Inc. | 10.059.770 | -8,37 | 1.247 | -12,01 | ||||
| 2026-01-07 | 13F | Permanent Capital Management, LP | 0 | -100,00 | 0 | |||||
| 2026-04-27 | 13F | Y-Intercept (Hong Kong) Ltd | 0 | -100,00 | 0 | |||||
| 2026-02-10 | 13F | Kentucky Retirement Systems Insurance Trust Fund | 3.325 | 0,00 | 412 | -3,74 | ||||
| 2026-01-28 | 13F | Geneos Wealth Management Inc. | 0 | -100,00 | 0 | -100,00 | ||||
| 2026-02-13 | 13F | Van Eck Associates Corp | 69.111 | 3,50 | 9 | 0,00 | ||||
| 2026-02-13 | 13F | Commerce Bank | 3.102 | 0,00 | 384 | -4,00 | ||||
| 2026-04-23 | 13F | Oppenheimer Asset Management Inc. | 23.736 | 14,65 | 2.990 | 16,53 | ||||
| 2026-02-17 | 13F | Utah Retirement Systems | 43.673 | 110,06 | 5.412 | 101,75 | ||||
| 2026-02-06 | 13F | Harvest Portfolios Group Inc. | 24.390 | -6,20 | 3.022 | -9,90 | ||||
| 2026-02-03 | 13F | RB Capital Management, LLC | 1.891 | -17,06 | 234 | -20,41 | ||||
| 2026-04-20 | 13F | Aurora Investment Managers, LLC. | 27.838 | -0,08 | 4 | 0,00 | ||||
| 2026-01-07 | 13F | Retirement Wealth Solutions LLC | 0 | -100,00 | 0 | |||||
| 2026-02-17 | 13F | FIL Ltd | 24.655 | -77,51 | 3.055 | -78,39 | ||||
| 2026-02-06 | 13F | Tredje AP-fonden | 13.472 | 5,01 | 1.669 | 0,91 | ||||
| 2026-02-10 | 13F | Anchor Capital Advisors Llc | 36.803 | 1,56 | 4.560 | -2,44 | ||||
| 2026-04-27 | 13F | Osborne Partners Capital Management, Llc | 47.600 | 1,80 | 5.996 | 3,47 | ||||
| 2026-02-13 | 13F | Korea Investment CORP | 109.978 | 91,90 | 13.627 | 84,35 | ||||
| 2026-02-17 | 13F | Ancora Advisors, LLC | 187 | 3.016,67 | 23 | |||||
| 2026-02-17 | 13F | Credit Agricole S A | 2.534 | -38,42 | 314 | -40,94 | ||||
| 2026-02-17 | 13F | Balyasny Asset Management Llc | 767.190 | 152,47 | 95.063 | 142,51 | ||||
| 2026-01-27 | 13F | First Horizon Corp | 5 | -61,54 | 1 | -100,00 | ||||
| 2026-02-13 | 13F | Royal London Asset Management Ltd | 46.341 | -8,26 | 5.742 | -11,88 | ||||
| 2026-04-07 | 13F | Central Pacific Bank - Trust Division | 4.450 | -1,11 | 561 | 0,54 | ||||
| 2026-01-30 | 13F | State of New Jersey Common Pension Fund D | 165.011 | -1,15 | 20.447 | -5,06 | ||||
| 2026-02-13 | 13F | Dodge & Cox | 14.491.865 | 0,08 | 1.795.687 | -3,87 | ||||
| 2026-04-17 | 13F | Discipline Wealth Solutions, LLC | 2.878 | 0,00 | 362 | 1,69 | ||||
| 2026-02-12 | 13F | Cibc World Markets Corp | 33.572 | -9,89 | 4.160 | -11,74 | ||||
| 2026-02-13 | 13F | Treasurer of the State of North Carolina | 51.314 | -9,66 | 6 | -14,29 | ||||
| 2026-02-23 | 13F | Mv Capital Management, Inc. | 3 | 0,00 | 0 | |||||
| 2026-04-16 | 13F | Balboa Wealth Partners | 4.657 | -13,02 | 587 | -11,61 | ||||
| 2026-02-05 | 13F | SkyOak Wealth, LLC | 4.589 | 0,00 | 569 | -3,89 | ||||
| 2026-02-12 | 13F | APG Asset Management US Inc. | 304.084 | -9,80 | 37.679 | -13,03 | ||||
| 2026-02-13 | 13F | Morgan Stanley | 954.742 | 4,31 | 118.302 | 0,20 | ||||
| 2026-02-12 | 13F | Chilton Capital Management Llc | 99.536 | -5,10 | 12.425 | -8,83 | ||||
| 2026-04-27 | 13F | Wbh Advisory Inc | 9.110 | -8,30 | 1.160 | -5,77 | ||||
| 2026-01-23 | 13F | Assetmark, Inc | 159 | -41,33 | 20 | -44,12 | ||||
| 2025-11-14 | 13F | Mount Yale Investment Advisors, LLC | 0 | -100,00 | 0 | -100,00 | ||||
| 2026-01-08 | 13F | Nordea Investment Management Ab | 12.711 | 9,02 | 1.575 | 5,92 | ||||
| 2026-02-11 | 13F | Manchester Capital Management LLC | 7 | 1 | ||||||
| 2025-11-14 | 13F | Skopos Labs, Inc. | 0 | -100,00 | 0 | |||||
| 2026-02-09 | 13F | Geode Capital Management, Llc | 2.338.358 | 0,41 | 288.937 | -3,53 | ||||
| 2026-02-17 | 13F | Sophron Capital Management L.P. | 12.482 | -19,92 | 1.547 | -23,08 | ||||
| 2026-01-28 | 13F | Universal- Beteiligungs- und Servicegesellschaft mbH | 254.925 | -7,01 | 31.619 | -10,59 | ||||
| 2026-01-29 | 13F | Sanctuary Advisors, LLC | 8.574 | -6,63 | 1.062 | -10,30 | ||||
| 2026-02-06 | 13F | Vestmark Advisory Solutions, Inc. | 18.938 | 127,18 | 2.347 | 118,23 | ||||
| 2026-03-02 | 13F | Reflection Asset Management | 121 | 15 | ||||||
| 2026-04-15 | 13F | DAVENPORT & Co LLC | 28.777 | -3,85 | 3.625 | -2,29 | ||||
| 2026-02-17 | 13F | Tower Research Capital LLC (TRC) | 2.027 | -50,61 | 251 | -52,55 | ||||
| 2026-02-13 | 13F | Public Employees Retirement Association Of Colorado | 12.598 | 0,00 | 2 | 0,00 | ||||
| 2026-04-15 | 13F | Spirit Of America Management Corp/ny | 8.950 | -3,76 | 1.127 | -2,17 | ||||
| 2026-02-04 | 13F | Community Bank, N.A. | 125 | 15 | ||||||
| 2026-02-13 | 13F | Gen-Wealth Partners Inc | 55 | 0,00 | 7 | -14,29 | ||||
| 2026-02-11 | 13F | Vestcor Inc | 2.881 | -51,89 | 0 | |||||
| 2026-02-17 | 13F | Citadel Advisors Llc | Call | 14.000 | 14,75 | 1.735 | 10,24 | |||
| 2026-02-17 | 13F | Citadel Advisors Llc | 1.253.123 | -8,36 | 155.274 | -11,98 | ||||
| 2026-04-27 | 13F | HB Wealth Management, LLC | 5.524 | -1,11 | 696 | 0,43 | ||||
| 2026-02-17 | 13F | Citadel Advisors Llc | Put | 2.300 | -61,02 | 285 | -62,68 | |||
| 2026-02-05 | 13F | 1620 Investment Advisors, Inc. | 142 | -7,79 | 18 | -10,53 | ||||
| 2026-02-09 | 13F/A | Swedbank AB | 157.113 | 21,40 | 19.468 | 16,61 | ||||
| 2026-02-11 | 13F | Franklin Resources Inc | 420.047 | 249,64 | 52.048 | 235,86 | ||||
| 2026-02-17 | 13F | Prosperity Bancshares Inc | 391 | 48 | ||||||
| 2026-02-17 | 13F | Aqr Capital Management Llc | 152.462 | 162,90 | 18.892 | 152,52 | ||||
| 2026-02-10 | 13F | Daiwa Securities Group Inc. | 1.511.146 | -16,29 | 187 | -19,40 | ||||
| 2026-02-06 | 13F | Gsa Capital Partners Llp | 0 | -100,00 | 0 | |||||
| 2026-02-12 | 13F | Commonwealth Equity Services, Llc | 8.460 | -0,80 | 1.048 | 104.700,00 | ||||
| 2025-11-21 | 13F/A | CIBC Bancorp USA Inc. | 35.498 | 4.579 | ||||||
| 2026-02-13 | 13F | Vision Capital Corp | 283.334 | 0,52 | 35.108 | -3,44 | ||||
| 2026-02-02 | 13F | Principal Financial Group Inc | 114.786 | -3,42 | 14.223 | -7,23 | ||||
| 2026-02-02 | 13F | Danske Bank A/s | 73.303 | 25,94 | 9.083 | 20,96 | ||||
| 2026-02-17 | 13F | Engineers Gate Manager LP | 46.290 | 232,61 | 5.736 | 219,50 | ||||
| 2026-02-11 | 13F | Zions Bancorporation, National Association /ut/ | 140 | 17 | ||||||
| 2026-04-13 | 13F | IFP Advisors, Inc | 2.643 | -8,92 | 333 | -7,52 | ||||
| 2026-02-13 | 13F | Umb Bank N A/mo | 24 | 50,00 | 3 | 0,00 | ||||
| 2026-02-11 | 13F | 111 Capital | 1.982 | 246 | ||||||
| 2026-02-10 | 13F | Rothschild Investment Llc | 604 | 7.450,00 | 75 | 7.300,00 | ||||
| 2026-02-17 | 13F | Polymer Capital Management (US) LLC | 0 | -100,00 | 0 | -100,00 | ||||
| 2026-02-17 | 13F | Mercer Global Advisors Inc /adv | 33.858 | 208,14 | 4.195 | 196,05 | ||||
| 2026-04-28 | 13F | Aew Capital Management L P | 66.967 | 37,65 | 8.435 | 39,93 | ||||
| 2026-04-22 | 13F | Sterling Capital Management LLC | 3.505 | -41,95 | 441 | -41,04 | ||||
| 2026-02-17 | 13F | Amundi | 260.834 | 9,35 | 32.320 | 6,27 | ||||
| 2026-01-23 | 13F | Sumitomo Mitsui Trust Holdings, Inc. | 419.203 | -5,18 | 51.943 | -8,92 | ||||
| 2025-11-13 | 13F | Capital Group Private Client Services, Inc. | 0 | -100,00 | 0 | |||||
| 2026-02-11 | 13F | Inceptionr Llc | 0 | -100,00 | 0 | |||||
| 2026-04-08 | 13F | Arlington Trust Co LLC | 137 | 17 | ||||||
| 2026-02-11 | 13F | TCTC Holdings, LLC | 45 | 0,00 | 6 | 0,00 | ||||
| 2026-04-21 | 13F | Nemes Rush Group LLC | 0 | -100,00 | 0 | |||||
| 2025-11-14 | 13F | Axa S.a. | 0 | -100,00 | 0 | |||||
| 2026-02-12 | 13F | Ci Investments Inc. | 120.577 | -6,94 | 14.941 | 93.275,00 | ||||
| 2026-02-17 | 13F | Land & Buildings Investment Management, LLC | 285.481 | 21,59 | 35.374 | 16,79 | ||||
| 2026-04-06 | 13F | Versant Capital Management, Inc | 1.304 | 75,27 | 164 | 78,26 | ||||
| 2026-02-13 | 13F | Cramer Rosenthal Mcglynn Llc | 254.316 | -3,65 | 31.512 | -7,45 | ||||
| 2026-02-13 | 13F | Macquarie Group Ltd | 106.912 | 2,82 | 13.247 | -1,23 | ||||
| 2025-10-31 | 13F | Symphony Financial, Ltd. Co. | 0 | -100,00 | 0 | -100,00 | ||||
| 2026-01-29 | 13F | D.a. Davidson & Co. | 3.914 | 18,03 | 485 | 13,35 | ||||
| 2026-02-10 | 13F | Intech Investment Management Llc | 37.274 | -33,33 | 4.619 | -35,96 | ||||
| 2026-02-17 | 13F | Parallax Volatility Advisers, L.P. | Put | 0 | -100,00 | 0 | ||||
| 2026-02-13 | 13F | JustInvest LLC | 6.970 | -17,71 | 864 | -21,04 | ||||
| 2026-02-17 | 13F | Parallax Volatility Advisers, L.P. | 0 | -100,00 | 0 | |||||
| 2026-02-17 | 13F | Parallax Volatility Advisers, L.P. | Call | 0 | -100,00 | 0 | ||||
| 2026-02-17 | 13F | Bank Of America Corp /de/ | 519.864 | -4,07 | 64.416 | -7,85 | ||||
| 2026-02-09 | 13F | Atlantic Trust, LLC | 52 | -24,64 | 6 | -25,00 | ||||
| 2026-02-17 | 13F | LMR Partners LLP | 158.668 | 239,34 | 19.661 | 225,98 | ||||
| 2025-11-13 | 13F | Aware Super Pty Ltd as trustee of Aware Super | 61.650 | -52,42 | 7.953 | -50,47 | ||||
| 2026-02-10 | 13F | Parr Mcknight Wealth Management Group, Llc | 9.331 | -11,57 | 1.156 | -15,06 | ||||
| 2026-04-23 | 13F | SJS Investment Consulting Inc. | 374 | -8,11 | 47 | -6,00 | ||||
| 2026-02-17 | 13F | Price T Rowe Associates Inc /md/ | 5.560.075 | -12,76 | 689 | -16,30 | ||||
| 2026-02-17 | 13F | California State Teachers Retirement System | 190.643 | -6,64 | 23.623 | -10,33 | ||||
| 2026-04-27 | 13F | Adams Asset Advisors, LLC | 22.270 | 0,00 | 2.805 | 1,67 | ||||
| 2026-02-17 | 13F | Jain Global LLC | 0 | -100,00 | 0 | |||||
| 2026-02-06 | 13F | Van Hulzen Asset Management, LLC | 5.835 | 21,69 | 723 | 16,99 | ||||
| 2026-04-02 | 13F | Aspect Partners, LLC | 13 | 0,00 | 2 | 0,00 | ||||
| 2025-11-13 | 13F | Guggenheim Capital Llc | 0 | -100,00 | 0 | -100,00 | ||||
| 2026-02-10 | 13F | Td Asset Management Inc | 63.984 | 1,00 | 7.928 | -2,99 | ||||
| 2026-01-26 | 13F | KBC Group NV | 26.586 | -1,68 | 3 | 0,00 | ||||
| 2026-02-17 | 13F | Dark Forest Capital Management Lp | 49.155 | -15,45 | 6.091 | -18,79 | ||||
| 2026-02-10 | 13F | Eurizon Capital SGR S.p.A. | 28.745 | 3.566 | ||||||
| 2026-02-17 | 13F | Crawford Investment Counsel Inc | 0 | -100,00 | 0 | |||||
| 2026-02-20 | 13F | Kovitz Investment Group Partners, LLC | 0 | -100,00 | 0 | |||||
| 2025-11-14 | 13F | Wetherby Asset Management Inc | 2.026 | -4,21 | 261 | -2,25 | ||||
| 2026-01-22 | 13F | LDR Capital Management LLC | 20.871 | 2.586 | ||||||
| 2026-02-11 | 13F | Cerity Partners LLC | 30.579 | 0,79 | 3.789 | -3,17 | ||||
| 2026-01-27 | 13F | Regions Financial Corp | 2.169 | 1,59 | 269 | -2,55 | ||||
| 2026-04-07 | 13F | Signaturefd, Llc | 1.170 | -2,09 | 147 | -0,68 | ||||
| 2026-04-24 | 13F | Key FInancial Inc | 195 | 0,00 | 25 | 0,00 | ||||
| 2026-02-10 | 13F | Envestnet Asset Management Inc | 163.339 | -4,70 | 20.239 | -8,46 | ||||
| 2026-02-04 | 13F | HighPoint Advisor Group LLC | 1.730 | -3,51 | 214 | -7,36 | ||||
| 2026-02-09 | 13F | Harbour Investments, Inc. | 69 | 21,05 | 9 | 14,29 | ||||
| 2026-02-13 | 13F | Colony Group, LLC | 8.200 | 1.016 | ||||||
| 2026-02-13 | 13F | Towarzystwo Funduszy Inwestycyjnych Pzu Sa | 0 | -100,00 | 0 | |||||
| 2026-02-13 | 13F | Transamerica Financial Advisors, Inc. | 14 | 2 | ||||||
| 2026-01-22 | 13F | Ofi Invest Asset Management | 3.809 | -3,10 | 402 | -6,96 | ||||
| 2026-02-11 | 13F | Syon Capital Llc | 2.247 | 278 | ||||||
| 2026-02-12 | 13F | CIBC Private Wealth Group, LLC | 1.635 | -16,41 | 203 | -19,84 | ||||
| 2026-02-17 | 13F | Rakuten Investment Management, Inc. | 5.302 | -55,22 | 662 | -75,21 | ||||
| 2026-04-15 | 13F | Exchange Traded Concepts, Llc | 1.877 | 8,75 | 236 | 10,80 | ||||
| 2026-01-30 | 13F | Valued Wealth Advisors LLC | 77 | 0,00 | 10 | -10,00 | ||||
| 2026-02-17 | 13F | Tcw Group Inc | 1.736 | 215 | ||||||
| 2025-11-13 | 13F | Tocqueville Asset Management L.p. | 0 | -100,00 | 0 | |||||
| 2026-02-13 | 13F | Manufacturers Life Insurance Company, The | 0 | -100,00 | 0 | |||||
| 2026-02-06 | 13F | EverSource Wealth Advisors, LLC | 773 | 13,18 | 96 | 7,95 | ||||
| 2026-02-10 | 13F | Ilmarinen Mutual Pension Insurance Co | 12.500 | 2 | ||||||
| 2026-02-12 | 13F | California Public Employees Retirement System | 281.983 | -8,51 | 34.941 | -12,12 | ||||
| 2026-02-12 | 13F | Bank Of Montreal /can/ | 23.705 | -61,69 | 2.937 | -63,20 | ||||
| 2026-02-13 | 13F | Brookfield Asset Management Inc. | 10.590 | -71,24 | 1.312 | -72,38 | ||||
| 2026-04-22 | 13F | Pictet Asset Management Holding SA | 48.721 | -5,86 | 6.137 | -4,30 | ||||
| 2026-01-06 | 13F | Ransom Advisory, Ltd | 39 | 0,00 | 5 | -20,00 | ||||
| 2026-01-27 | 13F | Asset Management One Co., Ltd. | 235.582 | 1,20 | 29.404 | -2,09 | ||||
| 2026-01-28 | 13F | Chicago Partners Investment Group LLC | 1.921 | 243 | ||||||
| 2026-02-05 | 13F | Baader Bank INC | 4.030 | 499 | ||||||
| 2026-02-17 | 13F | NEOS Investment Management LLC | 16.484 | 42,92 | 2.043 | 37,32 | ||||
| 2026-04-27 | 13F | Leonteq Securities AG | 5 | -76,19 | 1 | -100,00 | ||||
| 2026-04-24 | 13F | Mitchell Mcleod Pugh & Williams Inc | 2.438 | 0,00 | 307 | 0,33 | ||||
| 2026-01-28 | 13F | DekaBank Deutsche Girozentrale | 110.373 | 0,00 | 14 | -7,14 | ||||
| 2026-02-06 | 13F | Summit Wealth Group, LLC | 3.887 | 0,00 | 482 | -3,99 | ||||
| 2026-02-17 | 13F | Cresset Asset Management, LLC | 4.363 | 0,30 | 545 | -3,54 | ||||
| 2026-02-13 | 13F | Candriam Luxembourg S.C.A. | 12.279 | 40,96 | 1.522 | 35,44 | ||||
| 2026-02-13 | 13F | State Street Corp | 5.302.747 | -1,51 | 662.472 | -5,34 | ||||
| 2026-02-19 | 13F | Rare Wolf Capital LLC | 9.714 | 1.204 | ||||||
| 2026-02-17 | 13F | Greenland Capital Management LP | 14.000 | 100,00 | 1.735 | 92,03 | ||||
| 2026-02-10 | 13F | Commonwealth Of Pennsylvania Public School Empls Retrmt Sys | 40.053 | -3,37 | 4.963 | -7,20 | ||||
| 2026-04-22 | 13F | Spire Wealth Management | 0 | -100,00 | 0 | |||||
| 2026-02-13 | 13F | Smartleaf Asset Management LLC | 1.554 | 133,68 | 195 | 128,24 | ||||
| 2025-11-14 | 13F | Virtu Financial LLC | 0 | -100,00 | 0 | |||||
| 2026-01-26 | 13F | Cwm, Llc | 9.305 | 240,10 | 1 | |||||
| 2026-02-12 | 13F | Skandinaviska Enskilda Banken AB (publ) | 24.068 | -5,36 | 2.982 | -9,09 | ||||
| 2026-02-17 | 13F | SageView Advisory Group, LLC | 47 | 6 | ||||||
| 2026-02-17 | 13F | Agf Management Ltd | 24.018 | -8,14 | 2.976 | -11,74 | ||||
| 2026-01-16 | 13F | Trust Co Of Vermont | 73 | 0,00 | 9 | 0,00 | ||||
| 2026-02-12 | 13F | Principal Securities, Inc. | 0 | -100,00 | 0 | |||||
| 2026-02-09 | 13F | New Age Alpha Advisors, LLC | 20.042 | -16,44 | 2.483 | -19,75 | ||||
| 2026-04-07 | 13F | CoreCap Advisors, LLC | 2.153 | -3,37 | 271 | -1,81 | ||||
| 2026-02-17 | 13F | Susquehanna International Group, Llp | Call | 23.700 | 229,17 | 2.937 | 216,38 | |||
| 2026-02-11 | 13F | Allianz Asset Management GmbH | 121.942 | 0,54 | 15.110 | -3,43 | ||||
| 2026-02-05 | 13F | North Dakota State Investment Board | 4.448 | 551 | ||||||
| 2026-02-13 | 13F | Kennedy Capital Management, Inc. | 44.994 | -0,48 | 5.575 | -4,41 | ||||
| 2026-02-17 | 13F | Susquehanna International Group, Llp | 272.213 | 34,10 | 33.730 | 28,81 | ||||
| 2026-02-17 | 13F | Lighthouse Investment Partners, LLC | 56.804 | 7.039 | ||||||
| 2026-02-17 | 13F | Jones Financial Companies Lllp | 4.122 | 26,40 | 511 | 21,72 | ||||
| 2026-02-17 | 13F | Susquehanna International Group, Llp | Put | 53.900 | 60,90 | 6.679 | 54,55 | |||
| 2026-04-13 | 13F | Mather Group, Llc. | 1.168 | 147 | ||||||
| 2026-02-13 | 13F | Parkside Financial Bank & Trust | 63 | 53,66 | 8 | 40,00 | ||||
| 2026-01-09 | 13F | Congress Asset Management Co /ma | 0 | -100,00 | 0 | |||||
| 2026-02-11 | 13F | Group One Trading, L.p. | Put | 2.000 | -4,76 | 248 | -8,52 | |||
| 2026-02-11 | 13F | Group One Trading, L.p. | 113 | 0,00 | 14 | 0,00 | ||||
| 2026-02-11 | 13F | Group One Trading, L.p. | Call | 3.000 | 2.900,00 | 372 | 2.991,67 | |||
| 2026-04-23 | 13F | American National Bank | 6.000 | 0,00 | 756 | 1,62 | ||||
| 2026-04-08 | 13F | Icapital Wealth Llc | 1.992 | 0,00 | 251 | 1,62 | ||||
| 2026-04-08 | 13F | Wealth Enhancement Advisory Services, Llc | 3.978 | -94,95 | 514 | -94,69 | ||||
| 2026-04-16 | 13F | BI Asset Management Fondsmaeglerselskab A/S | 8.315 | 26,21 | 1 | |||||
| 2026-02-12 | 13F | Nuveen, LLC | 982.857 | -0,51 | 121.786 | -4,43 | ||||
| 2026-01-15 | 13F | Warwick Investment Management, Inc. | 2.479 | -0,16 | 307 | -4,06 | ||||
| 2026-02-02 | 13F | Sachetta, LLC | 17 | 0,00 | 2 | 0,00 | ||||
| 2026-02-13 | 13F | Panagora Asset Management Inc | 2.220 | 0,00 | 275 | -3,85 | ||||
| 2026-02-04 | 13F | Dogwood Wealth Management LLC | 0 | -100,00 | 0 | -100,00 | ||||
| 2025-11-19 | 13F | Caitong International Asset Management Co., Ltd | 0 | -100,00 | 0 | |||||
| 2026-04-21 | 13F | GHP Investment Advisors, Inc. | 2 | 0 | ||||||
| 2026-02-13 | 13F | American Century Companies Inc | 186.330 | 266,48 | 23.088 | 252,06 | ||||
| 2026-02-13 | 13F | Healthcare Of Ontario Pension Plan Trust Fund | 73.598 | 9.120 | ||||||
| 2026-02-17 | 13F | Farringdon Capital, Ltd. | 0 | -100,00 | 0 | |||||
| 2026-01-15 | 13F | Burns Matteson Capital Management, LLC | 14.632 | 40,30 | 1.813 | 34,80 | ||||
| 2026-02-09 | 13F | Knights of Columbus Asset Advisors LLC | 19.758 | -6,85 | 2.448 | -10,53 | ||||
| 2026-02-17 | 13F | Jump Financial, LLC | 2.644 | 328 | ||||||
| 2026-04-14 | 13F | Thurston, Springer, Miller, Herd & Titak, Inc. | 183 | -8,04 | 23 | -4,17 | ||||
| 2026-04-17 | 13F | CENTRAL TRUST Co | 19 | 0,00 | 2 | 0,00 | ||||
| 2026-02-12 | 13F | Dimensional Fund Advisors Lp | 1.760.713 | -1,58 | 218.177 | -5,46 | ||||
| 2026-02-13 | 13F | Squarepoint Ops LLC | 28.492 | -48,74 | 3.530 | -50,76 | ||||
| 2026-02-12 | 13F | DRW Securities, LLC | 0 | -100,00 | 0 | |||||
| 2026-02-12 | 13F | Jane Street Group, Llc | 942.435 | 21,87 | 116.777 | 17,06 | ||||
| 2026-02-12 | 13F | Jane Street Group, Llc | Put | 3.400 | -79,76 | 421 | -80,57 | |||
| 2026-02-05 | 13F | Amalgamated Bank | 6.931 | -1,37 | 1 | |||||
| 2026-02-12 | 13F | Wealthspire Advisors, LLC | 0 | -100,00 | 0 | |||||
| 2026-02-12 | 13F | Jane Street Group, Llc | Call | 67.000 | 8.302 | |||||
| 2026-02-13 | 13F | Marshall Wace, Llp | 8.384 | 1.039 | ||||||
| 2026-02-13 | 13F | Brasada Capital Management, Lp | 4.680 | 7,34 | 572 | 1,78 | ||||
| 2026-02-17 | 13F | Quantinno Capital Management LP | 158.605 | 288,39 | 19.653 | 273,04 | ||||
| 2026-02-09 | 13F | Hartland & Co., LLC | 36 | 0,00 | 4 | 0,00 | ||||
| 2026-02-17 | 13F | Bayesian Capital Management, LP | 0 | -100,00 | 0 | |||||
| 2026-04-08 | 13F | Wealth Enhancement Trust Services, Inc. | 0 | -100,00 | 0 | |||||
| 2026-02-13 | 13F | Arkadios Wealth Advisors | 7.683 | 4,42 | 952 | 0,32 | ||||
| 2026-02-11 | 13F | United Financial Planning Group LLC | 3 | 0 | ||||||
| 2026-02-13 | 13F | Neuberger Berman Group LLC | 203.015 | -16,69 | 25.156 | -19,98 | ||||
| 2026-04-28 | 13F | Bogart Wealth, LLC | 16 | 300,00 | 2 | |||||
| 2026-02-12 | 13F | Third Avenue Management Llc | 0 | -100,00 | 0 | |||||
| 2026-04-28 | 13F | Argonautica Private Wealth Management, Inc | 4.454 | 561 | ||||||
| 2026-02-17 | 13F | Public Employees Retirement System Of Ohio | 198.628 | -3,48 | 24.612 | -7,29 | ||||
| 2026-02-04 | 13F | Bailard, Inc. | 0 | -100,00 | 0 | |||||
| 2026-01-22 | 13F | Bfsg, Llc | 1.075 | 0,00 | 133 | -3,62 | ||||
| 2026-02-17 | 13F | Northern Trust Corp | 1.038.722 | -0,26 | 128.708 | -4,20 | ||||
| 2026-04-02 | 13F | Ares Financial Consulting, LLC | 3 | 0,00 | 0 | |||||
| 2026-02-09 | 13F | Legal & General Group Plc | 1.080.585 | 6,41 | 133.895 | 2,21 | ||||
| 2026-02-13 | 13F | BNP Paribas Asset Management Holding S.A. | 164.562 | 1.519,23 | 20 | 1.900,00 | ||||
| 2026-04-28 | 13F | South Shore Capital Advisors | 3.359 | 8,95 | 423 | 10,73 | ||||
| 2026-03-06 | 13F | Hsbc Holdings Plc | 596.643 | 9,54 | 74.043 | 5,69 | ||||
| 2026-02-17 | 13F | Man Group plc | 6.900 | -18,82 | 855 | -22,08 | ||||
| 2026-02-17 | 13F | Alliancebernstein L.p. | 183.282 | 2,23 | 22.710 | -1,81 | ||||
| 2026-04-17 | 13F | Bell Investment Advisors, Inc | 4 | 0,00 | 1 | |||||
| 2026-01-12 | 13F | Rialto Wealth Management, LLC | 4 | 0,00 | 0 | |||||
| 2026-01-22 | 13F | Massachusetts Financial Services Co /ma/ | 2.322 | -99,62 | 288 | -99,64 | ||||
| 2026-02-12 | 13F | Xponance, Inc. | 16.161 | -0,36 | 2.003 | -4,30 | ||||
| 2026-01-22 | 13F | True North Advisors, LLC | 1.652 | 205 | ||||||
| 2026-02-17 | 13F | Delta Global Management LP | 19.395 | 2.403 | ||||||
| 2026-04-16 | 13F | E. Ohman J:or Asset Management AB | 4.277 | 0,00 | 539 | 1,70 | ||||
| 2026-02-13 | 13F | Ossiam | 0 | -100,00 | 0 | |||||
| 2026-01-30 | 13F | Us Bancorp \de\ | 4.026 | -11,26 | 499 | -14,87 | ||||
| 2026-02-17 | 13F | Two Sigma Investments, Lp | 6.100 | -45,05 | 756 | -47,24 | ||||
| 2026-02-17 | 13F | Norinchukin Bank, The | 5.390 | -4,09 | 668 | -7,87 | ||||
| 2025-11-14 | 13F | WealthTrak Capital Management LLC | 0 | -100,00 | 0 | |||||
| 2026-02-11 | 13F | Meeder Asset Management Inc | 67.242 | -13,94 | 8.332 | -17,34 | ||||
| 2026-02-13 | 13F | Taproot Management LP | 78.584 | 9.737 | ||||||
| 2026-02-17 | 13F | Aster Capital Management (DIFC) Ltd | 84 | -60,56 | 10 | -62,96 | ||||
| 2026-04-10 | 13F | Naviter Wealth, LLC | 8.635 | 11,18 | 1.097 | 13,09 | ||||
| 2026-02-05 | 13F | Gamco Investors, Inc. Et Al | 12.065 | 0,00 | 1.495 | -3,98 | ||||
| 2026-02-11 | 13F | GW&K Investment Management, LLC | 398.019 | 49 | ||||||
| 2026-02-13 | 13F | Toroso Investments, LLC | Call | 900 | 112 | |||||
| 2026-04-24 | 13F | Sumitomo Mitsui DS Asset Management Company, Ltd | 43.206 | 10,12 | 5.442 | 11,95 | ||||
| 2026-04-28 | 13F | Harbor Capital Advisors, Inc. | 0 | -100,00 | 0 | |||||
| 2026-02-13 | 13F | Toroso Investments, LLC | 77.365 | 10,94 | 9.586 | 6,57 | ||||
| 2025-11-04 | 13F | American Assets Capital Advisers, LLC | 4.609 | -52,00 | 595 | -51,07 | ||||
| 2026-02-17 | 13F | Creative Planning | 10.978 | -8,88 | 1.360 | -12,48 | ||||
| 2026-02-11 | 13F | Havemeyer Place LP | 4.150 | 514 | ||||||
| 2026-02-17 | 13F | Advisory Services Network, LLC | 0 | -100,00 | 0 | |||||
| 2026-03-20 | 13F | Purpose Unlimited Inc. | 1.837 | 228 | ||||||
| 2026-02-17 | 13F | Point72 Asset Management, L.P. | 151.440 | 18.765 | ||||||
| 2026-02-19 | 13F | CI Private Wealth, LLC | 93.608 | 3,96 | 11.582 | -0,29 | ||||
| 2026-02-13 | 13F | Ubs Asset Management Americas Inc | 1.474.162 | 37.933,08 | 182.663 | 36.432,60 | ||||
| 2026-01-30 | 13F | Levin Capital Strategies, L.p. | 0 | -100,00 | 0 | |||||
| 2026-04-27 | 13F | Fjarde Ap-fonden /fourth Swedish National Pension Fund | 82.358 | 154,13 | 10.374 | 158,36 | ||||
| 2026-02-04 | 13F | Summit Wealth Group Llc / Co | 0 | -100,00 | 0 | |||||
| 2026-02-09 | 13F | Hantz Financial Services, Inc. | 280 | -41,79 | 0 | |||||
| 2026-02-17 | 13F | Gotham Asset Management, LLC | 56.010 | 33,58 | 6.940 | 28,33 | ||||
| 2026-02-06 | 13F | Americana Partners, LLC | 2.020 | 250 | ||||||
| 2026-02-06 | 13F | Advisory Alpha, LLC | 3.000 | 0,00 | 372 | -3,89 | ||||
| 2026-02-05 | 13F | DnB Asset Management AS | 77.034 | 218,03 | 9.545 | 205,54 | ||||
| 2026-02-05 | 13F | Arbejdsmarkedets Tillaegspension | 189.036 | 23.423 | ||||||
| 2026-02-17 | 13F | Wiley Bros.-aintree Capital, Llc | 11.703 | 1,60 | 1.450 | -2,42 | ||||
| 2026-02-09 | 13F | Allstate Corp | 16.113 | 215,57 | 1.997 | 203,34 | ||||
| 2026-02-17 | 13F | Cander Asset Management LP | 23.200 | 2.875 | ||||||
| 2026-02-12 | 13F | Swiss National Bank | 342.960 | -6,79 | 42.496 | -10,47 | ||||
| 2026-03-03 | 13F/A | Integrated Investment Consultants, LLC | 13.383 | -0,56 | 1.658 | -4,49 | ||||
| 2026-02-10 | 13F | CIBC Asset Management Inc | 5.467 | 2,09 | 677 | -1,88 | ||||
| 2026-02-17 | 13F | DoubleLine ETF Adviser LP | 7.608 | 1,71 | 943 | -2,28 | ||||
| 2026-02-13 | 13F | Kempen Capital Management N.v. | 0 | -100,00 | 0 | |||||
| 2026-02-17 | 13F | Cetera Investment Advisers | 10.430 | -1,42 | 1.292 | -5,28 | ||||
| 2026-02-02 | 13F | Fifth Third Bancorp | 3.985 | -9,53 | 494 | -13,20 | ||||
| 2026-02-17 | 13F | Royal Bank Of Canada | Put | 0 | -100,00 | 0 | ||||
| 2026-02-02 | 13F | Cornerstone Planning Group LLC | 41 | -89,51 | 5 | -78,26 | ||||
| 2026-02-17 | 13F | Royal Bank Of Canada | Call | 0 | -100,00 | 0 | ||||
| 2026-02-05 | 13F | Plante Moran Financial Advisors, LLC | 509 | 0,00 | 63 | -3,08 | ||||
| 2026-04-15 | 13F | Activest Wealth Management | 0 | -100,00 | 0 | |||||
| 2026-02-17 | 13F | Wealth Watch Advisors, INC | 12 | 0,00 | 1 | 0,00 | ||||
| 2026-01-29 | 13F | Dunhill Financial, LLC | 6 | 1 | ||||||
| 2026-04-21 | 13F | Financial Consulate, Inc | 19 | 0,00 | 2 | 0,00 | ||||
| 2026-04-28 | 13F | Quent Capital, LLC | 111 | -21,83 | 14 | -17,65 | ||||
| 2026-04-13 | 13F | Massmutual Trust Co Fsb/adv | 143 | 0,00 | 18 | 5,88 | ||||
| 2026-04-22 | 13F | Pasadena Private Wealth, LLC | 0 | -100,00 | 0 | |||||
| 2026-02-11 | 13F | SOUTH STATE Corp | 4 | -50,00 | 0 | -100,00 | ||||
| 2026-01-30 | 13F | Caldwell Securities, Inc | 6 | 0,00 | 1 | |||||
| 2026-02-13 | 13F | Prudential Financial Inc | 310.750 | 52,21 | 38.505 | 46,20 | ||||
| 2026-02-04 | 13F | Pacer Advisors, Inc. | 3 | 0,00 | 0 | |||||
| 2026-02-12 | 13F | Penserra Capital Management LLC | 4.737 | 0,21 | 1 | |||||
| 2026-01-30 | 13F | Lincluden Management Ltd | 13.407 | -40,36 | 2 | -50,00 | ||||
| 2025-11-12 | 13F | Headlands Technologies LLC | 0 | -100,00 | 0 | |||||
| 2026-04-21 | 13F | Robeco Institutional Asset Management B.V. | 6.094 | -20,28 | 768 | -19,01 | ||||
| 2026-01-27 | 13F | Zurcher Kantonalbank (Zurich Cantonalbank) | 110.176 | 1,21 | 13.652 | -2,78 | ||||
| 2026-04-24 | 13F | IFM Investors Pty Ltd | 40.721 | -7,12 | 5.129 | 102.480,00 | ||||
| 2026-02-17 | 13F | Woodline Partners LP | 2.306 | 286 | ||||||
| 2026-02-13 | 13F | Wells Fargo & Company/mn | 149.266 | 1,03 | 18.496 | -2,95 | ||||
| 2026-02-17 | 13F/A | Uniplan Investment Counsel, Inc. | 55.646 | -0,94 | 6.895 | -4,84 | ||||
| 2026-01-30 | 13F | AMG National Trust Bank | 13.323 | -5,32 | 1.651 | -9,09 | ||||
| 2026-02-13 | 13F | Osmosis Investment Management UK Ltd | 2.148 | 268 | ||||||
| 2026-02-17 | 13F | Schonfeld Strategic Advisors LLC | 30.584 | 339,93 | 3.790 | 322,88 | ||||
| 2026-04-20 | 13F | Ronald Blue Trust, Inc. | 108 | -78,74 | 14 | -79,03 | ||||
| 2026-02-17 | 13F | Nomura Holdings Inc | 2.501 | -2,91 | 310 | -6,93 | ||||
| 2026-02-04 | 13F | Plato Investment Management Ltd | 4.674 | -6,01 | 582 | -8,65 | ||||
| 2026-02-17 | 13F | Qube Research & Technologies Ltd | 469.888 | 5.683,24 | 58.224 | 5.455,63 | ||||
| 2026-02-10 | 13F | Forsta Ap-fonden | 19.100 | -6,37 | 2.367 | -10,07 | ||||
| 2026-04-24 | 13F | Zwj Investment Counsel Inc | 1.900 | 0,00 | 239 | 1,70 | ||||
| 2026-02-13 | 13F | Banco Santander, S.A. | 4.432 | -1,34 | 549 | -5,18 | ||||
| 2026-02-17 | 13F | Toronto Dominion Bank | 20.031 | -3,41 | 2.482 | -7,21 | ||||
| 2026-02-04 | 13F | Swiss Life Asset Management Ltd | 8.380 | -21,40 | 1.038 | -24,51 | ||||
| 2026-02-10 | 13F | Nomura Asset Management Co Ltd | 212.647 | 1,69 | 26.349 | -2,32 | ||||
| 2026-02-11 | 13F | Empowered Funds, LLC | 3.281 | 0,74 | 407 | -3,33 | ||||
| 2026-02-04 | 13F | Virginia Retirement Systems Et Al | 25.180 | 0,00 | 3.120 | -3,94 | ||||
| 2026-04-15 | 13F | Fortitude Family Office, LLC | 36 | 0,00 | 5 | 0,00 | ||||
| 2026-01-27 | 13F | Lecap Asset Management Ltd | 0 | -100,00 | 0 | |||||
| 2026-02-12 | 13F | Johnson Financial Group, Inc. | 9 | 1 | ||||||
| 2026-04-23 | 13F | CWM Advisors, LLC | 14.987 | 3,85 | 1.888 | 5,54 | ||||
| 2026-04-28 | 13F | Everence Capital Management Inc | 3.837 | -13,52 | 0 | |||||
| 2026-01-28 | 13F | B. Metzler seel. Sohn & Co. AG | 2.841 | 0,00 | 352 | -3,83 | ||||
| 2026-02-05 | 13F | IMG Wealth Management, Inc. | 44 | 0,00 | 5 | 0,00 | ||||
| 2026-02-03 | 13F | ASR Vermogensbeheer N.V. | 2.760 | -1,22 | 342 | -5,28 | ||||
| 2026-02-06 | 13F | Envestnet Portfolio Solutions, Inc. | 1.623 | -2,81 | 201 | -6,51 | ||||
| 2026-02-06 | 13F | Global Retirement Partners, LLC | 924 | 294,87 | 114 | 280,00 | ||||
| 2026-02-10 | 13F | Gulf International Bank (UK) Ltd | 5.657 | 0,00 | 1 | |||||
| 2026-02-03 | 13F | International Assets Investment Management, Llc | 21 | 3 | ||||||
| 2025-11-14 | 13F | Waterfront Capital Partners, LLC | 0 | -100,00 | 0 | |||||
| 2026-02-11 | 13F | Illinois Municipal Retirement Fund | 26.525 | -47,14 | 3.287 | -49,23 | ||||
| 2026-04-27 | 13F | Truist Financial Corp | 9.625 | 7,18 | 1.212 | 8,99 | ||||
| 2026-01-12 | 13F | Heartwood Wealth Advisors LLC | 0 | -100,00 | 0 | |||||
| 2026-04-28 | 13F | Oversea-Chinese Banking CORP Ltd | 6.257 | -51,36 | 788 | -50,53 | ||||
| 2026-02-10 | 13F | Peapack Gladstone Financial Corp | 6.468 | -59,73 | 1 | -100,00 | ||||
| 2026-02-17 | 13F | Worldquant Millennium Advisors Llc | 13.730 | 1.701 | ||||||
| 2026-02-04 | 13F | First National Advisers, LLC | 14.425 | -4,27 | 1.787 | -8,03 | ||||
| 2026-01-23 | 13F | Freestone Capital Holdings, LLC | 0 | -100,00 | 0 | |||||
| 2026-02-12 | 13F | Cloud Capital Management, LLC | 0 | -100,00 | 0 | |||||
| 2025-11-05 | 13F | Checchi Capital Advisers, LLC | 0 | -100,00 | 0 | |||||
| 2026-02-11 | 13F | Heartland Advisors Inc | 42.367 | 5.250 | ||||||
| 2026-04-27 | 13F | Ethic Inc. | 9.178 | 15,07 | 1.156 | 17,00 | ||||
| 2026-02-17 | 13F | Wellington Management Group Llp | 5.039.870 | 12,35 | 624.490 | 7,92 | ||||
| 2026-02-09 | 13F | Catalyst Funds Management Pty Ltd | 4.800 | 595 | ||||||
| 2026-01-30 | 13F | Catalytic Wealth RIA, LLC | 0 | -100,00 | 0 | |||||
| 2026-02-11 | 13F | Metis Global Partners, LLC | 28.777 | 1,05 | 3.566 | -2,94 | ||||
| 2025-11-14 | 13F | Nfj Investment Group, Llc | 0 | -100,00 | 0 | |||||
| 2026-04-27 | 13F | Td Private Client Wealth Llc | 12 | 500,00 | 2 | |||||
| 2026-04-17 | 13F | Braeburn Wealth Management LLC | 3.426 | 3,01 | 432 | 4,61 | ||||
| 2025-11-13 | 13F/A | Peak6 Llc | Call | 0 | -100,00 | 0 | ||||
| 2026-04-15 | 13F | Gf Fund Management Co. Ltd. | 1.893 | -8,73 | 238 | -7,03 | ||||
| 2026-04-24 | 13F | Yousif Capital Management, Llc | 6.316 | 1,27 | 796 | 1,27 | ||||
| 2026-02-12 | 13F | Callan Family Office, LLC | 2.500 | 310 | ||||||
| 2026-02-17 | 13F | Magnetar Financial LLC | 28.906 | 314,42 | 3.582 | 298,33 | ||||
| 2026-02-10 | 13F | Bruce G. Allen Investments, LLC | 12 | 0,00 | 1 | 0,00 | ||||
| 2026-02-12 | 13F | Elo Mutual Pension Insurance Co | 0 | -100,00 | 0 | |||||
| 2026-02-05 | 13F | Elyxium Wealth, LLC | 6 | 1 | ||||||
| 2026-01-23 | 13F | Rsm Us Wealth Management Llc | 4.700 | -11,04 | 590 | -14,39 | ||||
| 2026-02-06 | 13F | Larson Financial Group LLC | 106 | -39,08 | 13 | -40,91 | ||||
| 2026-02-10 | 13F | Eurizon SLJ Capital Ltd | 451 | 56 | ||||||
| 2026-02-10 | 13F | Principia Wealth Advisory, LLC | 2 | 0,00 | 0 | |||||
| 2026-02-03 | 13F | Mitsubishi UFJ Kokusai Asset Management Co., Ltd. | 209.699 | 1,30 | 25.611 | -4,10 | ||||
| 2026-04-24 | 13F | UMA Financial Services, Inc. | 36 | 56,52 | 5 | 100,00 | ||||
| 2026-02-13 | 13F | Bank Of Nova Scotia | 8.174 | 71,08 | 1.013 | 64,45 | ||||
| 2026-02-13 | 13F | Heitman Real Estate Securities Llc | 71.360 | -70,53 | 8.842 | -71,69 | ||||
| 2026-02-13 | 13F | Barclays Plc | 203.893 | 7,28 | 25.264 | 3,05 | ||||
| 2026-04-24 | 13F | Strs Ohio | 121.933 | 58,28 | 15.359 | 60,90 | ||||
| 2026-01-21 | 13F | Prime Capital Investment Advisors, LLC | 0 | -100,00 | 0 | |||||
| 2026-02-06 | 13F | Pnc Financial Services Group, Inc. | 5.661 | 169,44 | 701 | 158,67 | ||||
| 2025-10-30 | 13F | Twin Peaks Wealth Advisors, LLC | 0 | -100,00 | 0 | |||||
| 2026-02-10 | 13F | Natixis Advisors, L.p. | 10.879 | -49,21 | 1 | -50,00 | ||||
| 2026-04-15 | 13F | NorthAvenue LLC | 0 | -100,00 | 0 | |||||
| 2026-02-12 | 13F | BRYN MAWR TRUST Co | 0 | -100,00 | 0 | -100,00 | ||||
| 2026-02-13 | 13F | Truvestments Capital Llc | 32 | 0,00 | 4 | -25,00 | ||||
| 2026-04-08 | 13F | Legacy Wealth Asset Management, LLC | 1.933 | 243 | ||||||
| 2026-02-13 | 13F | Baird Financial Group, Inc. | 4.357 | 4,09 | 540 | 0,00 | ||||
| 2025-11-13 | 13F | Kayne Anderson Rudnick Investment Management Llc | 0 | -100,00 | 0 | |||||
| 2026-02-11 | 13F | Livforsakringsbolaget Skandia, Omsesidigt | 700 | 0,00 | 87 | -3,33 | ||||
| 2026-02-17 | 13F | Weiss Asset Management LP | 0 | -100,00 | 0 | -100,00 | ||||
| 2026-04-16 | 13F | Capital Advisors, Ltd. LLC | 12 | 0,00 | 0 | |||||
| 2026-02-17 | 13F | Capstone Investment Advisors, Llc | 0 | -100,00 | 0 | -100,00 | ||||
| 2026-02-12 | 13F | Centersquare Investment Management Llc | 0 | -100,00 | 0 | |||||
| 2026-01-29 | 13F | IMC-Chicago, LLC | Put | 0 | -100,00 | 0 | ||||
| 2026-02-13 | 13F | Resources Investment Advisors, LLC. | 0 | -100,00 | 0 | |||||
| 2026-02-06 | 13F | Fairtree Asset Management (Pty) Ltd | 1.990 | 247 | ||||||
| 2026-02-17 | 13F | DV Trading LLC | 300 | 37 | ||||||
| 2026-02-17 | 13F | Fmr Llc | 4.868.784 | -7,75 | 603.291 | -11,39 | ||||
| 2026-01-22 | 13F | Bartlett & Co. Wealth Management Llc | 261 | 0,00 | 33 | -3,03 | ||||
| 2026-02-17 | 13F | Investment Management Corp of Ontario | 40.715 | 6,27 | 5.045 | 2,06 | ||||
| 2026-04-10 | 13F/A | OP Asset Management Ltd | 12.809 | -9,78 | 1.613 | -8,30 | ||||
| 2026-01-15 | 13F | Allspring Global Investments Holdings, LLC | 264.668 | -21,44 | 32.324 | -25,33 | ||||
| 2026-04-27 | 13F | Nixon Peabody Trust Co | 1.750 | -12,50 | 220 | -10,93 | ||||
| 2026-01-14 | 13F | Hunter Perkins Capital Management, LLC | 39.777 | -0,25 | 5 | -20,00 | ||||
| 2026-04-03 | 13F | Investors Research Corp | 22 | 3 | ||||||
| 2026-02-11 | 13F | Deutsche Bank Ag\ | 1.243.927 | 17,91 | 154.135 | 13,26 | ||||
| 2026-02-17 | 13F | Russell Investments Group, Ltd. | 798.380 | -15,25 | 98.929 | -18,60 | ||||
| 2026-02-12 | 13F | Paralel Advisors LLC | 16.094 | 0,00 | 1.994 | -3,95 | ||||
| 2026-02-12 | 13F | Aviva Plc | 101.719 | 5,69 | 12.604 | 1,53 | ||||
| 2026-02-17 | 13F | Raymond James Financial Inc | 118.825 | -5,39 | 14.724 | -9,12 | ||||
| 2026-02-13 | 13F | Capital Square, LLC | 8.638 | -35,19 | 1.070 | -37,75 | ||||
| 2026-02-17 | 13F | Hunting Hill Global Capital, LLC | 3.825 | 0,00 | 474 | -4,06 | ||||
| 2026-04-28 | 13F | Handelsbanken Fonder AB | 44.498 | 0,00 | 6 | 0,00 | ||||
| 2026-02-12 | 13F | Steward Partners Investment Advisory, Llc | 20.662 | -10,21 | 2.560 | -13,75 | ||||
| 2026-04-06 | 13F | Rosenberg Matthew Hamilton | 213 | -26,80 | 27 | -27,78 | ||||
| 2026-04-27 | 13F | Qrg Capital Management, Inc. | 3.158 | -42,38 | 398 | -41,53 | ||||
| 2026-02-10 | 13F | Kentucky Retirement Systems | 7.932 | 0,00 | 983 | -4,01 | ||||
| 2026-02-17 | 13F | Vinva Investment Management Ltd | 0 | -100,00 | 0 | |||||
| 2026-02-09 | 13F | Keating Financial Advisory Services, Inc. | 1 | 0 | ||||||
| 2026-02-17 | 13F | Delaware Management Holdings, Inc. | 29.739 | 3.685 | ||||||
| 2026-02-17 | 13F | Millennium Management Llc | 773.961 | 12,93 | 95.902 | 8,48 | ||||
| 2026-02-17 | 13F | Cambria Investment Management, L.P. | 4.653 | 577 | ||||||
| 2026-02-06 | 13F | Tortoise Investment Management, LLC | 0 | -100,00 | 0 | |||||
| 2025-11-06 | 13F | Atria Investments Llc | 0 | -100,00 | 0 | |||||
| 2026-02-09 | 13F | Quest Partners LLC | 1.319 | 163 | ||||||
| 2026-02-12 | 13F | Quadrant Capital Group Llc | 2.295 | -1,84 | 284 | -5,65 | ||||
| 2026-04-28 | 13F | Whittier Trust Co | 227.245 | -14,09 | 29.051 | -10,60 | ||||
| 2026-02-11 | 13F | Hughes Financial Services, LLC | 4 | 0,00 | 0 | |||||
| 2026-02-11 | 13F | Winnow Wealth Llc | 1 | 0,00 | 0 | |||||
| 2026-02-13 | 13F | Bridgefront Capital, LLC | 22.469 | 2.784 | ||||||
| 2026-02-17 | 13F | SummitTX Capital, L.P. | 42.893 | 30,88 | 5.315 | 25,72 | ||||
| 2026-02-06 | 13F | HighTower Advisors, LLC | 2.050 | -12,95 | 254 | -16,17 | ||||
| 2026-02-17 | 13F | Royal Bank Of Canada | 182.165 | -30,07 | 22.572 | -32,83 | ||||
| 2026-02-04 | 13F | Dynamic Wealth Strategies, LLC | 171 | 0,00 | 21 | -4,55 | ||||
| 2026-02-13 | 13F | Ieq Capital, Llc | 3.467 | 430 | ||||||
| 2026-02-05 | 13F/A | Fulcrum Asset Management LLP | 211 | 0,00 | 26 | -3,70 | ||||
| 2026-02-12 | 13F | EntryPoint Capital, LLC | 0 | -100,00 | 0 | |||||
| 2026-04-14 | 13F | Zrc Wealth Management, Llc | 18 | 38,46 | 2 | 100,00 | ||||
| 2026-02-11 | 13F | Prudential Plc | 3.769 | 0,00 | 467 | -3,91 | ||||
| 2026-04-20 | 13F | Provenance Wealth Advisors, LLC | 9 | 0,00 | 1 | 0,00 | ||||
| 2026-04-23 | 13F | North Star Investment Management Corp. | 60 | 9,09 | 8 | 16,67 | ||||
| 2026-02-05 | 13F | Thrivent Financial For Lutherans | 20.749 | 474,92 | 3 | |||||
| 2026-04-22 | 13F | Union Bancaire Privee, UBP SA | 5.548 | 524 | ||||||
| 2026-04-23 | 13F | Interchange Capital Partners, LLC | 0 | -100,00 | 0 | |||||
| 2026-02-10 | 13F | Machina Capital S.a.s. | 1.961 | 243 | ||||||
| 2026-02-13 | 13F | Schroder Investment Management Group | 197.207 | -44,91 | 24.538 | -46,87 | ||||
| 2026-01-29 | 13F | Vanguard Group Inc | 16.664.977 | -8,88 | 2.064.957 | -12,48 | ||||
| 2026-02-17 | 13F | Captrust Financial Advisors | 4.669 | 33,78 | 579 | 28,44 | ||||
| 2026-02-12 | 13F | Ensign Peak Advisors, Inc | 24.040 | -29,36 | 2.979 | -32,16 | ||||
| 2026-04-21 | 13F | Cannon Global Investment Management, LLC | 11.900 | 1.499 | ||||||
| 2026-02-13 | 13F | Centiva Capital, LP | 0 | -100,00 | 0 | |||||
| 2026-04-24 | 13F | Raiffeisen Bank International AG | 121 | 0,00 | 15 | 0,00 | ||||
| 2026-02-13 | 13F | Caxton Associates Llp | 1.676 | 208 | ||||||
| 2026-01-20 | 13F | AdvisorNet Financial, Inc | 0 | -100,00 | 0 | |||||
| 2026-02-10 | 13F | Fideuram Asset Management (Ireland) dac | 5 | 1 | ||||||
| 2026-02-13 | 13F | Great West Life Assurance Co /can/ | 225.711 | -0,17 | 28 | -6,90 | ||||
| 2026-02-13 | 13F | Kestra Advisory Services, LLC | 550 | 68 | ||||||
| 2026-02-12 | 13F | State Board Of Administration Of Florida Retirement System | 114.483 | 0,00 | 14.186 | -3,95 | ||||
| 2026-01-23 | 13F | Baillie Gifford & Co | 42.273 | -12,31 | 5.238 | -15,77 | ||||
| 2026-02-10 | 13F | Bank of New York Mellon Corp | 692.017 | 29,08 | 85.748 | 23,99 | ||||
| 2026-02-10 | 13F | Goldman Sachs Group Inc | 271.516 | -21,47 | 33.644 | -24,57 | ||||
| 2026-02-10 | 13F | ESL Trust Services, LLC | 0 | -100,00 | 0 | |||||
| 2026-04-13 | 13F | True Wealth Design, LLC | 88 | -17,76 | 11 | -15,38 | ||||
| 2026-02-13 | 13F | Verition Fund Management LLC | 9.100 | -89,04 | 1.128 | -89,48 | ||||
| 2026-02-11 | 13F | Buckingham Strategic Partners | 11.868 | -0,69 | 1.471 | -4,55 | ||||
| 2026-02-14 | 13F | Rockefeller Capital Management L.P. | 6.940 | 2,06 | 861 | -2,05 | ||||
| 2025-11-13 | 13F | Prudent Man Advisors, LLC | 0 | -100,00 | 0 | |||||
| 2026-01-14 | 13F | ORG Partners LLC | 44 | 5 | ||||||
| 2026-02-13 | 13F | Financial Network Wealth Advisors LLC | 146 | 0,69 | 18 | 0,00 | ||||
| 2026-04-07 | 13F | Park Avenue Securities Llc | 5.022 | -15,50 | 1 | |||||
| 2026-02-17 | 13F | Caisse De Depot Et Placement Du Quebec | 337.013 | 43,33 | 41.759 | 37,68 | ||||
| 2026-02-12 | 13F | MetLife Investment Management, LLC | 6.368 | -2,69 | 789 | -6,52 | ||||
| 2026-02-13 | 13F | National Bank Of Canada /fi/ | 1.763 | 93,95 | 218 | 86,32 | ||||
| 2026-02-09 | 13F | AIA Group Ltd | 7.966 | 987 | ||||||
| 2025-11-14 | 13F | Walleye Trading LLC | 0 | -100,00 | 0 | |||||
| 2026-02-13 | 13F | MAI Capital Management | 131 | 3,97 | 16 | 0,00 | ||||
| 2025-11-14 | 13F | Walleye Trading LLC | Call | 0 | -100,00 | 0 | ||||
| 2026-01-22 | 13F | Lee Financial Co | 0 | -100,00 | 0 | |||||
| 2026-02-17 | 13F | Landmark Investment Partners, L.p. | Call | 23.500 | 2.912 | |||||
| 2026-02-17 | 13F | Anson Funds Management LP | 23.000 | 2.850 | ||||||
| 2025-11-14 | 13F | Walleye Trading LLC | Put | 0 | -100,00 | 0 | ||||
| 2026-04-22 | 13F | Wiser Advisor Group LLC | 360 | 0,84 | 45 | 2,27 | ||||
| 2026-02-11 | 13F | Rise Advisors, LLC | 0 | -100,00 | 0 | |||||
| 2026-02-12 | 13F | Hrt Financial Lp | 137.697 | 17 | ||||||
| 2026-02-17 | 13F | GeoWealth Management, LLC | 6.104 | 13,92 | 756 | 9,41 | ||||
| 2026-02-12 | 13F | Brown Brothers Harriman & Co | 44 | -6,38 | 5 | -16,67 | ||||
| 2026-02-05 | 13F | Bessemer Group Inc | 192 | -84,31 | 0 | |||||
| 2026-02-17 | 13F | Janus Henderson Group Plc | 28.294 | 26,34 | 3.504 | 21,33 | ||||
| 2026-02-13 | 13F | Charles Schwab Investment Management Inc | 1.470.652 | 7,74 | 182.228 | 3,49 | ||||
| 2026-02-11 | 13F | Los Angeles Capital Management Llc | 0 | -100,00 | 0 | |||||
| 2026-02-11 | 13F | Simplex Trading, Llc | Put | 2.100 | -86,71 | 260 | 12.900,00 | |||
| 2026-02-12 | 13F | Rossby Financial, LCC | 16 | 2 | ||||||
| 2026-02-13 | 13F | BRITISH COLUMBIA INVESTMENT MANAGEMENT Corp | 22.174 | 20,88 | 2.748 | 16,10 | ||||
| 2026-02-13 | 13F | Quarry LP | 16 | 2 | ||||||
| 2026-02-11 | 13F | Simplex Trading, Llc | 1.416 | -62,67 | 175 | |||||
| 2026-04-20 | 13F | Jfs Wealth Advisors, Llc | 79 | 0,00 | 10 | 0,00 | ||||
| 2026-02-11 | 13F | Simplex Trading, Llc | Call | 500 | 150,00 | 62 | ||||
| 2026-02-18 | 13F | Mackenzie Financial Corp | 18.183 | 49,10 | 2.277 | 44,69 | ||||
| 2026-04-13 | 13F | Cascade Investment Advisors, Inc. | 10.698 | -0,23 | 1.348 | 1,43 | ||||
| 2026-02-17 | 13F | Holocene Advisors, LP | 3.144 | -66,75 | 390 | -68,09 | ||||
| 2026-04-27 | 13F | Pensionmark Financial Group, Llc | 1.911 | -0,42 | 241 | 1,27 | ||||
| 2026-01-30 | 13F/A | M&t Bank Corp | 14.616 | 499,75 | 1.811 | 474,92 | ||||
| 2026-02-13 | 13F | Cornerstone Financial Management LLC | 4 | 0 | ||||||
| 2026-04-20 | 13F | Vanderbilt University | 0 | -100,00 | 0 | |||||
| 2026-02-17 | 13F | Ameriprise Financial Inc | 96.765 | 431,38 | 12.000 | 408,86 | ||||
| 2026-02-13 | 13F | OMERS ADMINISTRATION Corp | 4.500 | 0,00 | 558 | -3,97 | ||||
| 2026-02-06 | 13F | Resona Asset Management Co.,Ltd. | 66.998 | -4,95 | 8.347 | -8,27 | ||||
| 2026-01-28 | 13F | Arizona State Retirement System | 34.358 | -9,08 | 4.257 | -12,66 | ||||
| 2026-01-27 | 13F | Tokio Marine Asset Management Co Ltd | 5.828 | 2,34 | 722 | -1,63 | ||||
| 2026-04-23 | 13F | TFC Financial Management | 1 | 0,00 | 0 | |||||
| 2026-02-09 | 13F | CBIZ Investment Advisory Services, LLC | 15 | 0,00 | 2 | 0,00 | ||||
| 2026-02-11 | 13F | Parallel Advisors, LLC | 718 | 22,32 | 89 | 17,33 | ||||
| 2026-04-13 | 13F | Gateway Investment Advisers Llc | 0 | -100,00 | 0 | |||||
| 2026-02-18 | 13F | GWM Advisors LLC | 1.497 | 0,00 | 186 | -4,15 | ||||
| 2026-01-28 | 13F | Salomon & Ludwin, LLC | 238 | -11,85 | 29 | -20,00 | ||||
| 2026-02-17 | 13F | Siemens Fonds Invest GmbH | 1.751 | 0,00 | 220 | -2,67 | ||||
| 2026-01-30 | 13F | American Capital Advisory, LLC | 0 | -100,00 | 0 | |||||
| 2026-02-13 | 13F | Martingale Asset Management L P | 7.036 | 872 | ||||||
| 2026-02-10 | 13F | Norges Bank | 6.079.930 | 753.364 | ||||||
| 2026-01-28 | 13F | Davis Capital Management | 0 | -100,00 | 0 | |||||
| 2026-02-10 | 13F | One Capital Management, LLC | 5.688 | 0,00 | 705 | -3,96 | ||||
| 2026-02-13 | 13F | Pathstone Holdings, LLC | 10.858 | -6,11 | 1.346 | -9,85 | ||||
| 2026-01-29 | 13F | UBS Group AG | 198.300 | -45,19 | 24.571 | -47,36 | ||||
| 2026-02-17 | 13F | Maryland State Retirement & Pension System | 6.141 | 0,00 | 761 | -4,04 | ||||
| 2026-02-13 | 13F | Alyeska Investment Group, L.P. | 409.461 | 24,99 | 50.736 | 20,06 | ||||
| 2026-02-12 | 13F | UniSuper Management Pty Ltd | 27.500 | -28,39 | 3.408 | -31,21 | ||||
| 2026-02-10 | 13F | Bnp Paribas Arbitrage, Sa | 162.403 | 111,39 | 20.123 | 103,06 | ||||
| 2026-01-28 | 13F | Klp Kapitalforvaltning As | 46.900 | 0,00 | 5.853 | -3,92 | ||||
| 2026-02-17 | 13F | ArrowMark Colorado Holdings LLC | 60.312 | -34,16 | 7.473 | -36,76 | ||||
| 2026-02-10 | 13F/A | Northwestern Mutual Wealth Management Co | 1.585 | 170,94 | 196 | 161,33 | ||||
| 2026-02-13 | 13F | Sei Investments Co | 580.005 | 8,71 | 71.868 | 4,42 | ||||
| 2026-02-13 | 13F | Citigroup Inc | 233.129 | 72,72 | 28.887 | 65,91 | ||||
| 2026-02-13 | 13F | Ostrum Asset Management | 7.787 | -24,89 | 965 | -27,90 | ||||
| 2026-02-13 | 13F | Entropy Technologies, LP | 36.449 | 234,79 | 4.516 | 221,65 | ||||
| 2026-02-06 | 13F | Abn Amro Investment Solutions | 4.340 | 538 | ||||||
| 2026-02-11 | 13F | Tacita Capital Inc | 13.962 | 60,34 | 1.730 | 54,05 | ||||
| 2026-02-09 | 13F | Waratah Capital Advisors Ltd. | 0 | -100,00 | 0 | |||||
| 2026-02-11 | 13F | Jpmorgan Chase & Co | 650.439 | 29,76 | 80.596 | 24,64 | ||||
| 2026-04-06 | 13F | GAMMA Investing LLC | 1.192 | 19,44 | 150 | 21,95 | ||||
| 2026-02-17 | 13F | Brevan Howard Capital Management LP | 3.110 | -48,92 | 385 | -50,96 | ||||
| 2026-01-30 | 13F | Wealthfront Advisers Llc | 27.133 | -2,50 | 3.362 | -6,32 | ||||
| 2026-04-23 | 13F | MQS Management LLC | 2.558 | 322 | ||||||
| 2026-01-27 | 13F | Bayforest Capital Ltd | 0 | -100,00 | 0 | |||||
| 2026-02-09 | 13F | Jefferies Financial Group Inc. | 0 | -100,00 | 0 | |||||
| 2026-04-06 | 13F | Highline Wealth Partners Llc | 51 | 0,00 | 6 | 0,00 | ||||
| 2026-01-28 | 13F | Teacher Retirement System Of Texas | 109.675 | -3,08 | 13.590 | -6,91 | ||||
| 2026-02-18 | 13F | Wahed Invest LLC | 3.220 | -6,12 | 399 | -9,95 | ||||
| 2026-02-12 | 13F | Federated Hermes, Inc. | 8.165 | 16,05 | 1.012 | 11,47 | ||||
| 2026-02-12 | 13F | BlackRock, Inc. | 10.663.302 | -6,76 | 1.321.290 | -10,44 | ||||
| 2026-04-28 | 13F | Whittier Trust Co Of Nevada Inc | 90.800 | -17,76 | 11.608 | -14,43 | ||||
| 2026-01-20 | 13F | Cromwell Holdings LLC | 14 | 0,00 | 2 | 0,00 | ||||
| 2026-02-17 | 13F | Blair William & Co/il | 6.247 | 1,15 | 774 | -2,76 | ||||
| 2026-02-13 | 13F | Pinnacle Wealth Planning Services, Inc. | 20 | 2 | ||||||
| 2025-11-04 | 13F | High Note Wealth, LLC | 0 | -100,00 | 0 | |||||
| 2026-01-21 | 13F | Flagship Harbor Advisors, Llc | 0 | -100,00 | 0 | |||||
| 2026-02-13 | 13F | Golden State Wealth Management, LLC | 0 | -100,00 | 0 | |||||
| 2026-02-12 | 13F | Voya Investment Management Llc | 9.619 | -13,29 | 1.192 | -16,71 | ||||
| 2026-02-12 | 13F | APG Asset Management N.V. | 62.571 | -10,23 | 6.602 | -13,73 | ||||
| 2026-02-12 | 13F | Andra AP-fonden | 51.700 | -23,52 | 6.406 | -26,54 | ||||
| 2026-04-13 | 13F | Global X Japan Co., Ltd. | 338 | 26,59 | 43 | 27,27 | ||||
| 2026-02-10 | 13F | Measured Wealth Private Client Group, LLC | 110 | 0,00 | 14 | -7,14 | ||||
| 2026-04-27 | 13F | V-Square Quantitative Management LLC | 548 | 36,66 | 69 | 40,82 | ||||
| 2026-02-13 | 13F | Police & Firemen's Retirement System of New Jersey | 18.847 | -6,67 | 2.335 | -10,36 | ||||
| 2026-01-12 | 13F | CVA Family Office, LLC | 70 | 70,73 | 9 | 60,00 | ||||
| 2026-02-09 | 13F | Huntington National Bank | 719 | 46,14 | 89 | 41,27 | ||||
| 2026-02-17 | 13F | State Of Wisconsin Investment Board | 91.407 | -8,51 | 11.326 | -12,12 | ||||
| 2026-02-17 | 13F | Freestone Grove Partners LP | 0 | -100,00 | 0 | |||||
| 2026-02-11 | 13F | Private Management Group Inc | 190.733 | -1,12 | 23.634 | -5,03 | ||||
| 2026-02-13 | 13F | Rhumbline Advisers | 152.941 | -2,31 | 18.951 | -6,16 | ||||
| 2026-02-13 | 13F | SRS Capital Advisors, Inc. | 1.727 | -16,93 | 214 | -20,52 | ||||
| 2025-11-06 | 13F | Whipplewood Advisors, LLC | 0 | -100,00 | 0 | -100,00 | ||||
| 2026-02-13 | 13F | LRT Capital Management, LLC | 0 | -100,00 | 0 | |||||
| 2026-01-20 | 13F | Independence Bank of Kentucky | 250 | 0,00 | 31 | -6,25 | ||||
| 2026-02-11 | 13F | Harvest Fund Management Co., Ltd | 588 | -27,23 | 0 | |||||
| 2026-02-09 | 13F | Annis Gardner Whiting Capital Advisors, LLC | 11 | 0,00 | 1 | 0,00 | ||||
| 2026-02-12 | 13F | New York State Common Retirement Fund | 73.147 | -2,66 | 9.064 | -6,50 | ||||
| 2026-02-17 | 13F | Nissay Asset Management Corp /japan/ /adv | 33.820 | 0,43 | 4.191 | -3,55 | ||||
| 2026-02-13 | 13F | Stifel Financial Corp | 5.850 | -4,72 | 725 | -8,59 | ||||
| 2026-01-30 | 13F | Mitsubishi UFJ Trust & Banking Corp | 158.294 | 10,12 | 19.614 | 5,78 | ||||
| 2026-04-07 | 13F | Farther Finance Advisors, LLC | 369 | -23,44 | 47 | -20,34 | ||||
| 2026-02-11 | 13F | Capital International Inc /ca/ | 3.027 | -9,26 | 375 | -12,79 | ||||
| 2026-04-27 | 13F | Sound Income Strategies, LLC | 9 | -62,50 | 1 | -66,67 | ||||
| 2026-02-19 | 13F | Invesco Ltd. | 264.235 | 9,14 | 32.741 | 4,83 | ||||
| 2025-11-12 | 13F | Phocas Financial Corp. | 0 | -100,00 | 0 | |||||
| 2025-11-14 | 13F | Tudor Investment Corp Et Al | 0 | -100,00 | 0 | |||||
| 2026-04-15 | 13F | Avanza Fonder AB | 6.213 | 1,64 | 783 | 3,30 | ||||
| 2026-02-06 | 13F | Covestor Ltd | 74 | -78,11 | 0 | |||||
| 2026-02-11 | 13F | Capital Analysts, Inc. | 136 | -0,73 | 0 | |||||
| 2026-01-14 | 13F | Kmg Fiduciary Partners, Llc | 0 | -100,00 | 0 | |||||
| 2026-02-03 | 13F | Sequoia Financial Advisors, LLC | 2.433 | -29,21 | 301 | -32,05 | ||||
| 2026-02-13 | 13F | Cetera Trust Company, N.A | 1.965 | 2,61 | 243 | -1,62 | ||||
| 2026-02-17 | 13F | Advisor Group Holdings, Inc. | 8.548 | -9,75 | 1.059 | -12,19 | ||||
| 2026-02-11 | 13F | LPL Financial LLC | 27.957 | -0,58 | 3.464 | -4,49 | ||||
| 2026-01-27 | 13F | Tributary Capital Management, LLC | 2.230 | -1,76 | 276 | -5,48 | ||||
| 2025-11-13 | 13F | Employees Retirement System of Texas | 0 | -100,00 | 0 | -100,00 | ||||
| 2026-02-12 | 13F | Advisors Asset Management, Inc. | 19.453 | 2,80 | 2.410 | -1,27 | ||||
| 2026-02-09 | 13F | Avalon Trust Co | 507 | 0,00 | 63 | -4,62 |
Other Listings
| DE:SCZ | 109,00 € |