Grundlæggende statistik
| Institutionelle ejere | 320 total, 320 long only, 0 short only, 0 long/short - change of 5,94% MRQ |
| Gennemsnitlig porteføljeallokering | 0.5412 % - change of 1,95% MRQ |
| Institutionelle aktier (lange) | 79.243.777 (ex 13D/G) - change of -0,39MM shares -0,49% MRQ |
| Institutionel værdi (lang) | $ 1.923.106 USD ($1000) |
Institutionelt ejerskab og aktionærer
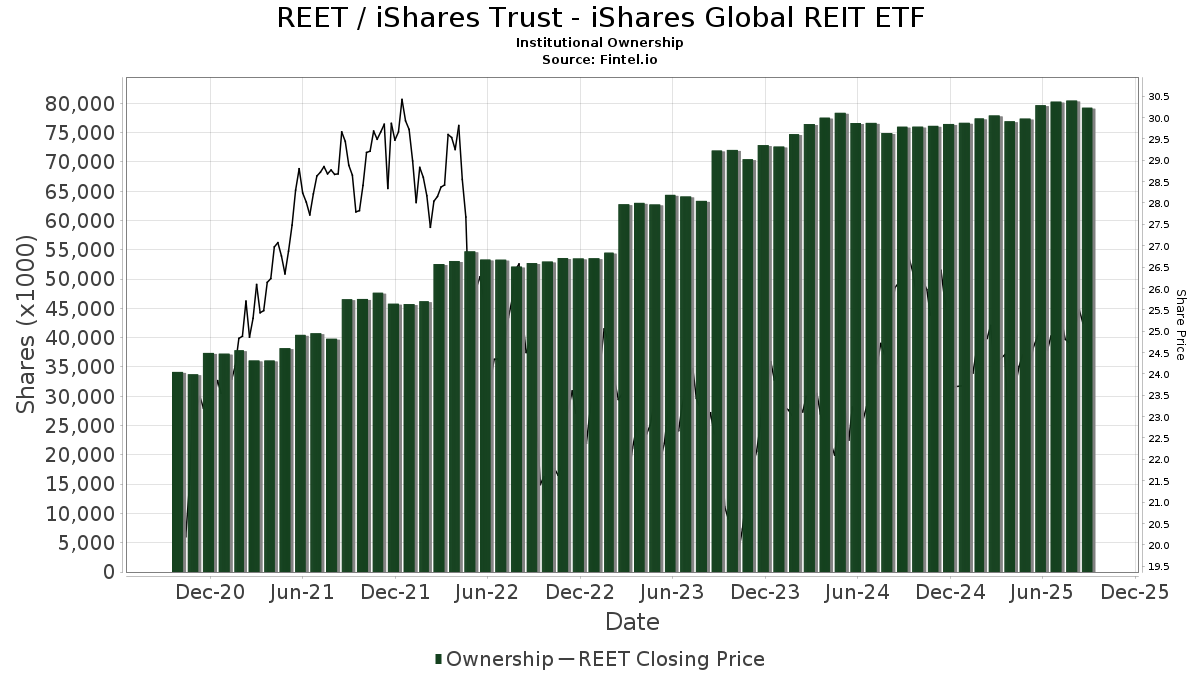
iShares Trust - iShares Global REIT ETF (US:REET) har 320 institutionelle ejere og aktionærer, der har indsendt 13D/G- eller 13F-formularer til Securities Exchange Commission (SEC). Disse institutioner har i alt 79,243,777 aktier. Største aktionærer omfatter Valmark Advisers, Inc., Hsbc Holdings Plc, Northwestern Mutual Wealth Management Co, BlackRock, Inc., M&t Bank Corp, Morgan Stanley, SageView Advisory Group, LLC, Savant Capital, LLC, Bank Of Montreal /can/, and Nepc Llc .
iShares Trust - iShares Global REIT ETF (ARCA:REET) institutionel ejerskabsstruktur viser aktuelle positioner i virksomheden efter institutioner og fonde, samt seneste ændringer i positionsstørrelse. Større aktionærer kan omfatte individuelle investorer, investeringsforeninger, hedgefonde eller institutioner. Skema 13D angiver, at investoren besidder (eller besidder) mere end 5 % af virksomheden og har til hensigt (eller har til hensigt at) aktivt at forfølge en ændring i forretningsstrategi. Skema 13G indikerer en passiv investering på over 5%.
The share price as of September 18, 2025 is 25,46 / share. Previously, on September 19, 2024, the share price was 26,98 / share. This represents a decline of 5,63% over that period.
Fondens stemningsscore
Fund Sentiment Score (fka Ownership Accumulation Score) finder de aktier, der bliver mest købt af fonde. Det er resultatet af en sofistikeret, multi-faktor kvantitativ model, der identificerer virksomheder med de højeste niveauer af institutionel akkumulering. Scoringsmodellen bruger en kombination af den samlede stigning i oplyste ejere, ændringerne i porteføljeallokeringer i disse ejere og andre målinger. Tallet går fra 0 til 100, hvor højere tal indikerer et højere niveau af akkumulering for sine jævnaldrende, og 50 er gennemsnittet.
Opdateringsfrekvens: Dagligt
Se Ownership Explorer, som giver en liste over højest rangerende virksomheder.
AI+ Ask Fintel’s AI assistant about iShares Trust - iShares Global REIT ETF.
Thinking of good questions…
Institutionel Put/Call-forhold
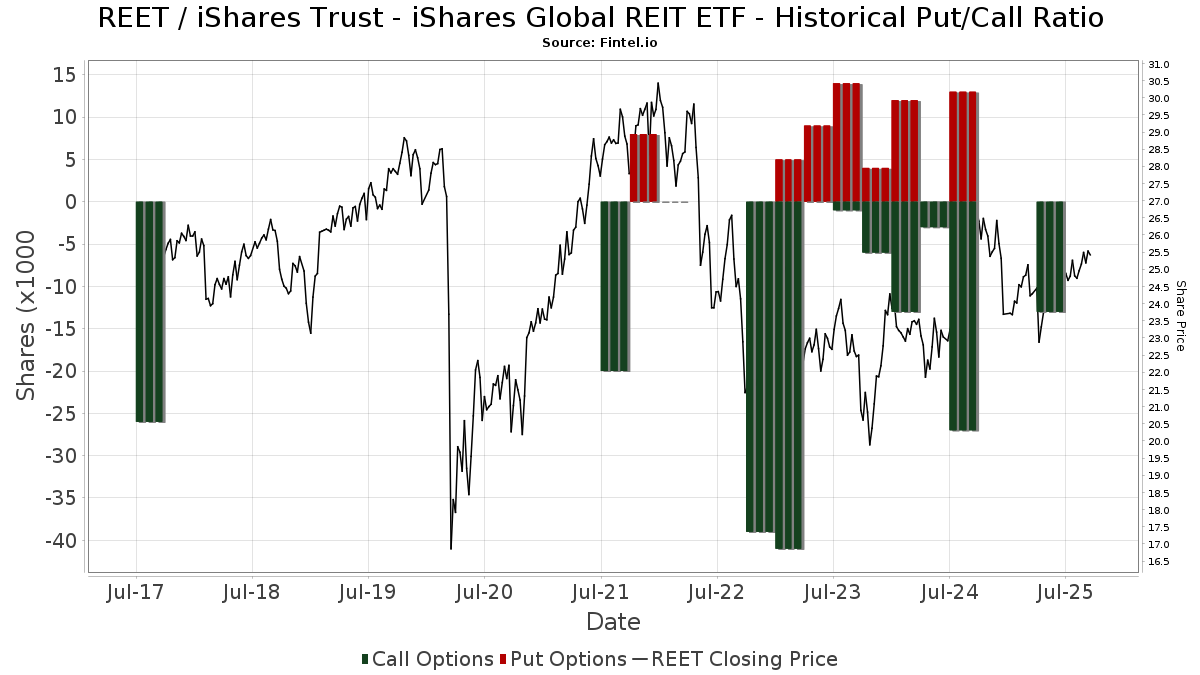
Ud over at indberette standardaktie- og gældsudstedelser skal institutter med mere end 100 mill. aktiver under forvaltning også oplyse deres put- og call-optionsbeholdninger. Da salgsoptioner generelt indikerer negativ stemning, og købsoptioner indikerer positiv stemning, kan vi få en fornemmelse af den overordnede institutionelle stemning ved at plotte forholdet mellem put og kald. Diagrammet til højre viser det historiske put/call-forhold for dette instrument.
Brug af Put/Call Ratio som en indikator for investorernes stemning overvinder en af de vigtigste mangler ved at bruge totalt institutionelt ejerskab, som er, at en betydelig mængde af aktiver under forvaltning investeres passivt for at spore indekser. Passivt forvaltede fonde køber typisk ikke optioner, så indikatoren for put/call-forholdet følger mere nøje følelsen af aktivt forvaltede fonde.
13F og NPORT arkivering
Detaljer om 13F-arkivering er gratis. Detaljer om NP-ansøgninger kræver et premium-medlemskab. Grønne rækker angiver nye positioner. Røde rækker angiver lukkede positioner. Klik på linket ikon for at se den fulde transaktionshistorik.
Opgrader
for at låse premium-data op og eksportere til Excel ![]() .
.
| Fil dato | Kilde | Investor | Type | Gennemsnitlig pris (Øst) |
Aktier | Δ Aktier (%) |
Rapporteret Værdi ($1000) |
Δ Værdi (%) |
Port Alloc (%) |
|
|---|---|---|---|---|---|---|---|---|---|---|
| 2025-08-14 | 13F | Boston Private Wealth Llc | 63.817 | -54,50 | 1.576 | -53,67 | ||||
| 2025-08-01 | 13F | Biltmore Family Office, LLC | 850 | 0,00 | 21 | 0,00 | ||||
| 2025-03-27 | NP | TCHDX - Transamerica ClearTrack 2035 R6 | 104.795 | 56,08 | 2.549 | 48,83 | ||||
| 2025-07-15 | 13F | Fifth Third Bancorp | 5.902 | 146 | ||||||
| 2025-08-06 | 13F | Golden State Wealth Management, LLC | 268 | 0,00 | 7 | 0,00 | ||||
| 2025-07-16 | 13F | Signaturefd, Llc | 876 | 0,46 | 22 | 0,00 | ||||
| 2025-08-15 | 13F | Captrust Financial Advisors | 20.048 | 0,01 | 495 | 1,85 | ||||
| 2025-08-26 | NP | Northern Lights Variable Trust - TOPS Moderate Growth ETF Portfolio Class 1 shares | 330.917 | 4,97 | 8.174 | 6,86 | ||||
| 2025-07-15 | 13F | Level Financial Advisors, Inc. | 41.840 | -15,46 | 1.033 | -13,92 | ||||
| 2025-08-07 | 13F | Allworth Financial LP | 10 | 0,00 | 0 | |||||
| 2025-08-13 | 13F | Parkworth Wealth Management, Inc. | 36.375 | 1,05 | 898 | 2,86 | ||||
| 2025-08-07 | 13F | Tacita Capital Inc | 4.262 | 0,00 | 105 | 1,94 | ||||
| 2025-08-14 | 13F | Royal Bank Of Canada | 889.389 | 24,75 | 21.969 | 27,03 | ||||
| 2025-08-14 | 13F | Goldman Sachs Group Inc | 1.203.517 | 3,35 | 29.727 | 5,22 | ||||
| 2025-08-14 | 13F | GWM Advisors LLC | 46.407 | -1,40 | 1.146 | 0,44 | ||||
| 2025-04-17 | 13F | Rs Crum Inc. | 131.280 | -0,38 | 3.185 | 0,82 | ||||
| 2025-07-09 | 13F | Seaside Wealth Management, Inc. | 19.336 | 4,55 | 478 | 6,47 | ||||
| 2025-08-13 | 13F | Transce3nd, LLC | 764 | 3,66 | 19 | 5,88 | ||||
| 2025-08-26 | NP | Northern Lights Variable Trust - TOPS Balanced ETF Portfolio Class 1 shares | 216.614 | 2,24 | 5.350 | 4,11 | ||||
| 2025-06-26 | NP | TCTKX - Transamerica ClearTrack 2025 R3 | 41.509 | 1.003 | ||||||
| 2025-04-11 | 13F | Davis Capital Management | 1 | 0,00 | 0 | |||||
| 2025-05-02 | 13F | Kooman & Associates | 0 | -100,00 | 0 | |||||
| 2025-08-06 | 13F | Commonwealth Equity Services, Llc | 453.964 | 21,72 | 11 | 22,22 | ||||
| 2025-03-27 | NP | TDITX - Transamerica ClearTrack 2025 R1 | 72.077 | 48,14 | 1.753 | 41,18 | ||||
| 2025-07-25 | 13F | Envestnet Portfolio Solutions, Inc. | 9.763 | -22,14 | 241 | -20,72 | ||||
| 2025-08-06 | 13F | New Millennium Group LLC | 664 | 0,00 | 16 | 0,00 | ||||
| 2025-07-21 | 13F | Red Mountain Financial, LLC | 13.940 | 324 | ||||||
| 2025-08-05 | 13F | GPS Wealth Strategies Group, LLC | 415 | 0,73 | 10 | 0,00 | ||||
| 2025-08-13 | 13F | EverSource Wealth Advisors, LLC | 6.869 | -75,38 | 170 | -75,00 | ||||
| 2025-07-07 | 13F | Investors Research Corp | 196 | 0,00 | 5 | 0,00 | ||||
| 2025-07-15 | 13F | Bfsg, Llc | 629 | 0,00 | 16 | 0,00 | ||||
| 2025-08-14 | 13F | D. E. Shaw & Co., Inc. | 15.558 | -12,56 | 384 | -10,90 | ||||
| 2025-08-13 | 13F | RFP Financial Group LLC | 140.404 | -2,16 | 3.468 | -0,40 | ||||
| 2025-08-14 | 13F | Wilshire Associates Inc | 0 | -100,00 | 0 | |||||
| 2025-08-26 | NP | Northern Lights Variable Trust - TOPS Aggressive Growth ETF Portfolio Class 2 shares | 374.828 | 9,54 | 9.258 | 11,53 | ||||
| 2025-04-28 | 13F | Redmont Wealth Advisors Llc | 18 | 0 | ||||||
| 2025-07-24 | 13F | Leo Wealth, LLC | 19.694 | 2,07 | 486 | 3,85 | ||||
| 2025-08-12 | 13F | BlackRock, Inc. | 4.936.996 | 0,01 | 121.944 | 1,82 | ||||
| 2025-08-07 | 13F | Resources Investment Advisors, LLC. | 13.770 | -27,34 | 340 | -25,93 | ||||
| 2025-07-23 | 13F | Elevate Wealth Advisory, Inc | 2.992 | 0,00 | 74 | 1,39 | ||||
| 2025-08-14 | 13F | Financial Advisory Service, Inc. | 79.280 | 3,27 | 1.958 | 5,16 | ||||
| 2025-08-11 | 13F | Diversified Portfolios, Inc. | 853.902 | 4,67 | 21.091 | 6,57 | ||||
| 2025-07-28 | 13F | Cutler Investment Counsel Llc | 272.096 | 9,80 | 6.721 | 11,80 | ||||
| 2025-07-31 | 13F | Asset Management One Co., Ltd. | 309.000 | -3,74 | 7.632 | -1,99 | ||||
| 2025-08-18 | 13F/A | National Bank Of Canada /fi/ | 3.216 | -63,12 | 79 | -62,56 | ||||
| 2025-07-24 | 13F | Morton Brown Family Wealth, LLC | 431.190 | 6,09 | 10.650 | 8,01 | ||||
| 2025-05-08 | 13F | Natixis Advisors, L.p. | 0 | -100,00 | 0 | |||||
| 2025-08-06 | 13F | Longview Financial Advisors LLC | 25.507 | -2,69 | 630 | -0,79 | ||||
| 2025-08-14 | 13F | UBS Group AG | 93.371 | 88,93 | 2.306 | 92,49 | ||||
| 2025-08-11 | 13F | Wealthspire Advisors, LLC | 192.801 | -3,79 | 4.762 | -2,04 | ||||
| 2025-07-10 | 13F | Sumitomo Mitsui DS Asset Management Company, Ltd | 1.038.021 | 2,10 | 25.639 | 3,95 | ||||
| 2025-07-14 | 13F | Harbor Group, Inc. | 26.600 | -1,39 | 657 | 0,46 | ||||
| 2025-07-23 | 13F | Valmark Advisers, Inc. | 5.816.994 | 1,80 | 143.680 | 3,64 | ||||
| 2025-08-14 | 13F | Old Mission Capital Llc | 66.334 | 1.638 | ||||||
| 2025-06-26 | NP | TCTLX - Transamerica ClearTrack 2030 R3 | 65.716 | 1.588 | ||||||
| 2025-05-16 | 13F | McIlrath & Eck, LLC | 0 | -100,00 | 0 | |||||
| 2025-08-14 | 13F | Mml Investors Services, Llc | 33.543 | 1,30 | 1 | |||||
| 2025-07-23 | 13F | Foundation Wealth Management, LLC | 48.785 | -1,59 | 1.205 | 0,17 | ||||
| 2025-08-14 | 13F | Toronto Dominion Bank | 150.000 | 4.770,13 | 3.705 | 4.906,76 | ||||
| 2025-05-15 | 13F | Talon Private Wealth, LLC | 0 | -100,00 | 0 | -100,00 | ||||
| 2025-07-31 | 13F | Waldron Private Wealth LLC | 382.996 | -2,17 | 9.460 | -0,39 | ||||
| 2025-08-14 | 13F | Qube Research & Technologies Ltd | 46.006 | 41,14 | 1.136 | 43,80 | ||||
| 2025-06-26 | NP | TCTMX - Transamerica ClearTrack 2035 R3 | 98.874 | 2.390 | ||||||
| 2025-08-05 | 13F | Scarborough Advisors, LLC | 13 | 0 | ||||||
| 2025-07-28 | 13F | Courier Capital Llc | 23.702 | -0,42 | 585 | 1,39 | ||||
| 2025-08-18 | 13F | Front Row Advisors LLC | 300 | -40,00 | 7 | -41,67 | ||||
| 2025-08-29 | 13F | Evolution Wealth Management Inc. | 334 | 8 | ||||||
| 2025-05-21 | 13F/A | Geneos Wealth Management Inc. | 0 | -100,00 | 0 | -100,00 | ||||
| 2025-08-14 | 13F | Guardian Wealth Advisors, Llc / Nc | 17.860 | 3,45 | 441 | 5,50 | ||||
| 2025-07-11 | 13F/A | Umb Bank N A/mo | 6.967 | -28,97 | 172 | -27,43 | ||||
| 2025-08-13 | 13F | Holos Integrated Wealth LLC | 332 | 0,00 | 8 | 0,00 | ||||
| 2025-08-07 | 13F | Hughes Financial Services, LLC | 0 | -100,00 | 0 | |||||
| 2025-07-30 | 13F | First Citizens Bank & Trust Co | 8.594 | -30,89 | 212 | -29,57 | ||||
| 2025-07-31 | 13F | Nisa Investment Advisors, Llc | 0 | -100,00 | 0 | |||||
| 2025-07-14 | 13F | Matrix Trust Co | 57.259 | 0,90 | 1 | 0,00 | ||||
| 2025-08-14 | 13F | Manufacturers Life Insurance Company, The | 383.113 | -30,68 | 9.463 | -29,43 | ||||
| 2025-06-03 | 13F/A | First National Bank Of Omaha | 21.163 | -34,42 | 513 | -34,23 | ||||
| 2025-08-13 | 13F | Beacon Pointe Advisors, LLC | 18.980 | -3,32 | 469 | -1,68 | ||||
| 2025-06-23 | NP | IYLD - iShares Morningstar Multi-Asset Income ETF | 235.485 | 135,53 | 5.692 | 134,10 | ||||
| 2025-08-15 | 13F | North Ridge Wealth Advisors, Inc. | 43.018 | -0,03 | 1.063 | 1,82 | ||||
| 2025-08-14 | 13F | Waterford Advisors, LLC | 34.411 | -88,51 | 7.477 | 2,92 | ||||
| 2025-07-07 | 13F | Accelerate Investment Advisors LLC | 40.204 | 3,86 | 993 | 5,75 | ||||
| 2025-08-14 | 13F | Jane Street Group, Llc | 975.311 | 24.090 | ||||||
| 2025-05-15 | 13F | SRS Capital Advisors, Inc. | 0 | -100,00 | 0 | |||||
| 2025-08-12 | 13F | Steward Partners Investment Advisory, Llc | 357 | 30,77 | 9 | 33,33 | ||||
| 2025-08-14 | 13F | Hrt Financial Lp | 20.929 | 39,60 | 1 | |||||
| 2025-03-27 | NP | TDFTX - Transamerica ClearTrack 2030 R1 | 84.053 | 50,56 | 2.044 | 43,54 | ||||
| 2025-07-08 | 13F | Zrc Wealth Management, Llc | 3.460 | 0,46 | 85 | 2,41 | ||||
| 2025-05-06 | 13F | Assetmark, Inc | 0 | -100,00 | 0 | |||||
| 2025-07-10 | 13F | Financial Management Network Inc | 11.797 | 1,13 | 294 | 15,29 | ||||
| 2025-07-31 | 13F | Buckingham Strategic Partners | 84.074 | 80,69 | 2.077 | 84,04 | ||||
| 2025-08-08 | 13F | Intrua Financial, LLC | 0 | -100,00 | 0 | |||||
| 2025-08-26 | NP | Northern Lights Variable Trust - TOPS Growth ETF Portfolio Class 2 shares | 415.990 | 10,12 | 10.275 | 12,11 | ||||
| 2025-08-08 | 13F | Capstone Financial Advisors, Inc. | 841.329 | 0,40 | 20.781 | 2,22 | ||||
| 2025-07-17 | 13F | XY Planning Network, Inc. | 58.651 | 1.449 | ||||||
| 2025-04-14 | 13F | Greenspring Advisors, LLC | 46.134 | 21,99 | 1.119 | 23,51 | ||||
| 2025-08-08 | 13F | Commonwealth Of Pennsylvania Public School Empls Retrmt Sys | 430.936 | 97,28 | 10.644 | 100,87 | ||||
| 2025-08-11 | 13F | One Capital Management, LLC | 577.488 | 0,62 | 14.264 | 2,43 | ||||
| 2025-08-06 | 13F | AE Wealth Management LLC | 30.550 | -5,42 | 755 | -3,70 | ||||
| 2025-07-23 | 13F | Prime Capital Investment Advisors, LLC | 11.652 | -11,13 | 288 | -9,75 | ||||
| 2025-08-12 | 13F | Franklin Resources Inc | 42.591 | -6,70 | 1.052 | -5,06 | ||||
| 2025-08-06 | 13F | SOUTH STATE Corp | 6.000 | 3,63 | 148 | 5,71 | ||||
| 2025-08-12 | 13F | Integrated Advisors Network LLC | 10.105 | 1,05 | 250 | 2,89 | ||||
| 2025-08-13 | 13F | Quadrature Capital Ltd | 0 | -100,00 | 0 | |||||
| 2025-08-15 | 13F | CI Private Wealth, LLC | 362.651 | -8,47 | 8.957 | -6,81 | ||||
| 2025-08-13 | 13F | Amundi | 700.000 | 0,00 | 17.416 | 4,93 | ||||
| 2025-07-30 | 13F | First Interstate Bank | 14.514 | 0,00 | 358 | 1,70 | ||||
| 2025-07-28 | 13F | WealthPlan Investment Management, LLC | 24.277 | 1,28 | 600 | 3,10 | ||||
| 2025-08-12 | 13F | Founders Financial Alliance, LLC | 79 | 0,00 | 2 | 0,00 | ||||
| 2025-08-05 | 13F | Bank Of Montreal /can/ | 1.950.176 | -27,95 | 48.169 | -26,64 | ||||
| 2025-08-04 | 13F | Spire Wealth Management | 0 | -100,00 | 0 | |||||
| 2025-05-15 | 13F/A | Orion Portfolio Solutions, LLC | 45.553 | 51,50 | 1.105 | 53,47 | ||||
| 2025-08-07 | 13F | Mitsubishi UFJ Kokusai Asset Management Co., Ltd. | 56.649 | 0,00 | 1.399 | 1,82 | ||||
| 2025-08-14 | 13F | Federation des caisses Desjardins du Quebec | 206 | 0,00 | 5 | 25,00 | ||||
| 2025-08-05 | 13F | Huntington National Bank | 116 | |||||||
| 2025-05-12 | 13F | Sandy Spring Bank | 8 | 0 | ||||||
| 2025-08-14 | 13F | Fmr Llc | 7.730 | 3,00 | 191 | 4,40 | ||||
| 2025-05-14 | 13F | Susquehanna International Group, Llp | 0 | -100,00 | 0 | |||||
| 2025-07-24 | 13F | Jfs Wealth Advisors, Llc | 85.500 | -11,39 | 2.112 | -9,79 | ||||
| 2025-08-13 | 13F | Quadrant Capital Group Llc | 0 | -100,00 | 0 | |||||
| 2025-06-26 | NP | TCTQX - Transamerica ClearTrack 2040 R3 | 95.628 | 2.311 | ||||||
| 2025-08-01 | 13F | Envestnet Asset Management Inc | 792.184 | 0,25 | 19.567 | 2,07 | ||||
| 2025-08-14 | 13F | Ameriprise Financial Inc | 35.888 | -4,99 | 884 | -3,49 | ||||
| 2025-07-15 | 13F | FLP Wealth Management, LLC | 0 | -100,00 | 0 | |||||
| 2025-08-05 | 13F | Castlekeep Investment Advisors Llc | 8.891 | 0,35 | 220 | 2,34 | ||||
| 2025-06-26 | NP | TCTTX - Transamerica ClearTrack 2045 R3 | 74.568 | 1.802 | ||||||
| 2025-08-12 | 13F | MAI Capital Management | 1.698 | -12,65 | 42 | -12,77 | ||||
| 2025-08-14 | 13F | Strive Asset Management, LLC | 0 | -100,00 | 0 | |||||
| 2025-08-14 | 13F | Betterment LLC | 15.906 | 44,14 | 0 | |||||
| 2025-05-02 | 13F | MB Generational Wealth, LLC | 69.563 | 31,02 | 1.688 | 32,63 | ||||
| 2025-08-08 | 13F | Financial Gravity Companies, Inc. | 424 | 0,00 | 10 | 0,00 | ||||
| 2025-07-08 | 13F | Peirce Capital Management, LLC | 47.371 | 1.170 | ||||||
| 2025-07-09 | 13F | Aurelius Family Office LLC | 96.381 | 4,26 | 2.381 | 6,16 | ||||
| 2025-08-14 | 13F | Sunbelt Securities, Inc. | 21.856 | 1,84 | 524 | 0,58 | ||||
| 2025-08-14 | 13F | Two Sigma Securities, Llc | 8.425 | 208 | ||||||
| 2025-07-03 | 13F | Collective Family Office Llc | 103.198 | 24,21 | 2.549 | 26,45 | ||||
| 2025-08-01 | 13F | Advisory Alpha, LLC | 8.097 | 200 | ||||||
| 2025-08-12 | 13F | Aviso Financial Inc. | 12.267 | 7,11 | 303 | 9,39 | ||||
| 2025-08-27 | 13F/A | Squarepoint Ops LLC | 17.236 | 426 | ||||||
| 2025-07-25 | 13F | Cwm, Llc | 12.788 | -27,67 | 0 | |||||
| 2025-08-05 | 13F | Hills Bank & Trust Co | 108.843 | 2.688 | ||||||
| 2025-07-21 | 13F | Mirae Asset Global Investments Co., Ltd. | 93.891 | -7,94 | 2.319 | 895,28 | ||||
| 2025-08-14 | 13F | Integrated Wealth Concepts LLC | 11.679 | -3,21 | 288 | -1,37 | ||||
| 2025-07-31 | 13F | Cambridge Investment Research Advisors, Inc. | 25.252 | 11,91 | 1 | |||||
| 2025-08-14 | 13F | Comerica Bank | 33.995 | 0,60 | 840 | 2,44 | ||||
| 2025-07-25 | 13F | Stonehage Fleming Financial Services Holdings Ltd | 4.845 | 0,00 | 120 | 1,71 | ||||
| 2025-07-29 | 13F | Aspiriant, Llc | 20.204 | -28,60 | 499 | -27,26 | ||||
| 2025-08-14 | 13F | Citadel Advisors Llc | Call | 13.000 | 321 | |||||
| 2025-08-13 | 13F | M&t Bank Corp | 4.912.571 | -0,09 | 121.341 | 1,72 | ||||
| 2025-06-30 | 13F/A | Deutsche Bank Ag\ | 0 | -100,00 | 0 | |||||
| 2025-08-15 | 13F | Morgan Stanley | 3.392.807 | -0,06 | 83.802 | 1,75 | ||||
| 2025-06-26 | NP | TCTUX - Transamerica ClearTrack 2050 R3 | 67.506 | 1.632 | ||||||
| 2025-05-01 | 13F | Quest 10 Wealth Builders, Inc. | 236 | -11,61 | 6 | -16,67 | ||||
| 2025-07-21 | 13F | Creative Capital Management Investments LLC | 1.836 | 0,00 | 45 | 2,27 | ||||
| 2025-07-22 | 13F | SOL Capital Management CO | 150.600 | -0,02 | 4 | 0,00 | ||||
| 2025-08-08 | 13F | Cetera Investment Advisers | 304.892 | -2,42 | 7.531 | -0,65 | ||||
| 2025-08-07 | 13F | Aegis Wealth Management LLC | 54.808 | 0,00 | 1.330 | 0,00 | ||||
| 2025-08-14 | 13F | DZ BANK AG Deutsche Zentral Genossenschafts Bank, Frankfurt am Main | 39.747 | -21,40 | 982 | -19,98 | ||||
| 2025-09-04 | 13F/A | Advisor Group Holdings, Inc. | 135.406 | -8,81 | 3.345 | -7,16 | ||||
| 2025-08-11 | 13F | Aptus Capital Advisors, LLC | 20.437 | 3,00 | 505 | 4,78 | ||||
| 2025-08-14 | 13F | Mercer Global Advisors Inc /adv | 93.628 | -10,86 | 2.313 | -9,26 | ||||
| 2025-08-12 | 13F | Pathstone Holdings, LLC | 16.722 | -45,25 | 413 | -44,19 | ||||
| 2025-07-24 | 13F | Brandywine Oak Private Wealth Llc | 624.804 | 2,03 | 15.433 | 3,88 | ||||
| 2025-08-11 | 13F | Nicola Wealth Management Ltd. | 903.300 | -19,94 | 22.312 | -18,49 | ||||
| 2025-08-05 | 13F | Integrity Financial Corp /WA | 191 | 0,00 | 5 | 0,00 | ||||
| 2025-08-12 | 13F | LPL Financial LLC | 1.617.901 | 2,98 | 39.962 | 4,85 | ||||
| 2025-08-12 | 13F | Insigneo Advisory Services, Llc | 21.986 | -23,83 | 543 | -22,43 | ||||
| 2025-08-06 | 13F | Capasso Planning Partners LLC | 76.024 | -27,50 | 1.878 | -26,19 | ||||
| 2025-07-30 | 13F | Clune & Associates, Ltd. | 64.780 | 10,43 | 1.600 | 12,44 | ||||
| 2025-07-15 | 13F | Maseco Llp | 8.999 | 222 | ||||||
| 2025-07-24 | 13F | Us Bancorp \de\ | 24.275 | 0,00 | 600 | 1,87 | ||||
| 2025-08-14 | 13F | First Foundation Advisors | 9.254 | 0,00 | 229 | 1,79 | ||||
| 2025-07-17 | 13F | Symmetry Partners, LLC | 28.135 | -3,90 | 695 | -2,25 | ||||
| 2025-07-02 | 13F | Boston Standard Wealth Management, LLC | 612.418 | 11,11 | 15.127 | 18,05 | ||||
| 2025-08-13 | 13F | Continuum Advisory, LLC | 0 | -100,00 | 0 | |||||
| 2025-07-14 | 13F | Foster Group, Inc. | 44.434 | -7,82 | 1.098 | -6,16 | ||||
| 2025-07-31 | 13F | 180 Wealth Advisors, Llc | 32.426 | 2,05 | 801 | 3,76 | ||||
| 2025-08-12 | 13F | Virtu Financial LLC | 0 | -100,00 | 0 | |||||
| 2025-08-14 | 13F | Stifel Financial Corp | 11.656 | 3,22 | 288 | 5,13 | ||||
| 2025-07-10 | 13F | Brooklyn FI, LLC | 309.953 | 15,92 | 7.656 | 18,02 | ||||
| 2025-08-06 | 13F | Decker Retirement Planning Inc. | 43 | 1 | ||||||
| 2025-08-14 | 13F | Bnp Paribas Arbitrage, Sa | 417.800 | -18,08 | 10.320 | -16,59 | ||||
| 2025-05-09 | 13F | McMill Wealth Management | 0 | -100,00 | 0 | |||||
| 2025-07-17 | 13F | Wolff Wiese Magana Llc | 200 | 0,00 | 5 | 0,00 | ||||
| 2025-08-11 | 13F | HighTower Advisors, LLC | 1.164.926 | -0,90 | 28.774 | 0,90 | ||||
| 2025-07-03 | 13F | McLean Asset Management Corp | 22.049 | -0,85 | 549 | 14,17 | ||||
| 2025-08-12 | 13F | O'shaughnessy Asset Management, Llc | 1.823 | -40,91 | 45 | -39,19 | ||||
| 2025-07-11 | 13F | Farther Finance Advisors, LLC | 39.019 | 708,52 | 964 | 723,08 | ||||
| 2025-07-18 | 13F | Trust Co Of Vermont | 10.007 | 150,74 | 247 | 157,29 | ||||
| 2025-04-29 | 13F | Traveka Wealth, LLC | 0 | -100,00 | 0 | |||||
| 2025-07-31 | 13F | Orion Capital Management LLC | 5.457 | 0,17 | 135 | 1,52 | ||||
| 2025-05-13 | 13F | Heck Capital Advisors, LLC | 0 | -100,00 | 0 | -100,00 | ||||
| 2025-08-13 | 13F | Capital Analysts, Inc. | 10.320 | 0,00 | 0 | |||||
| 2025-07-21 | 13F | Credential Qtrade Securities Inc. | 11.053 | 16,34 | 262 | 13,97 | ||||
| 2025-07-07 | 13F | Versant Capital Management, Inc | 56 | 0,00 | 1 | 0,00 | ||||
| 2025-08-07 | 13F | Rathbone Brothers plc | 21.486 | -16,50 | 531 | -15,06 | ||||
| 2025-08-15 | 13F | Urban Financial Advisory Corp | 2.613 | 0,77 | 65 | 3,23 | ||||
| 2025-08-13 | 13F | Northwestern Mutual Wealth Management Co | 5.013.169 | 2,71 | 123.825 | 4,58 | ||||
| 2025-04-22 | 13F/A | NorthRock Partners, LLC | 0 | -100,00 | 0 | |||||
| 2025-03-27 | NP | TCHTX - Transamerica ClearTrack 2020 R1 | 407 | -97,77 | 10 | -98,06 | ||||
| 2025-08-12 | 13F | NFP Retirement, Inc. | 65.804 | -14,15 | 1.625 | -12,59 | ||||
| 2025-08-14 | 13F | Colony Group, LLC | 276.997 | 17,96 | 6.842 | 20,10 | ||||
| 2025-08-14 | 13F | Raymond James Financial Inc | 93.836 | 11,70 | 2.318 | 13,69 | ||||
| 2025-07-08 | 13F | Apella Capital, LLC | 89.822 | -21,86 | 2.222 | -15,51 | ||||
| 2025-08-01 | 13F | Chilton Capital Management Llc | 1.138 | 28 | ||||||
| 2025-07-15 | 13F | Total Wealth Planning, Llc | 20.373 | -2,45 | 503 | -0,59 | ||||
| 2025-08-06 | 13F | Savant Capital, LLC | 2.624.235 | 9,22 | 64.819 | 11,20 | ||||
| 2025-08-05 | 13F | Avant Financial Advisors LLC | 26.976 | 4,07 | 666 | 6,05 | ||||
| 2025-07-23 | 13F | Abel Hall, LLC | 15.240 | -13,37 | 376 | -11,74 | ||||
| 2025-05-16 | 13F | Arete Wealth Advisors, LLC | 0 | -100,00 | 0 | |||||
| 2025-08-07 | 13F | Prime Buchholz LLC | 235.330 | -26,31 | 5.813 | -24,97 | ||||
| 2025-08-25 | 13F/A | Promus Capital, LLC | 2.758 | 68 | ||||||
| 2025-08-06 | 13F | Modera Wealth Management, LLC | 1.181.583 | 11,80 | 29.185 | 13,83 | ||||
| 2025-03-27 | NP | TCRTX - Transamerica ClearTrack 2040 R1 | 131.547 | 48,74 | 3.199 | 41,80 | ||||
| 2025-03-27 | NP | TCITX - Transamerica ClearTrack Retirement Income R1 | 112.048 | 254,20 | 2.725 | 238,09 | ||||
| 2025-07-21 | 13F | Ameritas Advisory Services, LLC | 7.700 | -58,81 | 190 | -58,06 | ||||
| 2025-08-14 | 13F | Peapack Gladstone Financial Corp | 15.092 | 10,76 | 0 | |||||
| 2025-07-28 | 13F | BRYN MAWR TRUST Co | 500 | 12 | ||||||
| 2025-08-08 | 13F | Hartland & Co., LLC | 8.724 | -10,98 | 215 | -9,28 | ||||
| 2025-07-15 | 13F | Alhambra Investment Partners LLC | 172.869 | -0,13 | 4.270 | 1,67 | ||||
| 2025-08-14 | 13F | Quantinno Capital Management LP | 0 | -100,00 | 0 | |||||
| 2025-04-15 | 13F | Corrigan Financial, Inc. | 189.624 | -1,07 | 4.600 | 0,13 | ||||
| 2025-07-17 | 13F | Raleigh Capital Management Inc. | 649 | 0,78 | 16 | 6,67 | ||||
| 2025-07-08 | 13F | Nbc Securities, Inc. | 3.530 | 1.383,19 | 0 | |||||
| 2025-07-28 | 13F | Harbour Investments, Inc. | 9 | -94,27 | 0 | -100,00 | ||||
| 2025-07-29 | 13F | Aire Advisors, Llc | 13.050 | 4,07 | 322 | 5,92 | ||||
| 2025-08-12 | 13F | Proequities, Inc. | 0 | 0 | ||||||
| 2025-08-26 | NP | Northern Lights Variable Trust - TOPS Managed Risk Moderate Growth ETF Portfolio Class 1 shares | 145.625 | -4,39 | 3.597 | -2,65 | ||||
| 2025-05-05 | 13F | Nwam Llc | 0 | -100,00 | 0 | |||||
| 2025-07-24 | 13F | Callan Family Office, LLC | 99.216 | -14,43 | 2.451 | -12,87 | ||||
| 2025-08-04 | 13F | Creative Financial Designs Inc /adv | 142 | 0,00 | 4 | 0,00 | ||||
| 2025-07-31 | 13F | BIP Wealth, LLC | 448.210 | -0,74 | 11.071 | 1,06 | ||||
| 2025-08-14 | 13F | Nepc Llc | 1.851.623 | 18,54 | 45.735 | 20,69 | ||||
| 2025-03-27 | NP | TCSOX - Transamerica ClearTrack 2060 Class R1 | 6.639 | 24,75 | 161 | 19,26 | ||||
| 2025-07-23 | 13F | TPG Financial Advisors, LLC | 0 | -100,00 | 0 | |||||
| 2025-05-15 | 13F | Cullen Capital Management, LLC | 0 | -100,00 | 0 | -100,00 | ||||
| 2025-07-31 | 13F | Glass Jacobson Investment Advisors llc | 0 | -100,00 | 0 | |||||
| 2025-05-14 | 13F | Family Wealth Group, LLC | 0 | -100,00 | 0 | -100,00 | ||||
| 2025-08-13 | 13F | Sumitomo Mitsui Financial Group, Inc. | 100.850 | 3,96 | 2.491 | 5,82 | ||||
| 2025-07-17 | 13F | SC&H Financial Advisors, Inc. | 126.454 | -0,61 | 3.123 | 1,20 | ||||
| 2025-08-14 | 13F | Mariner, LLC | 13.527 | 0,21 | 334 | 2,14 | ||||
| 2025-07-09 | 13F | Triumph Capital Management | 0 | -100,00 | 0 | |||||
| 2025-03-27 | NP | TCPTX - Transamerica ClearTrack 2045 R1 | 90.717 | 47,52 | 2.206 | 40,69 | ||||
| 2025-07-24 | 13F | IFP Advisors, Inc | 6.682 | -59,22 | 165 | -58,44 | ||||
| 2025-08-27 | 13F/A | Brinker Capital Investments, LLC | 43.780 | -3,89 | 1.081 | -2,17 | ||||
| 2025-07-14 | 13F | AdvisorNet Financial, Inc | 4.187 | 15,86 | 103 | 18,39 | ||||
| 2025-08-08 | 13F | Pnc Financial Services Group, Inc. | 16.356 | 0,13 | 404 | 1,77 | ||||
| 2025-08-11 | 13F | Brown Brothers Harriman & Co | 2.780 | 69 | ||||||
| 2025-07-25 | 13F | Keener Financial Planning LLC | 406 | 99,02 | 0 | |||||
| 2025-05-15 | 13F | Wealth Management Nebraska | 0 | -100,00 | 0 | |||||
| 2025-07-07 | 13F | Upper Left Wealth Management, LLC | 8.331 | 206 | ||||||
| 2025-08-08 | 13F | Creative Planning | 245.241 | -1,10 | 6.057 | 0,68 | ||||
| 2025-08-08 | 13F | Larson Financial Group LLC | 33.349 | -20,27 | 824 | -18,84 | ||||
| 2025-08-12 | 13F | Horizon Financial Services, Llc | 2.016 | 1,36 | 50 | 2,08 | ||||
| 2025-07-17 | 13F | Heritage Investment Group, Inc. | 1.575.201 | 1,05 | 38.907 | 2,88 | ||||
| 2025-08-12 | 13F | CIBC Private Wealth Group, LLC | 68.060 | 11,58 | 1.681 | 27,74 | ||||
| 2025-08-19 | 13F/A | Pitcairn Co | 8.350 | 0,00 | 206 | 1,98 | ||||
| 2025-05-09 | 13F | GeoWealth Management, LLC | 0 | -100,00 | 0 | |||||
| 2025-05-02 | 13F/A | Voya Investment Management Llc | 0 | -100,00 | 0 | |||||
| 2025-07-29 | 13F | Private Wealth Management Group, LLC | 17.348 | -7,44 | 428 | -5,73 | ||||
| 2025-05-15 | 13F | Tower Research Capital LLC (TRC) | 0 | -100,00 | 0 | |||||
| 2025-08-13 | 13F | SageView Advisory Group, LLC | 2.951.690 | 10,82 | 73.025 | 13,02 | ||||
| 2025-07-18 | 13F | Naples Global Advisors, Llc | 287.456 | 7,75 | 7.100 | 9,70 | ||||
| 2025-08-14 | 13F | Murphy & Mullick Capital Management Corp | 420 | 0,00 | 10 | 0,00 | ||||
| 2025-05-15 | 13F | Macquarie Group Ltd | 0 | -100,00 | 0 | |||||
| 2025-08-14 | 13F | MidWestOne Financial Group, Inc. | 39.592 | -24,08 | 978 | -22,77 | ||||
| 2025-06-26 | NP | TCTZX - Transamerica ClearTrack Retirement Income R3 | 81.338 | 1.966 | ||||||
| 2025-08-04 | 13F | Pensionmark Financial Group, Llc | 315.973 | -2,54 | 7.805 | -0,78 | ||||
| 2025-07-09 | 13F | Parkside Advisors LLC | 11.206 | 277 | ||||||
| 2025-08-13 | 13F | IAG Wealth Partners, LLC | 3.584 | 0,00 | 89 | 2,33 | ||||
| 2025-08-12 | 13F | TCTC Holdings, LLC | 2.899 | 72 | ||||||
| 2025-07-24 | 13F | Lester Murray Antman dba SimplyRich | 169.422 | -4,02 | 4 | 0,00 | ||||
| 2025-07-22 | 13F | Simplicity Wealth,LLC | 33.293 | 19,92 | 822 | 22,14 | ||||
| 2025-08-04 | 13F | Capital Performance Advisors Llp | 40.993 | 0,03 | 1.013 | 1,81 | ||||
| 2025-08-12 | 13F | Ci Investments Inc. | 20.368 | -4,00 | 1 | |||||
| 2025-07-31 | 13F | Money Design Co.,Ltd. | 492.368 | -26,26 | 12 | -25,00 | ||||
| 2025-07-11 | 13F | Caldwell Securities, Inc | 143 | 0,00 | 4 | 0,00 | ||||
| 2025-08-13 | 13F | Hsbc Holdings Plc | 5.681.021 | 0,00 | 140.321 | 1,81 | ||||
| 2025-08-08 | 13F | Bailard, Inc. | 304.540 | 0,82 | 7.522 | 2,66 | ||||
| 2025-08-11 | 13F | Great Lakes Advisors, Llc | 115.379 | 3,68 | 2.850 | 5,56 | ||||
| 2025-08-14 | 13F | Warren Averett Asset Management, LLC | 69.517 | 0,00 | 1.717 | 1,84 | ||||
| 2025-08-14 | 13F | Ancora Advisors, LLC | 391 | 10 | ||||||
| 2025-07-16 | 13F | Diversified Enterprises, LLC | 0 | -100,00 | 0 | |||||
| 2025-07-28 | 13F | Rosenberg Matthew Hamilton | 1.902 | -0,99 | 47 | 0,00 | ||||
| 2025-07-01 | 13F | GP Brinson Investments LLC | 186.339 | 0,00 | 4.603 | 1,81 | ||||
| 2025-07-10 | 13F | Waypoint Wealth Partners Inc. | 39.050 | 0,00 | 965 | 1,80 | ||||
| 2025-07-17 | 13F | Emerald Advisors, LLC | 92.492 | 2,40 | 2.285 | 4,24 | ||||
| 2025-07-25 | 13F | Hazlett, Burt & Watson, Inc. | 100 | 0,00 | 0 | |||||
| 2025-08-13 | 13F | StoneX Group Inc. | 9.768 | 241 | ||||||
| 2025-07-28 | 13F | Morris Financial Concepts, Inc. | 50.484 | -1,31 | 1.247 | 0,40 | ||||
| 2025-08-12 | 13F | Jpmorgan Chase & Co | 56.246 | -5,58 | 1.389 | -3,88 | ||||
| 2025-08-04 | 13F | Creekmur Asset Management LLC | 0 | 0 | ||||||
| 2025-07-16 | 13F | St Germain D J Co Inc | 4.250 | 0,00 | 105 | 0,97 | ||||
| 2025-07-22 | 13F | Valley National Advisers Inc | 1.203 | -49,33 | 0 | |||||
| 2025-07-28 | 13F | Rik Saylor Financial, Inc. | 12.993 | -1,22 | 321 | 0,31 | ||||
| 2025-07-30 | 13F | Phillips Financial Management, Llc | 4.500 | 0,00 | 111 | 1,83 | ||||
| 2025-08-14 | 13F | City National Bank Of Florida /msd | 33.293 | 17,13 | 822 | 19,30 | ||||
| 2025-07-17 | 13F | ERn Financial, LLC | 412.357 | -0,16 | 10.185 | 1,66 | ||||
| 2025-08-14 | 13F | Partners Capital Investment Group, Llp | 1.338.032 | -57,80 | 33.049 | -57,04 | ||||
| 2025-03-27 | NP | TCTOX - Transamerica ClearTrack 2055 Class R1 | 11.877 | 73,31 | 289 | 65,52 | ||||
| 2025-08-07 | 13F | Gryphon Financial Partners LLC | 26.773 | 1,08 | 661 | 2,96 | ||||
| 2025-07-16 | 13F | Leading Edge Financial Planning LLC | 309.613 | -2,91 | 7.647 | -1,14 | ||||
| 2025-08-15 | 13F | Cornerstone Financial Group, LLC /NE/ | 76.635 | 6,76 | 1.893 | 7,20 | ||||
| 2025-07-16 | 13F | ORG Wealth Partners, LLC | 5.050 | 0,00 | 126 | 2,46 | ||||
| 2025-08-14 | 13F | Glenmede Investment Management, LP | 7.674 | 190 | ||||||
| 2025-08-07 | 13F | Parkside Financial Bank & Trust | 3.089 | 0,00 | 76 | 2,70 | ||||
| 2025-07-10 | 13F | Wealth Enhancement Advisory Services, Llc | 196.002 | -33,78 | 4.890 | -31,89 | ||||
| 2025-04-16 | 13F | Yoffe Investment Management, LLC | 0 | -100,00 | 0 | -100,00 | ||||
| 2025-08-26 | NP | Northern Lights Variable Trust - TOPS Managed Risk Balanced ETF Portfolio Class 2 shares | 83.475 | -3,10 | 2.062 | -1,34 | ||||
| 2025-04-30 | 13F | Sofos Investments, Inc. | 424 | 10 | ||||||
| 2025-07-29 | 13F | Private Trust Co Na | 1.171 | 0,00 | 29 | 0,00 | ||||
| 2025-07-24 | 13F | PDS Planning, Inc | 1.422.662 | 4,64 | 35.140 | 6,54 | ||||
| 2025-08-12 | 13F | Marshall & Sterling Wealth Advisors Inc. | 128 | 0,79 | 3 | 0,00 | ||||
| 2025-07-31 | 13F | Sage Mountain Advisors LLC | 3.731 | 0,00 | 92 | 2,22 | ||||
| 2025-07-15 | 13F | Regatta Capital Group, Llc | 10.230 | 0,00 | 253 | 1,61 | ||||
| 2025-08-13 | 13F | Cresset Asset Management, LLC | 29.310 | 4,78 | 724 | 6,64 | ||||
| 2025-08-26 | NP | Northern Lights Variable Trust - TOPS Managed Risk Growth ETF Portfolio Class 1 shares | 230.612 | -3,02 | 5.696 | -1,27 | ||||
| 2025-07-03 | 13F | Fiduciary Financial Group, Llc | 158.507 | 4,30 | 3.940 | 15,54 | ||||
| 2025-08-11 | 13F | Principal Securities, Inc. | 82 | -40,58 | 2 | -33,33 | ||||
| 2025-05-15 | 13F | Glenmede Trust Co Na | 574 | -89,87 | 14 | -90,37 | ||||
| 2025-08-05 | 13F | Mission Wealth Management, Lp | 15.764 | -6,43 | 389 | -4,66 | ||||
| 2025-08-12 | 13F | Global Retirement Partners, LLC | 5.568 | -32,06 | 138 | -30,10 | ||||
| 2025-08-14 | 13F | Archetype Wealth Partners | 129.737 | -5,24 | 3 | 0,00 | ||||
| 2025-08-14 | 13F | CoreCap Advisors, LLC | 9 | 0,00 | 0 | |||||
| 2025-07-31 | 13F | FSM Wealth Advisors, LLC | 430.419 | 26,94 | 10.649 | 29,46 | ||||
| 2025-08-14 | 13F | Wells Fargo & Company/mn | 716.662 | -0,35 | 17.702 | 1,46 | ||||
| 2025-08-06 | 13F | Mark Sheptoff Financial Planning, Llc | 126 | 0,00 | 3 | 0,00 | ||||
| 2025-08-11 | 13F | Citigroup Inc | 5.533 | 5,96 | 137 | 7,94 | ||||
| 2025-07-15 | 13F | Ballentine Partners, LLC | 10.714 | -4,72 | 265 | -2,94 | ||||
| 2025-08-15 | 13F | Equitable Holdings, Inc. | 19.470 | 0,00 | 481 | 1,69 | ||||
| 2025-03-27 | NP | TRNTX - Transamerica ClearTrack 2050 R1 | 69.420 | 29,37 | 1.688 | 23,39 | ||||
| 2025-07-24 | 13F | Comprehensive Money Management Services LLC | 29.389 | -5,54 | 726 | -3,85 | ||||
| 2025-08-05 | 13F | Clarity Wealth Development LLC | 10.965 | 4,59 | 271 | 6,72 | ||||
| 2025-07-16 | 13F/A | CX Institutional | 574 | 0,00 | 0 | |||||
| 2025-08-11 | 13F | TD Waterhouse Canada Inc. | 40.855 | 9,13 | 1.014 | 11,67 | ||||
| 2025-08-12 | 13F | EFG Asset Management (Americas) Corp. | 8.144 | 201 | ||||||
| 2025-05-05 | 13F | Wealth Alliance | 0 | -100,00 | 0 | |||||
| 2025-07-29 | 13F | Chicago Partners Investment Group LLC | 23.443 | 0,61 | 592 | 4,04 | ||||
| 2025-07-30 | 13F | Whittier Trust Co | 9.000 | 0,00 | 222 | 1,83 | ||||
| 2025-05-29 | NP | SIIIX - AlphaCentric Strategic Income Fund Class I | 0 | -100,00 | 0 | -100,00 | ||||
| 2025-08-26 | NP | Northern Lights Variable Trust - TOPS Conservative ETF Portfolio Class 1 shares | 16.731 | 0,00 | 413 | 1,98 | ||||
| 2025-05-14 | 13F | Kestra Advisory Services, LLC | 0 | -100,00 | 0 | |||||
| 2025-07-15 | 13F | Garrett Investment Advisors LLC | 15.892 | 393 | ||||||
| 2025-08-14 | 13F | Bank Of America Corp /de/ | 1.053.734 | 42,14 | 26.027 | 44,72 | ||||
| 2025-08-26 | NP | Northern Lights Variable Trust - TOPS Managed Risk Flex ETF Portfolio | 184.001 | -4,78 | 4.545 | -3,07 | ||||
| 2025-07-22 | 13F | Sava Infond d.o.o. | 800 | 0,00 | 20 | 0,00 | ||||
| 2025-05-16 | 13F | Signature Estate & Investment Advisors Llc | 0 | -100,00 | 0 | |||||
| 2025-08-11 | 13F | Comprehensive Wealth Management, LLC | 26.241 | 648 | ||||||
| 2025-08-05 | 13F | Claro Advisors LLC | 9.608 | -25,57 | 237 | -24,28 | ||||
| 2025-07-10 | 13F | Cypress Point Wealth Management, LLC | 8.434 | -8,72 | 208 | -7,14 | ||||
| 2025-07-30 | 13F | Exencial Wealth Advisors, Llc | 72.162 | -8,36 | 1.782 | -6,70 | ||||
| 2025-07-08 | 13F | Parallel Advisors, LLC | 1.057 | -38,55 | 26 | -36,59 | ||||
| 2025-08-14 | 13F | Oxford Financial Group Ltd | 56.352 | 1,33 | 1.392 | 3,11 | ||||
| 2025-08-13 | 13F | Jones Financial Companies Lllp | 61.945 | 48,36 | 1.523 | 51,14 | ||||
| 2025-05-14 | 13F | Crossingbridge Advisors, LLC | 0 | -100,00 | 0 | |||||
| 2025-07-11 | 13F | International Private Wealth Advisors LLC | 10.437 | 4,00 | 258 | 5,76 | ||||
| 2025-08-01 | 13F | SYM FINANCIAL Corp | 948 | -32,91 | 23 | -32,35 | ||||
| 2025-08-06 | 13F | Vestmark Advisory Solutions, Inc. | 315.531 | -5,82 | 7.794 | -4,11 | ||||
| 2025-07-09 | 13F | Breakwater Investment Management | 4.879 | -4,24 | 121 | -2,44 | ||||
| 2025-08-13 | 13F | First National Advisers, LLC | 58.100 | 0,00 | 1.435 | 1,85 | ||||
| 2025-03-27 | NP | TCFTX - Transamerica ClearTrack 2015 R1 | 358 | -98,14 | 9 | -98,37 | ||||
| 2025-07-15 | 13F | Compagnie Lombard Odier SCmA | 10.200 | 0,00 | 252 | 1,62 | ||||
| 2025-07-16 | 13F | Twelve Points Wealth Management LLC | 20.235 | 5,57 | 500 | 7,31 | ||||
| 2025-08-14 | 13F | Sterling Wealth Management, Inc. | 36.838 | -7,36 | 910 | -4,62 | ||||
| 2025-08-14 | 13F | Fiduciary Trust Co | 0 | -100,00 | 0 | |||||
| 2025-07-21 | 13F | Quent Capital, LLC | 508.202 | 3,94 | 12.553 | 5,83 | ||||
| 2025-08-12 | 13F | Cooper/haims Advisors, Llc | 517.646 | 3,70 | 12.786 | 5,57 | ||||
| 2025-08-15 | 13F | Harvest Fund Management Co., Ltd | 11.400 | 0 |