Grundlæggende statistik
| Institutionelle aktier (lange) | 329.292.908 - 49,78% (ex 13D/G) - change of -52,41MM shares -13,73% MRQ |
| Institutionel værdi (lang) | $ 2.663.370 USD ($1000) |
Institutionelt ejerskab og aktionærer
NexGen Energy Ltd. (US:NXE) har 271 institutionelle ejere og aktionærer, der har indsendt 13D/G- eller 13F-formularer til Securities Exchange Commission (SEC). Disse institutioner har i alt 329,292,908 aktier. Største aktionærer omfatter MIRAE ASSET GLOBAL ETFS HOLDINGS Ltd., L1 Capital Pty Ltd, Van Eck Associates Corp, Vanguard Group Inc, Alps Advisors Inc, Hancock Prospecting Pty Ltd, CIBC Asset Management Inc, Ameriprise Financial Inc, Norges Bank, and Grantham, Mayo, Van Otterloo & Co. LLC .
NexGen Energy Ltd. (NYSE:NXE) institutionel ejerskabsstruktur viser aktuelle positioner i virksomheden efter institutioner og fonde, samt seneste ændringer i positionsstørrelse. Større aktionærer kan omfatte individuelle investorer, investeringsforeninger, hedgefonde eller institutioner. Skema 13D angiver, at investoren besidder (eller besidder) mere end 5 % af virksomheden og har til hensigt (eller har til hensigt at) aktivt at forfølge en ændring i forretningsstrategi. Skema 13G indikerer en passiv investering på over 5%.
The share price as of April 7, 2026 is 11,36 / share. Previously, on April 8, 2025, the share price was 4,06 / share. This represents an increase of 179,80% over that period.

Fondens stemningsscore
Fund Sentiment Score (fka Ownership Accumulation Score) finder de aktier, der bliver mest købt af fonde. Det er resultatet af en sofistikeret, multi-faktor kvantitativ model, der identificerer virksomheder med de højeste niveauer af institutionel akkumulering. Scoringsmodellen bruger en kombination af den samlede stigning i oplyste ejere, ændringerne i porteføljeallokeringer i disse ejere og andre målinger. Tallet går fra 0 til 100, hvor højere tal indikerer et højere niveau af akkumulering for sine jævnaldrende, og 50 er gennemsnittet.
Opdateringsfrekvens: Dagligt
Se Ownership Explorer, som giver en liste over højest rangerende virksomheder.
AI+ Ask Fintel’s AI assistant about NexGen Energy Ltd..
Select a question to share a public post with an AI-crafted answer.
Thinking of good questions…
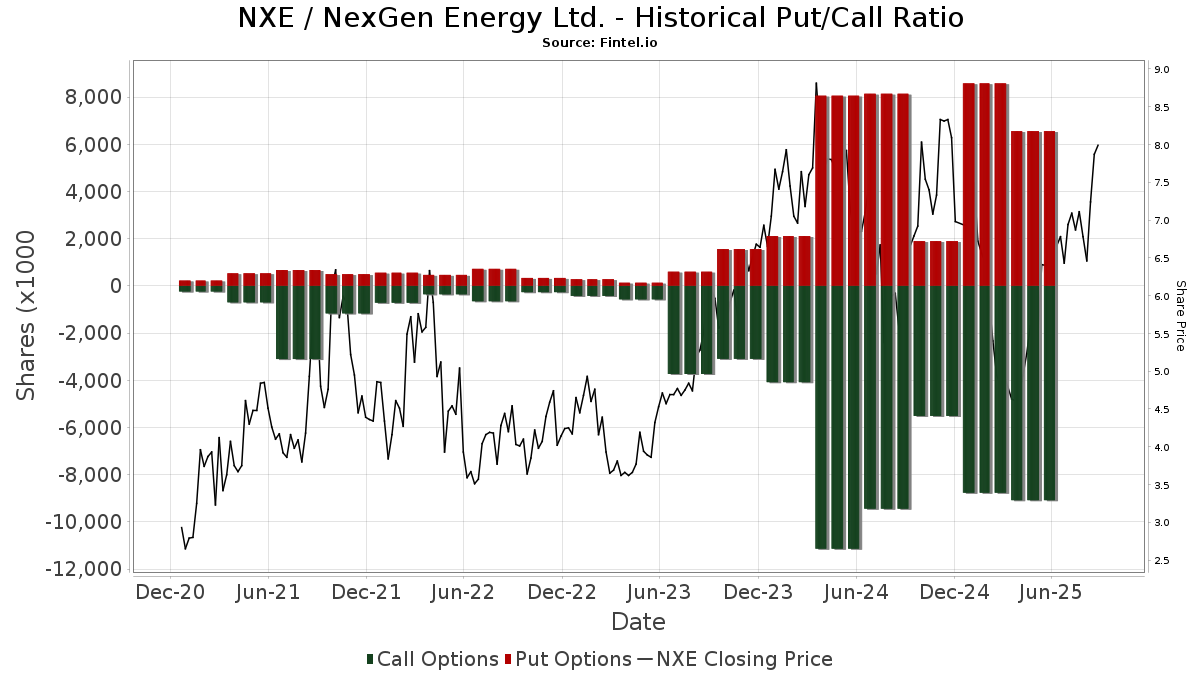
Institutionel Put/Call-forhold
Ud over at indberette standardaktie- og gældsudstedelser skal institutter med mere end 100 mill. aktiver under forvaltning også oplyse deres put- og call-optionsbeholdninger. Da salgsoptioner generelt indikerer negativ stemning, og købsoptioner indikerer positiv stemning, kan vi få en fornemmelse af den overordnede institutionelle stemning ved at plotte forholdet mellem put og kald. Diagrammet til højre viser det historiske put/call-forhold for dette instrument.
Brug af Put/Call Ratio som en indikator for investorernes stemning overvinder en af de vigtigste mangler ved at bruge totalt institutionelt ejerskab, som er, at en betydelig mængde af aktiver under forvaltning investeres passivt for at spore indekser. Passivt forvaltede fonde køber typisk ikke optioner, så indikatoren for put/call-forholdet følger mere nøje følelsen af aktivt forvaltede fonde.
13D/G-arkivering
Vi præsenterer 13D/G ansøgninger separat fra 13F ansøgninger på grund af den forskellige behandling af SEC. 13D/G-ansøgninger kan indgives af grupper af investorer (med én ledende), hvorimod 13F-ansøgninger ikke kan. Dette resulterer i situationer, hvor en investor kan indsende en 13D/G, der rapporterer én værdi for de samlede aktier (der repræsenterer alle de aktier, der ejes af investorgruppen), men derefter indsender en 13F, der rapporterer en anden værdi for de samlede aktier (der udelukkende repræsenterer deres egne) ejendomsret). Det betyder, at aktieejerskab af 13D/G-arkiver og 13F-arkiveringer ofte ikke er direkte sammenlignelige, så vi præsenterer dem separat.
Bemærk: Fra den 16. maj 2021 viser vi ikke længere ejere, der ikke har indsendt en 13D/G inden for det seneste år. Tidligere viste vi den fulde historie af 13D/G-arkiver. Generelt skal enheder, der er forpligtet til at indgive 13D/G-ansøgninger, indgive mindst årligt, før de indsender en afsluttende ansøgning. Dog forlader fonde nogle gange positioner uden at indsende en afsluttende ansøgning (dvs. de afvikler), så visning af den fulde historie resulterede nogle gange i forvirring om det nuværende ejerskab. For at undgå forvirring viser vi nu kun 'aktuelle' ejere - det vil sige - ejere, der har anmeldt inden for det seneste år.
Upgrade to unlock premium data.
| Fil dato | Form | Investor | Forrige Aktier |
Seneste Aktier |
Δ Aktier (Procent) |
Ejendomsret (Procent) |
Δ Ejerskab (Procent) |
|
|---|---|---|---|---|---|---|---|---|
| 2026-02-11 | BARCLAYS PLC | 32,998,265 | 32,619,428 | -1.15 | 4.98 | -13.99 |
13F og NPORT arkivering
Detaljer om 13F-arkivering er gratis. Detaljer om NP-ansøgninger kræver et premium-medlemskab. Grønne rækker angiver nye positioner. Røde rækker angiver lukkede positioner. Klik på linket ikon for at se den fulde transaktionshistorik.
Opgrader
for at låse premium-data op og eksportere til Excel ![]() .
.
| Fil dato | Kilde | Investor | Type | Gennemsnitlig pris (Øst) |
Aktier | Δ Aktier (%) |
Rapporteret Værdi ($1000) |
Δ Værdi (%) |
Port Alloc (%) |
|
|---|---|---|---|---|---|---|---|---|---|---|
| 2026-02-11 | 13F | Deutsche Bank Ag\ | 3.935.033 | 73,68 | 36.202 | 78,54 | ||||
| 2026-02-12 | 13F | Swiss National Bank | 1.230.800 | 16,03 | 11.349 | 19,44 | ||||
| 2025-11-13 | 13F | Sei Investments Co | 0 | -100,00 | 0 | |||||
| 2026-02-13 | 13F | De Lisle Partners LLP | 1.208.732 | 0,00 | 11.120 | 2,79 | ||||
| 2026-02-12 | 13F | BlackRock, Inc. | 137.431 | 15,69 | 1.264 | 18,91 | ||||
| 2026-02-17 | 13F | PharVision Advisers, LLC | 0 | -100,00 | 0 | |||||
| 2026-02-10 | 13F | Td Asset Management Inc | 3.184.421 | -4,27 | 29.341 | -1,51 | ||||
| 2026-02-12 | 13F | Marex Group plc | Call | 10.000 | 0,00 | 92 | 3,37 | |||
| 2026-02-17 | 13F | Trexquant Investment LP | 440.529 | 63,07 | 4.053 | 67,65 | ||||
| 2025-11-14 | 13F | ExodusPoint Capital Management, LP | 896.909 | 79,15 | 8.027 | 267.466,67 | ||||
| 2026-02-17 | 13F | Black Maple Capital Management LP | 66.200 | -23,20 | 609 | -21,01 | ||||
| 2026-02-13 | 13F | American Century Companies Inc | 473.812 | 12,23 | 4.360 | 15,35 | ||||
| 2026-02-06 | 13F | Banque Cantonale Vaudoise | 212.569 | 192,98 | 1.959 | |||||
| 2026-02-10 | 13F | KERR FINANCIAL PLANNING Corp | 1.000 | 0,00 | 11 | 25,00 | ||||
| 2026-02-13 | 13F | Marshall Wace, Llp | 7.182.303 | 66.077 | ||||||
| 2026-01-28 | 13F | Legacy Capital Group California, Inc. | 86.250 | 1,28 | 794 | 4,07 | ||||
| 2026-01-29 | 13F | Beirne Wealth Consulting Services, LLC | 25.000 | 0,00 | 230 | 3,14 | ||||
| 2026-02-06 | 13F/A | CapWealth Advisors, LLC | 14.000 | 0,00 | 129 | 2,40 | ||||
| 2026-01-16 | 13F | Matauro, Llc | 12.659 | 0,00 | 116 | 2,65 | ||||
| 2026-02-13 | 13F | Aviso Financial Inc. | 0 | -100,00 | 0 | |||||
| 2026-02-18 | 13F | VGI Partners Ltd | 205.000 | 412,50 | 1.886 | 426,82 | ||||
| 2026-02-11 | 13F | Simplex Trading, Llc | Put | 220.300 | 37,77 | 2.027 | 202.500,00 | |||
| 2026-02-11 | 13F | Simplex Trading, Llc | 138.119 | -57,08 | 1.271 | 63.400,00 | ||||
| 2025-11-24 | 13F/A | Fulcrum Asset Management LLP | Put | 0 | -100,00 | 0 | -100,00 | |||
| 2026-02-17 | 13F | Millennium Management Llc | 7.133.264 | -29,61 | 65.660 | -27,62 | ||||
| 2026-02-13 | 13F | Manufacturers Life Insurance Company, The | 0 | -100,00 | 0 | |||||
| 2026-02-12 | 13F | Summit Financial, LLC | 186.100 | -0,27 | 1.712 | 2,51 | ||||
| 2025-11-14 | 13F | Sig Brokerage, Lp | 0 | -100,00 | 0 | -100,00 | ||||
| 2026-02-12 | 13F | Sprott Inc. | 501.402 | 14,63 | 4.614 | 17,85 | ||||
| 2026-01-28 | 13F | Chicago Partners Investment Group LLC | 178.405 | 2.244 | ||||||
| 2026-01-28 | 13F | DekaBank Deutsche Girozentrale | 11.651 | 0,00 | 0 | |||||
| 2026-02-17 | 13F | Russell Investments Group, Ltd. | 733.065 | -12,30 | 6.754 | -9,75 | ||||
| 2026-02-12 | 13F | Bank Of Montreal /can/ | Call | 0 | -100,00 | 0 | -100,00 | |||
| 2026-02-05 | 13F | Financial Security Advisor, Inc. | 10.164 | 0,00 | 94 | 3,33 | ||||
| 2026-02-10 | 13F | Envestnet Asset Management Inc | 362.901 | 0,04 | 3.339 | 2,87 | ||||
| 2026-02-13 | 13F | Wexford Capital Lp | 15.412 | -75,63 | 142 | -75,09 | ||||
| 2026-01-15 | 13F | Refined Wealth Management | 11.000 | 0,00 | 101 | 3,06 | ||||
| 2026-02-03 | 13F | Violich Capital Management, Inc. | 42.400 | -6,61 | 390 | -3,94 | ||||
| 2026-02-13 | 13F | Itau Unibanco Holding S.A. | 0 | -100,00 | 0 | |||||
| 2026-02-17 | 13F | Guggenheim Capital Llc | 18.476 | 170 | ||||||
| 2026-02-13 | 13F | Citigroup Inc | 690.759 | 2,13 | 6.365 | 5,09 | ||||
| 2026-01-29 | 13F | St Germain D J Co Inc | 1.000 | 0,00 | 9 | 12,50 | ||||
| 2026-02-11 | 13F | LPL Financial LLC | 164.283 | 15,04 | 1.511 | 18,23 | ||||
| 2026-02-13 | 13F | Headlands Technologies LLC | 41.396 | -20,70 | 381 | -18,63 | ||||
| 2026-02-17 | 13F | Alliancebernstein L.p. | 2.672.827 | -27,23 | 24.590 | -25,19 | ||||
| 2026-02-17 | 13F | SIG North Trading, ULC | 291.672 | -20,21 | 2.683 | -17,98 | ||||
| 2026-02-12 | 13F | Alps Advisors Inc | 14.073.076 | -10,07 | 129.472 | -7,56 | ||||
| 2026-02-17 | 13F | Quantinno Capital Management LP | 13.736 | 126 | ||||||
| 2025-11-07 | 13F | Shell Asset Management Co | 7.988 | -73,02 | 0 | |||||
| 2026-01-14 | 13F | Hennion & Walsh Asset Management, Inc. | 110.588 | 183,78 | 1.017 | 192,24 | ||||
| 2026-01-14 | 13F/A | TABR Capital Management, LLC | 11.000 | 101 | ||||||
| 2026-02-10 | 13F | Bnp Paribas Arbitrage, Sa | 1.276.863 | 11,84 | 11.747 | 14,98 | ||||
| 2026-02-17 | 13F | Amundi | 780.475 | -32,88 | 7.180 | -31,69 | ||||
| 2026-02-17 | 13F | SIG North Trading, ULC | Put | 82.700 | -48,76 | 761 | -47,37 | |||
| 2026-02-17 | 13F | Raffles Associates Lp | 175.000 | -27,08 | 1.610 | -25,05 | ||||
| 2026-02-10 | 13F | Bnp Paribas Arbitrage, Sa | Call | 1.884 | 1.733 | |||||
| 2026-02-17 | 13F | Lighthouse Investment Partners, LLC | 43.702 | -39,34 | 402 | -37,58 | ||||
| 2026-02-17 | 13F | SIG North Trading, ULC | Call | 280.000 | -31,34 | 2.576 | -29,41 | |||
| 2026-02-17 | 13F | Lombard Odier Asset Management (USA) Corp | 0 | -100,00 | 0 | |||||
| 2026-02-17 | 13F | Polygon Management Ltd. | 0 | -100,00 | 0 | |||||
| 2026-02-17 | 13F | Masters Capital Management Llc | 2.000.000 | 0,00 | 18.400 | 2,79 | ||||
| 2026-02-13 | 13F | Blueshift Asset Management, LLC | 76.151 | 701 | ||||||
| 2026-04-07 | 13F | Farther Finance Advisors, LLC | 109 | 105,66 | 1 | |||||
| 2026-02-17 | 13F | Freshford Capital Management, LLC | 895.213 | -20,90 | 8.236 | -18,70 | ||||
| 2025-10-22 | 13F | Kercheville Advisors, LLC | 0 | -100,00 | 0 | -100,00 | ||||
| 2025-11-14 | 13F | Wolverine Trading, Llc | 59.963 | -47,49 | 540 | -30,41 | ||||
| 2026-02-17 | 13F | Kerrisdale Advisers, LLC | 50.883 | 0,00 | 468 | 2,86 | ||||
| 2026-02-17 | 13F | Hancock Prospecting Pty Ltd | 9.078.245 | 10,04 | 83.656 | 13,29 | ||||
| 2025-11-14 | 13F | Wolverine Trading, Llc | Call | 382.600 | 37,53 | 3.447 | 82,28 | |||
| 2025-11-14 | 13F | Wolverine Trading, Llc | Put | 142.600 | 55,51 | 1.285 | 106,10 | |||
| 2026-02-13 | 13F | First Trust Advisors Lp | 25.579 | 143,96 | 235 | 152,69 | ||||
| 2026-02-09 | 13F | MMCAP International Inc. SPC | 2.429.898 | 4.759,12 | 22.355 | 4.901,12 | ||||
| 2026-02-06 | 13F | Kimelman & Baird, LLC | 131 | 0,00 | 1 | 0,00 | ||||
| 2026-01-27 | 13F | Zurcher Kantonalbank (Zurich Cantonalbank) | 202.641 | 20,49 | 1.867 | 23,97 | ||||
| 2026-01-29 | 13F | UBS Group AG | Put | 900.000 | 8.280 | |||||
| 2026-02-17 | 13F | State Of Wisconsin Investment Board | 15.985 | 147 | ||||||
| 2026-01-29 | 13F | UBS Group AG | 1.788.199 | -44,98 | 16.451 | -43,45 | ||||
| 2026-02-12 | 13F | Bank Of Montreal /can/ | Put | 100.000 | 920 | |||||
| 2026-03-13 | 13F/A | Pensionmark Financial Group, Llc | 19.978 | 184 | ||||||
| 2026-02-12 | 13F | Bank Of Montreal /can/ | 3.682.015 | 65,56 | 33.882 | 70,20 | ||||
| 2026-02-06 | 13F | Larson Financial Group LLC | 10.575 | -1,40 | 97 | 2,11 | ||||
| 2026-02-09 | 13F | Catalyst Funds Management Pty Ltd | 112.000 | 6,16 | 1.030 | 9,11 | ||||
| 2026-02-17 | 13F | Mpwm Advisory Solutions, Llc | 0 | -100,00 | 0 | |||||
| 2026-02-10 | 13F | Lido Advisors, LLC | 10.100 | 0,00 | 90 | 0,00 | ||||
| 2026-02-11 | 13F | Group One Trading, L.p. | Put | 296.500 | 15,82 | 2.728 | 19,03 | |||
| 2026-02-10 | 13F | Norges Bank | 7.857.282 | 72.303 | ||||||
| 2026-02-17 | 13F | Encompass Capital Advisors LLC | 0 | -100,00 | 0 | |||||
| 2026-02-17 | 13F | Caption Management, LLC | 0 | -100,00 | 0 | |||||
| 2026-02-17 | 13F | Advisory Services Network, LLC | 14.500 | -50,65 | 133 | -49,24 | ||||
| 2026-02-13 | 13F | JustInvest LLC | 45.347 | 12,50 | 417 | 15,83 | ||||
| 2025-11-14 | 13F | Capstone Investment Advisors, Llc | 41.264 | -48,68 | 369 | -33,75 | ||||
| 2026-02-17 | 13F | Massar Capital Management, LP | 123.799 | 1.139 | ||||||
| 2026-02-18 | 13F | Mackenzie Financial Corp | 554.087 | 87,40 | 5.039 | 90,40 | ||||
| 2026-02-13 | 13F | L1 Capital Pty Ltd | 33.642.681 | 9,09 | 309.145 | 18,63 | ||||
| 2026-01-22 | 13F | Accordant Advisory Group Inc | 143.412 | -0,97 | 1.319 | 1,77 | ||||
| 2026-02-03 | 13F | We Are One Seven, LLC | 17.922 | 46,05 | 165 | 50,46 | ||||
| 2026-02-06 | 13F/A | Rathbone Brothers plc | 33.131 | 16,09 | 305 | 19,61 | ||||
| 2026-01-27 | 13F | First Horizon Corp | 2.000 | 0,00 | 18 | 5,88 | ||||
| 2026-01-29 | 13F | IMC-Chicago, LLC | Put | 274.800 | 23,39 | 2.528 | 26,84 | |||
| 2026-02-10 | 13F | Goldman Sachs Group Inc | 770.652 | -64,04 | 7.090 | -63,04 | ||||
| 2026-02-13 | 13F | 1832 Asset Management L.P. | 2.088.525 | 0,00 | 19.214 | 2,79 | ||||
| 2026-02-17 | 13F | Cresset Asset Management, LLC | 0 | -100,00 | 0 | -100,00 | ||||
| 2026-02-17 | 13F | Private Advisor Group, LLC | 22.550 | -7,39 | 207 | -4,61 | ||||
| 2025-11-24 | 13F | CIBC Private Wealth Group, LLC | 0 | -100,00 | 0 | -100,00 | ||||
| 2026-02-09 | 13F | Themes Management Co LLC | 71.552 | 658 | ||||||
| 2025-12-02 | 13F | Allworth Financial LP | 0 | -100,00 | 0 | |||||
| 2026-02-12 | 13F | Greenfield Seitz Capital Management, LLC | 14.850 | -51,07 | 137 | -49,82 | ||||
| 2026-02-12 | 13F | Nuveen, LLC | 451.293 | 11,12 | 4.158 | 14,32 | ||||
| 2026-01-14 | 13F | ORG Partners LLC | 1.210 | -24,84 | 11 | -21,43 | ||||
| 2026-02-11 | 13F | Deltroit Asset Management (UK) LLP | 3.196.635 | 29.416 | ||||||
| 2026-02-13 | 13F | Aigen Investment Management, Lp | 15.145 | 139 | ||||||
| 2025-11-14 | 13F | Cubist Systematic Strategies, LLC | 858.302 | 7.682 | ||||||
| 2026-02-10 | 13F | Bank of New York Mellon Corp | 3.900.556 | 48,17 | 35.885 | 52,31 | ||||
| 2026-02-12 | 13F | CoreCommodity Management, LLC | 22.682 | -72,03 | 209 | -71,31 | ||||
| 2026-02-17 | 13F | J. Goldman & Co LP | Call | 75.000 | 690 | |||||
| 2025-11-17 | 13F | Caxton Associates Llp | 0 | -100,00 | 0 | -100,00 | ||||
| 2026-02-17 | 13F | J. Goldman & Co LP | Put | 75.000 | 690 | |||||
| 2026-02-10 | 13F | BW Gestao de Investimentos Ltda. | 677.146 | 6.230 | ||||||
| 2026-02-17 | 13F | Arrow Capital Pty Ltd | 0 | -100,00 | 0 | -100,00 | ||||
| 2026-02-03 | 13F | International Assets Investment Management, Llc | 20.200 | 186 | ||||||
| 2025-11-21 | 13F | Nebula Research & Development LLC | 0 | -100,00 | 0 | |||||
| 2026-01-30 | 13F | New Harbor Financial Group, LLC | 24.500 | 4,26 | 225 | 7,14 | ||||
| 2026-02-17 | 13F | Public Employees Retirement System Of Ohio | 144.668 | 15,03 | 1.331 | 18,12 | ||||
| 2026-02-18 | 13F | Beacon Pointe Advisors, LLC | 35.000 | 0,00 | 322 | 2,88 | ||||
| 2025-10-30 | 13F | Keebeck Alpha, LP | 0 | -100,00 | 0 | |||||
| 2026-01-20 | 13F | AdvisorNet Financial, Inc | 3.278 | 1,55 | 30 | 7,14 | ||||
| 2026-02-11 | 13F | Capital Research Global Investors | 0 | -100,00 | 0 | |||||
| 2026-02-09 | 13F | Geode Capital Management, Llc | 422.432 | 32,82 | 3.975 | 38,90 | ||||
| 2026-02-03 | 13F | Chesapeake Capital Corp /il/ | 37.542 | 0,00 | 345 | 2,68 | ||||
| 2026-02-10 | 13F | CIBC World Markets Inc. | Put | 516.900 | 4.755 | |||||
| 2026-02-10 | 13F | CIBC World Markets Inc. | 108.464 | -25,77 | 998 | -23,72 | ||||
| 2026-02-13 | 13F | MAI Capital Management | 0 | -100,00 | 0 | |||||
| 2025-11-05 | 13F | Anthracite Investment Company, Inc. | 0 | -100,00 | 0 | |||||
| 2026-02-10 | 13F | CIBC World Markets Inc. | Call | 140.000 | -13,90 | 1.288 | -11,48 | |||
| 2026-02-20 | 13F | Sunbelt Securities, Inc. | 400 | 0,00 | 4 | 0,00 | ||||
| 2026-02-13 | 13F | Mariner, LLC | 15.594 | -0,72 | 143 | 2,14 | ||||
| 2026-02-06 | 13F | EverSource Wealth Advisors, LLC | 470 | 84,31 | 4 | 100,00 | ||||
| 2025-11-14 | 13F | Ion Asset Management Ltd. | 2.348.100 | 3.404,63 | 21.015 | 4.429,09 | ||||
| 2026-02-13 | 13F | Y-Intercept (Hong Kong) Ltd | 404.358 | -42,52 | 3.720 | -40,91 | ||||
| 2026-02-17 | 13F | MIRAE ASSET GLOBAL ETFS HOLDINGS Ltd. | 34.411.235 | 12,42 | 317.063 | 15,67 | ||||
| 2026-02-17 | 13F | Tower Research Capital LLC (TRC) | 1.854 | -94,43 | 17 | -94,28 | ||||
| 2026-02-13 | 13F | Quarry LP | Call | 364.800 | 156,00 | 3.356 | 163,22 | |||
| 2026-02-19 | 13F | Atomi Financial Group, Inc. | 10.388 | 0,00 | 96 | 3,26 | ||||
| 2026-02-19 | 13F | Invesco Ltd. | 1.196.664 | -1,98 | 11.009 | 0,77 | ||||
| 2026-02-17 | 13F | Raymond James Financial Inc | Put | 6.900 | 0,00 | 41 | 0,00 | |||
| 2026-02-17 | 13F | Raymond James Financial Inc | 597.255 | 8,61 | 5.495 | 11,64 | ||||
| 2026-02-17 | 13F | Arosa Capital Management LP | 0 | -100,00 | 0 | |||||
| 2025-11-21 | 13F/A | CIBC Bancorp USA Inc. | 97.780 | 875 | ||||||
| 2026-02-12 | 13F | Jane Street Group, Llc | Call | 1.110.000 | 113,05 | 10.212 | 119,05 | |||
| 2026-02-12 | 13F | Jane Street Group, Llc | 3.144.763 | 62,67 | 28.932 | 67,22 | ||||
| 2026-02-17 | 13F | Magnetar Financial LLC | 0 | -100,00 | 0 | |||||
| 2026-02-12 | 13F | Jane Street Group, Llc | Put | 334.700 | 223,07 | 3.079 | 232,15 | |||
| 2026-02-18 | 13F | GWM Advisors LLC | 0 | -100,00 | 0 | |||||
| 2026-02-13 | 13F | Great West Life Assurance Co /can/ | 1.338.800 | 90,39 | 12 | 100,00 | ||||
| 2026-02-17 | 13F | Ameriprise Financial Inc | 8.483.607 | 78.049 | ||||||
| 2026-02-05 | 13F/A | Fulcrum Asset Management LLP | 48.771 | -16,99 | 448 | -14,67 | ||||
| 2026-03-25 | 13F/A | Lifetime Wealth Management P.C. | 10.000 | 92 | ||||||
| 2025-11-13 | 13F | Eisler Capital Management Ltd. | 240.454 | 609,87 | 2.087 | 788,09 | ||||
| 2026-02-09 | 13F | GeoSphere Capital Management | 400.000 | -27,27 | 3.680 | -25,23 | ||||
| 2026-02-13 | 13F | Quarry LP | 0 | -100,00 | 0 | -100,00 | ||||
| 2026-02-17 | 13F | Jones Financial Companies Lllp | 13.804 | -40,72 | 127 | -40,28 | ||||
| 2026-02-13 | 13F | Alberta Investment Management Corp | 301.000 | 0,00 | 2.770 | 2,78 | ||||
| 2026-02-13 | 13F | Gts Securities Llc | 28.739 | -76,77 | 264 | -76,15 | ||||
| 2025-11-14 | 13F | Balyasny Asset Management Llc | 0 | -100,00 | 0 | |||||
| 2026-02-17 | 13F | Cape Investment Advisory, Inc. | 260 | 2 | ||||||
| 2025-11-14 | 13F | Arosa Capital Management LP | Call | 0 | -100,00 | 0 | -100,00 | |||
| 2026-01-09 | 13F | Silver Lake Advisory, LLC | 11.000 | 0,00 | 101 | 3,06 | ||||
| 2026-01-22 | 13F | Vision Financial Markets Llc | 40 | 0,00 | 0 | |||||
| 2026-01-28 | 13F | Eagle Global Advisors Llc | 62.100 | 12,91 | 571 | 16,06 | ||||
| 2026-02-17 | 13F | Bank Of America Corp /de/ | 696.916 | 60,07 | 6.412 | 64,55 | ||||
| 2026-02-13 | 13F | Morgan Stanley | 1.928.115 | 46,35 | 17.739 | 50,44 | ||||
| 2026-02-17 | 13F | Parallax Volatility Advisers, L.P. | 0 | -100,00 | 0 | |||||
| 2026-02-12 | 13F | Polen Capital Management Llc | 0 | -100,00 | 0 | |||||
| 2026-02-17 | 13F | XTX Topco Ltd | 45.026 | -35,06 | 414 | -33,23 | ||||
| 2026-02-09 | 13F | Legal & General Group Plc | 642.403 | 1,94 | 5.919 | 4,89 | ||||
| 2026-02-17 | 13F | Scientech Research LLC | 16.971 | 156 | ||||||
| 2026-02-17 | 13F | Nokomis Capital, L.L.C. | 1.598.948 | 7,53 | 14.710 | 10,54 | ||||
| 2026-02-17 | 13F | Mirabella Financial Services Llp | Call | 0 | -100,00 | 0 | ||||
| 2026-01-23 | 13F | Stanley-Laman Group, Ltd. | 472.115 | 6,87 | 4.343 | 9,87 | ||||
| 2026-02-17 | 13F | Mirabella Financial Services Llp | 0 | -100,00 | 0 | |||||
| 2025-11-14 | 13F | Kopernik Global Investors, LLC | 0 | -100,00 | 0 | |||||
| 2026-02-17 | 13F | Gotham Asset Management, LLC | 0 | -100,00 | 0 | |||||
| 2026-01-27 | 13F | TD Waterhouse Canada Inc. | 137.466 | -4,31 | 1.262 | -3,00 | ||||
| 2026-02-11 | 13F | Picton Mahoney Asset Management | 759.491 | 3,34 | 6.999 | 116.533,33 | ||||
| 2026-02-13 | 13F | Lord, Abbett & Co. Llc | 280.000 | 3 | ||||||
| 2026-02-12 | 13F | Hrt Financial Lp | 610.590 | 6 | ||||||
| 2026-02-13 | 13F | Acasta Partners UK LLP | 42.000 | 386 | ||||||
| 2026-02-17 | 13F | Brevan Howard Capital Management LP | 25.515 | 104,12 | 235 | 110,81 | ||||
| 2026-01-21 | 13F | Drummond Knight Asset Management Pty Ltd | 579.064 | 4,06 | 5.327 | 6,97 | ||||
| 2026-02-13 | 13F | Charles Schwab Investment Management Inc | 1.269.011 | 13,38 | 11.693 | 16,65 | ||||
| 2026-01-27 | 13F | Evergreen Capital Management Llc | 55.065 | -2,83 | 507 | -0,20 | ||||
| 2026-01-23 | 13F | Azarias Capital Management, L.P. | 1.079.795 | -3,33 | 9.934 | -0,63 | ||||
| 2026-02-13 | 13F | Falcon Edge Capital, LP | 152.657 | -49,01 | 1.404 | -47,59 | ||||
| 2026-02-10 | 13F/A | Northwestern Mutual Wealth Management Co | 53.690 | 494 | ||||||
| 2026-02-13 | 13F | Kayne Anderson Capital Advisors Lp | 313.888 | 2.888 | ||||||
| 2026-02-05 | 13F | Tejara Capital Ltd | 0 | -100,00 | 0 | |||||
| 2026-02-17 | 13F | Caption Management, LLC | Put | 30.000 | 276 | |||||
| 2026-02-17 | 13F | Caption Management, LLC | Call | 712.700 | 8,54 | 6.557 | 11,57 | |||
| 2026-02-13 | 13F | Aptus Capital Advisors, LLC | 12.281 | 0,00 | 113 | 2,75 | ||||
| 2026-02-17 | 13F | Point72 Asset Management, L.P. | 0 | -100,00 | 0 | -100,00 | ||||
| 2026-02-17 | 13F | Citadel Advisors Llc | Put | 1.338.500 | -70,34 | 12.314 | -69,51 | |||
| 2026-02-17 | 13F | Royal Bank Of Canada | Call | 0 | -100,00 | 0 | ||||
| 2026-02-13 | 13F | Natixis | 1.761 | -9,78 | 16 | -5,88 | ||||
| 2026-02-17 | 13F | Citadel Advisors Llc | Call | 2.460.900 | 28,37 | 22.640 | 31,96 | |||
| 2026-02-11 | 13F | Franklin Resources Inc | 33.320 | 14,83 | 307 | 18,15 | ||||
| 2026-02-17 | 13F | Citadel Advisors Llc | 3.469.926 | 10,64 | 31.923 | 13,73 | ||||
| 2026-02-17 | 13F | Prelude Capital Management, Llc | 44.241 | -31,15 | 407 | -29,22 | ||||
| 2026-02-17 | 13F | Blair William & Co/il | 13.921 | 0,00 | 128 | 3,23 | ||||
| 2025-11-13 | 13F | NewGen Equity Long/Short Fund | 0 | -100,00 | 0 | -100,00 | ||||
| 2026-02-13 | 13F | Walleye Trading LLC | Put | 56.900 | 306,43 | 523 | 318,40 | |||
| 2026-02-03 | 13F | SBI Securities Co., Ltd. | 7.965 | 454,28 | 73 | 508,33 | ||||
| 2025-10-20 | 13F | Muzinich & Co., Inc. | Call | 0 | -100,00 | 0 | -100,00 | |||
| 2025-10-23 | 13F | Canton Hathaway, LLC | 0 | -100,00 | 0 | |||||
| 2026-01-09 | 13F | Pacifica Partners Inc. | 21.000 | 0,00 | 214 | 12,70 | ||||
| 2026-02-13 | 13F | Van Eck Associates Corp | 29.157.056 | 23,37 | 268 | 27,01 | ||||
| 2026-02-13 | 13F | Kestra Advisory Services, LLC | 0 | -100,00 | 0 | |||||
| 2026-02-12 | 13F | Campbell & CO Investment Adviser LLC | 43.747 | -2,79 | 402 | 0,00 | ||||
| 2026-02-17 | 13F | Fmr Llc | 22 | 0,00 | 0 | |||||
| 2026-01-16 | 13F | FNY Investment Advisers, LLC | 66.560 | 564,67 | 1 | |||||
| 2026-01-16 | 13F | FNY Investment Advisers, LLC | Call | 470 | 0 | |||||
| 2026-02-11 | 13F | Jpmorgan Chase & Co | Put | 0 | -100,00 | 0 | -100,00 | |||
| 2026-02-13 | 13F | Barclays Plc | 103.809 | -44,74 | 955 | -22,10 | ||||
| 2026-02-17 | 13F | Two Sigma Investments, Lp | 936.887 | 436,82 | 8.619 | 452,15 | ||||
| 2026-02-17 | 13F | Kingdon Capital Management, L.l.c. | 2.500.000 | 14,79 | 23.000 | 18,00 | ||||
| 2026-02-17 | 13F | Two Sigma Advisers, Lp | 623.400 | 129,87 | 5.735 | 136,30 | ||||
| 2025-11-04 | 13F | Winnow Wealth Llc | 0 | -100,00 | 0 | |||||
| 2026-01-23 | 13F | Assetmark, Inc | 60 | 0,00 | 1 | |||||
| 2026-02-10 | 13F | Titan Global Capital Management Usa Llc | 500.313 | -0,10 | 4.603 | 2,68 | ||||
| 2026-02-17 | 13F | Lloyd Harbor Capital Management, LLC | Call | 700.000 | 0,00 | 6.440 | 2,79 | |||
| 2026-02-17 | 13F | Jump Financial, LLC | 10.073 | 93 | ||||||
| 2026-02-17 | 13F | Ardsley Advisory Partners Lp | 1.125.000 | 350,00 | 10.347 | 362,29 | ||||
| 2026-02-13 | 13F | Peak6 Llc | Call | 2.181.100 | -38,48 | 20.066 | -36,76 | |||
| 2026-02-09 | 13F | Strategic Financial Concepts, LLC | 0 | -100,00 | 0 | |||||
| 2026-02-13 | 13F | Peak6 Llc | Put | 218.600 | -64,74 | 2.011 | -63,75 | |||
| 2026-02-17 | 13F | Temasek Holdings (Private) Ltd | 1.240.208 | 11.410 | ||||||
| 2026-02-17 | 13F | Old West Investment Management, LLC | 2.717.795 | 2,57 | 25.004 | 5,43 | ||||
| 2026-02-14 | 13F | Rockefeller Capital Management L.P. | 500 | 0,00 | 5 | 0,00 | ||||
| 2026-01-20 | 13F | Packer & Co Ltd | 3.024.793 | 0,00 | 28 | 0,00 | ||||
| 2026-02-17 | 13F | Lloyd Harbor Capital Management, LLC | 3.037.817 | -12,90 | 27.945 | -10,48 | ||||
| 2026-02-17 | 13F | Old Mission Capital Llc | 185.383 | 1.706 | ||||||
| 2026-02-17 | 13F | Royal Bank Of Canada | 6.186.906 | -20,25 | 56.920 | -18,02 | ||||
| 2026-02-17 | 13F | Investment Management Corp of Ontario | 80.214 | 280,70 | 738 | 292,02 | ||||
| 2026-02-17 | 13F | Janus Henderson Group Plc | 386.122 | 12,70 | 3.558 | 15,71 | ||||
| 2026-02-13 | 13F | Banque Transatlantique SA | 1.875 | 17 | ||||||
| 2026-02-13 | 13F | Vontobel Holding Ltd. | 30.934 | -2,62 | 285 | 0,00 | ||||
| 2026-01-29 | 13F | Sava Infond d.o.o. | 30.000 | 30,43 | 276 | 34,63 | ||||
| 2026-02-10 | 13F | Fielder Capital Group LLC | 281.202 | -9,50 | 2.587 | -6,94 | ||||
| 2026-02-10 | 13F | Quantbot Technologies LP | 36.506 | -86,79 | 336 | -86,45 | ||||
| 2026-02-17 | 13F | Garnet Equity Capital Holdings, Inc. | 250.000 | -15,77 | 2.300 | -13,40 | ||||
| 2026-02-09 | 13F | Waratah Capital Advisors Ltd. | 1.535.236 | -55,54 | 14.124 | -54,30 | ||||
| 2026-02-09 | 13F | Waratah Capital Advisors Ltd. | Call | 70.000 | 644 | |||||
| 2026-02-13 | 13F | Flow Traders U.s. Llc | 0 | -100,00 | 0 | |||||
| 2026-02-13 | 13F | Squarepoint Ops LLC | 40.565 | 373 | ||||||
| 2026-02-17 | 13F | Toronto Dominion Bank | 196.882 | 1.001,25 | 1.812 | 1.031,88 | ||||
| 2026-02-11 | 13F | Tacita Capital Inc | 1.409 | 0,00 | 13 | 0,00 | ||||
| 2025-11-10 | 13F | Optiver Holding B.V. | 0 | -100,00 | 0 | |||||
| 2026-02-13 | 13F | Walleye Trading LLC | Call | 229.600 | 734,91 | 2.112 | 758,54 | |||
| 2025-10-30 | 13F | Jennison Associates Llc | 0 | -100,00 | 0 | |||||
| 2026-02-13 | 13F | Walleye Trading LLC | 35.135 | -68,13 | 323 | -67,24 | ||||
| 2026-02-17 | 13F | Segra Capital Management, LLC | 175.000 | -94,65 | 1.610 | -94,50 | ||||
| 2025-11-21 | 13F/A | Tcfg Wealth Management, Llc | 0 | -100,00 | 0 | -100,00 | ||||
| 2026-02-04 | 13F | Abc Arbitrage Sa | 68.904 | 634 | ||||||
| 2026-02-06 | 13F | Leonteq Securities AG | 1.245 | -89,68 | 16 | -86,61 | ||||
| 2026-02-13 | 13F | Stifel Financial Corp | 131.240 | 49,62 | 1.207 | 53,76 | ||||
| 2026-02-17 | 13F | Moore Capital Management, Lp | 0 | -100,00 | 0 | |||||
| 2026-02-17 | 13F | SummitTX Capital, L.P. | 631.241 | 39,75 | 5.807 | 43,67 | ||||
| 2026-02-17 | 13F | Engineers Gate Manager LP | 0 | -100,00 | 0 | |||||
| 2026-02-05 | 13F | Cambridge Investment Research Advisors, Inc. | 46.670 | -63,26 | 0 | -100,00 | ||||
| 2026-02-17 | 13F | Driehaus Capital Management Llc | 4.105.110 | 6,79 | 37.767 | 9,78 | ||||
| 2025-11-14 | 13F | Walleye Capital LLC | 0 | -100,00 | 0 | -100,00 | ||||
| 2026-01-29 | 13F | Vanguard Group Inc | 24.657.783 | 15,47 | 226.901 | 18,68 | ||||
| 2026-01-29 | 13F | UMA Financial Services, Inc. | 35 | 0,00 | 0 | |||||
| 2026-02-02 | 13F | SevenBridge Financial Group, LLC | 12.250 | 0,00 | 149 | 44,66 | ||||
| 2026-02-12 | 13F | Cibc World Markets Corp | 0 | -100,00 | 0 | |||||
| 2026-02-17 | 13F | PenderFund Capital Management Ltd. | 256.800 | 61,21 | 2.363 | 65,71 | ||||
| 2025-10-15 | 13F | Southland Equity Partners LLC | 0 | -100,00 | 0 | -100,00 | ||||
| 2026-02-17 | 13F | Quadrature Capital Ltd | 109.900 | 1.011 | ||||||
| 2026-02-17 | 13F | Susquehanna International Group, Llp | Call | 4.756.700 | 57,77 | 43.762 | 62,18 | |||
| 2026-01-28 | 13F | Kapitalo Investimentos Ltda | 0 | -100,00 | 0 | -100,00 | ||||
| 2026-02-17 | 13F | Susquehanna International Group, Llp | 1.963.298 | -15,35 | 18.062 | -12,98 | ||||
| 2026-01-13 | 13F | Ausbil Investment Management Ltd | 65.000 | -35,58 | 598 | -34,72 | ||||
| 2026-02-17 | 13F | Susquehanna International Group, Llp | Put | 465.200 | -15,53 | 4.280 | -13,17 | |||
| 2026-02-10 | 13F | CIBC Asset Management Inc | 8.821.855 | 341,95 | 81.312 | 354,86 | ||||
| 2026-02-17 | 13F | Graham Capital Management, L.P. | 0 | -100,00 | 0 | |||||
| 2026-02-12 | 13F/A | Pinebridge Investments Llc | 319.386 | 4.034 | ||||||
| 2026-02-13 | 13F | Wright Wealth Llc | 10.555 | 97 | ||||||
| 2026-02-10 | 13F | PCJ Investment Counsel Ltd. | 506.190 | -2,69 | 4.658 | 0,02 | ||||
| 2026-02-17 | 13F | DV Trading LLC | 793 | 7 | ||||||
| 2026-02-04 | 13F | Knuff & Co LLC | 11.250 | 104 | ||||||
| 2026-02-17 | 13F | Parallax Volatility Advisers, L.P. | Call | 1.140.000 | 65,07 | 10.488 | 69,71 | |||
| 2026-02-06 | 13F | HighTower Advisors, LLC | 17.705 | -10,15 | 163 | -7,95 | ||||
| 2026-02-17 | 13F | Parallax Volatility Advisers, L.P. | Put | 6.400 | -93,60 | 59 | -93,52 | |||
| 2026-01-09 | 13F | Dudley & Shanley, Inc. | 1.235.150 | 0,00 | 11.382 | 2,96 | ||||
| 2026-02-12 | 13F | Wealthspire Advisors, LLC | 0 | -100,00 | 0 | |||||
| 2026-02-17 | 13F | Cetera Investment Advisers | 145.789 | 5,13 | 1.343 | 8,22 | ||||
| 2026-02-24 | 13F | Bell Investment Advisors, Inc | 807 | 620,54 | 7 | 600,00 | ||||
| 2026-02-12 | 13F | Northwest & Ethical Investments L.P. | 104.075 | 12,33 | 953 | 14,41 | ||||
| 2026-02-23 | 13F | Virtu Financial LLC | 0 | -100,00 | 0 | |||||
| 2026-01-29 | 13F | IMC-Chicago, LLC | 0 | -100,00 | 0 | -100,00 | ||||
| 2026-02-17 | 13F | Grantham, Mayo, Van Otterloo & Co. LLC | 7.765.886 | -11,85 | 71.554 | -9,30 | ||||
| 2026-02-17 | 13F | Tanaka Capital Management Inc | 442.625 | 0,00 | 4 | 33,33 | ||||
| 2026-02-11 | 13F | Jpmorgan Chase & Co | 4.935.515 | -0,57 | 45.407 | 2,20 | ||||
| 2026-02-13 | 13F | Verition Fund Management LLC | 0 | -100,00 | 0 | |||||
| 2025-11-12 | 13F | Us Bancorp \de\ | 0 | -100,00 | 0 | |||||
| 2026-02-17 | 13F | Cooper Creek Partners Management Llc | 4.048.167 | -40,70 | 37 | -39,34 | ||||
| 2026-01-22 | 13F | Bear Mountain Capital, Inc. | 700 | 8 | ||||||
| 2026-02-13 | 13F | Neuberger Berman Group LLC | 28.800 | 0,00 | 265 | 2,72 | ||||
| 2025-11-21 | 13F/A | Royal Bank Of Canada | Put | 0 | -100,00 | 0 | -100,00 | |||
| 2026-02-13 | 13F | Mountaineer Partners Management, LLC | 538.042 | -4,69 | 4.950 | -2,04 | ||||
| 2025-11-17 | 13F | Sender Co & Partners, Inc. | 0 | -100,00 | 0 | |||||
| 2026-01-14 | 13F | Spire Wealth Management | 3.619 | 0,00 | 33 | 3,13 | ||||
| 2026-01-29 | 13F | Pictet Asset Management Holding SA | 110.623 | 19,78 | 1.019 | 23,22 | ||||
| 2025-11-14 | 13F | Point72 Asia (Singapore) Pte. Ltd. | 499 | 4 | ||||||
| 2025-11-14 | 13F | PineBridge Investments, L.P. | 391.288 | 4.875 | ||||||
| 2026-02-13 | 13F | National Bank Of Canada /fi/ | 595.369 | 12,36 | 5.472 | 15,42 | ||||
| 2026-02-17 | 13F | Cantor Fitzgerald, L. P. | 0 | -100,00 | 0 | -100,00 | ||||
| 2026-02-13 | 13F | Toroso Investments, LLC | 212.721 | 102,64 | 1.957 | 108,41 | ||||
| 2026-02-06 | 13F | Vestmark Advisory Solutions, Inc. | 148.324 | 1.365 | ||||||
| 2026-02-12 | 13F | Voya Investment Management Llc | 675.717 | 0,00 | 6.217 | 2,79 | ||||
| 2026-02-05 | 13F | Bessemer Group Inc | 2.187 | 0 | ||||||
| 2026-02-04 | 13F | Swiss Life Asset Management Ltd | 27.656 | 12,75 | 254 | 15,98 | ||||
| 2025-11-13 | 13F | Dynamic Technology Lab Private Ltd | 0 | -100,00 | 0 | |||||
| 2026-02-17 | 13F | Man Group plc | 594.823 | 68,00 | 5.472 | 72,73 | ||||
| 2026-02-12 | 13F | Scotia Capital Inc. | 246.607 | 4,46 | 2.264 | 7,15 | ||||
| 2026-02-17 | 13F | Turim 21 Investimentos Ltda. | 0 | -100,00 | 0 | |||||
| 2026-02-18 | 13F | Vident Advisory, LLC | 1.452.463 | -44,30 | 13.363 | -42,74 | ||||
| 2026-02-12 | 13F | Federation des caisses Desjardins du Quebec | 370.100 | -3,55 | 3.400 | -0,99 | ||||
| 2026-02-12 | 13F | Great Valley Advisor Group, Inc. | 11.316 | 2,72 | 104 | 6,12 | ||||
| 2026-02-13 | 13F | Macquarie Group Ltd | 118.763 | -5,67 | 1.093 | -3,02 | ||||
| 2026-01-30 | 13F | Pekin Hardy Strauss, Inc. | 185.200 | 12,79 | 1.707 | 16,05 | ||||
| 2026-02-13 | 13F | Rhumbline Advisers | 1 | 0,00 | 0 | |||||
| 2026-02-10 | 13F | Connor, Clark & Lunn Investment Management Ltd. | 2.941.269 | 54,49 | 27.066 | 58,82 | ||||
| 2026-02-13 | 13F | BRITISH COLUMBIA INVESTMENT MANAGEMENT Corp | 347.563 | 4,34 | 3.198 | 7,28 | ||||
| 2026-02-17 | 13F | Sig Brokerage, Lp | Call | 46.600 | -50,00 | 429 | -48,68 | |||
| 2025-11-14 | 13F | Compass Rose Asset Management, LP | 0 | -100,00 | 0 | |||||
| 2026-02-17 | 13F | Ninepoint Partners LP | 380.000 | 0,00 | 3.496 | 2,79 | ||||
| 2026-04-07 | 13F | CoreCap Advisors, LLC | 6.760 | 0,07 | 78 | 25,81 | ||||
| 2026-02-12 | 13F | Steward Partners Investment Advisory, Llc | 13.836 | -3,49 | 127 | -0,78 | ||||
| 2026-02-17 | 13F | ArrowMark Colorado Holdings LLC | 547.655 | 11,16 | 5.038 | 14,27 | ||||
| 2026-02-17 | 13F | Altshuler Shaham Ltd | 49.031 | 7,90 | 451 | 11,08 | ||||
| 2026-02-17 | 13F | Persistent Asset Partners Ltd | 243.529 | -2,34 | 2.242 | 0,40 | ||||
| 2026-01-26 | 13F | Cwm, Llc | 28.164 | 509,48 | 0 | |||||
| 2026-02-12 | 13F | Ankerstar Wealth, LLC | 250 | 2 | ||||||
| 2025-11-14 | 13F | Ubs Asset Management Americas Inc | 0 | -100,00 | 0 | |||||
| 2026-02-13 | 13F | Extract Advisors LLC | 902.505 | 8.303 | ||||||
| 2026-02-17 | 13F | Advisor Group Holdings, Inc. | 35.445 | -7,81 | 326 | 2,19 | ||||
| 2026-02-13 | 13F | Bridgewater Associates, LP | 317.134 | -67,55 | 2.918 | -66,65 | ||||
| 2026-03-06 | 13F | Hsbc Holdings Plc | 69.141 | 202,06 | 637 | 212,25 | ||||
| 2026-02-17 | 13F | Cinctive Capital Management LP | 0 | -100,00 | 0 | |||||
| 2026-04-02 | 13F | Marex Group plc | 0 | -100,00 | 0 | -100,00 | ||||
| 2026-04-01 | 13F | Confluence Investment Management Llc | 90.230 | 0,10 | 1.047 | 26,18 | ||||
| 2026-04-06 | 13F | Versant Capital Management, Inc | 2.876 | 0,00 | 33 | 26,92 | ||||
| 2026-01-14 | 13F | Appian Way Asset Management LP | 0 | -100,00 | 0 | |||||
| 2026-02-13 | 13F | Walleye Capital LLC | Call | 154.900 | 182,15 | 1.425 | 190,22 | |||
| 2026-02-13 | 13F | Walleye Capital LLC | Put | 66.500 | -50,41 | 612 | -49,08 | |||
| 2026-02-06 | 13F | Entrust Financial Llc | 325 | 3 | ||||||
| 2026-02-13 | 13F | Goehring & Rozencwajg Associates, LLC | 1.518.939 | 5,32 | 13.974 | 8,26 | ||||
| 2026-01-28 | 13F | CAPROCK Group, Inc. | 70.000 | 0,00 | 644 | 16,88 | ||||
| 2026-02-17 | 13F | Empyrean Capital Partners, LP | 0 | -100,00 | 0 | |||||
| 2026-02-13 | 13F | Caitong International Asset Management Co., Ltd | 2.440 | 22 | ||||||
| 2026-02-17 | 13F | Schonfeld Strategic Advisors LLC | 0 | -100,00 | 0 | |||||
| 2026-02-12 | 13F | Renaissance Technologies Llc | 609.200 | 5.605 | ||||||
| 2026-02-17 | 13F | Wellington Management Group Llp | 1.691.552 | 165,77 | 15.566 | 173,26 | ||||
| 2026-02-13 | 13F | Wells Fargo & Company/mn | 411.735 | 1,67 | 3.785 | 4,41 | ||||
| 2026-02-17 | 13F | Boothbay Fund Management, Llc | 0 | -100,00 | 0 | |||||
| 2026-02-17 | 13F | D. E. Shaw & Co., Inc. | 1.284.189 | 68,51 | 11.815 | 73,23 | ||||
| 2026-01-27 | 13F | Rye Brook Capital LLC | 773.300 | -0,08 | 7 | 16,67 | ||||
| 2026-02-17 | 13F | Wiley Bros.-aintree Capital, Llc | 15.784 | -12,67 | 145 | -9,94 | ||||
| 2025-11-14 | 13F | Tudor Investment Corp Et Al | 0 | -100,00 | 0 | -100,00 | ||||
| 2025-12-17 | 13F | NewGen Asset Management Ltd | 0 | -100,00 | 0 | -100,00 | ||||
| 2026-02-17 | 13F | ION Fund Management Ltd | 1.996.940 | 18.372 | ||||||
| 2026-02-18 | 13F | NFP Retirement, Inc. | 15.500 | 143 | ||||||
| 2026-02-10 | 13F | Greenwich Wealth Management LLC | 300.000 | 138,55 | 3 | 100,00 | ||||
| 2026-02-17 | 13F | Nomura Holdings Inc | 12.965 | -0,77 | 119 | 2,59 | ||||
| 2026-02-10 | 13F | Natixis Advisors, L.p. | 0 | -100,00 | 0 | |||||
| 2026-02-06 | 13F | Verde Servicos Internacionais S.A. | 0 | -100,00 | 0 | |||||
| 2026-02-13 | 13F | OMERS ADMINISTRATION Corp | 0 | -100,00 | 0 | |||||
| 2026-02-17 | 13F | Agf Management Ltd | 1.582.979 | 123,41 | 14.566 | 129,64 |