Grundlæggende statistik
| Institutionelle ejere | 141 total, 141 long only, 0 short only, 0 long/short - change of -19,66% MRQ |
| Gennemsnitlig porteføljeallokering | 0.3782 % - change of -35,09% MRQ |
| Institutionelle aktier (lange) | 16.558.088 (ex 13D/G) - change of -7,85MM shares -31,07% MRQ |
| Institutionel værdi (lang) | $ 1.535.088 USD ($1000) |
Institutionelt ejerskab og aktionærer
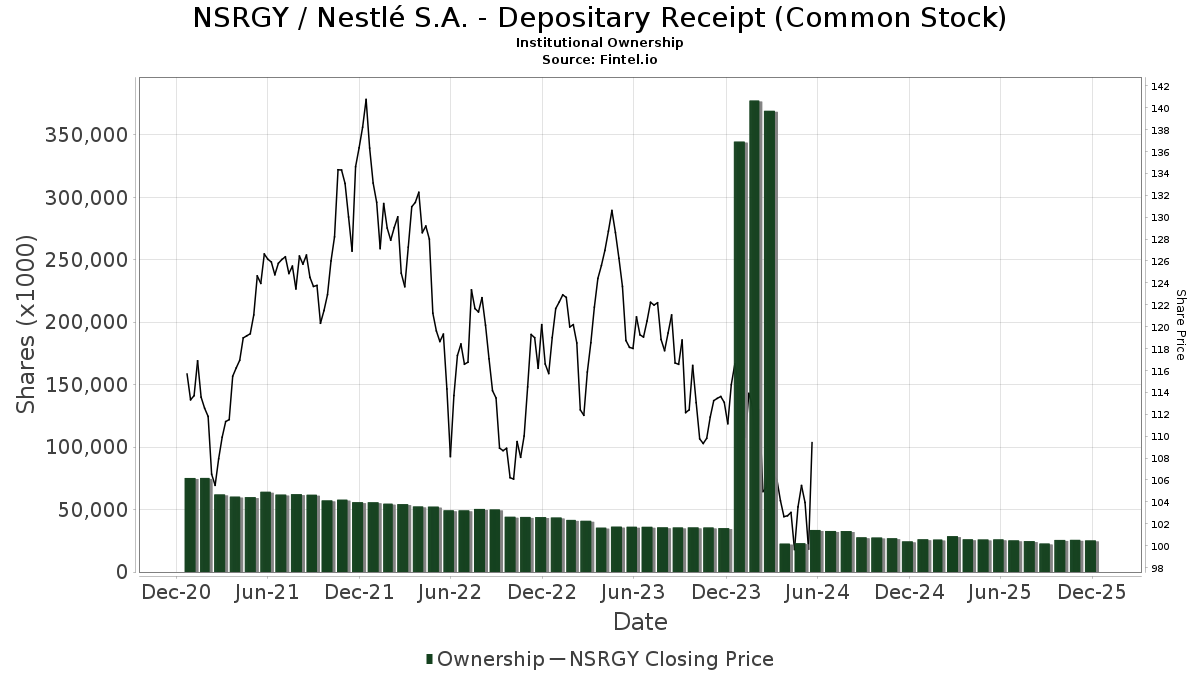
Nestlé S.A. - Depositary Receipt (Common Stock) (US:NSRGY) har 141 institutionelle ejere og aktionærer, der har indsendt 13D/G- eller 13F-formularer til Securities Exchange Commission (SEC). Disse institutioner har i alt 16,558,088 aktier. Største aktionærer omfatter Gardner Russo & Quinn Llc, AWSHX - WASHINGTON MUTUAL INVESTORS FUND Class A, HLMIX - Harding Loevner International Equity Portfolio Institutional, Bristol John W & Co Inc /ny/, Douglas Lane & Associates, LLC, Douglass Winthrop Advisors, LLC, First Manhattan Co, AADEX - American Beacon Large Cap Value Fund Institutional Class, Hantz Financial Services, Inc., and Altrius Capital Management Inc .
Nestlé S.A. - Depositary Receipt (Common Stock) (OTCPK:NSRGY) institutionel ejerskabsstruktur viser aktuelle positioner i virksomheden efter institutioner og fonde, samt seneste ændringer i positionsstørrelse. Større aktionærer kan omfatte individuelle investorer, investeringsforeninger, hedgefonde eller institutioner. Skema 13D angiver, at investoren besidder (eller besidder) mere end 5 % af virksomheden og har til hensigt (eller har til hensigt at) aktivt at forfølge en ændring i forretningsstrategi. Skema 13G indikerer en passiv investering på over 5%.
Fondens stemningsscore
Fund Sentiment Score (fka Ownership Accumulation Score) finder de aktier, der bliver mest købt af fonde. Det er resultatet af en sofistikeret, multi-faktor kvantitativ model, der identificerer virksomheder med de højeste niveauer af institutionel akkumulering. Scoringsmodellen bruger en kombination af den samlede stigning i oplyste ejere, ændringerne i porteføljeallokeringer i disse ejere og andre målinger. Tallet går fra 0 til 100, hvor højere tal indikerer et højere niveau af akkumulering for sine jævnaldrende, og 50 er gennemsnittet.
Opdateringsfrekvens: Dagligt
Se Ownership Explorer, som giver en liste over højest rangerende virksomheder.
AI+ Ask Fintel’s AI assistant about Nestlé S.A. - Depositary Receipt (Common Stock).
Select a question to share a public post with an AI-crafted answer.
Thinking of good questions…
Institutionel Put/Call-forhold
Ud over at indberette standardaktie- og gældsudstedelser skal institutter med mere end 100 mill. aktiver under forvaltning også oplyse deres put- og call-optionsbeholdninger. Da salgsoptioner generelt indikerer negativ stemning, og købsoptioner indikerer positiv stemning, kan vi få en fornemmelse af den overordnede institutionelle stemning ved at plotte forholdet mellem put og kald. Diagrammet til højre viser det historiske put/call-forhold for dette instrument.
Brug af Put/Call Ratio som en indikator for investorernes stemning overvinder en af de vigtigste mangler ved at bruge totalt institutionelt ejerskab, som er, at en betydelig mængde af aktiver under forvaltning investeres passivt for at spore indekser. Passivt forvaltede fonde køber typisk ikke optioner, så indikatoren for put/call-forholdet følger mere nøje følelsen af aktivt forvaltede fonde.
13F og NPORT arkivering
Detaljer om 13F-arkivering er gratis. Detaljer om NP-ansøgninger kræver et premium-medlemskab. Grønne rækker angiver nye positioner. Røde rækker angiver lukkede positioner. Klik på linket ikon for at se den fulde transaktionshistorik.
Opgrader
for at låse premium-data op og eksportere til Excel ![]() .
.
| Fil dato | Kilde | Investor | Type | Gennemsnitlig pris (Øst) |
Aktier | Δ Aktier (%) |
Rapporteret Værdi ($1000) |
Δ Værdi (%) |
Port Alloc (%) |
|
|---|---|---|---|---|---|---|---|---|---|---|
| 2026-01-20 | 13F | Lawson Kroeker Investment Management Inc/ne | 7.205 | -1,37 | 716 | 6,87 | ||||
| 2026-02-02 | 13F | Altrius Capital Management Inc | 88.600 | -0,48 | 8.752 | 7,11 | ||||
| 2026-02-10 | 13F | Pinnacle West Asset Management, Inc. | 2.970 | -2,46 | 0 | |||||
| 2026-02-03 | 13F | Hemenway Trust Co LLC | 4.976 | -71,64 | 492 | -69,50 | ||||
| 2026-02-03 | 13F | Coston, McIsaac & Partners | 79 | 0,00 | 0 | |||||
| 2026-01-28 | 13F | Salomon & Ludwin, LLC | 925 | -0,86 | 89 | 3,49 | ||||
| 2026-02-12 | 13F | McMillan Office, Inc. | 25 | 2 | ||||||
| 2026-02-05 | 13F | RiverFront Investment Group, LLC | 3.757 | -0,56 | 373 | 7,80 | ||||
| 2026-02-13 | 13F | Corient IA LLC | 0 | -100,00 | 0 | |||||
| 2026-02-13 | 13F | Sofos Investments, Inc. | 563 | 0,00 | 56 | 7,84 | ||||
| 2026-02-02 | 13F | Pettee Investors, Inc. | 20.759 | -0,79 | 2.063 | 7,39 | ||||
| 2026-02-06 | 13F | Associated Banc-corp | 2.596 | -64,07 | 258 | -61,09 | ||||
| 2026-02-12 | 13F | Gardner Russo & Quinn Llc | 5.617.162 | -2,79 | 554.863 | 4,63 | ||||
| 2025-09-25 | NP | Elevation Series Trust - The Opal International Dividend Income ETF | 14.537 | 17,03 | 1.264 | -4,53 | ||||
| 2026-01-21 | 13F | Yousif Capital Management, Llc | 29.626 | -15,62 | 2.773 | -13,99 | ||||
| 2026-02-11 | 13F | IMA Wealth, Inc. | 74 | 7 | ||||||
| 2026-02-13 | 13F | Broderick Brian C | 15.905 | -5,21 | 1.571 | 2,08 | ||||
| 2026-01-21 | 13F | Canton Hathaway, LLC | 307 | -0,32 | 30 | 7,14 | ||||
| 2026-02-10 | 13F | Spinnaker Trust | 62.113 | -1,04 | 6.173 | 7,10 | ||||
| 2025-09-26 | NP | AADEX - American Beacon Large Cap Value Fund Institutional Class | 112.201 | -21,24 | 9.759 | -35,73 | ||||
| 2026-02-09 | 13F | Studio Investment Management Llc | 4.483 | 1,79 | 443 | 9,41 | ||||
| 2026-02-11 | 13F | Ramirez Asset Management, Inc. | 58.011 | 1,50 | 5.766 | 9,85 | ||||
| 2025-11-12 | 13F | Ameriflex Group, Inc. | 0 | -100,00 | 0 | |||||
| 2026-02-13 | 13F | Motiv8 Investments LLC | 37 | 0 | ||||||
| 2026-02-13 | 13F | Bristol John W & Co Inc /ny/ | 958.569 | 94.687 | ||||||
| 2025-09-25 | NP | AWSHX - WASHINGTON MUTUAL INVESTORS FUND Class A | 3.053.577 | 44,64 | 265.600 | 24,58 | ||||
| 2025-11-07 | 13F | Murphy & Mullick Capital Management Corp | 0 | -100,00 | 0 | |||||
| 2026-01-30 | 13F | Verity Asset Management, Inc. | 8.605 | 27,96 | 850 | 37,76 | ||||
| 2026-02-14 | 13F | Puzo Michael J | 2.805 | -74,98 | 277 | -73,05 | ||||
| 2025-10-07 | 13F | 1620 Investment Advisors, Inc. | 0 | -100,00 | 0 | |||||
| 2026-01-23 | 13F | Ramsay, Stattman, Vela & Price, Inc. | 60.828 | -4,12 | 6.009 | 3,19 | ||||
| 2026-02-14 | 13F | Kidder Stephen W | 4.215 | -40,38 | 416 | -35,80 | ||||
| 2026-03-05 | 13F | Mengis Capital Management, Inc. | 46.175 | 11,44 | 4.561 | 19,96 | ||||
| 2026-02-09 | 13F | Accent Capital Management, LLC | 2.465 | 5,12 | 243 | 13,02 | ||||
| 2026-02-12 | 13F | Godshalk Welsh Capital Management, Inc. | 10.250 | -5,09 | 1.012 | 2,12 | ||||
| 2026-02-03 | 13F | Violich Capital Management, Inc. | 4.940 | 0,00 | 488 | 7,51 | ||||
| 2026-01-09 | 13F | Diversified Trust Co | 15.270 | 15,38 | 1.518 | 24,86 | ||||
| 2026-02-17 | 13F | Aristotle Capital Management, LLC | 4.678 | 0,86 | 465 | 9,18 | ||||
| 2026-01-20 | 13F | Wall Street Access Asset Management, LLC | 150 | 0,00 | 15 | 7,69 | ||||
| 2025-09-29 | NP | THMEX - CCT Thematic Equity Fund Institutional Shares | 6.349 | -40,52 | 552 | -51,45 | ||||
| 2025-09-25 | NP | HEIIX - Hennessy Equity and Income Fund Institutional Class | 7.958 | -10,61 | 692 | -27,00 | ||||
| 2026-02-13 | 13F | Resources Management Corp /ct/ /adv | 2.300 | 0,00 | 0 | |||||
| 2026-01-06 | 13F | Neville Rodie & Shaw Inc | 33.526 | -1,11 | 3 | 0,00 | ||||
| 2026-01-23 | 13F | Steigerwald, Gordon & Koch Inc. | 1.269 | -6,69 | 125 | 0,81 | ||||
| 2026-02-11 | 13F | Fca Corp /tx | 2.750 | 0,00 | 272 | 7,54 | ||||
| 2026-02-09 | 13F | North Star Asset Management Inc | 7.790 | 0,00 | 769 | 7,70 | ||||
| 2026-01-05 | 13F | GAMMA Investing LLC | 8.728 | 38,36 | 862 | 49,13 | ||||
| 2026-02-11 | 13F | Schulhoff & Co Inc | 5.152 | -1,90 | 512 | 6,22 | ||||
| 2026-02-13 | 13F | Kirtland Hills Capital Management, Llc | 4.259 | -4,89 | 421 | 2,44 | ||||
| 2026-02-17 | 13F | Df Dent & Co Inc | 0 | -100,00 | 0 | |||||
| 2026-01-14 | 13F | ORG Wealth Partners, LLC | 934 | 0,00 | 92 | 8,24 | ||||
| 2026-01-28 | 13F | Kingswood Wealth Advisors, Llc | 5.669 | 106,15 | 560 | 121,83 | ||||
| 2026-02-06 | 13F | Pnc Financial Services Group, Inc. | 2.335 | -46,48 | 231 | -42,50 | ||||
| 2026-02-17 | 13F | Kelly Lawrence W & Associates Inc/ca | 6.545 | -7,10 | 650 | 0,62 | ||||
| 2026-02-02 | 13F | Pinnacle Wealth Management Advisory Group, LLC | 23.948 | -12,98 | 2.366 | -6,34 | ||||
| 2026-02-17 | 13F | Carret Asset Management, Llc | 17.119 | -4,05 | 1.701 | 3,85 | ||||
| 2025-10-17 | 13F | Bard Financial Services, Inc. | 2.461 | 0,00 | 226 | -7,79 | ||||
| 2026-01-27 | 13F | Northstar Asset Management Llc | 26.065 | 0,00 | 2.575 | 7,65 | ||||
| 2026-02-17 | 13F | Ancora Advisors, LLC | 47.520 | -10,82 | 4.694 | -3,99 | ||||
| 2026-01-27 | 13F | Magnolia Capital Management Ltd | 6.000 | 0,00 | 1 | |||||
| 2026-02-04 | 13F | Cascades Capital Asset Management, LLC | 1.019 | 101 | ||||||
| 2026-02-12 | 13F | Front Row Advisors LLC | 177 | 0,00 | 17 | 6,25 | ||||
| 2025-10-30 | 13F | Hara Capital LLC | 0 | -100,00 | 0 | |||||
| 2026-02-14 | 13F | Somerville Kurt F | 34.276 | -13,95 | 3.386 | -7,39 | ||||
| 2025-11-12 | 13F | Mar Vista Investment Partners Llc | 0 | -100,00 | 0 | -100,00 | ||||
| 2026-02-17 | 13F | Signature Equity Partners, LLC | 140 | 14 | ||||||
| 2026-01-20 | 13F | Thurston, Springer, Miller, Herd & Titak, Inc. | 93 | 9 | ||||||
| 2026-02-09 | 13F | Ar Asset Management Inc | 17.000 | 0,00 | 2 | 0,00 | ||||
| 2025-09-29 | NP | CNGLX - Commonwealth Global Fund | 2.750 | 0,00 | 239 | -18,43 | ||||
| 2025-09-26 | NP | DIVD - Altrius Global Dividend ETF | 1.938 | 7,67 | 169 | -12,04 | ||||
| 2025-09-26 | NP | MSTFX - Morningstar International Equity Fund | 54.361 | 0,55 | 4.728 | -17,95 | ||||
| 2026-02-02 | 13F | Academy Capital Management Inc/tx | 34.035 | -2,30 | 3.362 | 5,16 | ||||
| 2026-02-12 | 13F | Sfam, Llc | 750 | 74 | ||||||
| 2026-01-15 | 13F | Gleason Group, Inc. | 145 | 0,00 | 14 | 7,69 | ||||
| 2026-02-04 | 13F | HighPoint Advisor Group LLC | 9.715 | -13,17 | 960 | -6,53 | ||||
| 2026-02-14 | 13F | Delaney Dennis R | 7.435 | -45,17 | 734 | -41,00 | ||||
| 2026-02-04 | 13F | Boyd Watterson Asset Management Llc/oh | 641 | 0,00 | 64 | 8,62 | ||||
| 2026-02-14 | 13F | Elefante Mark B | 6.500 | -0,76 | 642 | 6,82 | ||||
| 2026-01-22 | 13F | Richardson Financial Services Inc. | 10 | 123 | ||||||
| 2026-02-11 | 13F | Monetary Management Group Inc | 1.321 | 0,00 | 131 | 8,26 | ||||
| 2026-02-12 | 13F | Sit Investment Associates Inc | 18.270 | 0,00 | 2 | 0,00 | ||||
| 2025-11-10 | 13F | Dempze Nancy E | 0 | -100,00 | 0 | |||||
| 2026-01-06 | 13F | General Partner, Inc. | 300 | 0,00 | 30 | 7,41 | ||||
| 2026-02-04 | 13F | Wedgewood Investors Inc /pa/ | 2.700 | 0,00 | 267 | 7,69 | ||||
| 2025-10-10 | 13F | Kathleen S. Wright Associates Inc. | 4.790 | 0,00 | 446 | -0,22 | ||||
| 2026-02-14 | 13F | Notis-McConarty Edward | 5.700 | -26,45 | 563 | -20,82 | ||||
| 2026-01-06 | 13F | Tucker Asset Management Llc | 0 | -100,00 | 0 | |||||
| 2026-02-18 | 13F | Garton & Associates Financial Advisors LLC | 100 | 10 | ||||||
| 2026-02-13 | 13F | Boston Family Office Llc | 51.413 | -1,57 | 5 | 25,00 | ||||
| 2026-01-26 | 13F | Main Street Group, LTD | 0 | -100,00 | 0 | |||||
| 2026-01-14 | 13F | Thompson Investment Management, Inc. | 400 | 0,00 | 40 | 8,33 | ||||
| 2026-02-12 | 13F | Bahl & Gaynor Inc | 0 | -100,00 | 0 | |||||
| 2026-01-22 | 13F | Douglas Lane & Associates, LLC | 957.576 | 3,60 | 95.171 | 12,11 | ||||
| 2026-01-29 | 13F | Nbc Securities, Inc. | 655 | -15,05 | 65 | -7,14 | ||||
| 2026-01-27 | 13F | Meritage Portfolio Management | 2.520 | -2,59 | 249 | 4,64 | ||||
| 2026-01-14 | 13F | ORG Partners LLC | 273 | 0,00 | 27 | 4,00 | ||||
| 2026-01-14 | 13F | Generali Investments CEE, investicni spolecnost, a.s. | 37.160 | 57,12 | 3.671 | 69,12 | ||||
| 2026-01-29 | 13F | S.A. Mason LLC | 5.740 | -3,77 | 567 | 3,47 | ||||
| 2026-02-02 | 13F | Sawyer & Company, Inc | 650 | -50,00 | 64 | |||||
| 2026-02-04 | 13F | Raelipskie Partnership | 18.034 | -1,23 | 1.781 | 6,33 | ||||
| 2026-01-05 | 13F | Burkett Financial Services, Llc | 100 | 0,00 | 10 | 0,00 | ||||
| 2026-01-12 | 13F | Cullen Investment Group, Ltd. | 5.420 | -19,21 | 510 | -18,27 | ||||
| 2026-01-29 | 13F | Sentinel Trust Co Lba | 26.135 | 0,00 | 3 | 0,00 | ||||
| 2026-01-14 | 13F | Sky Investment Group LLC | 62.756 | -4,61 | 6.199 | 2,68 | ||||
| 2026-01-29 | 13F | Copeland Capital Management, LLC | 40 | 0,00 | 4 | 0,00 | ||||
| 2026-01-29 | 13F | RMG Wealth Management LLC | 1.891 | 0,00 | 175 | -9,33 | ||||
| 2026-02-17 | 13F | IHT Wealth Management, LLC | 2.836 | 9,03 | 280 | 17,65 | ||||
| 2026-01-28 | 13F | Old National Bancorp /in/ | 2.282 | 227 | ||||||
| 2026-01-27 | 13F | Benedict Financial Advisors Inc | 23.682 | 1,38 | 2.339 | 9,15 | ||||
| 2026-02-12 | 13F | Beck Mack & Oliver Llc | 17.570 | -2,23 | 1.736 | 5,22 | ||||
| 2026-02-12 | 13F | Douglass Winthrop Advisors, LLC | 954.467 | -2,48 | 94.282 | 4,97 | ||||
| 2026-02-23 | 13F | Wealth Preservation Advisors, LLC | 25 | 0,00 | 2 | 0,00 | ||||
| 2026-01-30 | 13F | Archer Investment Corp | 5.059 | -0,18 | 500 | 7,31 | ||||
| 2026-02-03 | 13F | Strengthening Families & Communities, LLC | 0 | -100,00 | 0 | |||||
| 2026-02-09 | 13F | Hantz Financial Services, Inc. | 93.581 | -9,80 | 9 | 0,00 | ||||
| 2025-09-25 | NP | DVRAX - MFS Global Alternative Strategy Fund A | 2.437 | 8,84 | 212 | -11,34 | ||||
| 2025-09-29 | NP | SPWO - SP Funds S&P World (ex-US) ETF | 11.980 | 41,76 | 1.042 | 15,78 | ||||
| 2026-01-15 | 13F | Delta Capital Management Llc | 18.265 | -14,11 | 2 | 0,00 | ||||
| 2026-02-12 | 13F | Azimuth Capital Investment Management LLC | 37.682 | -8,50 | 3.745 | -0,98 | ||||
| 2026-02-10 | 13F | KERR FINANCIAL PLANNING Corp | 0 | -100,00 | 0 | |||||
| 2026-01-29 | 13F | Saybrook Capital /nc | 76.997 | 1,12 | 7.606 | 8,83 | ||||
| 2026-02-17 | 13F | Henry James International Management Inc. | 30.495 | 0,00 | 3.012 | 7,65 | ||||
| 2025-11-14 | 13F | Skopos Labs, Inc. | 0 | -100,00 | 0 | |||||
| 2026-02-10 | 13F | Manitou Investment Management Ltd. | 210 | 0,00 | 21 | 5,26 | ||||
| 2026-01-15 | 13F | Moody Lynn & Lieberson, Llc | 5.820 | 0,10 | 575 | 7,69 | ||||
| 2026-02-13 | 13F | Minot DeBlois Advisors LLC | 8.929 | -0,47 | 882 | 7,17 | ||||
| 2025-11-05 | 13F | Moloney Securities Asset Management, LLC | 0 | -100,00 | 0 | |||||
| 2026-02-11 | 13F | Beddow Capital Management Inc | 73.394 | -0,46 | 7 | 16,67 | ||||
| 2025-09-26 | NP | HLMIX - Harding Loevner International Equity Portfolio Institutional | 2.386.367 | -4,13 | 207.566 | -21,77 | ||||
| 2026-02-13 | 13F | Rhumbline Advisers | 65.420 | 15,71 | 6.462 | 24,56 | ||||
| 2026-02-13 | 13F | Sterling Capital Management LLC | 201 | -98,57 | 20 | -98,53 | ||||
| 2026-02-04 | 13F | Paradigm Asset Management Co Llc | 1.150 | 0,00 | 114 | 7,62 | ||||
| 2026-02-10 | 13F | Lummis Asset Management, LP | 1.781 | 6,90 | 177 | 15,03 | ||||
| 2026-02-11 | 13F | Weik Capital Management | 50.884 | -0,56 | 5.026 | 7,05 | ||||
| 2026-02-13 | 13F | Heritage Wealth Advisors | 1.075 | 0,00 | 106 | 8,16 | ||||
| 2026-02-11 | 13F | Flagship Wealth Advisors, Llc | 400 | 0,00 | 40 | 8,33 | ||||
| 2026-02-17 | 13F | First Manhattan Co | 727.782 | -3,00 | 71.890 | 4,41 | ||||
| 2026-02-02 | 13F | Kornitzer Capital Management Inc /ks | 2.310 | 0,00 | 230 | 8,02 | ||||
| 2026-02-13 | 13F | Williams Jones Wealth Management, LLC. | 8.920 | 0,41 | 881 | 8,10 | ||||
| 2026-01-23 | 13F | Westside Investment Management, Inc. | 439 | 0,00 | 43 | 7,50 | ||||
| 2026-02-12 | 13F | Canopy Partners, LLC | 5.068 | 0,88 | 501 | 8,46 | ||||
| 2026-02-11 | 13F | Vermillion Wealth Management, Inc. | 0 | -100,00 | 0 | |||||
| 2026-01-29 | 13F | Farmers & Merchants Trust Co of Long Beach | 3.769 | -57,98 | 375 | -54,56 | ||||
| 2026-02-11 | 13F | Vaughan David Investments Inc/il | 2.098 | 0 | ||||||
| 2026-02-03 | 13F | Horrell Capital Management, Inc. | 24.330 | -3,38 | 2.418 | 4,58 | ||||
| 2026-02-06 | 13F | Poehling Capital Management, LLC | 25.612 | 2,33 | 2.530 | 10,15 | ||||
| 2026-01-12 | 13F | Byrne Asset Management LLC | 215 | 0,00 | 21 | 10,53 | ||||
| 2026-02-12 | 13F | Burke & Herbert Bank & Trust Co | 0 | -100,00 | 0 | |||||
| 2026-02-10 | 13F | Select Asset Management & Trust | 3.532 | 0,00 | 0 | |||||
| 2026-02-09 | 13F | Councilmark Asset Management, LLC | 4.397 | 0,46 | 434 | 8,23 | ||||
| 2026-02-03 | 13F | Winch Advisory Services, LLC | 108 | 0,00 | 11 | 11,11 | ||||
| 2026-01-15 | 13F | Boston Common Asset Management, LLC | 46.239 | -0,29 | 4.596 | 7,91 | ||||
| 2026-02-04 | 13F | Madison Asset Management, LLC | 3.640 | -9,74 | 360 | -2,97 | ||||
| 2026-01-21 | 13F | Forbes J M & Co Llp | 6.219 | -6,38 | 614 | 0,82 | ||||
| 2026-02-13 | 13F | Estabrook Capital Management | 1.058 | 0,00 | 105 | 8,25 | ||||
| 2026-01-30 | 13F | Kohmann Bosshard Financial Services, LLC | 472 | 47 | ||||||
| 2026-02-03 | 13F | Navellier & Associates Inc | 5.793 | 0,00 | 572 | 7,72 | ||||
| 2026-02-12 | 13F | Benson Wealth Management INC | 54 | 5 |
Other Listings
| DE:NESM | 82,20 € |