Grundlæggende statistik
| Institutionelle aktier (lange) | 107.926.320 - 103,74% (ex 13D/G) - change of -37,10MM shares -25,58% MRQ |
| Institutionel værdi (lang) | $ 2.296.602 USD ($1000) |
Institutionelt ejerskab og aktionærer
Northern Oil and Gas, Inc. (US:NOG) har 331 institutionelle ejere og aktionærer, der har indsendt 13D/G- eller 13F-formularer til Securities Exchange Commission (SEC). Disse institutioner har i alt 107,926,320 aktier. Største aktionærer omfatter BlackRock, Inc., Vanguard Group Inc, American Century Companies Inc, Fmr Llc, State Street Corp, Invesco Ltd., Dimensional Fund Advisors Lp, Alliancebernstein L.p., Westwood Holdings Group Inc, and UBS Group AG .
Northern Oil and Gas, Inc. (NYSE:NOG) institutionel ejerskabsstruktur viser aktuelle positioner i virksomheden efter institutioner og fonde, samt seneste ændringer i positionsstørrelse. Større aktionærer kan omfatte individuelle investorer, investeringsforeninger, hedgefonde eller institutioner. Skema 13D angiver, at investoren besidder (eller besidder) mere end 5 % af virksomheden og har til hensigt (eller har til hensigt at) aktivt at forfølge en ændring i forretningsstrategi. Skema 13G indikerer en passiv investering på over 5%.
The share price as of April 14, 2026 is 25,68 / share. Previously, on April 15, 2025, the share price was 22,43 / share. This represents an increase of 14,49% over that period.

Fondens stemningsscore
Fund Sentiment Score (fka Ownership Accumulation Score) finder de aktier, der bliver mest købt af fonde. Det er resultatet af en sofistikeret, multi-faktor kvantitativ model, der identificerer virksomheder med de højeste niveauer af institutionel akkumulering. Scoringsmodellen bruger en kombination af den samlede stigning i oplyste ejere, ændringerne i porteføljeallokeringer i disse ejere og andre målinger. Tallet går fra 0 til 100, hvor højere tal indikerer et højere niveau af akkumulering for sine jævnaldrende, og 50 er gennemsnittet.
Opdateringsfrekvens: Dagligt
Se Ownership Explorer, som giver en liste over højest rangerende virksomheder.
AI+ Ask Fintel’s AI assistant about Northern Oil and Gas, Inc..
Select a question to share a public post with an AI-crafted answer.
Thinking of good questions…
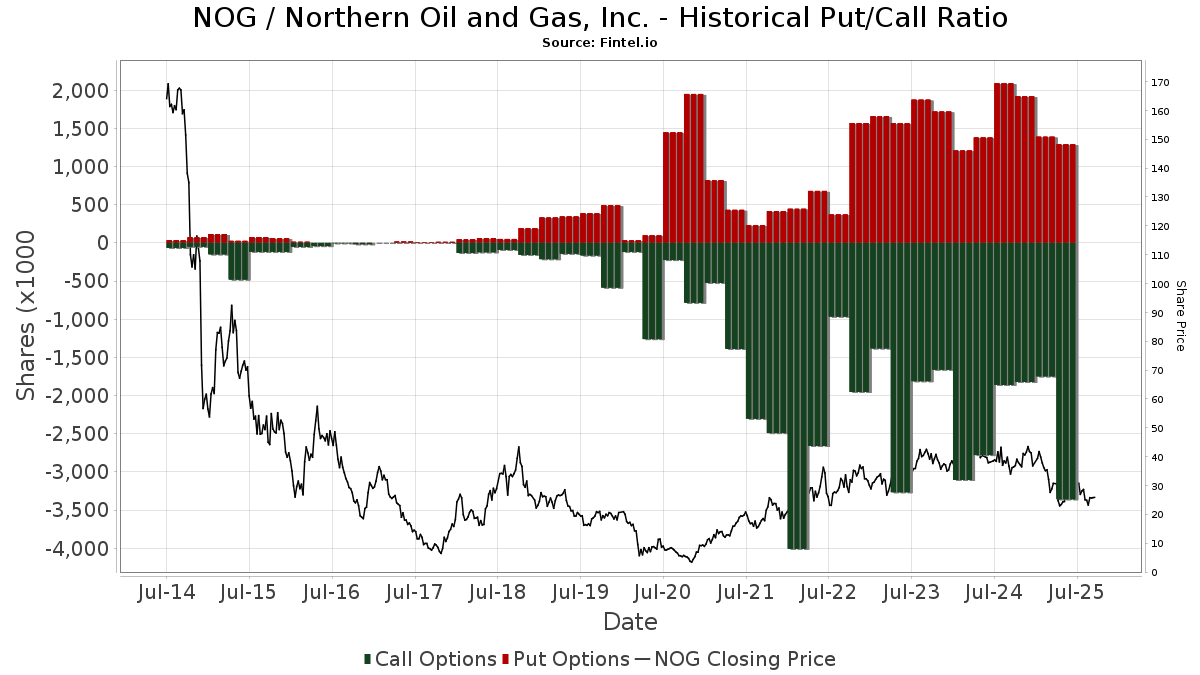
Institutionel Put/Call-forhold
Ud over at indberette standardaktie- og gældsudstedelser skal institutter med mere end 100 mill. aktiver under forvaltning også oplyse deres put- og call-optionsbeholdninger. Da salgsoptioner generelt indikerer negativ stemning, og købsoptioner indikerer positiv stemning, kan vi få en fornemmelse af den overordnede institutionelle stemning ved at plotte forholdet mellem put og kald. Diagrammet til højre viser det historiske put/call-forhold for dette instrument.
Brug af Put/Call Ratio som en indikator for investorernes stemning overvinder en af de vigtigste mangler ved at bruge totalt institutionelt ejerskab, som er, at en betydelig mængde af aktiver under forvaltning investeres passivt for at spore indekser. Passivt forvaltede fonde køber typisk ikke optioner, så indikatoren for put/call-forholdet følger mere nøje følelsen af aktivt forvaltede fonde.
13D/G-arkivering
Vi præsenterer 13D/G ansøgninger separat fra 13F ansøgninger på grund af den forskellige behandling af SEC. 13D/G-ansøgninger kan indgives af grupper af investorer (med én ledende), hvorimod 13F-ansøgninger ikke kan. Dette resulterer i situationer, hvor en investor kan indsende en 13D/G, der rapporterer én værdi for de samlede aktier (der repræsenterer alle de aktier, der ejes af investorgruppen), men derefter indsender en 13F, der rapporterer en anden værdi for de samlede aktier (der udelukkende repræsenterer deres egne) ejendomsret). Det betyder, at aktieejerskab af 13D/G-arkiver og 13F-arkiveringer ofte ikke er direkte sammenlignelige, så vi præsenterer dem separat.
Bemærk: Fra den 16. maj 2021 viser vi ikke længere ejere, der ikke har indsendt en 13D/G inden for det seneste år. Tidligere viste vi den fulde historie af 13D/G-arkiver. Generelt skal enheder, der er forpligtet til at indgive 13D/G-ansøgninger, indgive mindst årligt, før de indsender en afsluttende ansøgning. Dog forlader fonde nogle gange positioner uden at indsende en afsluttende ansøgning (dvs. de afvikler), så visning af den fulde historie resulterede nogle gange i forvirring om det nuværende ejerskab. For at undgå forvirring viser vi nu kun 'aktuelle' ejere - det vil sige - ejere, der har anmeldt inden for det seneste år.
Upgrade to unlock premium data.
| Fil dato | Form | Investor | Forrige Aktier |
Seneste Aktier |
Δ Aktier (Procent) |
Ejendomsret (Procent) |
Δ Ejerskab (Procent) |
|
|---|---|---|---|---|---|---|---|---|
| 2026-03-27 | VANGUARD GROUP INC | 10,587,536 | 0 | -100.00 | 0.00 | -100.00 | ||
| 2026-02-12 | Invesco Ltd. | 5,030,092 | 5.10 | |||||
| 2026-02-05 | FMR LLC | 10,630,809 | 6,924,371 | -34.87 | 7.10 | -32.28 | ||
| 2026-01-21 | DIMENSIONAL FUND ADVISORS LP | 4,941,662 | 4,243,285 | -14.13 | 4.30 | -15.69 | ||
| 2025-11-10 | STATE STREET CORP | 4,743,995 | 5,206,778 | 9.76 | 5.30 | 10.42 | ||
| 2025-08-14 | AMERICAN CENTURY INVESTMENT MANAGEMENT INC | 6,712,314 | 8,033,428 | 19.68 | 8.10 | 20.90 | ||
| 2025-07-17 | BlackRock, Inc. | 15,209,898 | 13,949,576 | -8.29 | 14.10 | -7.24 |
13F og NPORT arkivering
Detaljer om 13F-arkivering er gratis. Detaljer om NP-ansøgninger kræver et premium-medlemskab. Grønne rækker angiver nye positioner. Røde rækker angiver lukkede positioner. Klik på linket ikon for at se den fulde transaktionshistorik.
Opgrader
for at låse premium-data op og eksportere til Excel ![]() .
.
| Fil dato | Kilde | Investor | Type | Gennemsnitlig pris (Øst) |
Aktier | Δ Aktier (%) |
Rapporteret Værdi ($1000) |
Δ Værdi (%) |
Port Alloc (%) |
|
|---|---|---|---|---|---|---|---|---|---|---|
| 2026-02-17 | 13F | Price T Rowe Associates Inc /md/ | 76.359 | -5,96 | 2 | -50,00 | ||||
| 2026-02-24 | 13F | MidFirst Bank | 33 | 1 | ||||||
| 2026-02-13 | 13F | Police & Firemen's Retirement System of New Jersey | 25.716 | -2,30 | 552 | -15,34 | ||||
| 2026-02-13 | 13F | Rafferty Asset Management, LLC | 137.746 | -6,93 | 2.957 | -19,43 | ||||
| 2026-02-09 | 13F | 12th Street Asset Management Company, LLC | 0 | -100,00 | 0 | |||||
| 2026-02-13 | 13F | Prudential Financial Inc | 131.614 | 31,91 | 2.826 | 14,19 | ||||
| 2026-02-17 | 13F | Black Maple Capital Management LP | 33.600 | 721 | ||||||
| 2026-02-13 | 13F | Kennedy Capital Management, Inc. | 884.006 | 17,02 | 18.980 | 1,30 | ||||
| 2026-03-03 | 13F/A | Caitong International Asset Management Co., Ltd | 13 | -97,11 | 0 | -100,00 | ||||
| 2026-02-02 | 13F | Fifth Third Bancorp | 320 | -79,47 | 7 | -84,21 | ||||
| 2026-01-23 | 13F | Private Wealth Management Group, LLC | 0 | -100,00 | 0 | |||||
| 2026-01-27 | 13F | Zurcher Kantonalbank (Zurich Cantonalbank) | 17.637 | 0,00 | 379 | -13,50 | ||||
| 2026-02-13 | 13F | Centerpoint Advisors, LLC | 0 | -100,00 | 0 | |||||
| 2026-02-11 | 13F | Rise Advisors, LLC | 0 | -100,00 | 0 | |||||
| 2026-02-12 | 13F | Triumph Capital Management | 200 | -50,00 | 4 | -55,56 | ||||
| 2026-02-11 | 13F | Hughes Financial Services, LLC | 1 | 0 | ||||||
| 2026-02-06 | 13F | Midwest Professional Planners, LTD. | 19.777 | -53,06 | 425 | -59,39 | ||||
| 2026-01-28 | 13F | Teacher Retirement System Of Texas | 0 | -100,00 | 0 | |||||
| 2026-02-13 | 13F | Charles Schwab Investment Management Inc | 1.450.294 | 7,88 | 31.138 | -6,61 | ||||
| 2026-02-12 | 13F | Swiss National Bank | 182.800 | 0,55 | 3.925 | -12,95 | ||||
| 2025-10-31 | 13F | James Investment Research Inc | 0 | -100,00 | 0 | -100,00 | ||||
| 2026-02-05 | 13F | Allworth Financial LP | 258 | 3,20 | 6 | -16,67 | ||||
| 2026-02-17 | 13F | Tower Research Capital LLC (TRC) | 1.472 | -75,10 | 32 | -78,77 | ||||
| 2025-11-14 | 13F | Bayesian Capital Management, LP | 0 | -100,00 | 0 | -100,00 | ||||
| 2026-02-13 | 13F | Stifel Financial Corp | 0 | -100,00 | 0 | |||||
| 2026-02-06 | 13F | Covestor Ltd | 9.502 | 45,96 | 0 | |||||
| 2026-02-06 | 13F | Larson Financial Group LLC | 3 | -75,00 | 0 | |||||
| 2026-01-13 | 13F | Trust Point Inc. | 13.306 | 19,94 | 286 | 3,64 | ||||
| 2026-02-09 | 13F | Geode Capital Management, Llc | 2.297.677 | -0,97 | 49.343 | -14,27 | ||||
| 2026-02-09 | 13F | Keating Financial Advisory Services, Inc. | 2 | 0 | ||||||
| 2026-02-12 | 13F | Jane Street Group, Llc | Put | 10.000 | -78,45 | 215 | -81,39 | |||
| 2026-02-12 | 13F | Jane Street Group, Llc | Call | 50.700 | 32,03 | 1.089 | 14,29 | |||
| 2026-01-29 | 13F | Copeland Capital Management, LLC | 2.503 | -99,86 | 54 | -99,88 | ||||
| 2026-01-30 | 13F | Mitsubishi UFJ Trust & Banking Corp | 74.508 | 19,30 | 1.600 | 3,29 | ||||
| 2026-02-10 | 13F | Bank of New York Mellon Corp | 1.469.360 | 48,05 | 31.547 | 28,18 | ||||
| 2026-02-10 | 13F | Collar Capital Management, LLC | 134.003 | 2.877 | ||||||
| 2025-10-15 | 13F | Stephens Consulting, LLC | 0 | -100,00 | 0 | |||||
| 2026-04-13 | 13F | IFP Advisors, Inc | 1.200 | -4,91 | 35 | 29,63 | ||||
| 2026-01-28 | 13F | DekaBank Deutsche Girozentrale | 1.655 | 0,00 | 0 | |||||
| 2026-02-11 | 13F | Cedar Mountain Advisors, LLC | 18 | -55,00 | 0 | |||||
| 2026-04-09 | 13F | Epiq Partners, Llc | 65.688 | 1,39 | 1.920 | 38,13 | ||||
| 2026-02-03 | 13F | International Assets Investment Management, Llc | 40 | 1 | ||||||
| 2026-01-30 | 13F | Verity Asset Management, Inc. | 0 | -100,00 | 0 | |||||
| 2026-01-28 | 13F | WPG Advisers, LLC | 106 | 0,00 | 2 | 0,00 | ||||
| 2026-02-17 | 13F | Cresset Asset Management, LLC | 20.738 | 1,57 | 454 | -11,84 | ||||
| 2026-01-21 | 13F | Capital Advisors, Ltd. LLC | 0 | -100,00 | 0 | |||||
| 2026-02-10 | 13F | Easterly Investment Partners Llc | 187.146 | 32,72 | 4.018 | 14,90 | ||||
| 2026-02-10 | 13F | Mutual Of America Capital Management Llc | 461.498 | -2,59 | 9.908 | -15,67 | ||||
| 2026-02-13 | 13F | First National Bank Of Omaha | 90.647 | 31,55 | 1.946 | 13,93 | ||||
| 2026-02-11 | 13F | Investors Towarzystwo Funduszy Inwestycyjnych Spolka Akcyjna | 0 | -100,00 | 0 | -100,00 | ||||
| 2026-02-17 | 13F | Sciencast Management LP | 0 | -100,00 | 0 | |||||
| 2025-11-14 | 13F | Ieq Capital, Llc | 0 | -100,00 | 0 | |||||
| 2026-02-17 | 13F | Woodline Partners LP | 0 | -100,00 | 0 | |||||
| 2026-01-28 | 13F | Peregrine Capital Management Llc | 191.858 | 13,95 | 4.119 | -1,34 | ||||
| 2026-02-11 | 13F | Prestige Wealth Management Group LLC | 95 | 163,89 | 2 | |||||
| 2026-02-17 | 13F | Mercer Global Advisors Inc /adv | 0 | -100,00 | 0 | |||||
| 2026-02-11 | 13F | Simplex Trading, Llc | Put | 37.800 | 5,88 | 812 | ||||
| 2026-02-18 | 13F | GWM Advisors LLC | 1.052 | -88,79 | 23 | -90,52 | ||||
| 2025-11-13 | 13F | Jefferies Financial Group Inc. | 0 | -100,00 | 0 | -100,00 | ||||
| 2026-02-11 | 13F | Simplex Trading, Llc | Call | 21.100 | 7,11 | 453 | ||||
| 2026-03-12 | 13F/A | Peak6 Llc | Call | 0 | -100,00 | 0 | -100,00 | |||
| 2026-01-21 | 13F | Yousif Capital Management, Llc | 26.216 | -12,64 | 580 | -22,04 | ||||
| 2026-02-13 | 13F | Landscape Capital Management, L.l.c. | 0 | -100,00 | 0 | |||||
| 2025-11-14 | 13F | Ellevest, Inc. | 0 | -100,00 | 0 | |||||
| 2026-02-17 | 13F | Grantham, Mayo, Van Otterloo & Co. LLC | 0 | -100,00 | 0 | |||||
| 2026-02-09 | 13F | Quest Partners LLC | 48.225 | 13,04 | 1.035 | -2,17 | ||||
| 2026-02-13 | 13F | Sterling Capital Management LLC | 138.113 | -3,90 | 2.965 | -16,81 | ||||
| 2026-02-17 | 13F | Snowden Capital Advisors LLC | 0 | -100,00 | 0 | |||||
| 2025-11-14 | 13F | Oxford Asset Management Llp | 21.131 | 524 | ||||||
| 2026-02-02 | 13F | Chung Wu Investment Group, LLC | 300 | 0,00 | 6 | -14,29 | ||||
| 2025-11-14 | 13F | Bollard Group LLC | 0 | -100,00 | 0 | |||||
| 2026-02-13 | 13F | MAI Capital Management | 70 | 79,49 | 2 | |||||
| 2026-02-17 | 13F | Advisor Group Holdings, Inc. | 2.614 | -44,41 | 56 | -54,10 | ||||
| 2026-02-02 | 13F | Wolverine Asset Management Llc | Put | 136.900 | 58,45 | 2.939 | 37,21 | |||
| 2026-01-14 | 13F | Jfs Wealth Advisors, Llc | 30 | 3,45 | 1 | |||||
| 2026-02-13 | 13F | Sei Investments Co | 399.625 | 2,85 | 8.580 | -10,96 | ||||
| 2026-02-17 | 13F | Schonfeld Strategic Advisors LLC | 0 | -100,00 | 0 | |||||
| 2026-02-12 | 13F | New York State Common Retirement Fund | 746.078 | -36,16 | 16.018 | -44,74 | ||||
| 2026-02-17 | 13F | Aristotle Capital Boston, LLC | 315.356 | -8,98 | 6.771 | -21,21 | ||||
| 2026-02-03 | 13F | Denali Advisors Llc | 313.261 | 45,85 | 6.726 | 26,27 | ||||
| 2026-02-17 | 13F | Voloridge Investment Management, Llc | 223.203 | 4.792 | ||||||
| 2026-02-12 | 13F | Brown Brothers Harriman & Co | 108 | -79,78 | 2 | -84,62 | ||||
| 2026-02-17 | 13F | Public Employees Retirement System Of Ohio | 130.568 | 27,09 | 2.803 | 10,05 | ||||
| 2026-04-13 | 13F | Trust Co | 20 | 0,00 | 1 | |||||
| 2026-02-10 | 13F | Commonwealth Of Pennsylvania Public School Empls Retrmt Sys | 24.049 | -2,77 | 516 | -15,82 | ||||
| 2026-02-17 | 13F | Ameriprise Financial Inc | 269.783 | -3,45 | 5.795 | -16,41 | ||||
| 2026-02-19 | 13F | Invesco Ltd. | 4.361.776 | 18,67 | 93.647 | 2,74 | ||||
| 2026-01-15 | 13F | Allspring Global Investments Holdings, LLC | 1.297.897 | -24,64 | 28.567 | -32,74 | ||||
| 2026-02-05 | 13F | Isthmus Partners, Llc | 81.739 | 7,18 | 1.755 | -7,24 | ||||
| 2026-02-13 | 13F | Victory Capital Management Inc | 583.958 | -1,63 | 12.538 | -14,84 | ||||
| 2026-02-12 | 13F | Wealthspire Advisors, LLC | 0 | -100,00 | 0 | |||||
| 2026-02-13 | 13F | Cutler Capital Management, LLC | 30.900 | 663 | ||||||
| 2025-10-30 | 13F | Strs Ohio | 0 | -100,00 | 0 | |||||
| 2026-02-17 | 13F | Weiss Asset Management LP | 14.821 | 317 | ||||||
| 2026-02-02 | 13F | Millstone Evans Group, LLC | 250 | 0,00 | 5 | -16,67 | ||||
| 2026-02-13 | 13F | Transamerica Financial Advisors, Inc. | 692 | 15 | ||||||
| 2026-02-17 | 13F | Holocene Advisors, LP | 0 | -100,00 | 0 | |||||
| 2026-02-17 | 13F | Royal Bank Of Canada | 834.936 | -12,79 | 17.926 | -24,50 | ||||
| 2026-02-11 | 13F | Vestcor Inc | 16.462 | 0,00 | 0 | |||||
| 2026-04-13 | 13F | Salem Investment Counselors Inc | 440 | 13 | ||||||
| 2026-02-13 | 13F | Aptus Capital Advisors, LLC | 288.120 | -0,01 | 6.186 | -13,45 | ||||
| 2025-11-14 | 13F | Gallo Partners, LP | 0 | -100,00 | 0 | |||||
| 2025-10-24 | 13F | Bay Colony Advisory Group, Inc d/b/a Bay Colony Advisors | 0 | -100,00 | 0 | |||||
| 2026-02-03 | 13F | Ethic Inc. | 0 | -100,00 | 0 | -100,00 | ||||
| 2025-11-14 | 13F | Texas Permanent School Fund | 0 | -100,00 | 0 | -100,00 | ||||
| 2025-11-14 | 13F | Point72 (DIFC) Ltd | 0 | -100,00 | 0 | |||||
| 2026-02-17 | 13F | California State Teachers Retirement System | 87.914 | -1,24 | 1.888 | -14,50 | ||||
| 2026-04-13 | 13F | Wedge Capital Management L L P/nc | 37.926 | 0,13 | 1.109 | 36,29 | ||||
| 2026-02-03 | 13F | Mitsubishi UFJ Kokusai Asset Management Co., Ltd. | 152 | 0,00 | 3 | 0,00 | ||||
| 2026-01-15 | 13F | Fortitude Family Office, LLC | 16 | -46,67 | 0 | |||||
| 2026-01-14 | 13F | Hennion & Walsh Asset Management, Inc. | 27.902 | -1,90 | 599 | -15,04 | ||||
| 2026-02-06 | 13F | ProShare Advisors LLC | 18.661 | 2,11 | 401 | -11,70 | ||||
| 2026-01-05 | 13F | Commons Capital, Llc | 80.000 | 45,45 | 1.718 | 25,88 | ||||
| 2026-02-05 | 13F | Cambridge Investment Research Advisors, Inc. | 11.674 | -11,32 | 0 | |||||
| 2026-02-17 | 13F | Hotchkis & Wiley Capital Management Llc | 572.961 | 13,71 | 12.301 | -1,56 | ||||
| 2026-04-06 | 13F | GAMMA Investing LLC | 3.287 | 56,00 | 96 | 113,33 | ||||
| 2026-02-23 | 13F | Virtu Financial LLC | 0 | -100,00 | 0 | |||||
| 2026-02-10 | 13F | Re Advisers Corp | 88.500 | 0,00 | 1.900 | -13,40 | ||||
| 2026-02-17 | 13F | Garden State Investment Advisory Services LLC | 14.650 | 16,50 | 315 | 0,96 | ||||
| 2026-02-06 | 13F | Leonteq Securities AG | 25.546 | 87,14 | 548 | 62,13 | ||||
| 2026-02-17 | 13F | Brevan Howard Capital Management LP | 26.162 | -69,36 | 562 | -73,50 | ||||
| 2026-01-29 | 13F | Teachers Retirement System Of The State Of Kentucky | 24.247 | -12,58 | 1 | |||||
| 2026-02-11 | 13F | Illinois Municipal Retirement Fund | 47.795 | -8,08 | 1.026 | -20,40 | ||||
| 2026-02-17 | 13F | Balyasny Asset Management Llc | 180.215 | 7,01 | 3.869 | -7,35 | ||||
| 2026-02-17 | 13F | Fmr Llc | 6.554.767 | -31,69 | 140.731 | -40,86 | ||||
| 2026-02-17 | 13F | Balyasny Asset Management Llc | Put | 280.000 | 6.012 | |||||
| 2026-02-17 | 13F | State Of Wisconsin Investment Board | 0 | -100,00 | 0 | |||||
| 2026-02-13 | 13F | SRS Capital Advisors, Inc. | 276 | -95,83 | 6 | -96,95 | ||||
| 2026-02-17 | 13F | Magnetar Financial LLC | 145.074 | 4.316,26 | 3.115 | 3.744,44 | ||||
| 2026-02-17 | 13F | Northern Trust Corp | 961.436 | -16,42 | 20.642 | -27,64 | ||||
| 2026-01-28 | 13F | Salomon & Ludwin, LLC | 493 | -47,44 | 10 | -56,52 | ||||
| 2026-01-26 | 13F | KBC Group NV | 3.034 | 0,00 | 0 | |||||
| 2026-02-05 | 13F | Thrivent Financial For Lutherans | 66.748 | -4,74 | 1 | 0,00 | ||||
| 2026-02-17 | 13F | Captrust Financial Advisors | 0 | -100,00 | 0 | |||||
| 2026-02-13 | 13F | Gts Securities Llc | 0 | -100,00 | 0 | |||||
| 2026-01-12 | 13F | CVA Family Office, LLC | 0 | -100,00 | 0 | |||||
| 2026-01-28 | 13F | Arizona State Retirement System | 25.678 | -7,46 | 551 | -19,91 | ||||
| 2026-02-13 | 13F | Morgan Stanley | 2.262.731 | 0,27 | 48.581 | -13,19 | ||||
| 2026-02-13 | 13F | Entropy Technologies, LP | 0 | -100,00 | 0 | |||||
| 2026-02-13 | 13F | Squarepoint Ops LLC | Call | 117.500 | 193,02 | 2.523 | 153,72 | |||
| 2026-02-13 | 13F | Squarepoint Ops LLC | Put | 79.800 | -44,81 | 1.713 | -52,23 | |||
| 2026-02-13 | 13F | Squarepoint Ops LLC | 158.529 | 15,06 | 3.404 | -0,41 | ||||
| 2026-01-16 | 13F | Louisiana State Employees Retirement System | 44.500 | -0,22 | 955 | -13,65 | ||||
| 2025-11-13 | 13F | Hsbc Holdings Plc | 0 | -100,00 | 0 | |||||
| 2026-02-11 | 13F | Franklin Resources Inc | 87.543 | 120,95 | 1.880 | 91,34 | ||||
| 2026-02-11 | 13F | Picton Mahoney Asset Management | 33 | 0,00 | 1 | |||||
| 2026-02-17 | 13F | Prelude Capital Management, Llc | 25.336 | 544 | ||||||
| 2026-02-13 | 13F | Pathstone Holdings, LLC | 40.302 | -42,54 | 866 | -50,29 | ||||
| 2026-01-28 | 13F | Klp Kapitalforvaltning As | 20.300 | 0,00 | 444 | -13,31 | ||||
| 2026-01-12 | 13F | Robinson Value Management, Ltd. | 200 | 0,00 | 4 | 0,00 | ||||
| 2026-02-17 | 13F | Aster Capital Management (DIFC) Ltd | 0 | -100,00 | 0 | |||||
| 2026-02-11 | 13F | Jpmorgan Chase & Co | 325.688 | 76,80 | 6.993 | 53,06 | ||||
| 2026-02-09 | 13F | CBIZ Investment Advisory Services, LLC | 0 | -100,00 | 0 | |||||
| 2026-02-13 | 13F | Bridgefront Capital, LLC | 75.157 | 670,13 | 1.614 | 566,53 | ||||
| 2026-02-17 | 13F | Janus Henderson Group Plc | 41.620 | 0,00 | 893 | -13,48 | ||||
| 2026-02-17 | 13F | Elequin Capital Lp | 158 | 3 | ||||||
| 2026-02-13 | 13F | Neo Ivy Capital Management | 0 | -100,00 | 0 | |||||
| 2026-02-13 | 13F | Macquarie Group Ltd | 0 | -100,00 | 0 | |||||
| 2026-02-03 | 13F | Wesbanco Bank Inc | 48.500 | 120,45 | 1.041 | 91,01 | ||||
| 2025-11-04 | 13F | Keybank National Association/oh | 0 | -100,00 | 0 | -100,00 | ||||
| 2026-01-08 | 13F | Maridea Wealth Management LLC | 0 | -100,00 | 0 | |||||
| 2026-01-23 | 13F | Assetmark, Inc | 23 | -68,92 | 0 | -100,00 | ||||
| 2026-01-15 | 13F | Nisa Investment Advisors, Llc | 14.376 | -6,11 | 315 | -18,39 | ||||
| 2026-02-11 | 13F | Empowered Funds, LLC | 382.714 | 5,12 | 8.217 | -8,99 | ||||
| 2025-11-04 | 13F | Pineridge Advisors LLC | 86 | 2,38 | 2 | 0,00 | ||||
| 2026-02-10 | 13F | CIBC Asset Management Inc | 9.620 | 207 | ||||||
| 2026-02-17 | 13F | Gotham Asset Management, LLC | 16.181 | -71,13 | 347 | -75,02 | ||||
| 2026-02-03 | 13F | Garner Asset Management Corp | 6.324 | 136 | ||||||
| 2026-02-13 | 13F | Mariner, LLC | 0 | -100,00 | 0 | |||||
| 2026-02-10 | 13F | Axq Capital, Lp | 0 | -100,00 | 0 | |||||
| 2026-02-13 | 13F | Public Sector Pension Investment Board | 0 | -100,00 | 0 | |||||
| 2026-01-15 | 13F | Range Financial Group LLC | 9.441 | -3,03 | 203 | -16,18 | ||||
| 2025-11-14 | 13F | Point72 Hong Kong Ltd | 0 | -100,00 | 0 | -100,00 | ||||
| 2026-02-05 | 13F | Requisite Capital Management, LLC | 565.547 | 0,28 | 12.397 | -12,96 | ||||
| 2026-02-12 | 13F | Federated Hermes, Inc. | 1.346 | -94,35 | 29 | -95,26 | ||||
| 2026-02-04 | 13F | Oxbow Advisors, LLC | 0 | -100,00 | 0 | |||||
| 2026-01-30 | 13F | Simplicity Wealth,LLC | 0 | -100,00 | 0 | |||||
| 2026-02-17 | 13F | SummitTX Capital, L.P. | 108.905 | 33,78 | 2.338 | 15,86 | ||||
| 2026-02-24 | 13F | Bell Investment Advisors, Inc | 65 | -72,22 | 1 | -80,00 | ||||
| 2026-01-26 | 13F | Heritage Wealth Management, Inc. | 9.800 | 9,50 | 210 | -4,98 | ||||
| 2026-02-06 | 13F | Profund Advisors Llc | 11.857 | 255 | ||||||
| 2026-02-10 | 13F | Godfrey Financial Associates, Inc. | 10 | 0 | ||||||
| 2026-02-03 | 13F | SBI Securities Co., Ltd. | 3.207 | 18,78 | 69 | 3,03 | ||||
| 2026-02-10 | 13F | BW Gestao de Investimentos Ltda. | 0 | -100,00 | 0 | |||||
| 2026-02-13 | 13F | Manufacturers Life Insurance Company, The | 0 | -100,00 | 0 | |||||
| 2025-11-14 | 13F | Nicholas Investment Partners, LP | 0 | -100,00 | 0 | |||||
| 2026-02-17 | 13F | Redwood Park Advisors LLC | 150 | 0,00 | 3 | 0,00 | ||||
| 2026-01-09 | 13F | SG Americas Securities, LLC | 421.809 | 499,85 | 9 | 800,00 | ||||
| 2026-02-11 | 13F | Los Angeles Capital Management Llc | 500 | 11 | ||||||
| 2026-02-02 | 13F | Kornitzer Capital Management Inc /ks | 63.400 | 0,00 | 1.361 | -13,42 | ||||
| 2026-01-27 | 13F | Gf Fund Management Co. Ltd. | 27.933 | 4,82 | 600 | -9,24 | ||||
| 2026-02-03 | 13F | Farmers & Merchants Investments Inc | 60 | 0,00 | 1 | 0,00 | ||||
| 2025-11-07 | 13F | Standard Life Aberdeen plc | 0 | -100,00 | 0 | |||||
| 2026-02-17 | 13F | Aqr Capital Management Llc | 119.033 | -62,49 | 2.556 | -67,53 | ||||
| 2026-02-03 | 13F | Bokf, Na | 18.719 | -24,40 | 402 | -34,69 | ||||
| 2026-01-29 | 13F | Dunhill Financial, LLC | 2 | 0 | ||||||
| 2026-02-17 | 13F | Point72 Asset Management, L.P. | 579.853 | 12.449 | ||||||
| 2026-02-12 | 13F | MetLife Investment Management, LLC | 53.890 | -4,45 | 1.157 | -17,24 | ||||
| 2025-11-14 | 13F | Sapience Investments, LLC | 0 | -100,00 | 0 | |||||
| 2026-02-09 | 13F | Annis Gardner Whiting Capital Advisors, LLC | 0 | -100,00 | 0 | |||||
| 2025-11-14 | 13F | ExodusPoint Capital Management, LP | 0 | -100,00 | 0 | |||||
| 2026-02-05 | 13F | Bessemer Group Inc | 636 | -94,57 | 0 | |||||
| 2026-02-09 | 13F | Hartland & Co., LLC | 0 | -100,00 | 0 | |||||
| 2026-02-13 | 13F | Wells Fargo & Company/mn | 665.116 | 0,70 | 14.280 | -12,82 | ||||
| 2026-02-12 | 13F | Colonial Trust Co / SC | 67 | 0,00 | 1 | 0,00 | ||||
| 2026-02-03 | 13F | Legacy Wealth Managment, LLC/ID | 753 | 0,27 | 16 | -11,11 | ||||
| 2026-02-04 | 13F | Plato Investment Management Ltd | 1.989 | 43 | ||||||
| 2026-02-02 | 13F | Cornerstone Planning Group LLC | 38 | 65,22 | 1 | -100,00 | ||||
| 2026-04-02 | 13F | Byrne Asset Management LLC | 100 | 0,00 | 3 | 0,00 | ||||
| 2026-02-17 | 13F | Optiver Holding B.V. | 0 | -100,00 | 0 | |||||
| 2026-02-02 | 13F | Wolverine Asset Management Llc | 0 | -100,00 | 0 | -100,00 | ||||
| 2026-02-17 | 13F | D. E. Shaw & Co., Inc. | Put | 24.800 | -56,87 | 532 | -62,69 | |||
| 2026-02-17 | 13F | Advisory Services Network, LLC | 0 | -100,00 | 0 | |||||
| 2026-02-17 | 13F | Nomura Holdings Inc | 514.436 | -1,87 | 11.045 | -15,05 | ||||
| 2026-04-08 | 13F | Dynamic Advisor Solutions LLC | 7.510 | 220 | ||||||
| 2026-02-17 | 13F | Wiley Bros.-aintree Capital, Llc | 20.733 | -34,81 | 445 | -43,53 | ||||
| 2026-02-17 | 13F | Corigliano Investment Advisers, LLC | 66.100 | 24,72 | 1.419 | 7,99 | ||||
| 2025-11-14 | 13F | Binnacle Investments Inc | 581 | 4,87 | 14 | -6,67 | ||||
| 2026-04-13 | 13F | Creative Financial Designs Inc /adv | 8 | 0 | ||||||
| 2026-02-17 | 13F | D. E. Shaw & Co., Inc. | Call | 89.200 | 258,23 | 1.915 | 210,37 | |||
| 2026-02-17 | 13F | D. E. Shaw & Co., Inc. | 539.878 | -10,93 | 11.591 | -22,89 | ||||
| 2026-02-17 | 13F | Cahill Financial Advisors Inc | 54.947 | 0,00 | 1.180 | -13,44 | ||||
| 2026-02-17 | 13F | Delaware Management Holdings, Inc. | 929.610 | 19.959 | ||||||
| 2026-01-20 | 13F | Harbor Capital Advisors, Inc. | 1.353 | -97,19 | 0 | -100,00 | ||||
| 2026-02-10 | 13F | Nomura Asset Management Co Ltd | 930 | 0,00 | 20 | -17,39 | ||||
| 2026-04-07 | 13F | Howard Financial Services, Ltd. | 7.770 | 227 | ||||||
| 2026-02-10 | 13F | Natixis Advisors, L.p. | 53.242 | -19,01 | 1 | 0,00 | ||||
| 2025-10-16 | 13F | Silverleafe Capital Partners, LLC | 0 | -100,00 | 0 | |||||
| 2026-02-11 | 13F | Hilton Head Capital Partners, LLC | 778 | 17 | ||||||
| 2026-02-13 | 13F | Verition Fund Management LLC | 36.073 | 64,28 | 774 | 42,28 | ||||
| 2026-02-17 | 13F | Millennium Management Llc | 1.413.015 | 30.337 | ||||||
| 2026-04-13 | 13F | Massmutual Trust Co Fsb/adv | 453 | -39,03 | 13 | -13,33 | ||||
| 2026-02-17 | 13F | EFG International AG | 141.646 | 3.038 | ||||||
| 2026-02-13 | 13F | Pinnacle Wealth Planning Services, Inc. | 2.167 | 47 | ||||||
| 2025-11-14 | 13F | Eqis Capital Management, Inc. | 0 | -100,00 | 0 | -100,00 | ||||
| 2026-02-09 | 13F | Harbour Investments, Inc. | 0 | -100,00 | 0 | |||||
| 2026-02-17 | 13F | Tudor Investment Corp Et Al | Call | 26.400 | 567 | |||||
| 2026-02-17 | 13F | Tudor Investment Corp Et Al | Put | 18.600 | 399 | |||||
| 2026-02-17 | 13F | Westwood Holdings Group Inc | 3.309.394 | 23,20 | 71.053 | 6,66 | ||||
| 2026-02-13 | 13F | Graney & King, LLC | 4 | 0,00 | 0 | |||||
| 2026-04-08 | 13F | DiNuzzo Private Wealth, Inc. | 8 | 0,00 | 0 | |||||
| 2025-10-20 | 13F | Virginia Retirement Systems Et Al | 0 | -100,00 | 0 | |||||
| 2026-01-23 | 13F | Avion Wealth | 947 | 0,32 | 0 | |||||
| 2026-01-30 | 13F | NJ State Employees Deferred Compensation Plan | 0 | -100,00 | 0 | |||||
| 2026-02-12 | 13F | Marex Group plc | 18.299 | 117,79 | 393 | 88,46 | ||||
| 2026-02-17 | 13F | DV Trading LLC | 4 | 0 | ||||||
| 2026-02-13 | 13F | Glen Eagle Advisors, LLC | 35 | 2,94 | 1 | |||||
| 2026-02-10 | 13F | Envestnet Asset Management Inc | 228.838 | -52,83 | 4.913 | -59,16 | ||||
| 2026-02-17 | 13F | Two Sigma Investments, Lp | Put | 0 | -100,00 | 0 | ||||
| 2026-01-08 | 13F | Wealth Enhancement Advisory Services, Llc | 0 | -100,00 | 0 | |||||
| 2026-02-11 | 13F | LPL Financial LLC | 78.128 | -17,14 | 1.677 | -28,27 | ||||
| 2026-02-12 | 13F | Bank Of Montreal /can/ | 6.291 | -6,12 | 135 | -18,67 | ||||
| 2026-02-19 | 13F | CI Private Wealth, LLC | 0 | -100,00 | 0 | |||||
| 2026-02-10 | 13F | Root Financial Partners, LLC | 196 | -21,91 | 4 | -33,33 | ||||
| 2026-02-17 | 13F | Quantinno Capital Management LP | 19.651 | 37,17 | 422 | 18,59 | ||||
| 2026-02-17 | 13F | Alliancebernstein L.p. | 3.537.912 | 7,14 | 75.959 | -7,25 | ||||
| 2026-02-11 | 13F | Westfield Capital Management Co Lp | 0 | -100,00 | 0 | |||||
| 2026-02-17 | 13F | Citadel Advisors Llc | 0 | -100,00 | 0 | -100,00 | ||||
| 2026-04-07 | 13F | Farther Finance Advisors, LLC | 1.510 | 19,84 | 42 | 51,85 | ||||
| 2026-02-13 | 13F | Citigroup Inc | 522.675 | -19,20 | 11.222 | -30,05 | ||||
| 2026-02-17 | 13F | Bridgeway Capital Management Inc | 580.475 | 27,45 | 12.463 | 10,33 | ||||
| 2025-11-14 | 13F | CoreCommodity Management, LLC | 0 | -100,00 | 0 | |||||
| 2026-02-17 | 13F | Russell Investments Group, Ltd. | 283.225 | 45,41 | 6.081 | 25,88 | ||||
| 2026-02-20 | 13F | Sunbelt Securities, Inc. | 28 | 3,70 | 1 | |||||
| 2026-02-17 | 13F | Guggenheim Capital Llc | 38.145 | 72,70 | 819 | 49,54 | ||||
| 2025-10-24 | 13F | Hemington Wealth Management | 38 | -2,56 | 0 | |||||
| 2025-11-07 | 13F | Pallas Capital Advisors LLC | 0 | -100,00 | 0 | |||||
| 2025-11-14 | 13F | Teza Capital Management LLC | 0 | -100,00 | 0 | |||||
| 2026-02-12 | 13F | Nuveen, LLC | 1.317.627 | -4,14 | 28.289 | -17,01 | ||||
| 2026-02-13 | 13F | First Trust Advisors Lp | 538.774 | 37,90 | 11.567 | 19,38 | ||||
| 2026-02-17 | 13F | Lighthouse Investment Partners, LLC | 0 | -100,00 | 0 | |||||
| 2026-01-27 | 13F | First Horizon Corp | 551 | -50,18 | 12 | -59,26 | ||||
| 2026-02-17 | 13F | Signature Equity Partners, LLC | 865 | 19 | ||||||
| 2026-02-09 | 13F | New Age Alpha Advisors, LLC | 0 | -100,00 | 0 | |||||
| 2026-01-21 | 13F | Register Financial Advisors LLC | 89.926 | -13,99 | 1.931 | -25,54 | ||||
| 2026-02-13 | 13F | Segall Bryant & Hamill, Llc | 94.355 | 0,01 | 2.026 | -13,42 | ||||
| 2026-02-12 | 13F | Dimensional Fund Advisors Lp | 4.243.285 | -14,13 | 91.105 | -25,67 | ||||
| 2026-01-30 | 13F | New York State Teachers Retirement System | 41.480 | -8,76 | 1 | -100,00 | ||||
| 2025-11-13 | 13F | Bnp Paribas Arbitrage, Sa | Put | 0 | -100,00 | 0 | -100,00 | |||
| 2026-03-31 | 13F | Sankala Group LLC | 4.097 | 0,00 | 126 | 11,50 | ||||
| 2026-04-14 | 13F | Bay Harbor Wealth Management, LLC | 6 | 50,00 | 0 | |||||
| 2026-01-23 | 13F | Zwj Investment Counsel Inc | 10.243 | 0,00 | 220 | -13,78 | ||||
| 2026-01-21 | 13F | Phocas Financial Corp. | 0 | -100,00 | 0 | |||||
| 2026-02-13 | 13F | JustInvest LLC | 14.345 | -28,99 | 308 | -38,72 | ||||
| 2025-11-14 | 13F | Wolverine Trading, Llc | 43.509 | 1.118 | ||||||
| 2026-01-26 | 13F | Taylor Frigon Capital Management LLC | 72.854 | 1.564 | ||||||
| 2026-02-04 | 13F | Oregon Public Employees Retirement Fund | 22.194 | 1,35 | 477 | -12,34 | ||||
| 2026-02-10 | 13F | Goldman Sachs Group Inc | Call | 170.100 | 0,00 | 3.652 | -13,42 | |||
| 2025-11-14 | 13F | Wolverine Trading, Llc | Call | 42.700 | 46,23 | 1.097 | 29,67 | |||
| 2026-02-10 | 13F | Goldman Sachs Group Inc | Put | 170.100 | 0,00 | 3.652 | -13,42 | |||
| 2025-11-14 | 13F | Wolverine Trading, Llc | Put | 125.500 | 400,00 | 3.225 | 343,60 | |||
| 2026-02-10 | 13F | Goldman Sachs Group Inc | 802.145 | 28,67 | 17.222 | 11,40 | ||||
| 2026-02-12 | 13F | Advisors Asset Management, Inc. | 146.517 | 162,03 | 3.146 | 126,91 | ||||
| 2026-02-11 | 13F | Group One Trading, L.p. | Call | 49.000 | 78,18 | 1.052 | 54,25 | |||
| 2025-11-13 | 13F | Portolan Capital Management, LLC | 0 | -100,00 | 0 | |||||
| 2026-02-11 | 13F | Group One Trading, L.p. | Put | 15.300 | -57,85 | 328 | -63,56 | |||
| 2026-02-12 | 13F | Cibc World Markets Corp | 0 | -100,00 | 0 | |||||
| 2026-02-10 | 13F | Bnp Paribas Arbitrage, Sa | 29.559 | -27,46 | 635 | -37,23 | ||||
| 2026-02-13 | 13F | Channing Capital Management, LLC | 0 | -100,00 | 0 | |||||
| 2026-02-12 | 13F | Skopos Labs, Inc. | 11.288 | 247 | ||||||
| 2026-02-12 | 13F | Ensign Peak Advisors, Inc | 8.331 | -57,56 | 179 | -63,37 | ||||
| 2026-02-14 | 13F | Rockefeller Capital Management L.P. | 2.876 | 226,08 | 62 | 190,48 | ||||
| 2026-02-17 | 13F | Graham Capital Management, L.P. | 79.423 | 660,10 | 1.705 | 558,30 | ||||
| 2026-02-17 | 13F | Citadel Advisors Llc | Put | 79.500 | -51,85 | 1.707 | -58,33 | |||
| 2026-01-26 | 13F | Merit Financial Group, LLC | 0 | -100,00 | 0 | |||||
| 2026-02-17 | 13F | Summit Global Investments | 0 | -100,00 | 0 | |||||
| 2026-02-17 | 13F | Raymond James Financial Inc | Put | 23.300 | 0,00 | 629 | 0,00 | |||
| 2026-02-17 | 13F | Citadel Advisors Llc | Call | 355.900 | 5,48 | 7.641 | -8,68 | |||
| 2026-02-17 | 13F | Raymond James Financial Inc | 605.303 | -13,18 | 12.996 | -24,84 | ||||
| 2026-02-05 | 13F | Amalgamated Bank | 28.194 | 1,62 | 1 | |||||
| 2025-11-14 | 13F | Mount Yale Investment Advisors, LLC | 0 | -100,00 | 0 | -100,00 | ||||
| 2026-02-17 | 13F | Lazard Asset Management Llc | 4.944 | -31,95 | 106 | -41,11 | ||||
| 2026-03-05 | 13F | Bayban | 150 | 3 | ||||||
| 2026-02-10 | 13F | State of Wyoming | 638 | 31,55 | 14 | 8,33 | ||||
| 2026-02-13 | 13F | Mml Investors Services, Llc | 24.033 | 8,68 | 516 | -6,02 | ||||
| 2026-04-14 | 13F | Nbc Securities, Inc. | 107 | 3 | ||||||
| 2026-02-11 | 13F | Jpmorgan Chase & Co | Call | 0 | -100,00 | 0 | -100,00 | |||
| 2026-02-17 | 13F | Glenmede Trust Co Na | 11.928 | 0,76 | 256 | -28,29 | ||||
| 2026-02-11 | 13F | Ameritas Investment Partners, Inc. | 8.104 | 174 | ||||||
| 2026-02-11 | 13F | Jpmorgan Chase & Co | Put | 0 | -100,00 | 0 | -100,00 | |||
| 2026-02-13 | 13F | Ubs Asset Management Americas Inc | 103.956 | 0,71 | 2.232 | -12,82 | ||||
| 2026-02-09 | 13F | Legal & General Group Plc | 227.713 | -2,58 | 4.889 | -15,67 | ||||
| 2026-02-18 | 13F | State of Tennessee, Treasury Department | 29.316 | 21,34 | 733 | 22,20 | ||||
| 2026-02-02 | 13F | Principal Financial Group Inc | 462.919 | -1,30 | 9.939 | -14,56 | ||||
| 2026-02-17 | 13F | Engineers Gate Manager LP | 114.292 | 2.454 | ||||||
| 2026-02-17 | 13F | Dark Forest Capital Management Lp | 195.702 | 778,77 | 4.202 | 661,05 | ||||
| 2026-04-08 | 13F | Doliver Advisors, Lp | 35.191 | 15,97 | 1.029 | 57,91 | ||||
| 2026-01-29 | 13F | IMC-Chicago, LLC | Put | 66.100 | 3,28 | 1.419 | -10,59 | |||
| 2026-02-13 | 13F | Quarry LP | 30 | -96,53 | 1 | -100,00 | ||||
| 2026-01-29 | 13F | IMC-Chicago, LLC | Call | 139.200 | 74,65 | 2.989 | 51,21 | |||
| 2025-11-06 | 13F | Whipplewood Advisors, LLC | 0 | -100,00 | 0 | |||||
| 2026-02-04 | 13F | First National Advisers, LLC | 15.463 | 22,09 | 332 | 5,41 | ||||
| 2026-02-13 | 13F | Great West Life Assurance Co /can/ | 83.919 | 1,09 | 2 | -50,00 | ||||
| 2026-02-17 | 13F | Maryland State Retirement & Pension System | 14.268 | 2,18 | 306 | -11,56 | ||||
| 2026-02-17 | 13F | Abel Hall, LLC | 0 | -100,00 | 0 | |||||
| 2025-10-30 | 13F | Twin Peaks Wealth Advisors, LLC | 0 | -100,00 | 0 | |||||
| 2026-02-17 | 13F | MIRAE ASSET GLOBAL ETFS HOLDINGS Ltd. | 44.540 | -1,18 | 956 | -14,41 | ||||
| 2026-02-17 | 13F | Bank Of America Corp /de/ | 1.050.778 | -7,96 | 22.560 | -20,32 | ||||
| 2026-02-13 | 13F | Umb Bank N A/mo | 1.333 | 7,85 | 29 | -6,67 | ||||
| 2026-01-08 | 13F | True Wealth Design, LLC | 0 | -100,00 | 0 | |||||
| 2026-02-17 | 13F | Hood River Capital Management LLC | 1.270.371 | 1,08 | 27.275 | -12,49 | ||||
| 2025-10-30 | 13F | Jennison Associates Llc | 0 | -100,00 | 0 | -100,00 | ||||
| 2026-02-11 | 13F | J.Safra Asset Management Corp | 0 | -100,00 | 0 | -100,00 | ||||
| 2026-04-08 | 13F | Heritage Family Offices, LLP | 0 | -100,00 | 0 | |||||
| 2026-01-27 | 13F | WealthCollab, LLC | 0 | -100,00 | 0 | |||||
| 2026-02-11 | 13F | Gilpin Wealth Management, Llc | 7 | 0 | ||||||
| 2026-04-06 | 13F | CX Institutional | 0 | -100,00 | 0 | |||||
| 2025-10-30 | 13F | Universal- Beteiligungs- und Servicegesellschaft mbH | 0 | -100,00 | 0 | |||||
| 2026-03-05 | 13F | Gunpowder Capital Management, LLC dba Oliver Wealth Management | 800 | 17 | ||||||
| 2026-02-17 | 13F | Jones Financial Companies Lllp | 1.046 | 28,34 | 22 | 0,00 | ||||
| 2026-02-12 | 13F | BRYN MAWR TRUST Co | 0 | -100,00 | 0 | -100,00 | ||||
| 2026-02-11 | 13F | Vermillion Wealth Management, Inc. | 54 | -26,03 | 1 | 0,00 | ||||
| 2026-02-11 | 13F | Motley Fool Asset Management LLC | 0 | -100,00 | 0 | |||||
| 2026-02-12 | 13F | State Board Of Administration Of Florida Retirement System | 23.383 | 0,00 | 502 | -13,30 | ||||
| 2026-02-17 | 13F | XTX Topco Ltd | 17.910 | -32,40 | 385 | -41,55 | ||||
| 2026-02-13 | 13F | Icon Wealth Advisors, LLC | 0 | -100,00 | 0 | |||||
| 2025-11-14 | 13F | Jane Street Group, Llc | 0 | -100,00 | 0 | -100,00 | ||||
| 2026-04-06 | 13F | Versant Capital Management, Inc | 3.238 | 109,44 | 95 | 184,85 | ||||
| 2026-02-17 | 13F | Susquehanna Portfolio Strategies, LLC | 222.522 | 109,39 | 4.778 | 81,29 | ||||
| 2025-11-12 | 13F | Creekmur Asset Management LLC | 3 | 0,00 | 0 | |||||
| 2026-01-30 | 13F | Us Bancorp \de\ | 8.449 | -14,14 | 181 | -25,82 | ||||
| 2026-01-28 | 13F | Geneos Wealth Management Inc. | 4.280 | 0,00 | 92 | -14,15 | ||||
| 2026-02-13 | 13F | Kestra Advisory Services, LLC | 0 | -100,00 | 0 | |||||
| 2025-11-21 | 13F/A | CIBC Bancorp USA Inc. | 10.341 | 256 | ||||||
| 2026-01-29 | 13F | Vanguard Group Inc | 10.873.455 | 1,32 | 233.453 | -12,29 | ||||
| 2025-11-12 | 13F | Xponance, Inc. | 0 | -100,00 | 0 | |||||
| 2025-11-14 | 13F | Man Group plc | 0 | -100,00 | 0 | -100,00 | ||||
| 2026-02-13 | 13F | Barclays Plc | 458.022 | -32,60 | 9.834 | -41,65 | ||||
| 2026-02-13 | 13F | State Street Corp | 5.183.896 | -0,78 | 113.618 | -13,90 | ||||
| 2026-02-10 | 13F | Intech Investment Management Llc | 32.584 | 0,00 | 700 | -13,49 | ||||
| 2026-04-08 | 13F | West Financial Advisors, LLC | 56 | 1,82 | 2 | 0,00 | ||||
| 2026-02-12 | 13F | Principal Securities, Inc. | 0 | -100,00 | 0 | -100,00 | ||||
| 2025-11-21 | 13F | Nebula Research & Development LLC | 0 | -100,00 | 0 | |||||
| 2026-02-13 | 13F | Walleye Trading LLC | Call | 72.400 | 118,73 | 1.554 | 89,51 | |||
| 2026-02-17 | 13F | Capital Fund Management S.a. | Put | 22.400 | -54,84 | 481 | -60,98 | |||
| 2026-02-13 | 13F | Walleye Trading LLC | Put | 62.000 | 307,89 | 1.331 | 253,99 | |||
| 2025-11-14 | 13F | Sherbrooke Park Advisers Llc | 0 | -100,00 | 0 | |||||
| 2026-02-13 | 13F | Lord, Abbett & Co. Llc | 148.908 | -59,11 | 3 | -66,67 | ||||
| 2026-02-17 | 13F | Susquehanna International Group, Llp | Call | 345.100 | 19,41 | 7.409 | 3,38 | |||
| 2025-11-13 | 13F | Glenmede Investment Management, LP | 14.726 | 0,48 | 365 | -12,05 | ||||
| 2026-02-12 | 13F | Cloud Capital Management, LLC | 0 | -100,00 | 0 | |||||
| 2026-02-17 | 13F | Creative Planning | 134.811 | 46,59 | 2.894 | 26,93 | ||||
| 2026-02-17 | 13F | Susquehanna International Group, Llp | Put | 257.300 | -2,61 | 5.524 | -15,69 | |||
| 2026-02-05 | 13F | Dana Investment Advisors, Inc. | 137.971 | 29,87 | 2.962 | 12,45 | ||||
| 2026-02-09 | 13F | Huntington National Bank | 1 | -99,74 | 0 | -100,00 | ||||
| 2026-02-10 | 13F | Rothschild Investment Llc | 333 | -17,78 | 7 | -30,00 | ||||
| 2026-02-13 | 13F | Hudson Bay Capital Management LP | 90.000 | 0,00 | 1.932 | -13,44 | ||||
| 2026-02-12 | 13F | Federation des caisses Desjardins du Quebec | 50.449 | 14,94 | 1.083 | -0,46 | ||||
| 2026-02-11 | 13F | Janney Montgomery Scott LLC | 13.122 | 25,67 | 0 | |||||
| 2026-02-13 | 13F | Pin Oak Investment Advisors Inc | 109.713 | -17,09 | 3 | -99,94 | ||||
| 2025-11-12 | 13F | Ninepoint Partners LP | 0 | -100,00 | 0 | |||||
| 2026-01-23 | 13F | Westside Investment Management, Inc. | 287 | 0,00 | 6 | -14,29 | ||||
| 2026-02-12 | 13F | Pinnacle Holdings, LLC | 929 | 0,00 | 20 | -17,39 | ||||
| 2026-01-26 | 13F | Cwm, Llc | 2.276 | -89,69 | 0 | |||||
| 2026-04-07 | 13F | Retirement Wealth Solutions LLC | 252 | -22,22 | 7 | 16,67 | ||||
| 2026-02-11 | 13F | Allianz Asset Management GmbH | 123.121 | 1,30 | 2.643 | -12,31 | ||||
| 2025-11-13 | 13F | Fieldview Capital Management, LLC | 0 | -100,00 | 0 | |||||
| 2026-02-12 | 13F | Quadrant Capital Group Llc | 3.092 | 14,86 | 66 | 0,00 | ||||
| 2026-02-12 | 13F | Campbell & CO Investment Adviser LLC | 184.619 | 153,87 | 3.964 | 119,80 | ||||
| 2026-02-17 | 13F | Aventail Capital Group, LP | 0 | -100,00 | 0 | |||||
| 2026-02-05 | 13F | Td Private Client Wealth Llc | 0 | -100,00 | 0 | |||||
| 2026-02-17 | 13F/A | Laurion Capital Management LP | 31.899 | 685 | ||||||
| 2026-02-10 | 13F/A | Northwestern Mutual Wealth Management Co | 55 | 0,00 | 1 | 0,00 | ||||
| 2026-02-05 | 13F | HighMark Wealth Management LLC | 104 | 1,96 | 2 | 0,00 | ||||
| 2026-02-06 | 13F | Gsa Capital Partners Llp | 0 | -100,00 | 0 | |||||
| 2026-02-09 | 13F | Royce & Associates Lp | 219.891 | -8,07 | 4.721 | -20,40 | ||||
| 2026-02-10 | 13F | Savant Capital, LLC | 0 | -100,00 | 0 | |||||
| 2026-02-12 | 13F | Pitcairn Co | 0 | -100,00 | 0 | |||||
| 2026-02-13 | 13F | Kilter Group LLC | 73 | 2 | ||||||
| 2026-02-17 | 13F | SageView Advisory Group, LLC | 112 | 2 | ||||||
| 2025-11-14 | 13F | Integrated Wealth Concepts LLC | 0 | -100,00 | 0 | |||||
| 2026-02-17 | 13F | Aquatic Capital Management LLC | 113.099 | -27,03 | 2.428 | -36,84 | ||||
| 2026-02-17 | 13F | Silvercrest Asset Management Group Llc | 565.161 | -28,04 | 12.134 | -37,70 | ||||
| 2025-11-13 | 13F | Loomis Sayles & Co L P | 0 | -100,00 | 0 | |||||
| 2026-02-17 | 13F | Susquehanna International Group, Llp | 0 | -100,00 | 0 | |||||
| 2026-02-11 | 13F | Parallel Advisors, LLC | 143 | -86,14 | 3 | -88,00 | ||||
| 2026-02-17 | 13F | Kemnay Advisory Services Inc. | 3.424 | 74 | ||||||
| 2026-02-17 | 13F | Point72 Asset Management, L.P. | Put | 0 | -100,00 | 0 | ||||
| 2026-02-06 | 13F | Vestmark Advisory Solutions, Inc. | 26.399 | 567 | ||||||
| 2026-02-18 | 13F | Vermillion & White Wealth Management Group, LLC | 146 | 0,00 | 3 | 0,00 | ||||
| 2026-02-11 | 13F | Cerity Partners LLC | 0 | -100,00 | 0 | |||||
| 2026-02-17 | 13F | Cetera Investment Advisers | 21.083 | -38,23 | 453 | -46,57 | ||||
| 2026-01-12 | 13F | Rialto Wealth Management, LLC | 26 | 766,67 | 1 | |||||
| 2026-01-29 | 13F | Concurrent Investment Advisors, LLC | 21.279 | 127,95 | 457 | 97,40 | ||||
| 2026-02-17 | 13F | Two Sigma Securities, Llc | 0 | -100,00 | 0 | -100,00 | ||||
| 2026-01-22 | 13F | Personal Cfo Solutions, Llc | 0 | -100,00 | 0 | |||||
| 2026-02-13 | 13F | Rhumbline Advisers | 271.936 | 0,29 | 5.838 | -13,18 | ||||
| 2026-02-06 | 13F | Bare Financial Services, Inc | 75 | -59,89 | 2 | -75,00 | ||||
| 2026-02-09 | 13F | Atlantic Trust, LLC | 0 | -100,00 | 0 | |||||
| 2026-02-05 | 13F | HFM Investment Advisors, LLC | 3 | -25,00 | 0 | |||||
| 2026-02-05 | 13F | Atria Investments Llc | 0 | -100,00 | 0 | |||||
| 2026-02-17 | 13F | Virtus Investment Advisers, Inc. | 7.394 | 8,38 | 159 | -6,51 | ||||
| 2025-11-12 | 13F | Laurel Wealth Advisors LLC | 0 | -100,00 | 0 | |||||
| 2026-03-12 | 13F/A | Peak6 Llc | Put | 9.700 | -94,63 | 208 | -95,36 | |||
| 2026-03-12 | 13F/A | Peak6 Llc | 1.713 | -98,89 | 37 | -99,06 | ||||
| 2026-04-10 | 13F | Abound Wealth Management | 6 | 0,00 | 0 | |||||
| 2025-11-14 | 13F | Hrt Financial Lp | 0 | -100,00 | 0 | |||||
| 2026-02-17 | 13F | CastleKnight Management LP | 0 | -100,00 | 0 | |||||
| 2026-02-17 | 13F | Stansberry Asset Management, Llc | 203.631 | 4.372 | ||||||
| 2026-01-26 | 13F | Private Trust Co Na | 1.094 | 101,85 | 23 | 76,92 | ||||
| 2026-02-13 | 13F | National Bank Of Canada /fi/ | 0 | -100,00 | 0 | |||||
| 2026-02-06 | 13F | Global Retirement Partners, LLC | 1.682 | 572,80 | 36 | 500,00 | ||||
| 2026-04-02 | 13F | Ares Financial Consulting, LLC | 29 | 0,00 | 1 | |||||
| 2026-02-12 | 13F | Voya Investment Management Llc | 960.262 | -0,15 | 20.617 | -13,56 | ||||
| 2026-02-06 | 13F | EverSource Wealth Advisors, LLC | 206 | -80,80 | 4 | -84,62 | ||||
| 2026-01-29 | 13F | UMA Financial Services, Inc. | 0 | -100,00 | 0 | |||||
| 2026-02-12 | 13F | Great Valley Advisor Group, Inc. | 18.421 | -6,59 | 396 | -19,22 | ||||
| 2025-11-13 | 13F | Brandywine Global Investment Management, LLC | 0 | -100,00 | 0 | |||||
| 2026-03-24 | 13F/A | Barclays Plc | Call | 0 | -100,00 | 0 | -100,00 | |||
| 2026-01-30 | 13F | State of New Jersey Common Pension Fund D | 89.674 | 0,00 | 1.925 | -13,41 | ||||
| 2026-01-27 | 13F | Tributary Capital Management, LLC | 837.685 | 27,67 | 17.985 | 10,53 | ||||
| 2026-01-29 | 13F | Pictet Asset Management Holding SA | 14.922 | 0,00 | 320 | -13,51 | ||||
| 2026-01-23 | 13F | Deprince Race & Zollo Inc | 1.187.352 | 25.492 | ||||||
| 2026-02-13 | 13F | Walleye Capital LLC | Call | 210.800 | 487,19 | 4.526 | 408,43 | |||
| 2026-02-13 | 13F | Walleye Capital LLC | Put | 185.300 | 698,71 | 3.978 | 591,83 | |||
| 2026-01-29 | 13F | Quest 10 Wealth Builders, Inc. | 0 | -100,00 | 0 | |||||
| 2026-02-13 | 13F | Walleye Capital LLC | 13.435 | 288 | ||||||
| 2026-02-17 | 13F | Van Den Berg Management I, Inc | 38.305 | 3,79 | 822 | -10,16 | ||||
| 2026-02-13 | 13F | Toroso Investments, LLC | 29.817 | 182,36 | 640 | 145,21 | ||||
| 2025-11-07 | 13F | Sierra Ocean, Llc | 0 | -100,00 | 0 | -100,00 | ||||
| 2026-02-06 | 13F | Pnc Financial Services Group, Inc. | 9.506 | -55,06 | 204 | -61,07 | ||||
| 2026-02-13 | 13F | Caxton Associates Llp | 257.612 | 77,94 | 5.531 | 54,04 | ||||
| 2025-11-03 | 13F | EFG Asset Management (North America) Corp. | 116.879 | 1,16 | 2.897 | -11,55 | ||||
| 2026-01-20 | 13F | AdvisorNet Financial, Inc | 1.630 | 0,00 | 35 | -15,00 | ||||
| 2026-02-12 | 13F | Ankerstar Wealth, LLC | 12 | 0 | ||||||
| 2025-11-14 | 13F | Point72 Asia (Singapore) Pte. Ltd. | 0 | -100,00 | 0 | |||||
| 2026-01-29 | 13F | Comerica Bank | 42.629 | -73,27 | 915 | -76,86 | ||||
| 2026-02-09 | 13F | Jefferies Financial Group Inc. | Put | 0 | -100,00 | 0 | -100,00 | |||
| 2026-02-17 | 13F | Expect Equity LLC | 60.830 | 0,00 | 1.306 | -13,40 | ||||
| 2026-02-12 | 13F | BlackRock, Inc. | 14.570.385 | 4,13 | 312.826 | -9,85 | ||||
| 2026-02-17 | 13F | PDT Partners, LLC | 92.522 | -22,43 | 1.986 | -32,84 | ||||
| 2026-02-11 | 13F | Deutsche Bank Ag\ | 303.399 | 0,49 | 6.514 | -13,01 | ||||
| 2026-02-06 | 13F | Cullen/frost Bankers, Inc. | 31 | 0,00 | 1 | |||||
| 2026-02-09 | 13F | Hantz Financial Services, Inc. | 3.973 | -31,98 | 0 | |||||
| 2026-02-12 | 13F | CIBC Private Wealth Group, LLC | 1.110 | -41,11 | 24 | -50,00 | ||||
| 2026-02-13 | 13F | Smartleaf Asset Management LLC | 1.013 | -46,68 | 22 | -56,25 | ||||
| 2026-02-09 | 13F | Penn Capital Management Co Inc | 494.843 | -4,48 | 10.651 | -17,30 | ||||
| 2026-02-10 | 13F | Quantbot Technologies LP | 53.064 | 2.763,68 | 1.139 | 2.431,11 | ||||
| 2026-02-13 | 13F | Pingora Partners LLC | 0 | -100,00 | 0 | |||||
| 2026-01-29 | 13F | UBS Group AG | Call | 1.922.280 | 0,70 | 41.271 | -12,82 | |||
| 2026-02-13 | 13F | American Century Companies Inc | 8.400.047 | 2,11 | 180.349 | -11,60 | ||||
| 2026-01-23 | 13F | State of Alaska, Department of Revenue | 91.485 | 0,70 | 2 | -50,00 | ||||
| 2026-01-29 | 13F | UBS Group AG | 2.344.503 | 31,77 | 50.336 | 14,08 | ||||
| 2026-02-17 | 13F | Capital Fund Management S.a. | Call | 0 | -100,00 | 0 | ||||
| 2025-11-13 | 13F | Bank Of Montreal /can/ | Call | 0 | -100,00 | 0 | -100,00 | |||
| 2026-02-13 | 13F | Neuberger Berman Group LLC | 0 | -100,00 | 0 | |||||
| 2026-02-13 | 13F | Parkside Financial Bank & Trust | 202 | 100,00 | 4 | 100,00 | ||||
| 2026-02-12 | 13F | Sit Investment Associates Inc | 0 | -100,00 | 0 | |||||
| 2026-02-12 | 13F | Steward Partners Investment Advisory, Llc | 3.542 | 55,56 | 76 | 35,71 | ||||
| 2026-04-07 | 13F | Signaturefd, Llc | 4.557 | 35,06 | 133 | 84,72 | ||||
| 2026-02-17 | 13F | Palisade Capital Management Llc/nj | 791.676 | -14,78 | 16.997 | -26,22 | ||||
| 2026-02-09 | 13F | King Luther Capital Management Corp | 36.750 | 0,00 | 789 | -13,39 |
Other Listings
| DE:4LT1 | 22,93 € |