Grundlæggende statistik
| Institutionelle ejere | 316 total, 316 long only, 0 short only, 0 long/short - change of 7,09% MRQ |
| Gennemsnitlig porteføljeallokering | 0.4953 % - change of 19,49% MRQ |
| Institutionelle aktier (lange) | 84.343.463 (ex 13D/G) - change of 6,84MM shares 8,82% MRQ |
| Institutionel værdi (lang) | $ 1.885.975 USD ($1000) |
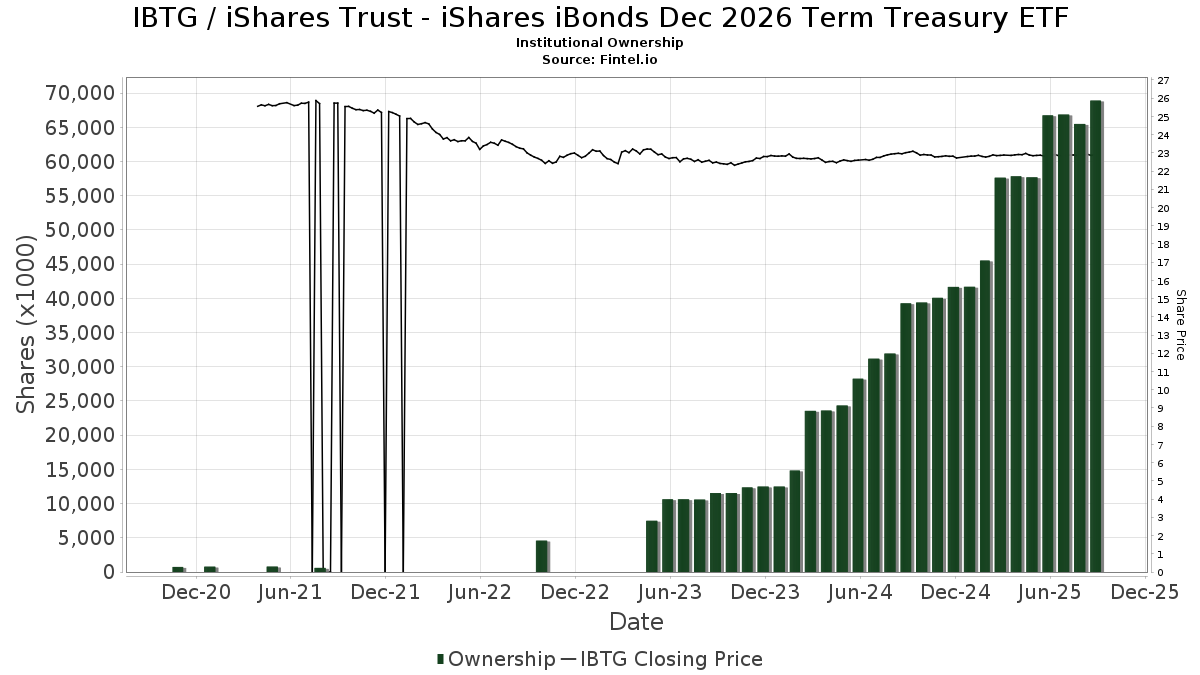
Institutionelt ejerskab og aktionærer
iShares Trust - iShares iBonds Dec 2026 Term Treasury ETF (US:IBTG) har 316 institutionelle ejere og aktionærer, der har indsendt 13D/G- eller 13F-formularer til Securities Exchange Commission (SEC). Disse institutioner har i alt 84,343,463 aktier. Største aktionærer omfatter Hm Payson & Co, Kovitz Investment Group Partners, LLC, Morgan Stanley, Bank Of America Corp /de/, Mercer Global Advisors Inc /adv, Bailard, Inc., Wells Fargo & Company/mn, Capital Investment Advisors, LLC, Raymond James Financial Inc, and LPL Financial LLC .
iShares Trust - iShares iBonds Dec 2026 Term Treasury ETF (NasdaqGM:IBTG) institutionel ejerskabsstruktur viser aktuelle positioner i virksomheden efter institutioner og fonde, samt seneste ændringer i positionsstørrelse. Større aktionærer kan omfatte individuelle investorer, investeringsforeninger, hedgefonde eller institutioner. Skema 13D angiver, at investoren besidder (eller besidder) mere end 5 % af virksomheden og har til hensigt (eller har til hensigt at) aktivt at forfølge en ændring i forretningsstrategi. Skema 13G indikerer en passiv investering på over 5%.
The share price as of March 6, 2026 is 22,87 / share. Previously, on March 10, 2025, the share price was 22,89 / share. This represents a decline of 0,09% over that period.
Fondens stemningsscore
Fund Sentiment Score (fka Ownership Accumulation Score) finder de aktier, der bliver mest købt af fonde. Det er resultatet af en sofistikeret, multi-faktor kvantitativ model, der identificerer virksomheder med de højeste niveauer af institutionel akkumulering. Scoringsmodellen bruger en kombination af den samlede stigning i oplyste ejere, ændringerne i porteføljeallokeringer i disse ejere og andre målinger. Tallet går fra 0 til 100, hvor højere tal indikerer et højere niveau af akkumulering for sine jævnaldrende, og 50 er gennemsnittet.
Opdateringsfrekvens: Dagligt
Se Ownership Explorer, som giver en liste over højest rangerende virksomheder.
AI+ Ask Fintel’s AI assistant about iShares Trust - iShares iBonds Dec 2026 Term Treasury ETF.
Select a question to share a public post with an AI-crafted answer.
Thinking of good questions…
Institutionel Put/Call-forhold
Ud over at indberette standardaktie- og gældsudstedelser skal institutter med mere end 100 mill. aktiver under forvaltning også oplyse deres put- og call-optionsbeholdninger. Da salgsoptioner generelt indikerer negativ stemning, og købsoptioner indikerer positiv stemning, kan vi få en fornemmelse af den overordnede institutionelle stemning ved at plotte forholdet mellem put og kald. Diagrammet til højre viser det historiske put/call-forhold for dette instrument.
Brug af Put/Call Ratio som en indikator for investorernes stemning overvinder en af de vigtigste mangler ved at bruge totalt institutionelt ejerskab, som er, at en betydelig mængde af aktiver under forvaltning investeres passivt for at spore indekser. Passivt forvaltede fonde køber typisk ikke optioner, så indikatoren for put/call-forholdet følger mere nøje følelsen af aktivt forvaltede fonde.
13F og NPORT arkivering
Detaljer om 13F-arkivering er gratis. Detaljer om NP-ansøgninger kræver et premium-medlemskab. Grønne rækker angiver nye positioner. Røde rækker angiver lukkede positioner. Klik på linket ikon for at se den fulde transaktionshistorik.
Opgrader
for at låse premium-data op og eksportere til Excel ![]() .
.
| Fil dato | Kilde | Investor | Type | Gennemsnitlig pris (Øst) |
Aktier | Δ Aktier (%) |
Rapporteret Værdi ($1000) |
Δ Værdi (%) |
Port Alloc (%) |
|
|---|---|---|---|---|---|---|---|---|---|---|
| 2026-01-08 | 13F | Wealth Enhancement Advisory Services, Llc | 188.574 | 5,44 | 4.317 | 5,42 | ||||
| 2026-01-27 | 13F | Regions Financial Corp | 28.605 | -47,76 | 654 | -47,93 | ||||
| 2026-02-10 | 13F | IFG Advisory, LLC | 14.484 | 331 | ||||||
| 2026-02-13 | 13F | Visionary Wealth Advisors | 15.414 | -2,82 | 353 | -3,30 | ||||
| 2025-11-13 | 13F | Nemes Rush Group LLC | 0 | -100,00 | 0 | |||||
| 2026-02-04 | 13F | Money Concepts Capital Corp | 61.967 | 34,17 | 1.417 | 33,81 | ||||
| 2026-01-27 | 13F | Duncker Streett & Co Inc | 24.342 | 0,00 | 557 | -0,36 | ||||
| 2026-01-16 | 13F | Cyr Financial Inc. | 0 | -100,00 | 0 | |||||
| 2026-02-05 | 13F | Avantax Planning Partners, Inc. | 57.906 | -0,01 | 1.325 | -0,38 | ||||
| 2026-02-06 | 13F | Midwest Professional Planners, LTD. | 323.594 | 10,34 | 7.402 | 9,99 | ||||
| 2026-02-10 | 13F | Koss-Olinger Consulting, LLC | 29.656 | 21,63 | 678 | 21,29 | ||||
| 2026-02-13 | 13F | Sunbeam Capital Management, LLC | 88.191 | 1,20 | 2.017 | 0,85 | ||||
| 2026-02-17 | 13F | Aqr Capital Management Llc | 20.387 | 0,00 | 466 | -0,21 | ||||
| 2026-01-09 | 13F | Montecito Bank & Trust | 73.200 | 4,33 | 1.674 | 3,98 | ||||
| 2026-02-13 | 13F | Centaurus Financial, Inc. | 8.818 | 11,28 | 0 | |||||
| 2026-02-13 | 13F | Resources Investment Advisors, LLC. | 21.001 | 480 | ||||||
| 2026-01-14 | 13F | Eastern Bank | 1.990 | 0,00 | 46 | 0,00 | ||||
| 2026-01-29 | 13F | True Link Financial Advisors, LLC | 136.340 | 103,91 | 3.119 | 103,26 | ||||
| 2026-02-04 | 13F | Atlantic Union Bankshares Corp | 4.078 | 0,00 | 93 | 0,00 | ||||
| 2026-02-10 | 13F | Portland Global Advisors LLC | 139.045 | 18,23 | 3.181 | 17,82 | ||||
| 2026-02-11 | 13F | Atlantic Private Wealth, LLC | 255.888 | 7,45 | 5.853 | 7,10 | ||||
| 2025-11-13 | 13F | Eight 31 Financial Llc | 0 | -100,00 | 0 | |||||
| 2025-11-04 | 13F | Pineridge Advisors LLC | 9.304 | 1,02 | 214 | 0,95 | ||||
| 2026-02-17 | 13F | Private Advisor Group, LLC | 175.123 | 2,49 | 4.006 | 2,14 | ||||
| 2026-01-23 | 13F | Kerntke Otto McGlone Wealth Management Group | 244.141 | -1,36 | 5.585 | -1,69 | ||||
| 2026-02-13 | 13F | Kestra Advisory Services, LLC | 0 | -100,00 | 0 | |||||
| 2026-02-13 | 13F | National Bank Of Canada /fi/ | 3.469 | -68,60 | 79 | -68,77 | ||||
| 2026-02-17 | 13F | Fmr Llc | 12.475 | -6,85 | 285 | -7,17 | ||||
| 2026-02-06 | 13F | Pnc Financial Services Group, Inc. | 25.275 | 19,26 | 578 | 18,93 | ||||
| 2026-02-23 | 13F | Mv Capital Management, Inc. | 659.601 | 11,71 | 15.088 | 11,44 | ||||
| 2026-02-10 | 13F | CFS Investment Advisory Services, LLC | 17.267 | 1,17 | 395 | 0,77 | ||||
| 2026-02-13 | 13F | Integrated Wealth Concepts LLC | 1.467.977 | 3,38 | 33.580 | 3,05 | ||||
| 2026-01-20 | 13F | C2P Capital Advisory Group, LLC d.b.a. Prosperity Capital Advisors | 11.502 | 0,06 | 263 | 0,00 | ||||
| 2026-02-13 | 13F | Element Wealth, LLC | 37.215 | -1,52 | 851 | -1,85 | ||||
| 2026-02-03 | 13F | International Assets Investment Management, Llc | 60.111 | -5,01 | 1.375 | -4,84 | ||||
| 2026-02-03 | 13F | Heartland Bank & Trust Co | 63.074 | 0,00 | 1.443 | -0,35 | ||||
| 2026-02-17 | 13F | United Capital Financial Advisers, Llc | 1.686.300 | 26,69 | 38.574 | 26,28 | ||||
| 2026-02-17 | 13F | Hanover Advisors Inc | 10.306 | 236 | ||||||
| 2026-01-23 | 13F | Highland Financial Advisors, LLC | 11.027 | 0,00 | 252 | -0,40 | ||||
| 2026-01-27 | 13F | Summit Wealth Partners, LLC | 64.013 | 0,10 | 1.464 | -0,20 | ||||
| 2026-02-06 | 13F | GPS Wealth Strategies Group, LLC | 486 | -83,46 | 11 | -83,58 | ||||
| 2026-02-11 | 13F | Gilpin Wealth Management, Llc | 370 | 8 | ||||||
| 2026-02-17 | 13F | Prosperity Bancshares Inc | 5.305 | 121 | ||||||
| 2026-01-20 | 13F | Signaturefd, Llc | 160.879 | 7,61 | 3.680 | 7,26 | ||||
| 2026-02-13 | 13F | Stifel Financial Corp | 446.629 | 5,94 | 10.217 | 5,59 | ||||
| 2026-02-09 | 13F | Atlantic Trust, LLC | 1.301 | 30 | ||||||
| 2026-01-16 | 13F | McLean Asset Management Corp | 12.019 | 0,00 | 275 | 0,00 | ||||
| 2026-01-22 | 13F | HHM Wealth Advisors, LLC | 589 | 0,00 | 13 | 0,00 | ||||
| 2026-01-21 | 13F | Clayton Financial Group LLC | 1.955 | 45 | ||||||
| 2026-01-23 | 13F | Farther Finance Advisors, LLC | 9.213 | 4,25 | 211 | 3,96 | ||||
| 2026-02-12 | 13F | Hm Payson & Co | 6.558.915 | 18,96 | 150.035 | 18,57 | ||||
| 2026-02-09 | 13F | Endowment Wealth Management, Inc. | 63.636 | 1.456 | ||||||
| 2026-01-21 | 13F | Apella Capital, LLC | 766.927 | 60,65 | 17.543 | 60,27 | ||||
| 2026-02-06 | 13F | Associated Banc-corp | 92.886 | 3,85 | 2.125 | 3,51 | ||||
| 2026-02-02 | 13F | Greenfield Savings Bank | 0 | -100,00 | 0 | |||||
| 2026-02-18 | 13F | GWM Advisors LLC | 1.817.907 | -4,54 | 41.585 | -4,86 | ||||
| 2026-02-11 | 13F | Janney Montgomery Scott LLC | 396.356 | 20,49 | 9 | 28,57 | ||||
| 2026-02-14 | 13F | Rockefeller Capital Management L.P. | 7.279 | -0,04 | 167 | -0,60 | ||||
| 2025-11-06 | 13F | Oppenheimer & Co Inc | 0 | -100,00 | 0 | -100,00 | ||||
| 2026-01-15 | 13F | Rebalance, Llc | 258.063 | 26,30 | 5.903 | 25,89 | ||||
| 2026-01-15 | 13F | Hara Capital LLC | 3.346 | 0,00 | 77 | 0,00 | ||||
| 2026-02-17 | 13F | Bank Of America Corp /de/ | 3.973.966 | 11,29 | 90.904 | 10,93 | ||||
| 2026-01-20 | 13F | AdvisorNet Financial, Inc | 813 | 1,25 | 19 | 0,00 | ||||
| 2026-01-08 | 13F | Legacy Private Trust Co. | 9.758 | -14,61 | 223 | -14,89 | ||||
| 2026-01-27 | 13F | TD Waterhouse Canada Inc. | 62.913 | 0,84 | 1.439 | 0,84 | ||||
| 2026-02-13 | 13F | Ubs Asset Management Americas Inc | 3.518 | 80 | ||||||
| 2026-02-12 | 13F | Brown Brothers Harriman & Co | 800 | 0,00 | 18 | 0,00 | ||||
| 2026-01-29 | 13F | Jim Saulnier & Associates, Llc | 45.089 | -2,33 | 1.031 | -2,64 | ||||
| 2026-01-22 | 13F | Beacon Financial Planning, Inc | 16.879 | 4,31 | 386 | 4,04 | ||||
| 2026-02-13 | 13F | Mml Investors Services, Llc | 191.620 | 7,22 | 4.383 | 6,88 | ||||
| 2025-11-12 | 13F | CIBC Bancorp USA Inc. | 14.700 | 337 | ||||||
| 2026-01-08 | 13F | Gradient Investments LLC | 171.021 | -5,38 | 3.912 | -5,69 | ||||
| 2026-02-10 | 13F | Savant Capital, LLC | 9.987 | -1,48 | 228 | -1,72 | ||||
| 2026-02-10 | 13F | Envestnet Asset Management Inc | 208.615 | -79,11 | 4.772 | -79,18 | ||||
| 2026-01-21 | 13F | Stonebridge Financial Group, LLC | 34.571 | -47,95 | 791 | -48,16 | ||||
| 2026-01-08 | 13F | Cooper Financial Group | 12.752 | 1,09 | 292 | 0,69 | ||||
| 2026-02-05 | 13F | AlphaCore Capital LLC | 983 | 22 | ||||||
| 2026-02-02 | 13F | Robertson Stephens Wealth Management, LLC | 21.000 | 0,00 | 480 | -0,21 | ||||
| 2026-02-10 | 13F | Cherry Tree Wealth Management, LLC | 11.432 | 3,97 | 262 | 3,57 | ||||
| 2026-02-13 | 13F | Change Path, LLC | 448.425 | 758,56 | 10.258 | 756,18 | ||||
| 2025-11-05 | 13F | Fullcircle Wealth Llc | 55.070 | -5,82 | 1.260 | -5,76 | ||||
| 2026-01-29 | 13F | Comerica Bank | 11.616 | -0,83 | 266 | -1,12 | ||||
| 2026-02-13 | 13F | Gould Asset Management Llc /ca/ | 92.573 | 0,92 | 2.118 | 0,57 | ||||
| 2026-02-11 | 13F | Buckingham Strategic Partners | 0 | -100,00 | 0 | |||||
| 2026-01-14 | 13F | Conrad Siegel Investment Advisors, Inc. | 26.425 | 23,70 | 604 | 23,27 | ||||
| 2026-02-20 | 13F | Kovitz Investment Group Partners, LLC | 4.714.898 | -5,57 | 107.853 | -5,88 | ||||
| 2026-02-04 | 13F | Liberty Wealth Management Llc | 13.767 | 1,13 | 315 | 0,64 | ||||
| 2026-02-12 | 13F | Daybright Advisory Services, Inc. | 20.276 | 464 | ||||||
| 2025-11-14 | 13F | Goldman Sachs Group Inc | 0 | -100,00 | 0 | |||||
| 2026-01-29 | 13F | Compass Ion Advisors, LLC | 45.924 | 0,00 | 1.051 | -0,28 | ||||
| 2026-02-17 | 13F | Wealth Watch Advisors, INC | 0 | -100,00 | 0 | |||||
| 2025-10-22 | 13F | OneAscent Financial Services LLC | 709.275 | 44,55 | 16.278 | 147.872,73 | ||||
| 2026-02-09 | 13F | Churchill Financial Advisors, LLC | 25.445 | 582 | ||||||
| 2026-01-07 | 13F | Harbor Investment Advisory, Llc | 1.200 | 0,00 | 27 | 0,00 | ||||
| 2025-11-05 | 13F | Lokken Investment Group LLC | 9.109 | 0,00 | 209 | 0,48 | ||||
| 2026-02-06 | 13F | EverSource Wealth Advisors, LLC | 341 | 8 | ||||||
| 2026-02-05 | 13F | Thrivent Financial For Lutherans | 320.738 | 28,90 | 7 | 40,00 | ||||
| 2026-01-23 | 13F | Transcend Wealth Collective, Llc | 9.740 | -40,97 | 223 | -41,27 | ||||
| 2026-02-06 | 13F | IFP Advisors, Inc | 102.035 | 10,12 | 2.334 | 9,78 | ||||
| 2026-02-17 | 13F | Creative Planning | 85.563 | 24,29 | 1.957 | 23,94 | ||||
| 2026-01-26 | 13F | McGuire Investment Group, LLC | 390.806 | 11,38 | 8.940 | 11,02 | ||||
| 2026-02-12 | 13F | Sfam, Llc | 197 | 5 | ||||||
| 2025-10-16 | 13F | Precision Wealth Strategies, LLC | 0 | -100,00 | 0 | |||||
| 2026-01-23 | 13F | Asset Advisors Investment Management, LLC | 474.139 | 7,05 | 10.846 | 6,70 | ||||
| 2026-01-28 | 13F | Delta Wealth Advisors LLC | 492.638 | 2,11 | 11.269 | 1,78 | ||||
| 2026-01-30 | 13F | Us Bancorp \de\ | 500 | 0,00 | 11 | 0,00 | ||||
| 2026-01-05 | 13F | Park Avenue Securities Llc | 111.356 | 0,35 | 3 | 0,00 | ||||
| 2026-01-27 | 13F | Belpointe Asset Management LLC | 174.769 | 269,58 | 3.998 | 268,39 | ||||
| 2026-02-12 | 13F | Keeler THomas Management LLC | 77.708 | -3,24 | 1.778 | -3,58 | ||||
| 2026-02-02 | 13F | Dudley Capital Management, Llc | 9.125 | 209 | ||||||
| 2026-01-27 | 13F | Probity Advisors, Inc. | 209.102 | 25,73 | 4.783 | 25,34 | ||||
| 2026-02-13 | 13F | Gts Securities Llc | 0 | -100,00 | 0 | |||||
| 2026-02-10 | 13F | Black Swift Group, LLC | 39.670 | -29,47 | 907 | -29,69 | ||||
| 2026-02-11 | 13F | Hughes Financial Services, LLC | 102.266 | -0,19 | 2.339 | -0,26 | ||||
| 2026-02-11 | 13F | MCF Advisors LLC | 1.276 | 1,75 | 29 | 3,57 | ||||
| 2026-01-07 | 13F | DecisionMap Wealth Management, LLC | 9.270 | 4,27 | 212 | 3,92 | ||||
| 2026-01-29 | 13F | UMA Financial Services, Inc. | 16.715 | 0,00 | 382 | -0,26 | ||||
| 2026-01-29 | 13F/A | Stockman Wealth Management, Inc. | 174.836 | 11,70 | 3.999 | 11,33 | ||||
| 2026-02-06 | 13F | Global Retirement Partners, LLC | 461.906 | 11,59 | 10.566 | 11,23 | ||||
| 2026-02-12 | 13F | Financial Engines Advisors L.L.C. | 396.586 | 18,87 | 9.072 | 18,48 | ||||
| 2026-01-27 | 13F | Berger Financial Group, Inc | 14.343 | 0,00 | 328 | -0,30 | ||||
| 2026-02-02 | 13F | Avidian Wealth Solutions, LLC | 10.315 | -3,67 | 236 | -4,08 | ||||
| 2026-01-23 | 13F | Carnegie Capital Asset Management, LLC | 877.139 | 10,59 | 20.065 | 10,23 | ||||
| 2026-01-26 | 13F | Private Trust Co Na | 0 | -100,00 | 0 | |||||
| 2026-02-05 | 13F | Cambridge Investment Research Advisors, Inc. | 100.278 | 3,74 | 2 | 0,00 | ||||
| 2026-02-17 | 13F | Citadel Advisors Llc | 0 | -100,00 | 0 | |||||
| 2026-01-20 | 13F | Raab & Moskowitz Asset Management LLC | 18.543 | 36,76 | 424 | 36,33 | ||||
| 2026-01-20 | 13F | Stratos Wealth Partners, LTD. | 675.295 | 1,01 | 15.447 | 0,68 | ||||
| 2026-02-10 | 13F | Guidance Point Advisors, LLC | 9.728 | 2,39 | 223 | 1,83 | ||||
| 2026-02-12 | 13F | Connecticut Wealth Management, LLC | 0 | -100,00 | 0 | |||||
| 2026-01-26 | 13F | Spectrum Asset Management, Inc. (NB/CA) | 19.243 | 1,37 | 440 | 1,15 | ||||
| 2026-02-05 | 13F | High Note Wealth, LLC | 46.371 | 25,89 | 1.061 | 25,44 | ||||
| 2026-02-09 | 13F | Prospera Financial Services Inc | 225.918 | 3,75 | 5.168 | 3,40 | ||||
| 2026-02-17 | 13F | Advisor Group Holdings, Inc. | 789.197 | 13,67 | 18.061 | 13,40 | ||||
| 2025-10-08 | 13F | Country Club Bank /gfn | 118.578 | -9,34 | 2.721 | -9,24 | ||||
| 2026-02-12 | 13F | Bank of Jackson Hole Trust | 0 | -100,00 | 0 | |||||
| 2026-01-20 | 13F | Austin Private Wealth, LLC | 62.239 | 0,39 | 1.424 | 0,07 | ||||
| 2026-02-11 | 13F | Parallel Advisors, LLC | 5.929 | 136 | ||||||
| 2026-02-13 | 13F | First National Bank Of Omaha | 103.768 | 2.373 | ||||||
| 2026-01-29 | 13F | Kestra Private Wealth Services, Llc | 56.308 | 39,93 | 1.288 | 39,54 | ||||
| 2026-01-12 | 13F | World Equity Group, Inc. | 12.588 | 5,50 | 288 | 5,13 | ||||
| 2026-02-03 | 13F | Koshinski Asset Management, Inc. | 17.601 | 2,59 | 403 | 2,29 | ||||
| 2026-02-11 | 13F | Private Management Group Inc | 8.825 | 202 | ||||||
| 2026-02-17 | 13F | Equitable Holdings, Inc. | 78.240 | 95,68 | 1.790 | 95,09 | ||||
| 2026-01-26 | 13F | Valmark Advisers, Inc. | 126.958 | 1,81 | 2.904 | 1,47 | ||||
| 2026-02-17 | 13F | Modern Wealth Management, LLC | 67.918 | 53,51 | 1.554 | 53,00 | ||||
| 2026-01-27 | 13F | Autumn Glory Partners, LLC | 13.170 | 0,45 | 301 | 0,33 | ||||
| 2026-02-17 | 13F | Wealth Management Strategies, Inc. | 518.098 | 5,36 | 11.851 | 5,02 | ||||
| 2026-01-26 | 13F | Shelton Wealth Management, Llc | 376.011 | 5,97 | 8.601 | 5,62 | ||||
| 2026-02-12 | 13F | Howland Capital Management Llc | 167.255 | 1,37 | 3.826 | 1,03 | ||||
| 2026-01-15 | 13F | 4J Wealth Management LLC | 12.242 | 0,26 | 280 | 0,00 | ||||
| 2026-01-29 | 13F | D.a. Davidson & Co. | 190.610 | -10,45 | 4.360 | -10,73 | ||||
| 2026-02-09 | 13F | Cary Street Partners Financial Llc | 27.615 | -0,78 | 632 | -1,10 | ||||
| 2026-01-20 | 13F | Blue Square Asset Management, Llc | 10.925 | 250 | ||||||
| 2025-11-12 | 13F | Hamel Associates, Inc. | 11.118 | 8,89 | 255 | 8,97 | ||||
| 2026-02-17 | 13F | SageView Advisory Group, LLC | 550 | 13 | ||||||
| 2026-02-11 | 13F | Straight Path Wealth Management | 39.788 | 46,36 | 910 | 46,07 | ||||
| 2026-02-17 | 13F | Tower Research Capital LLC (TRC) | 77.677 | 35,10 | 1.777 | 34,65 | ||||
| 2026-02-13 | 13F | Colony Group, LLC | 588.408 | -81,07 | 13.460 | -81,13 | ||||
| 2026-01-20 | 13F | Princeton Global Asset Management LLC | 12.430 | 255,14 | 284 | 255,00 | ||||
| 2026-02-06 | 13F | Americana Partners, LLC | 192.574 | -0,28 | 4.405 | -0,59 | ||||
| 2026-02-05 | 13F | Atria Investments Llc | 109.429 | 5,47 | 2.503 | 5,12 | ||||
| 2026-01-22 | 13F | Willis Johnson & Associates, Inc. | 12.842 | 10,83 | 294 | 10,57 | ||||
| 2026-02-17 | 13F | VestGen Advisors, LLC | 8.817 | 202 | ||||||
| 2026-02-17 | 13F | Snowden Capital Advisors LLC | 28.456 | 0,07 | 651 | -0,31 | ||||
| 2026-01-13 | 13F | Stephens Consulting, LLC | 397.664 | 1,60 | 9.097 | 1,27 | ||||
| 2026-01-26 | 13F | Old Point Trust & Financial Services N A | 16.600 | 3,75 | 380 | 3,27 | ||||
| 2026-02-17 | 13F | Captrust Financial Advisors | 206.708 | 18,12 | 4.728 | 17,73 | ||||
| 2026-02-17 | 13F | Mairs & Power Inc | 14.255 | 352,54 | 326 | -0,31 | ||||
| 2026-02-05 | 13F | Hills Bank & Trust Co | 13.710 | 1,24 | 314 | 0,97 | ||||
| 2026-01-20 | 13F | Moseley Investment Management Inc | 822.855 | 124,50 | 18.823 | 123,78 | ||||
| 2026-02-12 | 13F | Lbmc Investment Advisors, Llc | 15.190 | 67,48 | 347 | 66,83 | ||||
| 2026-02-10 | 13F | SCS Capital Management LLC | 34.233 | -66,18 | 783 | -66,29 | ||||
| 2026-02-13 | 13F | Mill Creek Capital Advisors, LLC | 89.775 | 95,67 | 2.054 | 95,15 | ||||
| 2026-01-07 | 13F | Aventura Private Wealth, LLC | 5 | 0,00 | 0 | |||||
| 2026-02-09 | 13F | Summitry Llc | 1.522.715 | 3,01 | 34.832 | 2,68 | ||||
| 2026-02-18 | 13F | Kastel Capital Advisors, LLC | 17.272 | 395 | ||||||
| 2025-11-14 | 13F | Flow Traders U.s. Llc | 0 | -100,00 | 0 | |||||
| 2025-11-14 | 13F/A | NorthRock Partners, LLC | 0 | -100,00 | 0 | |||||
| 2026-02-10 | 13F | Hazlett, Burt & Watson, Inc. | 174 | 1,16 | 0 | |||||
| 2026-01-15 | 13F | Trinity Wealth Management, LLC | 258.390 | 630,08 | 5.911 | 627,83 | ||||
| 2026-02-05 | 13F | Littlejohn Financial Services, Inc. | 144.853 | 7,71 | 3.314 | 7,36 | ||||
| 2026-02-06 | 13F | Great Diamond Partners, LLC | 18.809 | 63,36 | 430 | 62,88 | ||||
| 2026-01-22 | 13F | Yoder Wealth Management, Inc. | 23.231 | 6,41 | 531 | 5,99 | ||||
| 2026-02-13 | 13F | Baird Financial Group, Inc. | 457.326 | 17,51 | 10.461 | 17,12 | ||||
| 2026-02-17 | 13F/A | Kovack Advisors, Inc. | 18.599 | 425 | ||||||
| 2026-02-09 | 13F | Harbour Investments, Inc. | 21.232 | -6,33 | 486 | -6,73 | ||||
| 2026-01-14 | 13F | Lantz Financial LLC | 117.566 | -4,77 | 2.689 | -5,08 | ||||
| 2026-01-21 | 13F | Kfg Wealth Management, Llc | 71.535 | 105,52 | 1.636 | 105,01 | ||||
| 2026-01-26 | 13F | Phillips Financial Management, Llc | 88.291 | 27,51 | 2.020 | 27,06 | ||||
| 2026-01-26 | 13F | Cwm, Llc | 562.434 | 475,19 | 13 | 500,00 | ||||
| 2026-01-14 | 13F | Prosperity Planning, Inc. | 279 | |||||||
| 2026-02-17 | 13F | Susquehanna International Group, Llp | 46.269 | 1.058 | ||||||
| 2026-01-23 | 13F | First PREMIER Bank | 759 | 4,12 | 0 | |||||
| 2026-01-29 | 13F | James Investment Research Inc | 11.000 | 0,00 | 252 | -0,40 | ||||
| 2026-02-17 | 13F | Ameriprise Financial Inc | 319.181 | 11,38 | 7.301 | 11,33 | ||||
| 2026-01-26 | 13F | Merit Financial Group, LLC | 48.603 | 5,01 | 1.112 | 4,61 | ||||
| 2026-01-27 | 13F | Klaas Financial Asset Advisors, LLC | 85.525 | 36,74 | 1.956 | 36,31 | ||||
| 2026-01-15 | 13F | Brookstone Capital Management | 89.432 | 17,79 | 2.046 | 17,39 | ||||
| 2026-01-30 | 13F | Laurel Wealth Advisors LLC | 6.200 | 142 | ||||||
| 2025-10-24 | 13F | Hemington Wealth Management | 1.214 | 0,00 | 0 | |||||
| 2025-10-09 | 13F | Richard P Slaughter Associates Inc | 0 | -100,00 | 0 | |||||
| 2025-11-14 | 13F | CI Private Wealth, LLC | 0 | -100,00 | 0 | |||||
| 2026-01-20 | 13F | Stratos Wealth Advisors, LLC | 1.453.846 | -1,97 | 33.257 | -2,29 | ||||
| 2026-01-21 | 13F | Prime Capital Investment Advisors, LLC | 14.898 | 28,90 | 341 | 28,30 | ||||
| 2026-01-15 | 13F | Signature Wealth Management Group | 21.001 | 0,00 | 480 | -0,21 | ||||
| 2026-02-05 | 13F | Allworth Financial LP | 118.987 | -7,00 | 2.722 | -7,32 | ||||
| 2026-01-21 | 13F | Leo Wealth, LLC | 22.171 | 32,75 | 507 | 32,38 | ||||
| 2026-02-12 | 13F | BlackRock, Inc. | 277.468 | 65,78 | 6.347 | 65,24 | ||||
| 2025-11-17 | 13F | FSA Wealth Management LLC | 89 | 0,00 | 2 | 0,00 | ||||
| 2026-01-21 | 13F | Modera Wealth Management, LLC | 70.392 | 33,04 | 1.610 | 32,62 | ||||
| 2026-01-28 | 13F | Accretive Wealth Partners, LLC | 148.230 | 3,31 | 3.391 | 2,98 | ||||
| 2026-02-03 | 13F | Costello Asset Management, INC | 3.927 | 1,32 | 90 | 1,14 | ||||
| 2026-01-27 | 13F | TFR Capital, LLC. | 100.335 | 7,07 | 2.295 | 6,74 | ||||
| 2026-02-04 | 13F | MONECO Advisors, LLC | 12.588 | 0,00 | 288 | -0,35 | ||||
| 2026-02-09 | 13F | Kestra Investment Management, LLC | 15.237 | 0,37 | 349 | 0,00 | ||||
| 2026-02-18 | 13F | Beacon Pointe Advisors, LLC | 29.812 | 5,53 | 682 | 5,09 | ||||
| 2026-01-08 | 13F | Old Port Advisors | 82.229 | -8,84 | 1.881 | -9,18 | ||||
| 2026-01-15 | 13F | Trust Co | 62.886 | -2,15 | 1.439 | -2,44 | ||||
| 2026-01-20 | 13F | Savvy Advisors, Inc. | 30.105 | 8,18 | 689 | 7,84 | ||||
| 2026-02-04 | 13F | Foundry Financial Group, Inc. | 48.104 | -27,68 | 1.100 | -27,92 | ||||
| 2026-02-04 | 13F | Cannon Financial Strategists, Inc. | 62.798 | 1,16 | 1.437 | 0,84 | ||||
| 2026-02-12 | 13F | CIBC Private Wealth Group, LLC | 14.877 | 1,20 | 340 | 0,89 | ||||
| 2026-02-02 | 13F | Fifth Third Bancorp | 2.185 | 0,00 | 50 | -2,00 | ||||
| 2026-01-30 | 13F | Archer Investment Corp | 213.686 | 4.888 | ||||||
| 2026-02-09 | 13F | Leavell Investment Management, Inc. | 241.706 | 4,25 | 5.529 | 3,93 | ||||
| 2026-01-30 | 13F | Kohmann Bosshard Financial Services, LLC | 2.115 | 48 | ||||||
| 2026-02-04 | 13F | Pensionmark Financial Group, Llc | 12.147 | -13,41 | 262 | -18,69 | ||||
| 2026-02-12 | 13F | Titleist Asset Management, Llc | 334.631 | 3,36 | 7.655 | 3,01 | ||||
| 2026-02-04 | 13F | Bailard, Inc. | 2.824.210 | -8,78 | 64.604 | -9,07 | ||||
| 2026-02-11 | 13F | Madden Advisory Services, Inc. | 25.767 | -1,24 | 589 | -1,51 | ||||
| 2025-10-16 | 13F | Lowe Wealth Advisors, LLC | 1.200 | 0,00 | 28 | 0,00 | ||||
| 2025-11-14 | 13F | Capital Analysts, Inc. | 0 | -100,00 | 0 | |||||
| 2026-02-04 | 13F | Independent Advisor Alliance | 0 | -100,00 | 0 | |||||
| 2026-02-04 | 13F | Mascoma Wealth Management LLC | 9.544 | -4,45 | 218 | -4,80 | ||||
| 2026-02-13 | 13F | Pinnacle Wealth Planning Services, Inc. | 1.989 | 45 | ||||||
| 2026-01-13 | 13F | Capital Investment Advisors, LLC | 2.488.875 | 4,79 | 56.933 | 4,45 | ||||
| 2026-01-22 | 13F | Pinnacle Bancorp, Inc. | 18.202 | -28,33 | 416 | -28,52 | ||||
| 2026-01-16 | 13F | Evexia Wealth Llc | 0 | -100,00 | 0 | |||||
| 2026-02-13 | 13F | RFP Financial Group LLC | 11.047 | -50,76 | 253 | -50,97 | ||||
| 2026-02-05 | 13F | Rossmore Private Capital | 45.356 | 226,54 | 1.038 | 226,10 | ||||
| 2026-02-11 | 13F | Dorsey & Whitney Trust CO LLC | 23.465 | 0,00 | 537 | -0,37 | ||||
| 2026-02-13 | 13F | MAI Capital Management | 170.497 | 2,26 | 3.900 | 1,93 | ||||
| 2026-02-13 | 13F | Morgan Stanley | 3.975.244 | 2,04 | 90.934 | 1,70 | ||||
| 2026-01-22 | 13F | Centennial Advisors, LLC | 117.251 | 2.682 | ||||||
| 2026-02-04 | 13F | Pure Financial Advisors, Inc. | 27.714 | 1,41 | 634 | 0,96 | ||||
| 2026-01-23 | 13F | Robbins Farley Llc | 884 | -4,02 | 20 | -4,76 | ||||
| 2026-02-13 | 13F | Wells Fargo & Company/mn | 2.511.781 | 4,81 | 57.457 | 4,47 | ||||
| 2026-01-30 | 13F | Strategic Blueprint, LLC | 0 | -100,00 | 0 | |||||
| 2026-01-29 | 13F | Focused Wealth Management, Inc | 20.095 | 1,95 | 460 | 1,55 | ||||
| 2026-01-29 | 13F | Mattern Capital Management, Llc | 12.606 | 0,00 | 288 | -0,35 | ||||
| 2026-01-29 | 13F | Scissortail Wealth Management, LLC | 526.067 | 5,46 | 12.034 | 5,11 | ||||
| 2026-02-06 | 13F | Csenge Advisory Group | 27.337 | 44,81 | 625 | 44,34 | ||||
| 2026-02-17 | 13F | Royal Bank Of Canada | 519.265 | 4,27 | 11.878 | 3,93 | ||||
| 2026-01-12 | 13F | RVW Wealth, LLC | 0 | -100,00 | 0 | |||||
| 2026-02-11 | 13F | Jpmorgan Chase & Co | 3.342 | 0,00 | 76 | 0,00 | ||||
| 2026-01-26 | 13F | Asset Dedication, LLC | 271.240 | 320,47 | 6.205 | 319,19 | ||||
| 2026-01-30 | 13F | Bogart Wealth, LLC | 2.976 | -8,26 | 68 | -8,11 | ||||
| 2026-02-17 | 13F | Mercer Global Advisors Inc /adv | 2.842.417 | 126,00 | 65.017 | 125,26 | ||||
| 2026-01-28 | 13F | Barrett & Company, Inc. | 47.836 | 11,88 | 1.094 | 11,52 | ||||
| 2026-02-26 | 13F | TD Capital Management LLC | 2.083 | 1,36 | 48 | 0,00 | ||||
| 2026-01-12 | 13F | AllSquare Wealth Management LLC | 6.904 | 0,00 | 158 | 0,00 | ||||
| 2026-01-21 | 13F | BIP Wealth, LLC | 461.910 | 10.566 | ||||||
| 2026-02-11 | 13F | Cerity Partners LLC | 24.090 | 18,80 | 551 | 18,49 | ||||
| 2026-02-19 | 13F | Atomi Financial Group, Inc. | 107.006 | 2.448 | ||||||
| 2026-01-27 | 13F | Novem Group | 13.722 | -18,94 | 314 | -19,33 | ||||
| 2026-01-13 | 13F | Dakota Wealth Management | 9.109 | 208 | ||||||
| 2026-02-12 | 13F | Reliant Wealth Planning | 66.151 | 3,42 | 1.513 | 3,14 | ||||
| 2026-01-28 | 13F | Juno Financial Group LLC | 460.294 | 10.529 | ||||||
| 2026-02-10 | 13F | Black Cypress Capital Management, LLC | 5.100 | 1,63 | 117 | 0,87 | ||||
| 2026-02-12 | 13F | Woodley Farra Manion Portfolio Management Inc | 17.908 | 8,32 | 410 | 7,92 | ||||
| 2026-02-13 | 13F | Parkside Financial Bank & Trust | 218.579 | 5.000 | ||||||
| 2026-02-09 | 13F | Hartland & Co., LLC | 0 | -100,00 | 0 | |||||
| 2026-02-11 | 13F | CNB Bank | 3.966 | -80,19 | 91 | -80,39 | ||||
| 2026-02-06 | 13F | HighTower Advisors, LLC | 341.310 | -7,56 | 7.807 | -7,86 | ||||
| 2026-02-13 | 13F | Mariner, LLC | 405.997 | 4,89 | 9.287 | 4,56 | ||||
| 2026-01-29 | 13F | UBS Group AG | 1.585.824 | 5,50 | 36.276 | 5,15 | ||||
| 2026-02-10 | 13F | CIBC World Markets Inc. | 28.655 | 0,00 | 656 | -0,30 | ||||
| 2026-01-27 | 13F | Penobscot Investment Management Company, Inc. | 62.500 | 257,14 | 1.430 | 256,36 | ||||
| 2026-02-10 | 13F/A | Northwestern Mutual Wealth Management Co | 624.750 | -24,15 | 14.291 | -24,40 | ||||
| 2026-02-13 | 13F | Aptus Capital Advisors, LLC | 7.136 | 0,03 | 163 | 0,00 | ||||
| 2026-02-02 | 13F | Balentine LLC | 1.098 | 0,00 | 25 | 0,00 | ||||
| 2026-02-17 | 13F | Raymond James Financial Inc | 2.270.001 | 39,95 | 51.926 | 39,49 | ||||
| 2026-02-17 | 13F | Regal Investment Advisors LLC | 21.349 | -4,24 | 488 | -4,50 | ||||
| 2026-01-26 | 13F | AE Wealth Management LLC | 3.096 | -0,64 | 71 | -1,41 | ||||
| 2026-02-04 | 13F | Drive Wealth Management, Llc | 73.629 | -7,12 | 1.684 | -7,42 | ||||
| 2026-02-10 | 13F | Thoroughbred Financial Services, Llc | 53.610 | -18,34 | 1 | 0,00 | ||||
| 2026-02-11 | 13F | LPL Financial LLC | 2.249.853 | 50,10 | 51.465 | 49,61 | ||||
| 2026-02-13 | 13F | Baltimore-Washington Financial Advisors, Inc. | 451.747 | 4,93 | 10.334 | 4,59 | ||||
| 2026-02-02 | 13F | CENTRAL TRUST Co | 292.852 | -10,31 | 6.699 | -10,61 | ||||
| 2026-01-12 | 13F | Focus Financial Network, Inc. | 9.328 | 1,08 | 213 | 0,95 | ||||
| 2026-01-22 | 13F | Apollon Wealth Management, LLC | 1.074.034 | 6,77 | 24.569 | 6,42 | ||||
| 2026-01-28 | 13F | Grant Street Asset Management, Inc. | 23.344 | 1,32 | 534 | 0,95 | ||||
| 2025-10-21 | 13F | SILVER OAK SECURITIES, Inc | 0 | -100,00 | 0 | |||||
| 2026-01-14 | 13F | Chesley Taft & Associates LLC | 18.600 | 0,00 | 425 | -0,23 | ||||
| 2026-02-10 | 13F | Lido Advisors, LLC | 239.564 | 0,06 | 5.498 | 0,05 | ||||
| 2026-02-02 | 13F | Montag A & Associates Inc | 73.277 | -2,93 | 1.676 | -3,23 | ||||
| 2026-02-03 | 13F | We Are One Seven, LLC | 68.236 | 620,09 | 1.561 | 618,89 | ||||
| 2026-02-04 | 13F | Fourth Dimension Wealth, LLC | 81.834 | 87,77 | 1.872 | 87,10 | ||||
| 2026-02-02 | 13F | Riverchase Wealth Management, Llc | 60.883 | 27,73 | 1.393 | 27,36 | ||||
| 2026-02-12 | 13F | Principal Securities, Inc. | 21.876 | 9,10 | 500 | 8,70 | ||||
| 2026-01-12 | 13F | Heartwood Wealth Advisors LLC | 708.473 | 2,17 | 16.206 | 1,84 | ||||
| 2026-02-05 | 13F | Flavin Financial Services, Inc. | 9.914 | -25,98 | 227 | -26,38 | ||||
| 2026-01-30 | 13F | Simplicity Wealth,LLC | 20.084 | 459 | ||||||
| 2026-02-12 | 13F | BRYN MAWR TRUST Co | 2.500 | 0,00 | 57 | 0,00 | ||||
| 2026-02-09 | 13F | PSI Advisors, LLC | 312.794 | 542,18 | 7.155 | 540,56 | ||||
| 2026-02-12 | 13F | Steward Partners Investment Advisory, Llc | 44.515 | -84,86 | 1.018 | -84,91 | ||||
| 2026-02-13 | 13F | Tableaux Llc | 26.843 | 21,49 | 523 | 2,96 | ||||
| 2026-02-13 | 13F | Level Four Advisory Services, Llc | 20.457 | 468 | ||||||
| 2026-01-15 | 13F | Essential Planning, LLC. | 56.142 | -1,69 | 1.284 | -1,98 | ||||
| 2026-01-22 | 13F | Cliftonlarsonallen Wealth Advisors, Llc | 1.059.220 | 3,74 | 24.230 | 3,41 | ||||
| 2026-02-17 | 13F | Advisory Services Network, LLC | 19.792 | 79,34 | 453 | 78,66 | ||||
| 2026-01-30 | 13F | Opus Capital Group, LLC | 15.457 | 9,24 | 0 | |||||
| 2026-02-12 | 13F | Bank Of Montreal /can/ | 1.663 | 1,28 | 38 | 2,70 | ||||
| 2026-02-04 | 13F | Advisor OS, LLC | 14.240 | 326 | ||||||
| 2026-02-12 | 13F | Investor's Fiduciary Advisor Network, LLC | 103.952 | 2 | ||||||
| 2026-01-20 | 13F | Toth Financial Advisory Corp | 3.612 | 83 | ||||||
| 2026-01-22 | 13F | O'Brien Wealth Partners LLC | 11.055 | 253 | ||||||
| 2026-01-14 | 13F | Spire Wealth Management | 0 | -100,00 | 0 | |||||
| 2026-02-11 | 13F | Eldridge Investment Advisors, Inc. | 308.953 | 27,75 | 7.067 | 27,75 | ||||
| 2026-02-17 | 13F | IHT Wealth Management, LLC | 0 | -100,00 | 0 | |||||
| 2026-01-27 | 13F | Financial Advisory Corp | 1.624.264 | 9,24 | 37.155 | 8,89 | ||||
| 2026-01-30 | 13F | Sigma Planning Corp | 0 | -100,00 | 0 | |||||
| 2026-02-13 | 13F | STAR Financial Bank | 13.656 | -10,91 | 312 | -11,11 | ||||
| 2026-02-02 | 13F | Blake Schutter Theil Wealth Advisors, LLC | 13.915 | 0,00 | 318 | -0,31 | ||||
| 2026-02-05 | 13F | Mesirow Financial Investment Management, Inc. | 136.441 | -54,15 | 3.121 | -54,30 | ||||
| 2026-02-12 | 13F | Wealthspire Advisors, LLC | 156.047 | 11,35 | 3.570 | 10,98 | ||||
| 2026-01-21 | 13F | Crews Bank & Trust | 16.890 | -9,87 | 386 | -10,23 | ||||
| 2026-01-05 | 13F | Horizons Wealth Management | 52.772 | 11,17 | 1.207 | 10,84 | ||||
| 2026-02-03 | 13F | Washington Trust Advisors, Inc. | 22.064 | 6,05 | 505 | 5,66 | ||||
| 2026-02-13 | 13F | Boston Family Office Llc | 220.514 | -7,57 | 5 | 0,00 | ||||
| 2025-11-12 | 13F | Brinker Capital Investments, LLC | 0 | -100,00 | 0 | |||||
| 2026-01-30 | 13F | United Community Bank | 0 | -100,00 | 0 | -100,00 | ||||
| 2026-01-28 | 13F | Schmidt P J Investment Management Inc | 9.924 | -8,97 | 227 | -9,20 | ||||
| 2026-02-12 | 13F | Commonwealth Equity Services, Llc | 532.095 | 12,66 | 12.172 | 121.610,00 | ||||
| 2026-02-17 | 13F | Cetera Investment Advisers | 144.000 | 1,47 | 3.294 | 1,14 | ||||
| 2026-01-08 | 13F | Sound View Wealth Advisors Group, LLC | 494.443 | 69,48 | 11.310 | 68,93 | ||||
| 2026-01-29 | 13F | Horizon Advisory Services, Inc. | 860.483 | 19.684 | ||||||
| 2026-02-09 | 13F | Unified Investment Management | 8.763 | 0,00 | 200 | -0,50 | ||||
| 2025-11-03 | 13F | Annis Gardner Whiting Capital Advisors, LLC | 0 | -100,00 | 0 | |||||
| 2026-01-22 | 13F | Granite Harbor Advisors, Inc. | 37.646 | 5,04 | 861 | 4,74 | ||||
| 2026-01-27 | 13F | Krilogy Financial LLC | 867.383 | 7,16 | 19.885 | 7,39 | ||||
| 2026-02-09 | 13F | Coldstream Capital Management Inc | 27.449 | 18,94 | 628 | 18,53 | ||||
| 2026-02-10 | 13F | Vista Private Wealth Partners. LLC | 780.983 | 0,00 | 17.908 | 0,00 | ||||
| 2025-09-24 | NP | LDRT - iShares iBonds 1-5 Year Treasury Ladder ETF | 184.984 | 8,22 | 4.234 | 7,85 | ||||
| 2026-01-08 | 13F | MKT Advisors LLC | 755.316 | 35,84 | 17.293 | 35,92 | ||||
| 2026-02-13 | 13F | Northstar Group, Inc. | 84.695 | -0,24 | 1.937 | -0,56 | ||||
| 2026-01-05 | 13F | Garrett Investment Advisors LLC | 9.058 | 207 | ||||||
| 2026-01-29 | 13F | Sanctuary Advisors, LLC | 419.785 | 3,21 | 9.603 | 2,87 |