Grundlæggende statistik
| Institutionelle aktier (lange) | 116.381.715 - 91,81% (ex 13D/G) - change of -31,30MM shares -21,20% MRQ |
| Institutionel værdi (lang) | $ 4.880.564 USD ($1000) |
Institutionelt ejerskab og aktionærer
H&R Block, Inc. (US:HRB) har 502 institutionelle ejere og aktionærer, der har indsendt 13D/G- eller 13F-formularer til Securities Exchange Commission (SEC). Disse institutioner har i alt 116,381,715 aktier. Største aktionærer omfatter BlackRock, Inc., Fmr Llc, Vanguard Group Inc, Fuller & Thaler Asset Management, Inc., State Street Corp, Aqr Capital Management Llc, Boston Partners, Geode Capital Management, Llc, Dimensional Fund Advisors Lp, and Lazard Asset Management Llc .
H&R Block, Inc. (NYSE:HRB) institutionel ejerskabsstruktur viser aktuelle positioner i virksomheden efter institutioner og fonde, samt seneste ændringer i positionsstørrelse. Større aktionærer kan omfatte individuelle investorer, investeringsforeninger, hedgefonde eller institutioner. Skema 13D angiver, at investoren besidder (eller besidder) mere end 5 % af virksomheden og har til hensigt (eller har til hensigt at) aktivt at forfølge en ændring i forretningsstrategi. Skema 13G indikerer en passiv investering på over 5%.
The share price as of April 24, 2026 is 30,26 / share. Previously, on April 28, 2025, the share price was 60,60 / share. This represents a decline of 50,07% over that period.

Fondens stemningsscore
Fund Sentiment Score (fka Ownership Accumulation Score) finder de aktier, der bliver mest købt af fonde. Det er resultatet af en sofistikeret, multi-faktor kvantitativ model, der identificerer virksomheder med de højeste niveauer af institutionel akkumulering. Scoringsmodellen bruger en kombination af den samlede stigning i oplyste ejere, ændringerne i porteføljeallokeringer i disse ejere og andre målinger. Tallet går fra 0 til 100, hvor højere tal indikerer et højere niveau af akkumulering for sine jævnaldrende, og 50 er gennemsnittet.
Opdateringsfrekvens: Dagligt
Se Ownership Explorer, som giver en liste over højest rangerende virksomheder.
AI+ Ask Fintel’s AI assistant about H&R Block, Inc..
Select a question to share a public post with an AI-crafted answer.
Thinking of good questions…
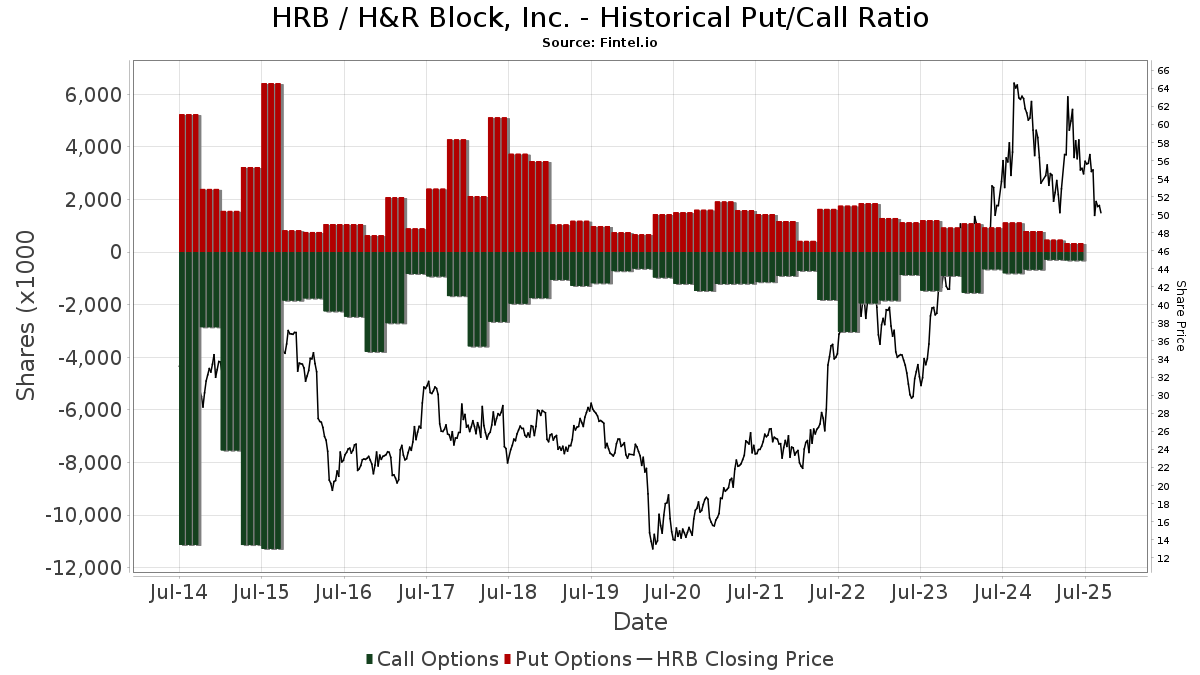
Institutionel Put/Call-forhold
Ud over at indberette standardaktie- og gældsudstedelser skal institutter med mere end 100 mill. aktiver under forvaltning også oplyse deres put- og call-optionsbeholdninger. Da salgsoptioner generelt indikerer negativ stemning, og købsoptioner indikerer positiv stemning, kan vi få en fornemmelse af den overordnede institutionelle stemning ved at plotte forholdet mellem put og kald. Diagrammet til højre viser det historiske put/call-forhold for dette instrument.
Brug af Put/Call Ratio som en indikator for investorernes stemning overvinder en af de vigtigste mangler ved at bruge totalt institutionelt ejerskab, som er, at en betydelig mængde af aktiver under forvaltning investeres passivt for at spore indekser. Passivt forvaltede fonde køber typisk ikke optioner, så indikatoren for put/call-forholdet følger mere nøje følelsen af aktivt forvaltede fonde.
13D/G-arkivering
Vi præsenterer 13D/G ansøgninger separat fra 13F ansøgninger på grund af den forskellige behandling af SEC. 13D/G-ansøgninger kan indgives af grupper af investorer (med én ledende), hvorimod 13F-ansøgninger ikke kan. Dette resulterer i situationer, hvor en investor kan indsende en 13D/G, der rapporterer én værdi for de samlede aktier (der repræsenterer alle de aktier, der ejes af investorgruppen), men derefter indsender en 13F, der rapporterer en anden værdi for de samlede aktier (der udelukkende repræsenterer deres egne) ejendomsret). Det betyder, at aktieejerskab af 13D/G-arkiver og 13F-arkiveringer ofte ikke er direkte sammenlignelige, så vi præsenterer dem separat.
Bemærk: Fra den 16. maj 2021 viser vi ikke længere ejere, der ikke har indsendt en 13D/G inden for det seneste år. Tidligere viste vi den fulde historie af 13D/G-arkiver. Generelt skal enheder, der er forpligtet til at indgive 13D/G-ansøgninger, indgive mindst årligt, før de indsender en afsluttende ansøgning. Dog forlader fonde nogle gange positioner uden at indsende en afsluttende ansøgning (dvs. de afvikler), så visning af den fulde historie resulterede nogle gange i forvirring om det nuværende ejerskab. For at undgå forvirring viser vi nu kun 'aktuelle' ejere - det vil sige - ejere, der har anmeldt inden for det seneste år.
Upgrade to unlock premium data.
13F og NPORT arkivering
Detaljer om 13F-arkivering er gratis. Detaljer om NP-ansøgninger kræver et premium-medlemskab. Grønne rækker angiver nye positioner. Røde rækker angiver lukkede positioner. Klik på linket ikon for at se den fulde transaktionshistorik.
Opgrader
for at låse premium-data op og eksportere til Excel ![]() .
.
| Fil dato | Kilde | Investor | Type | Gennemsnitlig pris (Øst) |
Aktier | Δ Aktier (%) |
Rapporteret Værdi ($1000) |
Δ Værdi (%) |
Port Alloc (%) |
|
|---|---|---|---|---|---|---|---|---|---|---|
| 2026-01-12 | 13F | Heartwood Wealth Advisors LLC | 0 | -100,00 | 0 | -100,00 | ||||
| 2026-02-17 | 13F | Wealth Watch Advisors, INC | 30 | 0,00 | 1 | 0,00 | ||||
| 2026-01-23 | 13F | Legacy Bridge, LLC | 15.265 | 0,00 | 665 | -13,75 | ||||
| 2026-01-28 | 13F | HB Wealth Management, LLC | 11.033 | 103,56 | 481 | 75,18 | ||||
| 2025-11-12 | 13F | NewSquare Capital LLC | 0 | -100,00 | 0 | |||||
| 2026-02-11 | 13F | O'shaughnessy Asset Management, Llc | 58.450 | -15,13 | 2.547 | -26,85 | ||||
| 2026-02-13 | 13F | Rodgers Brothers Inc. | 99.400 | -0,25 | 4.332 | -14,05 | ||||
| 2026-01-21 | 13F | Sound Income Strategies, LLC | 106.077 | 1.999,70 | 4.461 | 1.684,00 | ||||
| 2026-02-11 | 13F | SOUTH STATE Corp | 220 | 2.100,00 | 10 | |||||
| 2026-01-29 | 13F | Argyle Capital Management Inc. | 23.233 | 0,00 | 1.012 | -13,80 | ||||
| 2026-02-12 | 13F | Brown Brothers Harriman & Co | 4.180 | 0,00 | 182 | -13,74 | ||||
| 2026-02-17 | 13F | Janus Henderson Group Plc | 59.148 | -3,33 | 2.578 | -16,71 | ||||
| 2025-11-12 | 13F | Neo Ivy Capital Management | 0 | -100,00 | 0 | -100,00 | ||||
| 2026-02-13 | 13F | OMERS ADMINISTRATION Corp | 0 | -100,00 | 0 | |||||
| 2026-02-13 | 13F | Aigen Investment Management, Lp | 0 | -100,00 | 0 | -100,00 | ||||
| 2026-01-20 | 13F | Stratos Wealth Advisors, LLC | 59.625 | 34,35 | 2.598 | 15,78 | ||||
| 2026-01-26 | 13F | AE Wealth Management LLC | 14.297 | 30,13 | 623 | 12,25 | ||||
| 2026-02-13 | 13F | FORA Capital, LLC | 0 | -100,00 | 0 | |||||
| 2026-01-09 | 13F | Diversified Trust Co | 0 | -100,00 | 0 | -100,00 | ||||
| 2026-02-17 | 13F | Schonfeld Strategic Advisors LLC | 0 | -100,00 | 0 | |||||
| 2026-02-13 | 13F | Aurora Investment Counsel | 36.798 | -4,72 | 1.604 | -17,92 | ||||
| 2026-02-11 | 13F | Buckingham Strategic Partners | 0 | -100,00 | 0 | |||||
| 2026-02-17 | 13F | Alliancebernstein L.p. | 276.213 | 60,18 | 12.037 | 38,04 | ||||
| 2026-04-14 | 13F | USA Financial Portformulas Corp | 0 | -100,00 | 0 | |||||
| 2026-02-12 | 13F | Principal Securities, Inc. | 0 | -100,00 | 0 | -100,00 | ||||
| 2026-01-07 | 13F | Aventura Private Wealth, LLC | 26 | 0,00 | 1 | 0,00 | ||||
| 2026-02-06 | 13F | Gsa Capital Partners Llp | 6.467 | -21,79 | 0 | |||||
| 2026-02-13 | 13F | Schroder Investment Management Group | 27.946 | -67,38 | 1.217 | -71,93 | ||||
| 2026-02-11 | 13F | CLARET ASSET MANAGEMENT Corp | 14.690 | -0,16 | 1 | |||||
| 2026-04-17 | 13F | CENTRAL TRUST Co | 45 | -84,85 | 1 | -91,67 | ||||
| 2026-02-13 | 13F | SRS Capital Advisors, Inc. | 1.742 | -81,88 | 76 | -84,57 | ||||
| 2026-02-11 | 13F | Fox Run Management, L.l.c. | 0 | -100,00 | 0 | |||||
| 2026-02-12 | 13F | Xponance, Inc. | 14.281 | -17,94 | 622 | -29,32 | ||||
| 2026-02-10 | 13F | Commonwealth Of Pennsylvania Public School Empls Retrmt Sys | 31.637 | -7,92 | 1.379 | -20,67 | ||||
| 2026-02-13 | 13F | Prudential Financial Inc | 93.242 | -18,96 | 4.061 | -30,22 | ||||
| 2025-11-13 | 13F | Entropy Technologies, LP | 0 | -100,00 | 0 | -100,00 | ||||
| 2025-10-31 | 13F | PFG Investments, LLC | 0 | -100,00 | 0 | -100,00 | ||||
| 2025-11-12 | 13F | Edgestream Partners, L.P. | 0 | -100,00 | 0 | |||||
| 2026-02-17 | 13F | Prosperity Consulting Group, LLC | 0 | -100,00 | 0 | |||||
| 2026-02-17 | 13F | Agf Management Ltd | 68.824 | 5,70 | 2.999 | -8,90 | ||||
| 2026-02-04 | 13F | Midwest Trust Co | 170.328 | -1,98 | 7.423 | -15,53 | ||||
| 2026-04-14 | 13F | Nbc Securities, Inc. | 0 | -100,00 | 0 | |||||
| 2025-11-14 | 13F | Credit Agricole S A | 0 | -100,00 | 0 | -100,00 | ||||
| 2026-03-04 | 13F | SHP Wealth Management | 548 | 24 | ||||||
| 2026-02-05 | 13F | Park Square Financial Group, LLC | 147 | 8 | ||||||
| 2026-02-05 | 13F | Thrivent Financial For Lutherans | 28.468 | -7,45 | 1 | 0,00 | ||||
| 2026-02-13 | 13F | Manufacturers Life Insurance Company, The | 0 | -100,00 | 0 | |||||
| 2026-01-21 | 13F | Fulton Breakefield Broenniman Llc | 7.885 | -13,45 | 344 | -25,43 | ||||
| 2026-02-13 | 13F | Bridgefront Capital, LLC | 39.496 | 1.721 | ||||||
| 2026-02-17 | 13F | ExodusPoint Capital Management, LP | 0 | -100,00 | 0 | -100,00 | ||||
| 2026-02-17 | 13F | Freestone Grove Partners LP | 25.235 | 9,77 | 1.100 | -5,42 | ||||
| 2026-01-30 | 13F | State of New Jersey Common Pension Fund D | 48.501 | 17,04 | 2.114 | 0,86 | ||||
| 2026-02-17 | 13F | Weiss Asset Management LP | 0 | -100,00 | 0 | -100,00 | ||||
| 2026-02-17 | 13F | DV Trading LLC | 800 | 35 | ||||||
| 2026-02-04 | 13F | Dogwood Wealth Management LLC | 0 | 0 | ||||||
| 2026-02-12 | 13F | Andra AP-fonden | 0 | -100,00 | 0 | |||||
| 2026-02-17 | 13F | Redwood Investment Management, Llc | 59.320 | -6,11 | 3 | 0,00 | ||||
| 2026-01-30 | 13F | Archer Investment Corp | 800 | 0,00 | 35 | -15,00 | ||||
| 2026-02-03 | 13F | Credit Industriel Et Commercial | 0 | -100,00 | 0 | |||||
| 2025-11-03 | 13F | Trifecta Capital Advisors, LLC | 0 | -100,00 | 0 | |||||
| 2025-11-13 | 13F | Dynamic Technology Lab Private Ltd | 0 | -100,00 | 0 | |||||
| 2026-02-09 | 13F | Geode Capital Management, Llc | 2.890.440 | -2,46 | 125.985 | -15,94 | ||||
| 2026-04-14 | 13F | Focus Financial Network, Inc. | 0 | -100,00 | 0 | |||||
| 2026-02-03 | 13F | Credit Industriel Et Commercial | Put | 0 | -100,00 | 0 | ||||
| 2026-04-20 | 13F | Ritholtz Wealth Management | 20.212 | -33,32 | 642 | -51,48 | ||||
| 2026-01-29 | 13F | Advisors Capital Management, LLC | 0 | -100,00 | 0 | |||||
| 2026-02-17 | 13F | Armistice Capital, Llc | 7.245 | -50,06 | 316 | -57,03 | ||||
| 2026-02-17 | 13F | Capstone Investment Advisors, Llc | 0 | -100,00 | 0 | -100,00 | ||||
| 2026-02-17 | 13F | Creative Planning | 97.197 | 6,32 | 4.236 | -8,37 | ||||
| 2026-04-16 | 13F | PMV Capital Advisers, LLC | 4 | 0 | ||||||
| 2026-01-05 | 13F | GoalVest Advisory LLC | 0 | -100,00 | 0 | -100,00 | ||||
| 2026-04-24 | 13F | Boston Trust Walden Corp | 895.236 | 15,32 | 28.415 | -16,01 | ||||
| 2026-02-13 | 13F | Bridgewater Associates, LP | 455.655 | -24,84 | 19.857 | -35,23 | ||||
| 2026-02-09 | 13F | Employees Retirement System of Texas | 1.000 | 0,00 | 0 | |||||
| 2026-02-17 | 13F | Boothbay Fund Management, Llc | 0 | -100,00 | 0 | |||||
| 2026-02-12 | 13F | Counterpoint Mutual Funds LLC | 0 | -100,00 | 0 | -100,00 | ||||
| 2026-02-04 | 13F | Versor Investments LP | 20.100 | 20,82 | 876 | 4,04 | ||||
| 2026-01-27 | 13F | TriaGen Wealth Management LLC | 0 | -100,00 | 0 | |||||
| 2026-02-12 | 13F | Dimensional Fund Advisors Lp | 2.519.882 | 8,78 | 109.816 | -6,25 | ||||
| 2026-02-13 | 13F | Parkside Financial Bank & Trust | 716 | 34,59 | 31 | 19,23 | ||||
| 2026-01-26 | 13F | Mirae Asset Global Investments Co., Ltd. | 849 | -9,20 | 37 | -23,40 | ||||
| 2026-04-21 | 13F | Robeco Institutional Asset Management B.V. | 254.844 | 8.089 | ||||||
| 2026-01-30 | 13F | Wealthfront Advisers Llc | 17.342 | -2,55 | 756 | -16,02 | ||||
| 2026-04-10 | 13F | Abound Wealth Management | 200 | -67,53 | 6 | -76,92 | ||||
| 2026-02-17 | 13F | D. E. Shaw & Co., Inc. | 1.345.723 | 61,29 | 58.647 | 39,00 | ||||
| 2026-02-17 | 13F | Wiley Bros.-aintree Capital, Llc | 11.990 | -8,72 | 523 | -21,39 | ||||
| 2026-02-17 | 13F | D. E. Shaw & Co., Inc. | Call | 45.400 | 1.979 | |||||
| 2026-02-17 | 13F | Quantinno Capital Management LP | 137.929 | 138,07 | 6.011 | 105,19 | ||||
| 2026-04-23 | 13F | MQS Management LLC | 0 | -100,00 | 0 | |||||
| 2025-11-06 | 13F | Whipplewood Advisors, LLC | 0 | -100,00 | 0 | |||||
| 2026-02-17 | 13F | Cambria Investment Management, L.P. | 200.151 | 15,47 | 8.723 | -0,49 | ||||
| 2026-02-12 | 13F | Sprott Inc. | 50.000 | 2.179 | ||||||
| 2025-11-14 | 13F | Sherbrooke Park Advisers Llc | 0 | -100,00 | 0 | |||||
| 2026-02-05 | 13F | Bessemer Group Inc | 418 | -85,56 | 0 | |||||
| 2025-11-05 | 13F | Paladin Advisory Group, LLC | 0 | -100,00 | 0 | |||||
| 2026-02-13 | 13F | Ontario Teachers Pension Plan Board | 0 | -100,00 | 0 | |||||
| 2026-02-17 | 13F | Tower Research Capital LLC (TRC) | 7.550 | 26,55 | 329 | 9,30 | ||||
| 2026-01-26 | 13F | Cwm, Llc | 53.631 | 18,50 | 2 | 0,00 | ||||
| 2026-02-05 | 13F | Northwestern Mutual Investment Management Company, Llc | 28.286 | -5,21 | 1.233 | -18,36 | ||||
| 2026-04-24 | 13F | ProShare Advisors LLC | 0 | -100,00 | 0 | |||||
| 2026-01-14 | 13F | Pallas Capital Advisors LLC | 0 | -100,00 | 0 | |||||
| 2026-02-12 | 13F | Logan Capital Management Inc | 0 | -100,00 | 0 | |||||
| 2026-02-17 | 13F | SummitTX Capital, L.P. | 64.209 | 77,92 | 2.798 | 53,40 | ||||
| 2026-02-11 | 13F | Manchester Capital Management LLC | 265 | 12 | ||||||
| 2026-01-23 | 13F | Steigerwald, Gordon & Koch Inc. | 148 | 6 | ||||||
| 2026-02-10 | 13F | Bank of New York Mellon Corp | 1.419.957 | -0,80 | 61.882 | -14,51 | ||||
| 2026-02-12 | 13F | Round Hill Asset Management | 54.606 | -1,62 | 2.380 | -15,22 | ||||
| 2026-02-17 | 13F | Balyasny Asset Management Llc | 317.801 | 13.850 | ||||||
| 2026-02-11 | 13F | J.w. Cole Advisors, Inc. | 0 | -100,00 | 0 | |||||
| 2026-04-08 | 13F | DiNuzzo Private Wealth, Inc. | 12 | -45,45 | 0 | |||||
| 2026-04-15 | 13F | Exchange Traded Concepts, Llc | 0 | -100,00 | 0 | |||||
| 2026-02-03 | 13F | McIlrath & Eck, LLC | 60 | 0,00 | 3 | -33,33 | ||||
| 2026-04-17 | 13F | Tectonic Advisors Llc | 251.935 | 27,58 | 7.996 | -7,08 | ||||
| 2026-01-07 | 13F | Corsicana & Co. | 1.050 | 0,00 | 46 | -15,09 | ||||
| 2026-04-10 | 13F | Armstrong Advisory Group, Inc | 2.566 | -37,57 | 81 | -54,75 | ||||
| 2026-02-13 | 13F | National Bank Of Canada /fi/ | 1.433 | -3,83 | 62 | -17,33 | ||||
| 2026-01-15 | 13F | Fifth Third Wealth Advisors LLC | 0 | -100,00 | 0 | |||||
| 2026-02-12 | 13F | Swiss National Bank | 252.100 | -2,85 | 10.987 | -16,28 | ||||
| 2025-11-14 | 13F | Nomura Holdings Inc | 0 | -100,00 | 0 | -100,00 | ||||
| 2026-02-17 | 13F | Qube Research & Technologies Ltd | 507.482 | -51,16 | 22.116 | -57,91 | ||||
| 2026-01-27 | 13F | First Horizon Corp | 7 | 0,00 | 0 | |||||
| 2026-02-10 | 13F | Acadian Asset Management Llc | 76.956 | -51,97 | 3 | -62,50 | ||||
| 2026-02-05 | 13F | Qsemble Capital Management, LP | 52.500 | 2.288 | ||||||
| 2026-02-11 | 13F | United Financial Planning Group LLC | 24 | 1 | ||||||
| 2026-02-02 | 13F | Horizon Investments, LLC | 1.856 | -83,48 | 81 | -85,92 | ||||
| 2026-02-13 | 13F | Smartleaf Asset Management LLC | 1.264 | -5,53 | 55 | -17,91 | ||||
| 2026-02-04 | 13F | Virginia Retirement Systems Et Al | 41.200 | 23,35 | 1.795 | 6,28 | ||||
| 2026-02-12 | 13F | Nuveen, LLC | 681.709 | -1,62 | 29.709 | -15,22 | ||||
| 2026-02-10 | 13F | Savant Capital, LLC | 5.120 | -37,73 | 223 | -46,27 | ||||
| 2025-11-14 | 13F | Point72 (DIFC) Ltd | 0 | -100,00 | 0 | |||||
| 2026-02-10 | 13F | Jupiter Asset Management Ltd | 5.237 | 228 | ||||||
| 2026-02-13 | 13F | Transamerica Financial Advisors, Inc. | 167 | 7 | ||||||
| 2025-11-13 | 13F | AlphaStar Capital Management, LLC | 0 | -100,00 | 0 | |||||
| 2026-04-13 | 13F | True Wealth Design, LLC | 665 | 972,58 | 21 | 950,00 | ||||
| 2026-02-12 | 13F | Skopos Labs, Inc. | 6.599 | 288 | ||||||
| 2026-02-11 | 13F | Harvest Fund Management Co., Ltd | 0 | -100,00 | 0 | |||||
| 2026-02-04 | 13F | LRI Investments, LLC | 121 | 0,00 | 5 | -16,67 | ||||
| 2025-11-12 | 13F | Ameriflex Group, Inc. | 0 | -100,00 | 0 | -100,00 | ||||
| 2026-04-16 | 13F | SG Americas Securities, LLC | 163.973 | 72,43 | 5 | 25,00 | ||||
| 2026-02-11 | 13F | Picton Mahoney Asset Management | 19.287 | 1,97 | 841 | |||||
| 2026-02-17 | 13F | MIRAE ASSET GLOBAL ETFS HOLDINGS Ltd. | 4.375 | 15,34 | 191 | -0,52 | ||||
| 2026-02-12 | 13F | CIBC Private Wealth Group, LLC | 3.708 | -3,31 | 162 | -16,58 | ||||
| 2026-04-13 | 13F | Mather Group, Llc. | 531 | 17 | ||||||
| 2026-02-17 | 13F | Woodline Partners LP | 0 | -100,00 | 0 | |||||
| 2026-01-12 | 13F | Rialto Wealth Management, LLC | 2 | -66,67 | 0 | |||||
| 2026-02-18 | 13F | Vident Advisory, LLC | 34.597 | 6,40 | 1.508 | -8,33 | ||||
| 2026-02-24 | 13F/A | Pacer Advisors, Inc. | 533.391 | -4,65 | 23.245 | -17,83 | ||||
| 2026-04-07 | 13F | Signaturefd, Llc | 3.151 | 273,78 | 100 | 177,78 | ||||
| 2026-02-09 | 13F | Arnhold LLC | 5.600 | 0,00 | 244 | -13,78 | ||||
| 2026-02-17 | 13F | XTX Topco Ltd | 0 | -100,00 | 0 | |||||
| 2025-11-14 | 13F | Trexquant Investment LP | 0 | -100,00 | 0 | |||||
| 2026-04-17 | 13F | Bell Investment Advisors, Inc | 232 | 66,91 | 7 | 16,67 | ||||
| 2026-04-14 | 13F | Bay Harbor Wealth Management, LLC | 7 | -41,67 | 0 | |||||
| 2025-10-28 | 13F | Csenge Advisory Group | 0 | -100,00 | 0 | |||||
| 2026-01-28 | 13F | Arizona State Retirement System | 35.655 | -10,00 | 1.554 | -22,47 | ||||
| 2026-02-13 | 13F | Level Four Advisory Services, Llc | 4.955 | -0,02 | 216 | -14,00 | ||||
| 2026-02-13 | 13F/A | Alberta Investment Management Corp | 0 | -100,00 | 0 | |||||
| 2026-02-13 | 13F | Cornerstone Financial Management LLC | 15 | 1 | ||||||
| 2025-10-30 | 13F | Arcus Capital Partners, LLC | 4.990 | 0,02 | 252 | -7,69 | ||||
| 2025-11-14 | 13F | Holocene Advisors, LP | 0 | -100,00 | 0 | |||||
| 2026-01-28 | 13F | Geneos Wealth Management Inc. | 133 | 0,00 | 6 | -16,67 | ||||
| 2026-02-05 | 13F | Chase Investment Counsel Corp | 30.000 | 25,00 | 1 | 0,00 | ||||
| 2026-02-09 | 13F | Catalyst Funds Management Pty Ltd | 4.600 | 200 | ||||||
| 2025-11-13 | 13F | Glenmede Investment Management, LP | 0 | -100,00 | 0 | |||||
| 2026-01-29 | 13F | UBS Group AG | 934.917 | 19,22 | 40.744 | 2,74 | ||||
| 2026-01-28 | 13F | WPG Advisers, LLC | 623 | -6,32 | 27 | -18,18 | ||||
| 2026-02-02 | 13F | Danske Bank A/s | 900 | 0,00 | 39 | -13,33 | ||||
| 2026-02-24 | 13F | DGS Capital Management, LLC | 5.710 | -1,14 | 249 | -15,07 | ||||
| 2025-11-12 | 13F | Sciencast Management LP | 0 | -100,00 | 0 | |||||
| 2026-04-15 | 13F | Journey Strategic Wealth Llc | 12.879 | 3,29 | 409 | -24,86 | ||||
| 2026-02-02 | 13F | Robertson Stephens Wealth Management, LLC | 5.900 | 1,39 | 260 | -12,50 | ||||
| 2026-02-10 | 13F | Nomura Asset Management Co Ltd | 830 | 0,00 | 36 | -12,20 | ||||
| 2025-11-13 | 13F | Blue Whale Capital LLP | 0 | -100,00 | 0 | |||||
| 2026-02-12 | 13F | Campbell & CO Investment Adviser LLC | 97.273 | 728,63 | 4.239 | 614,84 | ||||
| 2026-04-20 | 13F | Ronald Blue Trust, Inc. | 7.088 | 3,38 | 225 | -24,83 | ||||
| 2026-02-17 | 13F | Public Employees Retirement System Of Ohio | 42.770 | -7,37 | 1.864 | -20,18 | ||||
| 2026-01-28 | 13F | DekaBank Deutsche Girozentrale | 154.795 | 0,00 | 8 | 14,29 | ||||
| 2026-02-17 | 13F | Lodge Hill Capital, LLC | 800.000 | 34.864 | ||||||
| 2026-02-12 | 13F | Federation des caisses Desjardins du Quebec | 11.757 | 11,56 | 512 | -3,76 | ||||
| 2026-02-17 | 13F | Voloridge Investment Management, Llc | 0 | -100,00 | 0 | |||||
| 2026-02-05 | 13F | Cambridge Investment Research Advisors, Inc. | 17.183 | 7,99 | 1 | |||||
| 2026-02-13 | 13F | Fieldview Capital Management, LLC | 13.030 | 568 | ||||||
| 2025-11-14 | 13F | Centiva Capital, LP | 0 | -100,00 | 0 | |||||
| 2026-02-17 | 13F | Aqr Capital Management Llc | 3.402.728 | 31,21 | 146.998 | 12,24 | ||||
| 2026-01-28 | 13F | Chicago Partners Investment Group LLC | 6.640 | 62,27 | 266 | 26,79 | ||||
| 2026-04-22 | 13F | Ifrah Financial Services, Inc. | 15.800 | -2,05 | 501 | -28,63 | ||||
| 2026-02-13 | 13F | Natixis | 112.116 | 1.680,47 | 4.886 | 1.436,48 | ||||
| 2025-12-16 | 13F | Garde Capital, Inc. | 0 | -100,00 | 0 | |||||
| 2026-02-06 | 13F | Lsv Asset Management | 1.534.451 | 3,78 | 67 | -10,81 | ||||
| 2026-01-26 | 13F | Patriot Financial Group Insurance Agency, LLC | 0 | -100,00 | 0 | |||||
| 2026-02-02 | 13F | Cornerstone Planning Group LLC | 19 | 0,00 | 1 | |||||
| 2026-02-02 | 13F | Principal Financial Group Inc | 271.894 | -8,54 | 11.849 | -21,18 | ||||
| 2026-02-17 | 13F | Limestone Investment Advisors LP | 0 | -100,00 | 0 | |||||
| 2026-02-10 | 13F | Natixis Advisors, L.p. | 10.026 | -36,49 | 0 | |||||
| 2026-02-12 | 13F | BRYN MAWR TRUST Co | 0 | -100,00 | 0 | -100,00 | ||||
| 2026-01-12 | 13F | CVA Family Office, LLC | 41 | 0,00 | 2 | -50,00 | ||||
| 2026-02-09 | 13F | Optimist Retirement Group LLC | 42.308 | 1,30 | 1.844 | -12,74 | ||||
| 2026-02-13 | 13F | Treasurer of the State of North Carolina | 53.075 | -73,14 | 2 | -77,78 | ||||
| 2025-11-14 | 13F | Arrowpoint Investment Partners (Singapore) Pte. Ltd. | 0 | -100,00 | 0 | |||||
| 2025-11-14 | 13F | Arrowpoint Investment Partners (Singapore) Pte. Ltd. | Put | 0 | -100,00 | 0 | ||||
| 2026-01-22 | 13F | Harwood Advisory Group, LLC | 91 | 1,11 | 4 | -25,00 | ||||
| 2026-02-17 | 13F | Utah Retirement Systems | 6.719 | -4,14 | 293 | -17,51 | ||||
| 2026-02-10 | 13F | Measured Wealth Private Client Group, LLC | 8.250 | -68,91 | 360 | -73,23 | ||||
| 2026-01-08 | 13F | Nordea Investment Management Ab | 110.986 | -9,33 | 4.793 | -22,22 | ||||
| 2026-02-17 | 13F | ISAM Funds (UK) Ltd | 6.139 | -68,25 | 268 | -72,67 | ||||
| 2025-11-14 | 13F | Two Sigma Securities, Llc | 0 | -100,00 | 0 | |||||
| 2026-01-30 | 13F | American Capital Advisory, LLC | 14 | 133,33 | 1 | |||||
| 2026-02-13 | 13F | Victory Capital Management Inc | 168.241 | 30,51 | 7.332 | 12,46 | ||||
| 2026-02-17 | 13F | Cahill Financial Advisors Inc | 0 | -100,00 | 0 | |||||
| 2026-01-23 | 13F | Rsm Us Wealth Management Llc | 12.957 | -1,00 | 564 | -15,57 | ||||
| 2026-04-24 | 13F | Yousif Capital Management, Llc | 37.196 | -5,14 | 1.181 | -25,13 | ||||
| 2026-02-17 | 13F | Sandler Capital Management | Put | 9.800 | 427 | |||||
| 2026-02-06 | 13F | Larson Financial Group LLC | 410 | -4,21 | 18 | -19,05 | ||||
| 2026-02-17 | 13F | Hancock Whitney Corp | 5.365 | -12,09 | 234 | -24,35 | ||||
| 2026-02-17 | 13F | FIL Ltd | 41.564 | 230,77 | 1.811 | 185,20 | ||||
| 2026-02-13 | 13F | Umb Bank N A/mo | 3.959 | -6,18 | 173 | -19,25 | ||||
| 2026-02-17 | 13F | Scientech Research LLC | 0 | -100,00 | 0 | |||||
| 2026-01-21 | 13F | Newbridge Financial Services Group, Inc. | 500 | 0,00 | 22 | -16,00 | ||||
| 2025-11-14 | 13F | PineBridge Investments, L.P. | 9.108 | -69,67 | 461 | -72,09 | ||||
| 2026-04-16 | 13F | Park National Corp /oh/ | 6.998 | -4,89 | 222 | -30,62 | ||||
| 2026-02-11 | 13F | Cerity Partners LLC | 109.330 | 5,28 | 4.765 | -9,27 | ||||
| 2026-01-20 | 13F | Harbor Capital Advisors, Inc. | 0 | -100,00 | 0 | |||||
| 2025-11-03 | 13F | Valeo Financial Advisors, LLC | 0 | -100,00 | 0 | |||||
| 2026-04-08 | 13F | Grove Bank & Trust | 113 | 0,00 | 4 | -25,00 | ||||
| 2026-02-09 | 13F | Atlantic Trust, LLC | 220 | 10.900,00 | 10 | |||||
| 2026-02-13 | 13F | State Street Corp | 3.985.160 | -4,22 | 175.391 | -17,32 | ||||
| 2026-02-10 | 13F | New Mexico Educational Retirement Board | 27.800 | 0,00 | 1 | 0,00 | ||||
| 2026-02-05 | 13F | Convergence Investment Partners, LLC | 0 | -100,00 | 0 | |||||
| 2026-04-16 | 13F | CWC Advisors, LLC. | 10.288 | -1,65 | 327 | -28,35 | ||||
| 2026-02-17 | 13F | Millennium Management Llc | 839.268 | 268,10 | 36.575 | 217,22 | ||||
| 2025-11-13 | 13F | Clear Street Markets Llc | 0 | -100,00 | 0 | -100,00 | ||||
| 2026-01-28 | 13F | Salomon & Ludwin, LLC | 83 | 5,06 | 4 | -25,00 | ||||
| 2026-02-13 | 13F | Palisade Asset Management, LLC | 0 | -100,00 | 0 | |||||
| 2025-10-28 | 13F | Qrg Capital Management, Inc. | 0 | -100,00 | 0 | |||||
| 2026-04-23 | 13F | CBOE Vest Financial, LLC | 62.072 | 9,51 | 1.970 | -20,24 | ||||
| 2026-02-12 | 13F | Federated Hermes, Inc. | 10.166 | -95,54 | 443 | -96,15 | ||||
| 2026-01-12 | 13F | Salem Investment Counselors Inc | 0 | -100,00 | 0 | -100,00 | ||||
| 2026-02-13 | 13F | Squarepoint Ops LLC | Call | 5.000 | -61,83 | 218 | -67,22 | |||
| 2026-02-13 | 13F | Squarepoint Ops LLC | 79.336 | 141,51 | 3.457 | 108,13 | ||||
| 2026-02-17 | 13F | Jones Financial Companies Lllp | 13.055 | -11,80 | 569 | -23,76 | ||||
| 2025-11-14 | 13F | Wolverine Trading, Llc | 4.742 | 240 | ||||||
| 2026-04-20 | 13F | Miller Howard Investments Inc /ny | 0 | -100,00 | 0 | |||||
| 2026-02-17 | 13F | Wellington Management Group Llp | 1.697.916 | -26,31 | 73.995 | -36,50 | ||||
| 2025-11-14 | 13F | Wolverine Trading, Llc | Call | 28.100 | 1.422 | |||||
| 2026-02-17 | 13F | Dark Forest Capital Management Lp | 0 | -100,00 | 0 | |||||
| 2025-11-14 | 13F | Wolverine Trading, Llc | Put | 14.300 | 724 | |||||
| 2026-02-05 | 13F | Leuthold Group, Llc | 0 | -100,00 | 0 | |||||
| 2026-02-13 | 13F | Motiv8 Investments LLC | 3.620 | 0 | ||||||
| 2026-04-20 | 13F | Louisiana State Employees Retirement System | 36.800 | 5,14 | 1.168 | -23,41 | ||||
| 2026-01-15 | 13F | Nisa Investment Advisors, Llc | 111.583 | -6,61 | 4.911 | -19,39 | ||||
| 2026-02-17 | 13F | Shelton Capital Management | 0 | -100,00 | 0 | |||||
| 2025-10-30 | 13F | Twin Peaks Wealth Advisors, LLC | 0 | -100,00 | 0 | -100,00 | ||||
| 2026-04-14 | 13F | Nova Wealth Management, Inc. | 0 | -100,00 | 0 | |||||
| 2026-02-12 | 13F | New York State Common Retirement Fund | 78.511 | -4,23 | 3.422 | -17,47 | ||||
| 2026-02-13 | 13F | Segall Bryant & Hamill, Llc | 95.000 | 0,00 | 4.140 | -13,82 | ||||
| 2026-02-03 | 13F | Sequoia Financial Advisors, LLC | 24.795 | 19,16 | 1.081 | 2,66 | ||||
| 2026-02-10 | 13F | Goldman Sachs Group Inc | 902.067 | 4,54 | 39.312 | -9,91 | ||||
| 2026-02-13 | 13F | First Trust Advisors Lp | 1.052.391 | 12,13 | 45.863 | -3,37 | ||||
| 2025-11-13 | 13F | Inceptionr Llc | 0 | -100,00 | 0 | |||||
| 2026-02-09 | 13F | Hartland & Co., LLC | 435 | -14,87 | 19 | -28,00 | ||||
| 2026-02-13 | 13F | Ossiam | 99.405 | 4.332 | ||||||
| 2026-02-12 | 13F | Lbmc Investment Advisors, Llc | 5.000 | 0,00 | 218 | -13,89 | ||||
| 2026-01-15 | 13F | Range Financial Group LLC | 15.053 | 4,79 | 656 | -9,64 | ||||
| 2026-02-12 | 13F | Cibc World Markets Corp | 34.270 | 1.493 | ||||||
| 2026-02-17 | 13F | Css Llc/il | 10.460 | 456 | ||||||
| 2026-02-17 | 13F | Northern Trust Corp | 2.415.655 | -12,17 | 105.274 | -24,31 | ||||
| 2026-03-12 | 13F/A | Peak6 Llc | 12.454 | 622.600,00 | 543 | |||||
| 2025-11-13 | 13F | Aviva Plc | 0 | -100,00 | 0 | |||||
| 2026-02-13 | 13F | Wbi Investments, Inc. | 39.809 | 228,40 | 1.735 | 182,87 | ||||
| 2026-03-12 | 13F/A | Peak6 Llc | Put | 43.800 | 1.909 | |||||
| 2026-02-12 | 13F | NDVR, Inc. | 0 | -100,00 | 0 | |||||
| 2026-02-13 | 13F | Mariner, LLC | 44.637 | -6,90 | 1.945 | -19,76 | ||||
| 2026-02-17 | 13F | Ibex Wealth Advisors | 104.731 | 1,17 | 4.564 | -12,80 | ||||
| 2026-02-13 | 13F | Landscape Capital Management, L.l.c. | 210.498 | 46,05 | 9.174 | 25,86 | ||||
| 2026-02-06 | 13F | Tanglewood Legacy Advisors, LLC | 500 | 0,00 | 22 | -16,00 | ||||
| 2026-02-19 | 13F | CI Private Wealth, LLC | 157.870 | -6,02 | 6.859 | -19,26 | ||||
| 2026-02-20 | 13F | Framtiden Holdings Management Co LLC | 275.000 | 11.984 | ||||||
| 2026-01-12 | 13F | Thrive Wealth Management, LLC | 0 | -100,00 | 0 | |||||
| 2026-02-12 | 13F | Wealthspire Advisors, LLC | 0 | -100,00 | 0 | |||||
| 2026-03-04 | 13F | Leonteq Securities AG | 0 | -100,00 | 0 | |||||
| 2026-04-13 | 13F | Chesley Taft & Associates LLC | 19.932 | 95,99 | 633 | 42,66 | ||||
| 2026-02-05 | 13F | HFM Investment Advisors, LLC | 5 | -16,67 | 0 | |||||
| 2026-02-05 | 13F | Elyxium Wealth, LLC | 398 | 17 | ||||||
| 2026-02-13 | 13F | Martingale Asset Management L P | 7.658 | -68,93 | 334 | -73,27 | ||||
| 2026-02-17 | 13F | Jain Global LLC | 8.580 | -82,20 | 374 | -84,69 | ||||
| 2026-02-03 | 13F | Mitsubishi UFJ Kokusai Asset Management Co., Ltd. | 430 | 0,00 | 18 | -14,29 | ||||
| 2026-01-21 | 13F | Oak Thistle LLC | 0 | -100,00 | 0 | |||||
| 2026-01-27 | 13F | Human Investing LLC | 30.380 | -13,84 | 1.324 | -25,80 | ||||
| 2026-02-11 | 13F | Sunrise Financial Services, LLC | 23 | 1 | ||||||
| 2026-02-17 | 13F | Crawford Investment Counsel Inc | 0 | -100,00 | 0 | |||||
| 2026-02-18 | 13F | EP Wealth Advisors, Inc. | 0 | -100,00 | 0 | |||||
| 2026-02-19 | 13F | Invesco Ltd. | 613.621 | 37,79 | 26.742 | 18,74 | ||||
| 2026-02-17 | 13F | Cetera Investment Advisers | 30.156 | -15,07 | 1.314 | -26,80 | ||||
| 2026-02-17 | 13F | Point72 Asset Management, L.P. | 119.858 | 5.223 | ||||||
| 2026-02-17 | 13F | IHT Wealth Management, LLC | 6.324 | -2,63 | 276 | -16,16 | ||||
| 2026-04-21 | 13F | GHP Investment Advisors, Inc. | 387 | 1,31 | 12 | -25,00 | ||||
| 2026-02-12 | 13F | Hrt Financial Lp | 145.565 | 94,12 | 6 | 100,00 | ||||
| 2026-02-13 | 13F | American Century Companies Inc | 11.226 | -87,75 | 489 | -89,45 | ||||
| 2026-01-14 | 13F | Hennion & Walsh Asset Management, Inc. | 27.816 | -19,64 | 1.212 | -30,74 | ||||
| 2025-11-14 | 13F | Point72 Hong Kong Ltd | 0 | -100,00 | 0 | |||||
| 2026-04-15 | 13F | Fortitude Family Office, LLC | 28 | 0,00 | 1 | -100,00 | ||||
| 2026-04-23 | 13F | First Pacific Financial | 74 | 2 | ||||||
| 2026-02-02 | 13F | Mutual Advisors, LLC | 11.078 | 483 | ||||||
| 2026-02-11 | 13F | Meeder Advisory Services, Inc. | 5.887 | 257 | ||||||
| 2026-02-12 | 13F | DRW Securities, LLC | 0 | -100,00 | 0 | -100,00 | ||||
| 2026-02-10 | 13F | Envestnet Asset Management Inc | 47.276 | -11,00 | 2.060 | -23,31 | ||||
| 2026-02-17 | 13F | Capital Fund Management S.a. | Put | 44.300 | 62,87 | 1.931 | 40,36 | |||
| 2026-02-09 | 13F | Coldstream Capital Management Inc | 0 | -100,00 | 0 | |||||
| 2026-02-17 | 13F | Capital Fund Management S.a. | Call | 21.400 | 8,63 | 933 | -6,43 | |||
| 2026-02-17 | 13F | Summit Trail Advisors, Llc | 21.481 | -6,32 | 939 | -19,12 | ||||
| 2026-02-23 | 13F | Mv Capital Management, Inc. | 7 | 0 | ||||||
| 2026-02-10 | 13F | CIBC Asset Management Inc | 0 | -100,00 | 0 | -100,00 | ||||
| 2025-11-04 | 13F | Pineridge Advisors LLC | 0 | -100,00 | 0 | -100,00 | ||||
| 2026-02-11 | 13F | Brandywine Global Investment Management, LLC | 0 | -100,00 | 0 | |||||
| 2026-01-29 | 13F | Teachers Retirement System Of The State Of Kentucky | 42.628 | -10,50 | 2 | -50,00 | ||||
| 2026-02-13 | 13F | Pathstone Holdings, LLC | 22.891 | -33,42 | 1.000 | -42,69 | ||||
| 2026-01-26 | 13F | Whittier Trust Co | 146 | -53,50 | 6 | -62,50 | ||||
| 2026-02-13 | 13F | Commerce Bank | 44.150 | 1,02 | 1.924 | -12,94 | ||||
| 2026-02-17 | 13F | Occudo Quantitative Strategies Lp | 0 | -100,00 | 0 | |||||
| 2026-03-12 | 13F/A | Peak6 Llc | Call | 0 | -100,00 | 0 | -100,00 | |||
| 2026-02-13 | 13F | Baird Financial Group, Inc. | 18.589 | 7,83 | 810 | -7,00 | ||||
| 2025-11-10 | 13F | Atomi Financial Group, Inc. | 0 | -100,00 | 0 | -100,00 | ||||
| 2026-01-20 | 13F | Independence Bank of Kentucky | 2.000 | 0,00 | 87 | -13,86 | ||||
| 2025-11-14 | 13F | Point72 Asia (Singapore) Pte. Ltd. | 0 | -100,00 | 0 | |||||
| 2026-01-28 | 13F | CAPROCK Group, Inc. | 0 | -100,00 | 0 | |||||
| 2026-04-24 | 13F | Retirement Systems of Alabama | 155.400 | 2,42 | 4.932 | -25,41 | ||||
| 2025-11-12 | 13F | Bellwether Advisors, LLC | 0 | -100,00 | 0 | |||||
| 2026-04-22 | 13F | Smallwood Wealth Investment Management, LLC | 0 | 0 | ||||||
| 2026-02-13 | 13F | Maverick Capital Ltd | 114.426 | 4.987 | ||||||
| 2026-02-17 | 13F | Two Sigma Investments, Lp | Put | 6.400 | 279 | |||||
| 2026-02-17 | 13F | Two Sigma Investments, Lp | Call | 4.600 | 200 | |||||
| 2026-02-06 | 13F | GPS Wealth Strategies Group, LLC | 0 | -100,00 | 0 | |||||
| 2025-11-05 | 13F | AdvisorShares Investments LLC | 0 | -100,00 | 0 | |||||
| 2025-11-14 | 13F | Petrus Trust Company, LTA | 0 | -100,00 | 0 | |||||
| 2026-04-15 | 13F | Capital Advisory Group Advisory Services, LLC | 0 | -100,00 | 0 | |||||
| 2025-11-17 | 13F | FSA Wealth Management LLC | 167 | 0,00 | 8 | -11,11 | ||||
| 2026-02-11 | 13F | Taylor Hoffman Capital Management LLC | 8.322 | 67,38 | 363 | 44,22 | ||||
| 2026-02-11 | 13F | Convergence Financial, LLC | 10.551 | 0,57 | 460 | -13,40 | ||||
| 2026-04-20 | 13F | State of Alaska, Department of Revenue | 55.233 | -0,59 | 2 | -50,00 | ||||
| 2026-04-07 | 13F | CoreCap Advisors, LLC | 196 | 3.820,00 | 6 | |||||
| 2026-02-17 | 13F | State Of Wisconsin Investment Board | 67.607 | -12,49 | 2.946 | -24,58 | ||||
| 2026-02-13 | 13F | Atlas Capital Advisors Llc | 135 | 0,00 | 6 | -28,57 | ||||
| 2026-01-26 | 13F | Paradigm Financial Partners, Llc | 0 | -100,00 | 0 | |||||
| 2026-02-09 | 13F | Ceera Investments, Llc | 10.580 | -48,42 | 461 | -55,54 | ||||
| 2026-02-17 | 13F | Citadel Advisors Llc | Put | 45.800 | 4,57 | 1.996 | -9,89 | |||
| 2026-02-12 | 13F | Elo Mutual Pension Insurance Co | 91.258 | 68,67 | 3.977 | 45,36 | ||||
| 2026-03-09 | 13F | EMC Capital Management | 2.479 | -15,02 | 0 | |||||
| 2026-02-12 | 13F | Triumph Capital Management | 1 | -99,10 | 0 | -100,00 | ||||
| 2026-02-17 | 13F | Citadel Advisors Llc | Call | 69.800 | 105,29 | 3.042 | 76,91 | |||
| 2026-02-04 | 13F | Tsfg, Llc | 257 | 0,78 | 0 | |||||
| 2026-02-17 | 13F | Citadel Advisors Llc | 1.598.948 | 14,52 | 69.682 | -1,31 | ||||
| 2026-02-12 | 13F | Jane Street Group, Llc | Put | 5.500 | -17,91 | 240 | -29,29 | |||
| 2026-04-08 | 13F | Wealth Enhancement Advisory Services, Llc | 34.165 | -13,68 | 1.099 | -36,10 | ||||
| 2026-02-04 | 13F | Securian Asset Management, Inc | 9.213 | -8,11 | 402 | -20,91 | ||||
| 2026-04-24 | 13F | Medallion Wealth Advisors, LLC | 2.400 | 0,00 | 76 | -26,92 | ||||
| 2026-02-13 | 13F | Kilter Group LLC | 10 | 0 | ||||||
| 2026-02-17 | 13F | Two Sigma Investments, Lp | 0 | -100,00 | 0 | |||||
| 2026-04-24 | 13F | Keybank National Association/oh | 6.520 | 40,37 | 207 | 1,98 | ||||
| 2026-02-10 | 13F | State of Wyoming | 684 | -69,19 | 30 | -74,11 | ||||
| 2026-02-17 | 13F | Ameriprise Financial Inc | 150.146 | -33,12 | 6.552 | -42,34 | ||||
| 2026-02-14 | 13F | Rockefeller Capital Management L.P. | 3.569 | -29,30 | 156 | -39,22 | ||||
| 2026-04-08 | 13F | High Point Wealth Management, LLC | 1.152 | -49,54 | 37 | -63,64 | ||||
| 2026-04-23 | 13F | Triad Investment Management | 13.200 | 448 | ||||||
| 2026-04-23 | 13F | Farmers & Merchants Investments Inc | 125 | 0,00 | 4 | -40,00 | ||||
| 2026-02-13 | 13F | Corient IA LLC | 0 | -100,00 | 0 | |||||
| 2026-04-13 | 13F | Massmutual Trust Co Fsb/adv | 581 | 448,11 | 18 | 350,00 | ||||
| 2026-04-24 | 13F | Key FInancial Inc | 0 | -100,00 | 0 | |||||
| 2026-04-13 | 13F | Creative Financial Designs Inc /adv | 10 | 0 | ||||||
| 2026-02-12 | 13F | Davy Global Fund Management Ltd | 0 | -100,00 | 0 | |||||
| 2025-11-06 | 13F | Ing Groep Nv | 0 | -100,00 | 0 | |||||
| 2026-01-23 | 13F | Westside Investment Management, Inc. | 15 | 1 | ||||||
| 2026-02-18 | 13F | State of Tennessee, Treasury Department | 51.160 | -7,71 | 2.018 | -28,01 | ||||
| 2026-02-17 | 13F | Advisory Services Network, LLC | 0 | -100,00 | 0 | |||||
| 2026-02-11 | 13F | Vestcor Inc | 29.494 | 27,16 | 1 | 0,00 | ||||
| 2026-02-10 | 13F/A | Northwestern Mutual Wealth Management Co | 618 | -26,43 | 27 | -38,10 | ||||
| 2026-02-13 | 13F | Huber Capital Management LLC | 23.100 | -0,43 | 1.007 | -14,24 | ||||
| 2026-04-17 | 13F | AdvisorNet Financial, Inc | 224 | 3.100,00 | 7 | |||||
| 2026-01-20 | 13F | Cromwell Holdings LLC | 0 | -100,00 | 0 | |||||
| 2026-02-12 | 13F | Ci Investments Inc. | 0 | -100,00 | 0 | |||||
| 2026-02-13 | 13F | Rhumbline Advisers | 374.932 | -3,07 | 16.339 | -16,46 | ||||
| 2026-02-17 | 13F | Canada Pension Plan Investment Board | 355.800 | 9,11 | 15.506 | -5,97 | ||||
| 2026-04-13 | 13F | Affinity Capital Advisors, LLC | 7.428 | 58,04 | 236 | 15,20 | ||||
| 2026-02-17 | 13F | Bank Of America Corp /de/ | 1.053.722 | 17,57 | 45.921 | 1,32 | ||||
| 2026-02-09 | 13F | Harbour Investments, Inc. | 12.139 | 45,76 | 529 | 25,65 | ||||
| 2025-11-14 | 13F | Cubist Systematic Strategies, LLC | 0 | -100,00 | 0 | -100,00 | ||||
| 2026-04-07 | 13F | Eastern Bank | 400 | 0,00 | 13 | -29,41 | ||||
| 2026-02-12 | 13F | Brinker Capital Investments, LLC | 5.093 | -28,30 | 222 | -38,44 | ||||
| 2025-11-06 | 13F | CIBC World Markets Inc. | 0 | -100,00 | 0 | |||||
| 2026-02-05 | 13F | North Dakota State Investment Board | 4.654 | 203 | ||||||
| 2026-02-13 | 13F | Kestra Advisory Services, LLC | 0 | -100,00 | 0 | |||||
| 2026-01-15 | 13F | Alpine Bank Wealth Management | 0 | -100,00 | 0 | |||||
| 2026-01-28 | 13F | Teacher Retirement System Of Texas | 22.474 | -39,58 | 979 | -47,95 | ||||
| 2026-01-27 | 13F | WealthCollab, LLC | 307 | 207,00 | 13 | 160,00 | ||||
| 2026-04-21 | 13F | Vise Technologies, Inc. | 7.548 | 0,00 | 329 | 0,00 | ||||
| 2026-02-13 | 13F | Walleye Capital LLC | Put | 10.900 | 445,00 | 475 | 370,30 | |||
| 2026-04-14 | 13F | Clean Yield Group | 0 | -100,00 | 0 | |||||
| 2026-02-13 | 13F | Walleye Capital LLC | 1.637 | 90,35 | 71 | 65,12 | ||||
| 2026-02-17 | 13F | California State Teachers Retirement System | 133.636 | 4,15 | 5.824 | -10,25 | ||||
| 2026-02-12 | 13F | MetLife Investment Management, LLC | 62.809 | -10,08 | 2.737 | -22,51 | ||||
| 2026-02-13 | 13F | Walleye Capital LLC | Call | 23.100 | 524,32 | 1.007 | 437,97 | |||
| 2026-01-27 | 13F | Krilogy Financial LLC | 0 | -100,00 | 0 | |||||
| 2025-11-14 | 13F | Corton Capital Inc. | 5.822 | 294 | ||||||
| 2026-02-12 | 13F | Jane Street Group, Llc | Call | 19.300 | 103,16 | 841 | 75,21 | |||
| 2026-02-12 | 13F | Jane Street Group, Llc | 467.640 | 357,28 | 20.380 | 294,10 | ||||
| 2026-02-12 | 13F | Voya Investment Management Llc | 286.604 | -4,77 | 12.490 | -17,93 | ||||
| 2026-02-06 | 13F | Global Retirement Partners, LLC | 3.577 | 113,94 | 156 | 84,52 | ||||
| 2026-02-10 | 13F | Eurizon Capital SGR S.p.A. | 2.735 | 119 | ||||||
| 2026-02-13 | 13F | Integrated Wealth Concepts LLC | 15.983 | 9,68 | 697 | -5,43 | ||||
| 2026-02-05 | 13F | 1620 Investment Advisors, Inc. | 3.809 | -4,44 | 166 | -17,41 | ||||
| 2026-04-10 | 13F | Country Trust Bank | 0 | -100,00 | 0 | |||||
| 2026-02-12 | 13F | Advisors Asset Management, Inc. | 0 | -100,00 | 0 | |||||
| 2025-11-13 | 13F | Bokf, Na | 0 | -100,00 | 0 | |||||
| 2026-02-09 | 13F | Morningstar Investment Management LLC | 16.692 | -83,88 | 1 | -100,00 | ||||
| 2026-02-17 | 13F | Brevan Howard Capital Management LP | 56.411 | 2.458 | ||||||
| 2026-02-17 | 13F | Keebeck Alpha, LP | 0 | -100,00 | 0 | |||||
| 2026-02-06 | 13F | Pnc Financial Services Group, Inc. | 18.077 | -2,23 | 788 | -15,83 | ||||
| 2026-02-17 | 13F | Man Group plc | 0 | -100,00 | 0 | |||||
| 2026-01-23 | 13F | Assetmark, Inc | 345 | -57,14 | 15 | -62,50 | ||||
| 2026-02-13 | 13F | Quarry LP | 137 | -95,25 | 6 | -96,55 | ||||
| 2026-02-25 | 13F | Westshore Wealth, LLC | 0 | -100,00 | 0 | -100,00 | ||||
| 2026-02-12 | 13F | California Public Employees Retirement System | 353.081 | -10,15 | 15.387 | -22,57 | ||||
| 2026-01-20 | 13F | Nvwm, Llc | 676 | 0,00 | 29 | -14,71 | ||||
| 2025-11-14 | 13F | Daiwa Securities Group Inc. | 0 | -100,00 | 0 | |||||
| 2026-02-06 | 13F | Cullen/frost Bankers, Inc. | 15 | 1 | ||||||
| 2025-11-14 | 13F | Bayesian Capital Management, LP | 0 | -100,00 | 0 | |||||
| 2026-04-10 | 13F | Quaker Wealth Management, LLC | 9 | 28,57 | 0 | |||||
| 2026-04-15 | 13F | Atwood & Palmer Inc | 570 | 0,00 | 18 | -25,00 | ||||
| 2026-02-17 | 13F | Lazard Asset Management Llc | 2.492.030 | -22,44 | 108.603 | -33,16 | ||||
| 2025-11-03 | 13F | Pandora Wealth, Inc. | 0 | -100,00 | 0 | |||||
| 2026-04-22 | 13F | Spire Wealth Management | 314 | -62,44 | 10 | -75,00 | ||||
| 2026-02-03 | 13F | NewEdge Wealth, LLC | 843.749 | 0,04 | 36.771 | -13,80 | ||||
| 2026-03-03 | 13F/A | Caitong International Asset Management Co., Ltd | 17 | 1 | ||||||
| 2026-02-17 | 13F | Fmr Llc | 14.567.341 | 1,28 | 634.845 | -12,72 | ||||
| 2026-01-29 | 13F | Vanguard Group Inc | 13.313.823 | -2,53 | 580.216 | -16,00 | ||||
| 2025-11-03 | 13F | Impact Partnership Wealth, LLC | 0 | -100,00 | 0 | |||||
| 2026-04-22 | 13F | Sterling Capital Management LLC | 3.646 | -42,87 | 116 | -58,63 | ||||
| 2026-02-09 | 13F | Kingsview Wealth Management, LLC | 165.431 | -14,40 | 7.209 | -26,24 | ||||
| 2026-02-10 | 13F | Rothschild Investment Llc | 1.645 | 45,19 | 72 | 24,56 | ||||
| 2026-02-13 | 13F | Wells Fargo & Company/mn | 53.915 | -0,40 | 2.350 | -14,18 | ||||
| 2026-02-17 | 13F | Prevatt Capital Ltd | 350.000 | 0,00 | 15.253 | -13,82 | ||||
| 2026-02-09 | 13F | Koesten, Hirschmann & Crabtree, INC. | 0 | -100,00 | 0 | |||||
| 2026-02-17 | 13F | RMB Capital Management, LLC | 11.718 | -1,20 | 516 | -14,74 | ||||
| 2026-03-06 | 13F | Hsbc Holdings Plc | 92.460 | 38,53 | 4.012 | 18,84 | ||||
| 2026-01-28 | 13F | Universal- Beteiligungs- und Servicegesellschaft mbH | 150.854 | -3,18 | 6.574 | -16,55 | ||||
| 2026-02-10 | 13F | Intech Investment Management Llc | 75.034 | 19,84 | 3.270 | 3,25 | ||||
| 2026-02-17 | 13F | Liontrust Investment Partners LLP | 0 | -100,00 | 0 | |||||
| 2026-02-11 | 13F | Curio Wealth, Llc | 86 | 0,00 | 4 | -25,00 | ||||
| 2025-10-28 | 13F | Prossimo Advisors, LLC | 0 | -100,00 | 0 | |||||
| 2026-02-03 | 13F | Ethic Inc. | 17.561 | -10,94 | 765 | -23,27 | ||||
| 2026-04-21 | 13F | Maridea Wealth Management LLC | 0 | -100,00 | 0 | |||||
| 2025-11-13 | 13F | Connor, Clark & Lunn Investment Management Ltd. | 0 | -100,00 | 0 | |||||
| 2026-04-17 | 13F | Guyasuta Investment Advisors Inc | 0 | -100,00 | 0 | |||||
| 2026-02-11 | 13F | Group One Trading, L.p. | Put | 1.800 | -5,26 | 78 | -18,75 | |||
| 2026-02-04 | 13F | Swiss Life Asset Management Ltd | 10.534 | 73,31 | 459 | 49,51 | ||||
| 2026-02-11 | 13F | Group One Trading, L.p. | 517 | -64,78 | 23 | -70,27 | ||||
| 2026-04-07 | 13F | Farther Finance Advisors, LLC | 17.126 | 17,94 | 544 | -13,92 | ||||
| 2026-02-11 | 13F | Group One Trading, L.p. | Call | 5.800 | 241,18 | 253 | 196,47 | |||
| 2026-02-12 | 13F | Marex Group plc | 5.317 | 232 | ||||||
| 2026-04-10 | 13F | Waldron Private Wealth LLC | 0 | -100,00 | 0 | |||||
| 2026-01-07 | 13F | CWA Asset Management Group, LLC | 0 | -100,00 | 0 | |||||
| 2026-04-24 | 13F | Root Financial Partners, LLC | 258 | -23,44 | 8 | -42,86 | ||||
| 2026-02-13 | 13F | Great West Life Assurance Co /can/ | 102.676 | -2,89 | 4 | -20,00 | ||||
| 2026-02-13 | 13F | Resources Investment Advisors, LLC. | 5.052 | 0,92 | 220 | -13,04 | ||||
| 2026-02-17 | 13F | Aquatic Capital Management LLC | 1.666 | -75,19 | 73 | -78,76 | ||||
| 2026-02-13 | 13F | Brown Advisory Inc | 8.756 | -5,40 | 382 | -18,59 | ||||
| 2026-02-05 | 13F | Amalgamated Bank | 57.592 | -7,92 | 3 | -33,33 | ||||
| 2026-02-12 | 13F | Rossby Financial, LCC | 128 | 48,84 | 6 | 25,00 | ||||
| 2026-02-12 | 13F | Steward Partners Investment Advisory, Llc | 1.440 | -4,00 | 63 | -17,33 | ||||
| 2026-04-22 | 13F | Janney Montgomery Scott LLC | 104.966 | 7,43 | 3 | -25,00 | ||||
| 2026-02-06 | 13F | Covestor Ltd | 2.069 | 47,89 | 0 | |||||
| 2025-11-19 | 13F | Sunbelt Securities, Inc. | 0 | -100,00 | 0 | |||||
| 2026-02-05 | 13F | New York Life Investment Management Llc | 11.461 | -14,86 | 499 | -26,62 | ||||
| 2026-04-20 | 13F | Jfs Wealth Advisors, Llc | 82 | -39,71 | 3 | -60,00 | ||||
| 2026-01-29 | 13F | Quent Capital, LLC | 10.013 | 1.750,83 | 436 | 1.514,81 | ||||
| 2026-04-06 | 13F | Highline Wealth Partners Llc | 271 | 9 | ||||||
| 2026-02-17 | 13F | Engineers Gate Manager LP | 36.693 | -88,41 | 1.599 | -90,01 | ||||
| 2026-02-11 | 13F | Jpmorgan Chase & Co | 631.511 | -2,82 | 27.521 | -16,25 | ||||
| 2026-02-11 | 13F | Jpmorgan Chase & Co | Call | 4.200 | -58,00 | 183 | -63,76 | |||
| 2026-04-06 | 13F | CX Institutional | 9.733 | 0 | ||||||
| 2026-02-17 | 13F | Algert Global Llc | 0 | -100,00 | 0 | |||||
| 2026-02-09 | 13F | Royce & Associates Lp | 316.067 | 47,31 | 13.774 | 26,95 | ||||
| 2026-01-30 | 13F | Turning Point Benefit Group, Inc. | 66 | 1.000,00 | 3 | |||||
| 2026-02-13 | 13F | Panagora Asset Management Inc | 0 | -100,00 | 0 | |||||
| 2026-02-09 | 13F/A | Swedbank AB | 345.643 | -0,15 | 15.063 | -13,95 | ||||
| 2026-02-10 | 13F | Fideuram Asset Management (Ireland) dac | 14.062 | 668 | ||||||
| 2026-02-05 | 13F | Allworth Financial LP | 5.779 | -0,79 | 252 | -14,63 | ||||
| 2026-02-12 | 13F/A | Pinebridge Investments Llc | 15.261 | 665 | ||||||
| 2026-02-17 | 13F | Altshuler Shaham Ltd | 0 | -100,00 | 0 | |||||
| 2026-02-12 | 13F | State Board Of Administration Of Florida Retirement System | 137.927 | -4,92 | 6.011 | -18,06 | ||||
| 2026-02-13 | 13F | JustInvest LLC | 14.480 | -14,64 | 631 | -26,46 | ||||
| 2026-02-17 | 13F | Russell Investments Group, Ltd. | 34.396 | -15,10 | 1.499 | -26,86 | ||||
| 2026-02-17 | 13F | Cresset Asset Management, LLC | 0 | -100,00 | 0 | -100,00 | ||||
| 2026-02-10 | 13F | Quantbot Technologies LP | 0 | -100,00 | 0 | |||||
| 2026-04-13 | 13F | IFP Advisors, Inc | 1.189 | -19,50 | 38 | -42,19 | ||||
| 2026-02-17 | 13F | Royal Bank Of Canada | 537.494 | -66,31 | 23.422 | -70,97 | ||||
| 2025-11-04 | 13F | Allianz Asset Management GmbH | 0 | -100,00 | 0 | |||||
| 2026-02-06 | 13F | Envestnet Portfolio Solutions, Inc. | 22.496 | 1,39 | 980 | -12,66 | ||||
| 2026-02-13 | 13F | Kayne Anderson Rudnick Investment Management Llc | 53 | 0,00 | 2 | 0,00 | ||||
| 2026-02-17 | 13F | Grantham, Mayo, Van Otterloo & Co. LLC | 240.790 | -9,97 | 10.494 | -22,42 | ||||
| 2026-01-20 | 13F | Ascent Group, LLC | 0 | -100,00 | 0 | |||||
| 2026-02-17 | 13F | Mercer Global Advisors Inc /adv | 40.765 | 0,33 | 1.777 | -13,53 | ||||
| 2026-02-17 | 13F | PharVision Advisers, LLC | 0 | -100,00 | 0 | |||||
| 2026-02-11 | 13F | Cunning Capital Partners, LP | 37.360 | 2 | ||||||
| 2026-02-10 | 13F | Bnp Paribas Arbitrage, Sa | 873.613 | 32,88 | 38.072 | 14,52 | ||||
| 2026-02-09 | 13F | Hantz Financial Services, Inc. | 3.296 | 144,69 | 0 | |||||
| 2026-02-17 | 13F | Jump Financial, LLC | 31.341 | 1.366 | ||||||
| 2025-11-14 | 13F | Two Sigma Advisers, Lp | 0 | -100,00 | 0 | |||||
| 2026-02-13 | 13F | Macquarie Group Ltd | 0 | -100,00 | 0 | |||||
| 2026-02-13 | 13F | Advisory Research Inc | 17.526 | 4,09 | 764 | -10,34 | ||||
| 2026-02-17 | 13F | SageView Advisory Group, LLC | 3.591 | -14,76 | 156 | -26,76 | ||||
| 2026-04-15 | 13F | Merit Financial Group, LLC | 19.006 | 39,94 | 603 | 2,03 | ||||
| 2026-04-23 | 13F | McMillan Office, Inc. | 130 | 0,00 | 4 | -20,00 | ||||
| 2026-02-02 | 13F | Seizert Capital Partners, Llc | 96.608 | 20,24 | 4.210 | 3,62 | ||||
| 2026-01-26 | 13F | Private Trust Co Na | 1.123 | -3,44 | 49 | -17,24 | ||||
| 2026-02-12 | 13F | Cloud Capital Management, LLC | 0 | -100,00 | 0 | |||||
| 2026-02-12 | 13F | Quadrant Capital Group Llc | 5.966 | -0,08 | 260 | -13,95 | ||||
| 2026-02-09 | 13F | MSH Capital Advisors LLC | 17.680 | -0,30 | 770 | -14,06 | ||||
| 2026-02-12 | 13F | Renaissance Technologies Llc | 0 | -100,00 | 0 | |||||
| 2026-02-02 | 13F | Sachetta, LLC | 0 | -100,00 | 0 | |||||
| 2026-01-27 | 13F | Institute for Wealth Management, LLC. | 0 | -100,00 | 0 | |||||
| 2026-02-13 | 13F | Colony Group, LLC | 22.208 | 21,34 | 1.075 | 15,61 | ||||
| 2026-01-30 | 13F | Us Bancorp \de\ | 12.139 | -3,67 | 529 | -16,95 | ||||
| 2026-02-05 | 13F | Td Private Client Wealth Llc | 7.619 | 172,98 | 332 | 135,46 | ||||
| 2026-02-12 | 13F | Penserra Capital Management LLC | 690 | -4,83 | 0 | |||||
| 2025-12-16 | 13F | Lindenwold Advisors | 5.402 | 0,65 | 273 | -7,14 | ||||
| 2026-02-17 | 13F | Price T Rowe Associates Inc /md/ | 640.918 | -39,92 | 28 | -49,06 | ||||
| 2026-02-12 | 13F | denkapparat Operations GmbH | 9.794 | 0,00 | 427 | -13,94 | ||||
| 2025-11-14 | 13F | Caisse De Depot Et Placement Du Quebec | 0 | -100,00 | 0 | |||||
| 2026-02-11 | 13F | Simplex Trading, Llc | Call | 1.800 | -47,06 | 78 | ||||
| 2026-02-13 | 13F | Verition Fund Management LLC | 9.144 | -50,74 | 398 | -57,57 | ||||
| 2026-04-06 | 13F | Versant Capital Management, Inc | 2.521 | 1.233,86 | 80 | 900,00 | ||||
| 2026-02-11 | 13F | Simplex Trading, Llc | Put | 36.500 | -6,41 | 1.591 | 158.900,00 | |||
| 2026-01-30 | 13F | NJ State Employees Deferred Compensation Plan | 0 | -100,00 | 0 | -100,00 | ||||
| 2026-02-11 | 13F | Simplex Trading, Llc | 13.203 | 526,33 | 575 | |||||
| 2026-02-11 | 13F | LPL Financial LLC | 65.366 | -2,13 | 2.849 | -15,66 | ||||
| 2026-04-23 | 13F | American National Bank | 0 | -100,00 | 0 | |||||
| 2026-02-10 | 13F | Semanteon Capital Management, LP | 0 | -100,00 | 0 | |||||
| 2026-02-13 | 13F | Boston Partners | 3.065.070 | -21,14 | 133.572 | -32,04 | ||||
| 2026-02-05 | 13F | Plante Moran Financial Advisors, LLC | 4 | 0 | ||||||
| 2026-02-17 | 13F | Tudor Investment Corp Et Al | Call | 6.600 | 288 | |||||
| 2026-01-29 | 13F | Dunhill Financial, LLC | 3 | 0 | ||||||
| 2026-02-12 | 13F | Alps Advisors Inc | 388.678 | -5,53 | 16.939 | -18,59 | ||||
| 2026-02-17 | 13F | Tudor Investment Corp Et Al | Put | 5.400 | 235 | |||||
| 2026-02-05 | 13F | Center for Financial Planning, Inc. | 2.303 | 0,00 | 100 | -13,79 | ||||
| 2025-11-17 | 13F | Caxton Associates Llp | 0 | -100,00 | 0 | -100,00 | ||||
| 2026-02-17 | 13F | Tudor Investment Corp Et Al | 36.096 | 1.573 | ||||||
| 2026-01-22 | 13F | Richardson Financial Services Inc. | 1.135 | -11,67 | 49 | -23,44 | ||||
| 2026-01-27 | 13F | Zurcher Kantonalbank (Zurich Cantonalbank) | 39.678 | -4,62 | 1.729 | -17,78 | ||||
| 2026-02-10 | 13F | Sittner & Nelson, Llc | 200 | 7 | ||||||
| 2026-04-22 | 13F | Pictet Asset Management Holding SA | 19.881 | 6,28 | 631 | -22,58 | ||||
| 2026-01-29 | 13F | D.a. Davidson & Co. | 5.731 | 26,85 | 250 | 9,21 | ||||
| 2026-02-17 | 13F | Delaware Management Holdings, Inc. | 19.900 | 867 | ||||||
| 2026-02-17 | 13F | Abel Hall, LLC | 5.046 | 220 | ||||||
| 2026-01-23 | 13F | Avion Wealth | 12 | 20,00 | 0 | |||||
| 2026-02-09 | 13F | Quest Partners LLC | 10.985 | 80,38 | 479 | 55,70 | ||||
| 2026-02-09 | 13F | Keating Financial Advisory Services, Inc. | 182 | 8 | ||||||
| 2026-04-27 | 13F | Y-Intercept (Hong Kong) Ltd | 47.981 | 1.523 | ||||||
| 2026-02-12 | 13F | Commonwealth Equity Services, Llc | 37.150 | -13,67 | 1.619 | 80.800,00 | ||||
| 2026-04-15 | 13F | Financial Management Professionals, Inc. | 42 | 0,00 | 1 | 0,00 | ||||
| 2026-02-12 | 13F | BlackRock, Inc. | 15.831.228 | -2,69 | 689.925 | -16,14 | ||||
| 2026-02-11 | 13F | Empowered Funds, LLC | 115.517 | 64,66 | 5.034 | 41,92 | ||||
| 2026-02-17 | 13F | Captrust Financial Advisors | 9.228 | 7,22 | 402 | -7,59 | ||||
| 2026-02-11 | 13F | First Command Advisory Services, Inc. | 29 | 0,00 | 1 | 0,00 | ||||
| 2025-11-10 | 13F | Hillsdale Investment Management Inc. | 0 | -100,00 | 0 | |||||
| 2026-02-10 | 13F | Operose Advisors LLC | 500 | 0,00 | 22 | -16,00 | ||||
| 2026-02-02 | 13F | GenTrust, LLC | 18.222 | 4,65 | 802 | -8,86 | ||||
| 2026-02-10 | 13F | Cherry Tree Wealth Management, LLC | 358 | 0,00 | 16 | -16,67 | ||||
| 2026-01-28 | 13F | Ruffer LLP | 118.033 | 28,37 | 5.152 | 10,80 | ||||
| 2026-01-26 | 13F | MOKAN Wealth Management Inc. | 6.291 | 0,82 | 274 | -13,02 | ||||
| 2026-01-29 | 13F | IMC-Chicago, LLC | Put | 20.300 | 26,09 | 885 | 8,60 | |||
| 2026-01-29 | 13F | IMC-Chicago, LLC | Call | 46.200 | 59,31 | 2.013 | 37,31 | |||
| 2026-02-17 | 13F | Capital Fund Management S.a. | 76.757 | -45,16 | 3.345 | -52,74 | ||||
| 2026-02-18 | 13F | First Citizens Bank & Trust Co | 27.418 | 0,41 | 1.195 | -13,48 | ||||
| 2026-01-15 | 13F | Moody Lynn & Lieberson, Llc | 0 | -100,00 | 0 | |||||
| 2026-01-30 | 13F | Torren Management, LLC | 408 | 18 | ||||||
| 2026-02-13 | 13F | Walleye Trading LLC | Put | 4.700 | -74,32 | 205 | -77,95 | |||
| 2026-02-13 | 13F | Walleye Trading LLC | Call | 34.700 | -3,07 | 1.512 | -16,46 | |||
| 2026-02-02 | 13F | Truist Financial Corp | 16.987 | -79,17 | 740 | -82,06 | ||||
| 2026-02-11 | 13F | Everett Harris & Co /ca/ | 5.000 | 0,00 | 218 | -13,89 | ||||
| 2026-01-30 | 13F | Mitsubishi UFJ Trust & Banking Corp | 75.473 | 101,40 | 3.289 | 73,56 | ||||
| 2026-02-13 | 13F | Ubs Asset Management Americas Inc | 691.037 | -7,78 | 30.115 | -20,52 | ||||
| 2026-01-26 | 13F | Asset Dedication, LLC | 241 | 0,00 | 11 | -16,67 | ||||
| 2026-02-18 | 13F | GWM Advisors LLC | 53.574 | 2,87 | 2.335 | -11,36 | ||||
| 2026-02-18 | 13F | Mackenzie Financial Corp | 10.139 | -64,36 | 441 | -69,40 | ||||
| 2026-02-06 | 13F | Intrust Bank Na | 0 | -100,00 | 0 | |||||
| 2026-01-30 | 13F | Bogart Wealth, LLC | 866 | -2,26 | 38 | -15,91 | ||||
| 2026-02-12 | 13F | South Dakota Investment Council | 12.501 | -9,42 | 1 | |||||
| 2025-11-06 | 13F | Affinity Wealth Management Llc | 0 | -100,00 | 0 | |||||
| 2026-02-06 | 13F | Handelsbanken Fonder AB | 49.300 | 46,73 | 2 | 100,00 | ||||
| 2026-02-13 | 13F | Pacific Center for Financial Services | 280 | 0,00 | 14 | 0,00 | ||||
| 2026-02-03 | 13F | Gallacher Capital Management LLC | 18.435 | -35,15 | 803 | -44,12 | ||||
| 2026-02-11 | 13F | Deutsche Bank Ag\ | 43.306 | -4,24 | 1.887 | -17,45 | ||||
| 2026-02-17 | 13F | Prelude Capital Management, Llc | 0 | -100,00 | 0 | |||||
| 2026-02-11 | 13F | Parallel Advisors, LLC | 1.802 | 26,99 | 79 | 9,86 | ||||
| 2026-02-02 | 13F | Fifth Third Bancorp | 10.425 | -3,16 | 454 | -16,54 | ||||
| 2026-02-09 | 13F | Legal & General Group Plc | 202.168 | -23,15 | 8.810 | -33,77 | ||||
| 2026-02-17 | 13F | Twinbeech Capital Lp | 5.895 | 257 | ||||||
| 2026-02-13 | 13F | Mml Investors Services, Llc | 14.381 | -5,23 | 627 | -18,38 | ||||
| 2026-02-11 | 13F | Franklin Resources Inc | 107.486 | -95,59 | 4.684 | -66,24 | ||||
| 2026-02-13 | 13F | Arrowstreet Capital, Limited Partnership | 1.794.481 | -9,84 | 78.203 | -22,30 | ||||
| 2026-04-13 | 13F | Gateway Investment Advisers Llc | 0 | -100,00 | 0 | |||||
| 2026-02-17 | 13F | Optiver Holding B.V. | 0 | -100,00 | 0 | |||||
| 2025-11-14 | 13F | Texas Permanent School Fund | 0 | -100,00 | 0 | -100,00 | ||||
| 2026-02-03 | 13F | Legacy Wealth Managment, LLC/ID | 79 | 0,00 | 3 | 0,00 | ||||
| 2026-02-11 | 13F | Illinois Municipal Retirement Fund | 105.164 | 10,84 | 4.583 | -4,46 | ||||
| 2026-02-13 | 13F | Tradewinds, LLC. | 8.581 | 0,00 | 374 | -13,86 | ||||
| 2026-04-24 | 13F | Kendall Capital Management | 65.415 | -7,58 | 2.076 | -32,68 | ||||
| 2026-01-28 | 13F | Klp Kapitalforvaltning As | 45.400 | -3,61 | 1.995 | -16,85 | ||||
| 2026-04-22 | 13F | Silver Coast Investments LLC | 6.428 | 0,00 | 204 | -27,14 | ||||
| 2026-02-12 | 13F | Fuller & Thaler Asset Management, Inc. | 4.285.516 | 4,68 | 186.763 | -9,79 | ||||
| 2026-04-13 | 13F | Hm Payson & Co | 8.950 | 678,26 | 284 | 468,00 | ||||
| 2025-11-14 | 13F | Spears Abacus Advisors LLC | 0 | -100,00 | 0 | |||||
| 2026-04-13 | 13F | Wedge Capital Management L L P/nc | 92.304 | 44,78 | 2.930 | 5,44 | ||||
| 2026-02-04 | 13F | Oregon Public Employees Retirement Fund | 25.224 | -6,31 | 1.099 | -19,25 | ||||
| 2026-02-13 | 13F | Stifel Financial Corp | 62.900 | 34,34 | 2.741 | 15,80 | ||||
| 2026-02-17 | 13F | Centennial Bank/AR/ | 140 | 0,00 | 6 | -14,29 | ||||
| 2025-11-06 | 13F | Ameritas Advisory Services, LLC | 0 | -100,00 | 0 | -100,00 | ||||
| 2025-11-06 | 13F | Abich Financial Wealth Management LLC | 2.338 | 118 | ||||||
| 2026-04-10 | 13F | Linden Thomas Advisory Services, LLC | 31.157 | 0,71 | 989 | -26,71 | ||||
| 2026-02-10 | 13F | Castlekeep Investment Advisors Llc | 29.665 | 0,00 | 1.293 | -13,87 | ||||
| 2026-02-17 | 13F | Sovereign's Capital Management, LLC | 23.316 | -10,54 | 1.016 | -22,91 | ||||
| 2026-02-17 | 13F | Advisor Group Holdings, Inc. | 19.894 | 2,88 | 867 | -11,26 | ||||
| 2026-02-13 | 13F | Pinnacle Wealth Planning Services, Inc. | 23 | 1 | ||||||
| 2026-04-20 | 13F | Banque Cantonale Vaudoise | 5.324 | 0,00 | 169 | -27,16 | ||||
| 2026-01-29 | 13F | State Of Michigan Retirement System | 29.868 | -6,28 | 1.302 | -19,24 | ||||
| 2026-02-13 | 13F | Neuberger Berman Group LLC | 14.953 | 12,38 | 652 | -3,12 | ||||
| 2026-02-17 | 13F | Auxier Asset Management | 45.292 | -1,62 | 1.974 | -15,25 | ||||
| 2026-02-17 | 13F | Oxford Asset Management Llp | 13.027 | 568 | ||||||
| 2025-11-12 | 13F | Headlands Technologies LLC | 0 | -100,00 | 0 | |||||
| 2026-02-13 | 13F | Charles Schwab Investment Management Inc | 1.576.650 | -3,60 | 68.710 | -16,92 | ||||
| 2026-01-22 | 13F | Bartlett & Co. Wealth Management Llc | 10.000 | 0,00 | 440 | -13,56 | ||||
| 2026-04-16 | 13F | Capital Advisors, Ltd. LLC | 0 | -100,00 | 0 | |||||
| 2026-02-17 | 13F | Maryland State Retirement & Pension System | 6.486 | 0,00 | 283 | -13,76 | ||||
| 2026-02-10 | 13F | Basepoint Wealth LLC | 205 | 9 | ||||||
| 2026-02-13 | 13F | Barclays Plc | 781.697 | 2,99 | 34.066 | -11,24 | ||||
| 2026-02-13 | 13F | S&t Bank/pa | 0 | -100,00 | 0 | |||||
| 2026-02-09 | 13F | Annis Gardner Whiting Capital Advisors, LLC | 45 | -99,11 | 2 | -99,61 | ||||
| 2026-02-13 | 13F | Citigroup Inc | 182.083 | 337,76 | 7.935 | 277,32 | ||||
| 2026-02-13 | 13F | Ranmore Fund Management Ltd | 948.000 | 41.314 | ||||||
| 2026-02-12 | 13F | Bank Of Montreal /can/ | 22.712 | -58,87 | 990 | -64,58 | ||||
| 2026-01-05 | 13F | Park Avenue Securities Llc | 0 | -100,00 | 0 | |||||
| 2026-04-09 | 13F | Wedmont Private Capital | 0 | -100,00 | 0 | |||||
| 2026-02-17 | 13F | Guggenheim Capital Llc | 5.314 | -62,17 | 232 | -67,46 | ||||
| 2026-04-17 | 13F | Vermillion Wealth Management, Inc. | 1 | 0 | ||||||
| 2026-01-30 | 13F | New York State Teachers Retirement System | 142.169 | -0,81 | 6 | -14,29 | ||||
| 2026-02-10 | 13F | Norges Bank | 1.593.419 | 69.441 | ||||||
| 2026-04-24 | 13F | Strs Ohio | 2.996 | -1,25 | 95 | -28,03 | ||||
| 2026-02-13 | 13F | Sei Investments Co | 425.562 | -1,55 | 18.547 | -15,16 | ||||
| 2026-02-11 | 13F | Dorsey & Whitney Trust CO LLC | 8.662 | 0,57 | 377 | -13,33 | ||||
| 2026-04-09 | 13F | Tealwood Asset Management Inc | 66.438 | 92,25 | 2 | 100,00 | ||||
| 2026-02-13 | 13F | Kennondale Capital Management LLC | 29.286 | 0,00 | 1.276 | -13,78 | ||||
| 2026-02-09 | 13F | Huntington National Bank | 1.627 | 3,56 | 71 | -11,39 | ||||
| 2026-04-21 | 13F | Maseco Llp | 13 | 0 | ||||||
| 2026-02-17 | 13F | Susquehanna International Group, Llp | 28.084 | 97,04 | 1.224 | 69,86 | ||||
| 2026-02-12 | 13F | Ensign Peak Advisors, Inc | 11.583 | -67,54 | 505 | -72,06 | ||||
| 2026-02-17 | 13F | Susquehanna International Group, Llp | Put | 27.400 | -47,51 | 1.194 | -54,76 | |||
| 2026-02-17 | 13F/A | RBF Capital, LLC | 15.000 | 0,00 | 654 | -13,85 | ||||
| 2026-04-06 | 13F | GAMMA Investing LLC | 1.176 | -55,15 | 37 | -67,54 | ||||
| 2026-02-27 | 13F | Strategic Investment Solutions, Inc. /IL | 52 | 0,00 | 2 | 0,00 | ||||
| 2026-01-21 | 13F | Flagship Harbor Advisors, Llc | 0 | -100,00 | 0 | |||||
| 2026-02-06 | 13F | HighTower Advisors, LLC | 15.576 | -18,33 | 679 | -29,67 | ||||
| 2026-02-13 | 13F | Toroso Investments, LLC | 41.485 | 241,55 | 1.808 | 194,30 | ||||
| 2026-04-16 | 13F | Rockland Trust Co | 16.866 | 0,00 | 535 | -27,21 | ||||
| 2026-02-11 | 13F | Ameritas Investment Partners, Inc. | 23.170 | 1.010 | ||||||
| 2026-02-10 | 13F | Mutual Of America Capital Management Llc | 52.615 | -14,90 | 2.293 | -26,68 | ||||
| 2026-02-03 | 13F | Crossmark Global Holdings, Inc. | 135.875 | -12,10 | 5.921 | -24,25 | ||||
| 2026-02-05 | 13F | Tucker Asset Management Llc | 27 | 1 | ||||||
| 2025-11-07 | 13F | Skandinaviska Enskilda Banken AB (publ) | 0 | -100,00 | 0 | -100,00 | ||||
| 2026-02-17 | 13F | Susquehanna International Group, Llp | Call | 17.100 | -54,52 | 745 | -60,81 | |||
| 2026-01-27 | 13F | Brighton Jones Llc | 0 | -100,00 | 0 | |||||
| 2026-04-20 | 13F | Inscription Capital, LLC | 7.133 | 226 | ||||||
| 2026-02-17 | 13F | Raymond James Financial Inc | 178.564 | -2,58 | 7.782 | -16,04 | ||||
| 2026-02-17 | 13F | New Vernon Capital Holdings II LLC | 3.763 | 0,00 | 164 | -14,21 | ||||
| 2026-02-17 | 13F | Rings Capital Management LLC | 53.000 | 0,00 | 2.310 | -13,84 | ||||
| 2026-02-09 | 13F | Jefferies Financial Group Inc. | 45.038 | 67,97 | 1.963 | 44,80 | ||||
| 2026-04-24 | 13F | Abacus Wealth Partners, LLC | 12.774 | 405 | ||||||
| 2026-01-23 | 13F | Burney Co/ | 41.344 | -5,81 | 1.802 | -18,84 | ||||
| 2026-02-10 | 13F | Principia Wealth Advisory, LLC | 15 | 1.400,00 | 1 | |||||
| 2026-02-13 | 13F | Bank Of Nova Scotia | 121.127 | 1.410,12 | 5.279 | 1.203,21 | ||||
| 2026-02-05 | 13F | LGT Group Foundation | 23.236 | -25,97 | 1.012 | -36,97 | ||||
| 2026-02-13 | 13F | Public Employees Retirement Association Of Colorado | 14.290 | 0,00 | 1 | |||||
| 2026-04-23 | 13F | North Star Investment Management Corp. | 1.986 | 0,10 | 63 | -26,74 | ||||
| 2026-01-30 | 13F/A | M&t Bank Corp | 36.663 | 5,95 | 1.597 | -8,74 | ||||
| 2026-02-06 | 13F | Tortoise Investment Management, LLC | 0 | -100,00 | 0 | |||||
| 2026-02-11 | 13F | Twin Tree Management, LP | Call | 0 | -100,00 | 0 | ||||
| 2025-11-13 | 13F | Farringdon Capital, Ltd. | 0 | -100,00 | 0 | -100,00 | ||||
| 2025-11-14 | 13F | Binnacle Investments Inc | 84 | 86,67 | 4 | 100,00 | ||||
| 2026-01-29 | 13F | Comerica Bank | 51.468 | -5,97 | 2.243 | -18,97 | ||||
| 2026-02-13 | 13F | MAI Capital Management | 760 | 50,79 | 33 | 32,00 | ||||
| 2026-02-11 | 13F | Rise Advisors, LLC | 0 | -100,00 | 0 | |||||
| 2026-02-13 | 13F | BNP Paribas Asset Management Holding S.A. | 1.802 | 32,79 | 0 | |||||
| 2026-01-26 | 13F | KBC Group NV | 3.929 | 0,00 | 0 | |||||
| 2026-02-12 | 13F | Barnett & Company, Inc. | 0 | -100,00 | 0 | |||||
| 2026-04-07 | 13F | Carolina Wealth Advisors, LLC | 51.303 | 4.357,25 | 1.628 | 3.156,00 | ||||
| 2026-04-15 | 13F | Valley National Advisers Inc | 800 | 0,00 | 0 | |||||
| 2025-11-07 | 13F | Shell Asset Management Co | 2.493 | -54,75 | 0 | |||||
| 2026-02-06 | 13F | EverSource Wealth Advisors, LLC | 2.361 | 69,13 | 103 | 45,71 | ||||
| 2026-02-13 | 13F | Morgan Stanley | 1.500.953 | -17,93 | 65.412 | -29,27 | ||||
| 2026-02-13 | 13F | Jacobs Levy Equity Management, Inc | 0 | -100,00 | 0 | |||||
| 2026-02-11 | 13F | Los Angeles Capital Management Llc | 643 | 33 | ||||||
| 2026-02-13 | 13F | Marshall Wace, Llp | 0 | -100,00 | 0 | |||||
| 2026-02-05 | 13F | Arbejdsmarkedets Tillaegspension | 555.637 | 24.215 | ||||||
| 2026-02-13 | 13F | Police & Firemen's Retirement System of New Jersey | 55.009 | -6,90 | 2.397 | -19,78 | ||||
| 2026-02-03 | 13F | SBI Securities Co., Ltd. | 922 | 5,86 | 40 | -9,09 | ||||
| 2026-04-22 | 13F | Harbor Asset Planning, Inc. | 379 | 0,00 | 12 | -25,00 | ||||
| 2026-02-13 | 13F | Aviso Wealth Management | 10.561 | 0,00 | 460 | -13,86 | ||||
| 2026-02-17 | 13F | Amundi | 9.377 | -90,61 | 409 | -91,97 | ||||
| 2026-04-23 | 13F | SJS Investment Consulting Inc. | 98 | 50,77 | 3 | 50,00 | ||||
| 2026-04-10 | 13F | Kessler Investment Group, LLC | 0 | -100,00 | 0 | |||||
| 2025-11-04 | 13F | Brown Capital Management Llc | 0 | -100,00 | 0 | |||||
| 2026-01-16 | 13F | West Branch Capital LLC | 0 | -100,00 | 0 | |||||
| 2026-02-10 | 13F | Private Wealth Asset Management, LLC | 225 | 12,50 | 10 | -10,00 | ||||
| 2025-11-14 | 13F | Wood Tarver Financial Group, LLC | 0 | -100,00 | 0 | |||||
| 2026-02-17 | 13F | Atom Investors LP | 171.538 | 7.476 | ||||||
| 2026-01-26 | 13F | Roof Eidam & Maycock/adv | 5.000 | 0,00 | 218 | -13,89 | ||||
| 2026-02-13 | 13F | TCM Advisors, LLC | 392 | 4,81 | ||||||
| 2026-02-17 | 13F | DZ BANK AG Deutsche Zentral Genossenschafts Bank, Frankfurt am Main | 0 | -100,00 | 0 | |||||
| 2026-02-09 | 13F | New Age Alpha Advisors, LLC | 14.431 | -49,00 | 629 | -56,08 | ||||
| 2026-02-17 | 13F | Lighthouse Investment Partners, LLC | 42.471 | 1.851 | ||||||
| 2026-04-14 | 13F | Zrc Wealth Management, Llc | 773 | 1,05 | 25 | -27,27 |