Grundlæggende statistik
| Institutionelle ejere | 169 total, 169 long only, 0 short only, 0 long/short - change of 18,06% MRQ |
| Gennemsnitlig porteføljeallokering | 0.6805 % - change of -23,13% MRQ |
| Institutionelle aktier (lange) | 31.531.669 (ex 13D/G) - change of -1,61MM shares -4,85% MRQ |
| Institutionel værdi (lang) | $ 991.423 USD ($1000) |
Institutionelt ejerskab og aktionærer
Franklin Templeton ETF Trust - Franklin FTSE Japan ETF (US:FLJP) har 169 institutionelle ejere og aktionærer, der har indsendt 13D/G- eller 13F-formularer til Securities Exchange Commission (SEC). Disse institutioner har i alt 31,531,669 aktier. Største aktionærer omfatter Bank Of America Corp /de/, Morgan Stanley, LPL Financial LLC, Janus Henderson Group Plc, Clayton Street Trust - Protective Life Dynamic Allocation Series - Moderate Portfolio, Bank Of Montreal /can/, Envestnet Asset Management Inc, RiverFront Investment Group, LLC, Arvest Bank Trust Division, and Agf Management Ltd .
Franklin Templeton ETF Trust - Franklin FTSE Japan ETF (ARCA:FLJP) institutionel ejerskabsstruktur viser aktuelle positioner i virksomheden efter institutioner og fonde, samt seneste ændringer i positionsstørrelse. Større aktionærer kan omfatte individuelle investorer, investeringsforeninger, hedgefonde eller institutioner. Skema 13D angiver, at investoren besidder (eller besidder) mere end 5 % af virksomheden og har til hensigt (eller har til hensigt at) aktivt at forfølge en ændring i forretningsstrategi. Skema 13G indikerer en passiv investering på over 5%.
The share price as of September 12, 2025 is 34,83 / share. Previously, on September 16, 2024, the share price was 29,99 / share. This represents an increase of 16,14% over that period.

Fondens stemningsscore
Fund Sentiment Score (fka Ownership Accumulation Score) finder de aktier, der bliver mest købt af fonde. Det er resultatet af en sofistikeret, multi-faktor kvantitativ model, der identificerer virksomheder med de højeste niveauer af institutionel akkumulering. Scoringsmodellen bruger en kombination af den samlede stigning i oplyste ejere, ændringerne i porteføljeallokeringer i disse ejere og andre målinger. Tallet går fra 0 til 100, hvor højere tal indikerer et højere niveau af akkumulering for sine jævnaldrende, og 50 er gennemsnittet.
Opdateringsfrekvens: Dagligt
Se Ownership Explorer, som giver en liste over højest rangerende virksomheder.
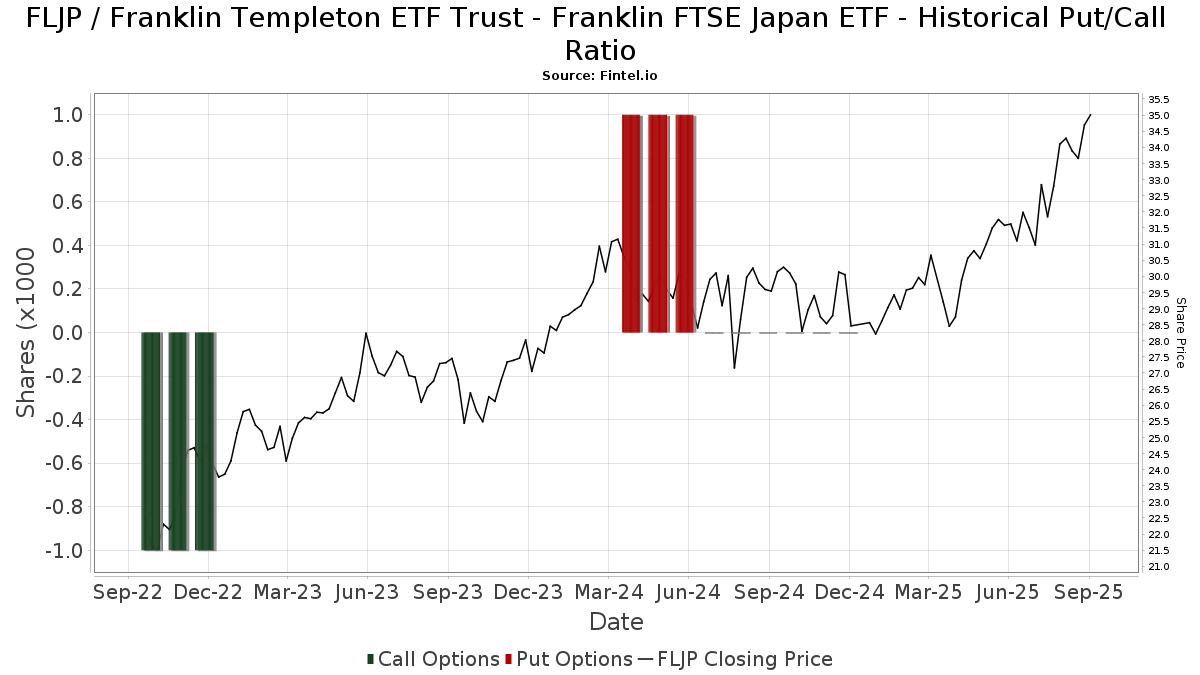
Institutionel Put/Call-forhold
Ud over at indberette standardaktie- og gældsudstedelser skal institutter med mere end 100 mill. aktiver under forvaltning også oplyse deres put- og call-optionsbeholdninger. Da salgsoptioner generelt indikerer negativ stemning, og købsoptioner indikerer positiv stemning, kan vi få en fornemmelse af den overordnede institutionelle stemning ved at plotte forholdet mellem put og kald. Diagrammet til højre viser det historiske put/call-forhold for dette instrument.
Brug af Put/Call Ratio som en indikator for investorernes stemning overvinder en af de vigtigste mangler ved at bruge totalt institutionelt ejerskab, som er, at en betydelig mængde af aktiver under forvaltning investeres passivt for at spore indekser. Passivt forvaltede fonde køber typisk ikke optioner, så indikatoren for put/call-forholdet følger mere nøje følelsen af aktivt forvaltede fonde.
13F og NPORT arkivering
Detaljer om 13F-arkivering er gratis. Detaljer om NP-ansøgninger kræver et premium-medlemskab. Grønne rækker angiver nye positioner. Røde rækker angiver lukkede positioner. Klik på linket ikon for at se den fulde transaktionshistorik.
Opgrader
for at låse premium-data op og eksportere til Excel ![]() .
.
| Fil dato | Kilde | Investor | Type | Gennemsnitlig pris (Øst) |
Aktier | Δ Aktier (%) |
Rapporteret Værdi ($1000) |
Δ Værdi (%) |
Port Alloc (%) |
|
|---|---|---|---|---|---|---|---|---|---|---|
| 2025-07-29 | 13F | Yoffe Investment Management, LLC | 11.410 | 0,00 | 367 | 9,25 | ||||
| 2025-08-14 | 13F | Mml Investors Services, Llc | 81.805 | 12,00 | 3 | 0,00 | ||||
| 2025-05-14 | 13F | Itau Unibanco Holding S.A. | 0 | -100,00 | 0 | |||||
| 2025-07-16 | 13F | Signaturefd, Llc | 60 | -58,33 | 2 | -75,00 | ||||
| 2025-08-14 | 13F | Ancora Advisors, LLC | 0 | -100,00 | 0 | |||||
| 2025-08-07 | 13F | Compass Financial Group, Inc. | 0 | -100,00 | 0 | |||||
| 2025-08-07 | 13F | Resources Investment Advisors, LLC. | 28.628 | -59,52 | 920 | -55,73 | ||||
| 2025-07-24 | 13F | Us Bancorp \de\ | 221 | -12,99 | 7 | 0,00 | ||||
| 2025-08-11 | 13F | HighTower Advisors, LLC | 52.137 | -0,22 | 1.676 | 9,11 | ||||
| 2025-08-14 | 13F | Bank Of America Corp /de/ | 11.359.669 | -0,64 | 365.213 | 8,66 | ||||
| 2025-07-24 | 13F | IFP Advisors, Inc | 9.722 | 60,85 | 313 | 76,27 | ||||
| 2025-05-14 | 13F | Visionary Wealth Advisors | 0 | -100,00 | 0 | |||||
| 2025-07-08 | 13F | Parallel Advisors, LLC | 30 | 0,00 | 1 | |||||
| 2025-08-05 | 13F | Bank Of Montreal /can/ | 662.168 | 288,04 | 21.289 | 324,40 | ||||
| 2025-07-28 | 13F | Harbour Investments, Inc. | 7.780 | 67,02 | 250 | 83,82 | ||||
| 2025-08-29 | NP | N/A - Protective Life Dynamic Allocation Series - Conservative Portfolio | 32.389 | -5,77 | 1.041 | 3,07 | ||||
| 2025-08-12 | 13F | MAI Capital Management | 500 | -7,92 | 16 | 6,67 | ||||
| 2025-05-06 | 13F | Venturi Wealth Management, LLC | 0 | -100,00 | 0 | |||||
| 2025-04-17 | 13F | Sound Income Strategies, LLC | 0 | -100,00 | 0 | |||||
| 2025-08-13 | 13F/A | StoneX Group Inc. | 200.000 | 5.420 | ||||||
| 2025-08-12 | 13F | Atlas Capital Advisors Llc | 206.781 | -6,27 | 6.648 | 2,51 | ||||
| 2025-07-10 | 13F | Wealth Enhancement Advisory Services, Llc | 25.607 | 26,92 | 820 | 38,28 | ||||
| 2025-08-05 | 13F | Huntington National Bank | 31 | 7,14 | ||||||
| 2025-08-07 | 13F | WESCAP Management Group, Inc. | 18.098 | -1,31 | 582 | 7,79 | ||||
| 2025-08-08 | 13F | Creative Planning | 10.923 | 54,76 | 351 | 69,57 | ||||
| 2025-07-24 | 13F | Ronald Blue Trust, Inc. | 194 | 0,00 | 6 | 20,00 | ||||
| 2025-08-13 | 13F | Northwestern Mutual Wealth Management Co | 2.899 | 29,07 | 93 | 40,91 | ||||
| 2025-08-11 | 13F | Madison Asset Management, LLC | 396.238 | -40,95 | 12.739 | -35,42 | ||||
| 2025-08-12 | 13F | RiverFront Investment Group, LLC | 632.962 | 3,00 | 20.350 | 12,63 | ||||
| 2025-07-23 | 13F | Spectrum Asset Management, Inc. (NB/CA) | 58.219 | 1.872 | ||||||
| 2025-08-14 | 13F | Wells Fargo & Company/mn | 275 | -27,06 | 9 | -27,27 | ||||
| 2025-08-29 | NP | Clayton Street Trust - Protective Life Dynamic Allocation Series - Growth Portfolio | 59.766 | -11,22 | 1.921 | -2,93 | ||||
| 2025-08-14 | 13F | Main Street Financial Solutions, LLC | 14.251 | 458 | ||||||
| 2025-08-14 | 13F | DZ BANK AG Deutsche Zentral Genossenschafts Bank, Frankfurt am Main | 24.388 | -97,45 | 784 | -97,21 | ||||
| 2025-08-07 | 13F | Evoke Wealth, Llc | 52.572 | 0,00 | 1.690 | 9,39 | ||||
| 2025-08-13 | 13F | Baird Financial Group, Inc. | 10.778 | 7,38 | 347 | 17,29 | ||||
| 2025-04-25 | 13F | New Millennium Group LLC | 0 | -100,00 | 0 | |||||
| 2025-08-14 | 13F | Janus Henderson Group Plc | 820.571 | -6,23 | 26.381 | 1,67 | ||||
| 2025-06-27 | NP | INTL - Main International ETF | 0 | -100,00 | 0 | -100,00 | ||||
| 2025-06-26 | NP | SSXU - Day Hagan/Ned Davis Research Smart Sector International ETF | 171.793 | -31,68 | 5.250 | -28,28 | ||||
| 2025-08-29 | NP | Clayton Street Trust - Protective Life Dynamic Allocation Series - Moderate Portfolio | 738.036 | -4,58 | 23.728 | 4,35 | ||||
| 2025-04-25 | 13F | Saxon Interests, Inc. | 0 | -100,00 | 0 | |||||
| 2025-05-14 | 13F | Level Four Advisory Services, Llc | 0 | -100,00 | 0 | |||||
| 2025-08-14 | 13F | EP Wealth Advisors, Inc. | 18.738 | -93,71 | 602 | -93,13 | ||||
| 2025-08-12 | 13F | Winnow Wealth Llc | 119.965 | 3.857 | ||||||
| 2025-05-09 | 13F | CoreCap Advisors, LLC | 0 | -100,00 | 0 | |||||
| 2025-08-04 | 13F | Simon Quick Advisors, Llc | 249.307 | 8.015 | ||||||
| 2025-08-12 | 13F | Proequities, Inc. | 0 | 0 | ||||||
| 2025-08-14 | 13F | Ameriprise Financial Inc | 249.268 | -38,86 | 8.014 | -33,09 | ||||
| 2025-08-11 | 13F | Brown Brothers Harriman & Co | 619 | 20 | ||||||
| 2025-07-11 | 13F | Adirondack Trust Co | 539 | 17 | ||||||
| 2025-08-13 | 13F | Kilter Group LLC | 101 | 3 | ||||||
| 2025-08-14 | 13F | Raymond James Financial Inc | 311.468 | -2,75 | 10.014 | 6,35 | ||||
| 2025-08-04 | 13F | Spire Wealth Management | 59 | -14,49 | 2 | -50,00 | ||||
| 2025-08-14 | 13F | UBS Group AG | 271.576 | -29,55 | 8.731 | -22,97 | ||||
| 2025-08-14 | 13F | Kovitz Investment Group Partners, LLC | 35.421 | -0,71 | 1.139 | 8,59 | ||||
| 2025-04-01 | 13F | Confluence Investment Management Llc | 0 | -100,00 | 0 | |||||
| 2025-08-11 | 13F | Principal Securities, Inc. | 44 | 1 | ||||||
| 2025-08-14 | 13F | Quantinno Capital Management LP | 38.608 | -1,74 | 1.241 | 7,45 | ||||
| 2025-04-25 | 13F | Stonebridge Financial Group, LLC | 0 | -100,00 | 0 | |||||
| 2025-08-06 | 13F | Agf Management Ltd | 430.131 | 6,71 | 13.829 | 16,69 | ||||
| 2025-05-09 | 13F | Wealthspire Advisors, LLC | 0 | -100,00 | 0 | |||||
| 2025-08-14 | 13F | Goldman Sachs Group Inc | 243.380 | 7.825 | ||||||
| 2025-07-14 | 13F | Toth Financial Advisory Corp | 0 | -100,00 | 0 | |||||
| 2025-06-17 | NP | MCNAX - Madison Conservative Allocation Fund Conservative Allocation Fund Class A | 31.703 | 10,04 | 969 | 15,51 | ||||
| 2025-08-14 | 13F | Hrt Financial Lp | 34.942 | 1 | ||||||
| 2025-08-19 | 13F | Newbridge Financial Services Group, Inc. | 80 | 0,00 | 3 | 0,00 | ||||
| 2025-07-28 | 13F | Fairman Group, LLC | 67 | 0,00 | 2 | 100,00 | ||||
| 2025-07-29 | 13F | Koshinski Asset Management, Inc. | 8.285 | 9,81 | 266 | 20,36 | ||||
| 2025-08-04 | 13F | Virtus Family Office LLC | 17.800 | 39,88 | 572 | 52,94 | ||||
| 2025-08-01 | 13F | New York Life Investment Management Llc | 0 | -100,00 | 0 | |||||
| 2025-08-13 | 13F | EverSource Wealth Advisors, LLC | 31.945 | 1,76 | 1.027 | 11,39 | ||||
| 2025-08-05 | 13F | Mma Asset Management Llc | 146.675 | 4.716 | ||||||
| 2025-08-04 | 13F | Pensionmark Financial Group, Llc | 13.748 | 2,83 | 442 | 12,47 | ||||
| 2025-08-05 | 13F | Carolinas Wealth Consulting Llc | 0 | -100,00 | 0 | -100,00 | ||||
| 2025-07-16 | 13F | Paragon Capital Management Ltd | 152.205 | 118,35 | 4.893 | 138,80 | ||||
| 2025-08-14 | 13F | Sunbelt Securities, Inc. | 200 | 0,00 | 6 | 0,00 | ||||
| 2025-08-13 | 13F | Cerity Partners LLC | 11.336 | -23,41 | 364 | -16,32 | ||||
| 2025-07-17 | 13F | Keystone Global Partners, LLC | 0 | -100,00 | 0 | |||||
| 2025-08-08 | 13F | Gts Securities Llc | 324.654 | 10.438 | ||||||
| 2025-08-12 | 13F | AlphaCore Capital LLC | 79 | 71,74 | 3 | 100,00 | ||||
| 2025-07-17 | 13F | Janney Montgomery Scott LLC | 75.474 | -2,34 | 2 | 0,00 | ||||
| 2025-09-04 | 13F/A | Advisor Group Holdings, Inc. | 19.766 | 9,16 | 636 | 19,36 | ||||
| 2025-08-12 | 13F | O'shaughnessy Asset Management, Llc | 5.904 | -6,46 | 190 | 2,16 | ||||
| 2025-05-15 | 13F | GWM Advisors LLC | 0 | -100,00 | 0 | |||||
| 2025-07-25 | 13F | Almanack Investment Partners, LLC. | 30.475 | 4,33 | 980 | 14,10 | ||||
| 2025-08-08 | 13F | Pnc Financial Services Group, Inc. | 4.702 | 0,00 | 151 | 9,42 | ||||
| 2025-08-08 | 13F | Mittelman Wealth Management | 108.395 | 13,55 | 3.485 | 24,16 | ||||
| 2025-08-14 | 13F | Comerica Bank | 36.978 | 123,72 | 1.189 | 144,95 | ||||
| 2025-07-22 | 13F | Belpointe Asset Management LLC | 19.820 | 637 | ||||||
| 2025-08-08 | 13F | Rockefeller Capital Management L.P. | 0 | -100,00 | 0 | |||||
| 2025-08-12 | 13F | Franklin Resources Inc | 7.547 | -98,15 | 243 | -97,98 | ||||
| 2025-08-14 | 13F | Mariner, LLC | 47.319 | 0,35 | 1.521 | 9,74 | ||||
| 2025-08-14 | 13F | Paces Ferry Wealth Advisors, Llc | 10.260 | -1,89 | 330 | 7,17 | ||||
| 2025-07-23 | 13F | Vontobel Holding Ltd. | 144.100 | -5,88 | 4.633 | 2,98 | ||||
| 2025-05-15 | 13F | Proquility Private Wealth Partners, LLC | 242.846 | 43,90 | 7.140 | 47,87 | ||||
| 2025-07-15 | 13F | Armis Advisers, LLC | 169.366 | 5.274 | ||||||
| 2025-08-13 | 13F | Rsm Us Wealth Management Llc | 8.644 | -1,90 | 278 | 6,95 | ||||
| 2025-07-21 | 13F | Ameritas Advisory Services, LLC | 200 | 6 | ||||||
| 2025-07-23 | 13F | Clear Creek Financial Management, LLC | 41.405 | 1.331 | ||||||
| 2025-08-06 | 13F | Innealta Capital, Llc | 220.030 | -17,43 | 7.074 | -9,71 | ||||
| 2025-07-31 | 13F | Brinker Capital Investments, LLC | 0 | -100,00 | 0 | -100,00 | ||||
| 2025-07-31 | 13F | Sage Mountain Advisors LLC | 2.125 | 0,00 | 68 | 9,68 | ||||
| 2025-08-14 | 13F | Jane Street Group, Llc | 67.027 | 2.155 | ||||||
| 2025-07-14 | 13F | Armstrong Advisory Group, Inc | 3.383 | 109 | ||||||
| 2025-07-28 | 13F | SFG Wealth Management, LLC. | 0 | -100,00 | 0 | |||||
| 2025-08-04 | 13F | Impact Partnership Wealth, LLC | 262.140 | 3,60 | 8.428 | 13,28 | ||||
| 2025-06-17 | NP | MMDAX - Madison Moderate Allocation Fund Moderate Allocation Fund Class A | 124.124 | 11,04 | 3.793 | 16,60 | ||||
| 2025-06-17 | NP | MAGSX - Madison Aggressive Allocation Fund Aggressive Allocation Fund Class A | 96.500 | 8,60 | 2.949 | 14,04 | ||||
| 2025-05-05 | 13F | Eagle Bay Advisors LLC | 0 | -100,00 | 0 | |||||
| 2025-07-31 | 13F | Opes Wealth Management LLC | 185.706 | 5,60 | 5.970 | 15,47 | ||||
| 2025-08-14 | 13F | Knightsbridge Asset Management, Llc | 51.415 | 9,47 | 1.653 | 19,71 | ||||
| 2025-08-12 | 13F | LPL Financial LLC | 867.229 | -12,70 | 27.881 | -4,54 | ||||
| 2025-07-10 | 13F | Farmers & Merchants Trust Co of Chambersburg PA | 369 | 0,00 | 0 | |||||
| 2025-05-15 | 13F | Citadel Advisors Llc | Put | 0 | -100,00 | 0 | -100,00 | |||
| 2025-07-14 | 13F | GAMMA Investing LLC | 259 | 0,00 | 8 | 14,29 | ||||
| 2025-08-14 | 13F | Fmr Llc | 4.527 | -7,73 | 146 | 0,69 | ||||
| 2025-08-29 | NP | GDMA - Gadsden Dynamic Multi-Asset ETF | 230.062 | -10,19 | 7.396 | -1,79 | ||||
| 2025-08-18 | NP | ULTRA SERIES FUND - Aggressive Allocation Fund Class I | 65.269 | -8,93 | 2.098 | -0,43 | ||||
| 2025-08-06 | 13F | Commonwealth Equity Services, Llc | 10.560 | 40,63 | 0 | |||||
| 2025-05-15 | 13F | Citadel Advisors Llc | Call | 0 | -100,00 | 0 | -100,00 | |||
| 2025-07-07 | 13F | General Partner, Inc. | 30.295 | 0,00 | 974 | 9,33 | ||||
| 2025-07-31 | 13F | Leavell Investment Management, Inc. | 87.815 | 4,13 | 2.823 | 13,88 | ||||
| 2025-08-18 | 13F/A | National Bank Of Canada /fi/ | 5.627 | 85,96 | 181 | 104,55 | ||||
| 2025-08-14 | 13F | Old Mission Capital Llc | 14.987 | 482 | ||||||
| 2025-08-18 | NP | ULTRA SERIES FUND - Conservative Allocation Fund Class I | 30.115 | -18,79 | 968 | -11,19 | ||||
| 2025-05-09 | 13F | Connable Office Inc | 0 | -100,00 | 0 | |||||
| 2025-08-12 | NP | DFNDX - Kensington Defender Fund Institutional Class | 120.172 | -51,15 | 3.864 | -45,40 | ||||
| 2025-07-10 | 13F | Atticus Wealth Management, Llc | 125 | 4 | ||||||
| 2025-08-05 | 13F | Harel Insurance Investments & Financial Services Ltd. | 3.400 | 385,71 | 0 | |||||
| 2025-08-12 | 13F | Accordant Advisory Group Inc | 119.965 | 3.857 | ||||||
| 2025-08-13 | 13F | Berkshire Asset Management Llc/pa | 6.586 | 0,00 | 212 | 4,46 | ||||
| 2025-08-14 | 13F | Stifel Financial Corp | 22.890 | 0,94 | 736 | 10,36 | ||||
| 2025-08-12 | 13F | Archer Investment Corp | 313 | 0,00 | 10 | 11,11 | ||||
| 2025-08-13 | 13F | Flow Traders U.s. Llc | 32.801 | 1 | ||||||
| 2025-08-11 | 13F | Empowered Funds, LLC | 230.687 | -9,94 | 7.417 | -1,53 | ||||
| 2025-08-06 | 13F | AE Wealth Management LLC | 825 | -7,20 | 27 | 0,00 | ||||
| 2025-08-13 | 13F | GeoWealth Management, LLC | 5.919 | 190 | ||||||
| 2025-05-27 | NP | MAINSTAY VP FUNDS TRUST - MainStay VP IQ Hedge Multi-Strategy Portfolio Initial Class | 2.445 | -13,36 | 72 | -11,25 | ||||
| 2025-08-13 | 13F | Avestar Capital, LLC | 321.882 | 10.349 | ||||||
| 2025-03-28 | NP | QAI - IQ Hedge Multi-Strategy Tracker ETF | 7.639 | 5,41 | 222 | 6,22 | ||||
| 2025-08-18 | NP | ULTRA SERIES FUND - Moderate Allocation Fund Class I | 114.414 | -20,62 | 3.678 | -13,19 | ||||
| 2025-05-12 | 13F | Benjamin Edwards Inc | 0 | -100,00 | 0 | |||||
| 2025-07-15 | 13F | Td Private Client Wealth Llc | 1.132 | -42,24 | 36 | -36,84 | ||||
| 2025-08-14 | 13F | Fiduciary Trust Co | 15.055 | 0,00 | 484 | 9,50 | ||||
| 2025-07-17 | 13F | Clean Yield Group | 1.750 | 0,00 | 56 | 9,80 | ||||
| 2025-07-29 | 13F | Crux Wealth Advisors | 23.686 | -28,08 | 762 | -21,38 | ||||
| 2025-08-11 | 13F | Inspire Advisors, LLC | 37.405 | 87,22 | 1.203 | 104,77 | ||||
| 2025-04-10 | 13F | Hennion & Walsh Asset Management, Inc. | 0 | -100,00 | 0 | |||||
| 2025-08-01 | 13F | Rossby Financial, LCC | 50 | 0,00 | 2 | 0,00 | ||||
| 2025-08-01 | 13F | Envestnet Asset Management Inc | 659.760 | 0,01 | 21.211 | 9,37 | ||||
| 2025-07-25 | 13F | Cwm, Llc | 11.651 | 1.072,13 | 0 | |||||
| 2025-08-08 | 13F | Principal Financial Group Inc | 0 | -100,00 | 0 | |||||
| 2025-08-18 | 13F | Geneos Wealth Management Inc. | 389 | 13 | ||||||
| 2025-08-08 | 13F | Kingsview Wealth Management, LLC | 7.371 | 237 | ||||||
| 2025-08-07 | 13F | Altman Advisors, Inc. | 57.432 | 3,86 | 1.836 | 8,64 | ||||
| 2025-05-16 | 13F | Jones Financial Companies Lllp | 0 | -100,00 | 0 | |||||
| 2025-08-07 | 13F | Allworth Financial LP | 70 | -85,26 | 2 | -85,71 | ||||
| 2025-08-29 | NP | RAA - SMI 3Fourteen Real Asset Allocation ETF SMI 3Fourteen REAL Asset Allocation ETF | 152.121 | 4.891 | ||||||
| 2025-08-12 | 13F | Steward Partners Investment Advisory, Llc | 313.151 | 0,50 | 10.068 | 9,90 | ||||
| 2025-08-14 | 13F | Toroso Investments, LLC | 136.325 | 12,91 | 4.383 | 23,47 | ||||
| 2025-08-01 | 13F | Bessemer Group Inc | 0 | -100,00 | 0 | |||||
| 2025-05-15 | 13F | Main Management LLC | 0 | -100,00 | 0 | |||||
| 2025-08-13 | 13F | Bare Financial Services, Inc | 432 | 0,00 | 14 | 8,33 | ||||
| 2025-08-15 | 13F | Morgan Stanley | 4.441.003 | 7,07 | 142.778 | 17,08 | ||||
| 2025-08-12 | 13F | Kensington Asset Management, LLC | 120.172 | 3.864 | ||||||
| 2025-07-29 | 13F | Private Trust Co Na | 168 | -9,19 | 5 | 0,00 | ||||
| 2025-06-27 | NP | DAAVX - Dunham Dynamic Macro Fund Class A | 153.100 | 3,80 | 4.679 | 8,97 | ||||
| 2025-08-14 | 13F | Alaska Permanent Fund Corp | 0 | -100,00 | 0 | |||||
| 2025-05-12 | 13F | Sandy Spring Bank | 100 | 3 | ||||||
| 2025-08-14 | 13F | Hara Capital LLC | 120 | 0,00 | 4 | 0,00 | ||||
| 2025-08-28 | NP | ICCIX - Dynamic International Opportunity Fund Class I | 219.688 | -17,46 | 7.063 | -9,74 | ||||
| 2025-08-12 | 13F | Global Retirement Partners, LLC | 10.218 | -4,92 | 329 | 6,84 | ||||
| 2025-05-13 | 13F | Heck Capital Advisors, LLC | 0 | -100,00 | 0 | -100,00 | ||||
| 2025-08-14 | 13F | Principia Wealth Advisory, LLC | 2.401 | 77 | ||||||
| 2025-08-08 | 13F | Tortoise Investment Management, LLC | 4.400 | 0,00 | 141 | 9,30 | ||||
| 2025-05-15 | 13F | SRS Capital Advisors, Inc. | 0 | -100,00 | 0 | |||||
| 2025-08-11 | 13F | HHM Wealth Advisors, LLC | 100 | 3 | ||||||
| 2025-07-28 | 13F | BRYN MAWR TRUST Co | 7.636 | -8,32 | 245 | 0,41 | ||||
| 2025-05-14 | 13F | Susquehanna International Group, Llp | 0 | -100,00 | 0 | |||||
| 2025-08-11 | 13F | Annis Gardner Whiting Capital Advisors, LLC | 731 | 24 | ||||||
| 2025-08-13 | 13F | Townsquare Capital Llc | 0 | -100,00 | 0 | |||||
| 2025-08-14 | 13F | Qube Research & Technologies Ltd | 5.732 | 184 | ||||||
| 2025-08-12 | 13F | Jpmorgan Chase & Co | 71.615 | 125,63 | 2.302 | 146,73 | ||||
| 2025-07-07 | 13F | Nova Wealth Management, Inc. | 70 | 2 | ||||||
| 2025-05-13 | 13F | Bokf, Na | 0 | -100,00 | 0 | |||||
| 2025-08-14 | 13F | Royal Bank Of Canada | 174.874 | 23,41 | 5.621 | 34,93 | ||||
| 2025-08-04 | 13F | Assetmark, Inc | 80 | 3 | ||||||
| 2025-08-13 | 13F | Green Harvest Asset Management LLC | 50.151 | 44,17 | 1.612 | 57,73 | ||||
| 2025-08-13 | 13F | Capital Analysts, Inc. | 121 | 0,00 | 0 | |||||
| 2025-07-31 | 13F | Wealthfront Advisers Llc | 15.481 | 2,31 | 498 | 11,94 | ||||
| 2025-08-15 | 13F | Chapman Financial Group, Llc | 15.425 | -3,74 | 496 | 8,08 | ||||
| 2025-07-16 | 13F | BOS Asset Management, LLC | 8.232 | 265 | ||||||
| 2025-07-30 | 13F | Strategic Investment Management, Llc | 0 | -100,00 | 0 | |||||
| 2025-08-08 | 13F | Cetera Investment Advisers | 43.242 | 31,16 | 1.390 | 43,45 | ||||
| 2025-05-15 | 13F | Main Management ETF Advisors, LLC | 0 | -100,00 | 0 | |||||
| 2025-08-11 | 13F | Private Advisor Group, LLC | 11.185 | -5,28 | 360 | 3,46 | ||||
| 2025-07-08 | 13F | Boltwood Capital Management | 12.200 | 34,07 | 392 | 46,82 | ||||
| 2025-08-14 | 13F | Coastal Bridge Advisors, LLC | 9.273 | 0,00 | 298 | 9,56 | ||||
| 2025-08-01 | 13F | Y-Intercept (Hong Kong) Ltd | 9.663 | 311 | ||||||
| 2025-08-08 | 13F | Arvest Bank Trust Division | 530.359 | -0,91 | 17.051 | 8,36 | ||||
| 2025-07-11 | 13F | Farther Finance Advisors, LLC | 1.284 | -65,58 | 41 | -62,04 | ||||
| 2025-07-03 | 13F | Arvest Investments, Inc. | 205.030 | -1,99 | 6.592 | 7,17 | ||||
| 2025-08-13 | 13F | Congress Wealth Management LLC / DE / | 321.981 | -1,00 | 10.352 | 8,26 | ||||
| 2025-05-14 | 13F | Bnp Paribas Arbitrage, Sa | 0 | -100,00 | 0 | |||||
| 2025-07-18 | 13F | Truist Financial Corp | 15.965 | -5,36 | 513 | 3,64 | ||||
| 2025-08-13 | 13F | Hsbc Holdings Plc | 15.510 | 499 | ||||||
| 2025-08-14 | 13F | D. E. Shaw & Co., Inc. | 32.437 | 1.043 | ||||||
| 2025-07-28 | 13F | Rainwater Charitable Foundation | 328.743 | 0,00 | 10.569 | 9,35 | ||||
| 2025-08-14 | 13F | Citadel Advisors Llc | 165.020 | 5.305 | ||||||
| 2025-07-31 | 13F | Cambridge Investment Research Advisors, Inc. | 6.358 | -14,42 | 0 | |||||
| 2025-08-26 | 13F/A | Thrivent Financial For Lutherans | 347.380 | -8,15 | 11 | 0,00 |
Other Listings
| MX:FLJP |