Grundlæggende statistik
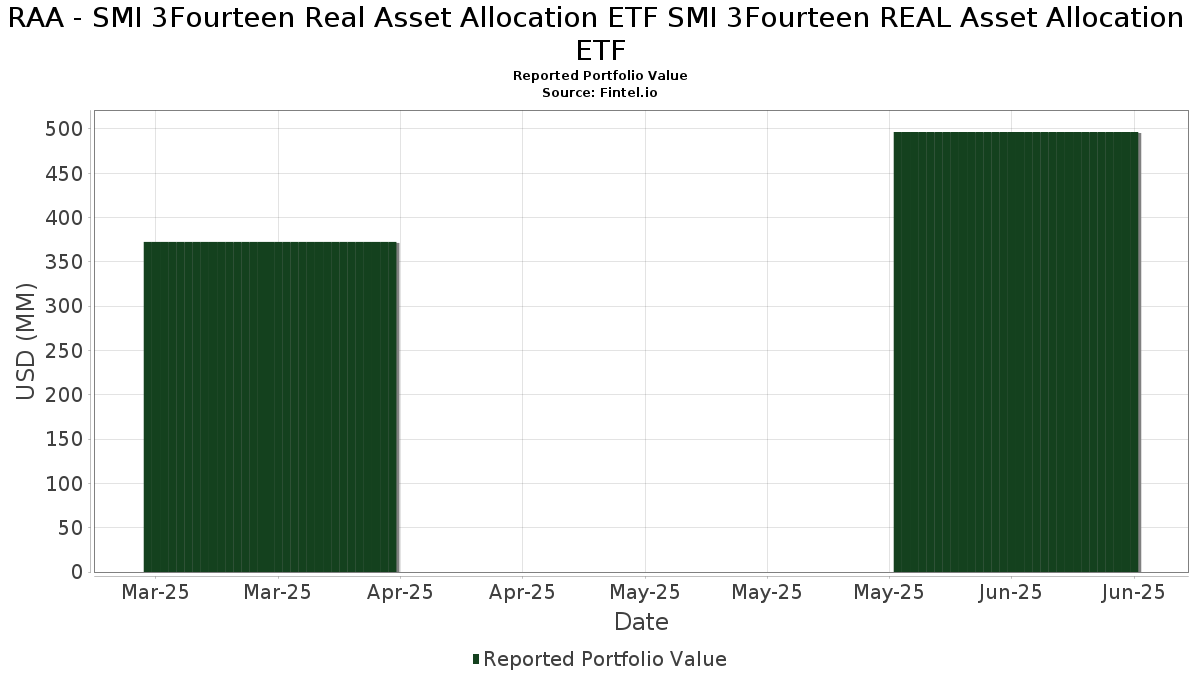
| Porteføljeværdi | $ 496.609.635 |
| Nuværende stillinger | 171 |
Seneste beholdninger, ydeevne, AUM (fra 13F, 13D)
RAA - SMI 3Fourteen Real Asset Allocation ETF SMI 3Fourteen REAL Asset Allocation ETF har afsløret 171 samlede besiddelser i deres seneste SEC-arkivering. Den seneste porteføljeværdi er beregnet til at være $ 496.609.635 USD. Faktiske aktiver under forvaltning (AUM) er denne værdi plus kontanter (som ikke er oplyst). RAA - SMI 3Fourteen Real Asset Allocation ETF SMI 3Fourteen REAL Asset Allocation ETFs største beholdninger er BNY Mellon ETF Trust - BNY Mellon US Large Cap Core Equity ETF (US:BKLC) , Schwab Strategic Trust - Schwab High Yield Bond ETF (US:SCYB) , Invesco Optimum Yield Diversified Commodity Strategy No K-1 ETF (US:PDBC) , Vanguard Scottsdale Funds - Vanguard Intermediate-Term Corporate Bond ETF (US:VCIT) , and iShares Trust - iShares J.P. Morgan USD Emerging Markets Bond ETF (US:EMB) . RAA - SMI 3Fourteen Real Asset Allocation ETF SMI 3Fourteen REAL Asset Allocation ETFs nye stillinger omfatter Franklin Templeton ETF Trust - Franklin FTSE Japan ETF (US:FLJP) , Albemarle Corporation (US:ALB) , Target Corporation (US:TGT) , T. Rowe Price Group, Inc. (US:TROW) , and Shopify Inc. (US:SHOP) .
Top øger dette kvartal
Vi bruger ændringen i porteføljeallokeringen, fordi dette er den mest meningsfulde metrik. Ændringer kan skyldes handler eller ændringer i aktiekurser.
| Sikkerhed | Aktier (MM) |
Værdi (MM$) |
Portefølje % | ΔPortefølje % |
|---|---|---|---|---|
| 2,29 | 29,85 | 5,9907 | 4,9379 | |
| 0,96 | 24,65 | 4,9481 | 2,9129 | |
| 1,85 | 49,10 | 9,8555 | 2,5403 | |
| 0,42 | 14,17 | 2,8448 | 2,2840 | |
| 0,27 | 24,82 | 4,9823 | 2,2662 | |
| 0,15 | 4,89 | 0,9817 | 0,9817 | |
| 0,19 | 9,64 | 1,9350 | 0,8939 | |
| 0,73 | 19,42 | 3,8985 | 0,7507 | |
| 0,02 | 1,09 | 0,2184 | 0,2184 | |
| 0,01 | 1,01 | 0,2020 | 0,2020 |
Top falder i dette kvartal
Vi bruger ændringen i porteføljeallokeringen, fordi dette er den mest meningsfulde metrik. Ændringer kan skyldes handler eller ændringer i aktiekurser.
| Sikkerhed | Aktier (MM) |
Værdi (MM$) |
Portefølje % | ΔPortefølje % |
|---|---|---|---|---|
| 0,31 | 9,87 | 1,9819 | -4,2161 | |
| 0,81 | 95,74 | 19,2178 | -2,1219 | |
| 0,58 | 14,60 | 2,9312 | -1,6024 | |
| 0,00 | 0,00 | -1,5094 | ||
| 0,36 | 29,54 | 5,9294 | -1,3506 | |
| 0,00 | 0,00 | -1,2627 | ||
| 0,03 | 7,14 | 1,4327 | -0,7487 | |
| 0,02 | 5,41 | 1,0852 | -0,3847 | |
| 0,00 | 2,39 | 0,4797 | -0,2409 | |
| 0,02 | 8,54 | 1,7135 | -0,2323 |
13F og Fondsarkivering
Denne formular blev indsendt den 2025-08-29 for rapporteringsperioden 2025-06-30. Klik på linkikonet for at se den fulde transaktionshistorik.
Opgrader for at låse op for premium-data og eksportere til Excel ![]() .
.
| Sikkerhed | Type | Gennemsnitlig aktiekurs | Aktier (MM) |
Δ Aktier (%) |
Δ Aktier (%) |
Værdi ($MM) |
Portefølje (%) |
ΔPortefølje (%) |
|
|---|---|---|---|---|---|---|---|---|---|
| BKLC / BNY Mellon ETF Trust - BNY Mellon US Large Cap Core Equity ETF | 0,81 | 8,01 | 95,74 | 20,32 | 19,2178 | -2,1219 | |||
| SCYB / Schwab Strategic Trust - Schwab High Yield Bond ETF | 1,85 | 77,08 | 49,10 | 80,00 | 9,8555 | 2,5403 | |||
| PDBC / Invesco Optimum Yield Diversified Commodity Strategy No K-1 ETF | 2,29 | 694,61 | 29,85 | 660,38 | 5,9907 | 4,9379 | |||
| VCIT / Vanguard Scottsdale Funds - Vanguard Intermediate-Term Corporate Bond ETF | 0,36 | 7,29 | 29,54 | 8,82 | 5,9294 | -1,3506 | |||
| EMB / iShares Trust - iShares J.P. Morgan USD Emerging Markets Bond ETF | 0,27 | 139,70 | 24,82 | 145,10 | 4,9823 | 2,2662 | |||
| DBMF / Litman Gregory Funds Trust - iMGP DBi Managed Futures Strategy ETF | 0,96 | 218,89 | 24,65 | 224,81 | 4,9481 | 2,9129 | |||
| SCHP / Schwab Strategic Trust - Schwab U.S. TIPS ETF | 0,73 | 66,77 | 19,42 | 65,47 | 3,8985 | 0,7507 | |||
| BTC / Grayscale Bitcoin Mini Trust | 0,31 | 0,46 | 14,93 | 31,46 | 2,9977 | -0,0489 | |||
| PHYS / Sprott Physical Gold Trust | 0,58 | -18,02 | 14,60 | -13,62 | 2,9312 | -1,6024 | |||
| FLEE / Franklin Templeton ETF Trust - Franklin FTSE Europe ETF | 0,42 | 525,75 | 14,17 | 577,76 | 2,8448 | 2,2840 | |||
| VB / Vanguard Index Funds - Vanguard Small-Cap ETF | 0,04 | 29,40 | 10,01 | 38,30 | 2,0102 | 0,0681 | |||
| PICK / iShares, Inc. - iShares MSCI Global Metals & Mining Producers ETF | 0,26 | 22,94 | 9,91 | 28,85 | 1,9895 | -0,0736 | |||
| SCHQ / Schwab Strategic Trust - Schwab Long-Term U.S. Treasury ETF | 0,31 | -56,11 | 9,87 | -57,28 | 1,9819 | -4,2161 | |||
| TBIL / The RBB Fund, Inc. - F/m US Treasury 3 Month Bill ETF | 0,19 | 148,39 | 9,64 | 148,30 | 1,9350 | 0,8939 | |||
| NVDA / NVIDIA Corporation | 0,06 | -10,99 | 9,18 | 29,75 | 1,8435 | -0,0546 | |||
| MSFT / Microsoft Corporation | 0,02 | -11,21 | 8,54 | 17,66 | 1,7135 | -0,2323 | |||
| AAPL / Apple Inc. | 0,03 | -5,00 | 7,14 | -12,26 | 1,4327 | -0,7487 | |||
| AMZN / Amazon.com, Inc. | 0,02 | -14,46 | 5,41 | -1,37 | 1,0852 | -0,3847 | |||
| EMXC / iShares, Inc. - iShares MSCI Emerging Markets ex China ETF | 0,08 | 13,32 | 5,13 | 29,91 | 1,0305 | -0,0295 | |||
| AVGO / Broadcom Inc. | 0,02 | -21,07 | 4,99 | 29,97 | 1,0011 | -0,0281 | |||
| FLJP / Franklin Templeton ETF Trust - Franklin FTSE Japan ETF | 0,15 | 4,89 | 0,9817 | 0,9817 | |||||
| META / Meta Platforms, Inc. | 0,01 | -13,32 | 3,71 | 10,99 | 0,7442 | -0,1515 | |||
| NFLX / Netflix, Inc. | 0,00 | -13,93 | 3,20 | 23,59 | 0,6427 | -0,0520 | |||
| TSLA / Tesla, Inc. | 0,01 | -12,84 | 2,73 | 6,82 | 0,5471 | -0,1371 | |||
| GOOGL / Alphabet Inc. | 0,01 | -12,91 | 2,39 | -0,75 | 0,4804 | -0,1663 | |||
| COST / Costco Wholesale Corporation | 0,00 | -15,03 | 2,39 | -11,06 | 0,4797 | -0,2409 | |||
| GOOG / Alphabet Inc. | 0,01 | -14,71 | 2,27 | -3,16 | 0,4557 | -0,1730 | |||
| PEP / PepsiCo, Inc. | 0,02 | 28,18 | 2,01 | 12,94 | 0,4029 | -0,0740 | |||
| PLTR / Palantir Technologies Inc. | 0,01 | -14,68 | 1,68 | 37,80 | 0,3367 | 0,0103 | |||
| CSCO / Cisco Systems, Inc. | 0,02 | -4,56 | 1,57 | 7,29 | 0,3160 | -0,0775 | |||
| CVX / Chevron Corporation | 0,01 | 105,83 | 1,57 | 76,15 | 0,3145 | 0,0760 | |||
| TMUS / T-Mobile US, Inc. | 0,01 | -7,91 | 1,51 | -17,72 | 0,3040 | -0,1897 | |||
| AMD / Advanced Micro Devices, Inc. | 0,01 | -4,59 | 1,34 | 31,76 | 0,2691 | -0,0037 | |||
| INTU / Intuit Inc. | 0,00 | -2,03 | 1,26 | 25,75 | 0,2520 | -0,0159 | |||
| LIN / Linde plc | 0,00 | -19,07 | 1,24 | -18,47 | 0,2482 | -0,1584 | |||
| O / Realty Income Corporation | 0,02 | -2,14 | 1,12 | -2,86 | 0,2254 | -0,0845 | |||
| ALB / Albemarle Corporation | 0,02 | 1,09 | 0,2184 | 0,2184 | |||||
| TXN / Texas Instruments Incorporated | 0,01 | -14,94 | 1,08 | -1,73 | 0,2168 | -0,0780 | |||
| ISRG / Intuitive Surgical, Inc. | 0,00 | -9,64 | 1,07 | -0,83 | 0,2156 | -0,0750 | |||
| BEN / Franklin Resources, Inc. | 0,04 | 16,06 | 1,06 | 43,98 | 0,2136 | 0,0151 | |||
| ADM / Archer-Daniels-Midland Company | 0,02 | 23,22 | 1,05 | 35,44 | 0,2111 | 0,0029 | |||
| AMCR / Amcor plc | 0,11 | 49,12 | 1,05 | 41,30 | 0,2102 | 0,0114 | |||
| EQT / EQT Corporation | 0,02 | 118,29 | 1,02 | 138,32 | 0,2048 | 0,0900 | |||
| QCOM / QUALCOMM Incorporated | 0,01 | -10,19 | 1,02 | -6,95 | 0,2045 | -0,0889 | |||
| XOM / Exxon Mobil Corporation | 0,01 | 200,83 | 1,02 | 172,92 | 0,2044 | 0,1042 | |||
| SU / Suncor Energy Inc. | 0,03 | 170,07 | 1,01 | 161,30 | 0,2021 | 0,0987 | |||
| TGT / Target Corporation | 0,01 | 1,01 | 0,2020 | 0,2020 | |||||
| SWK / Stanley Black & Decker, Inc. | 0,01 | 69,63 | 1,00 | 49,63 | 0,2016 | 0,0214 | |||
| GD / General Dynamics Corporation | 0,00 | 14,94 | 1,00 | 23,00 | 0,2009 | -0,0174 | |||
| WMB / The Williams Companies, Inc. | 0,02 | 154,14 | 1,00 | 167,56 | 0,2005 | 0,1002 | |||
| TROW / T. Rowe Price Group, Inc. | 0,01 | 0,99 | 0,1996 | 0,1996 | |||||
| CNQ / Canadian Natural Resources Limited | 0,03 | 141,39 | 0,99 | 146,65 | 0,1995 | 0,0912 | |||
| OXY / Occidental Petroleum Corporation | 0,02 | 214,71 | 0,99 | 167,84 | 0,1990 | 0,0997 | |||
| MPC / Marathon Petroleum Corporation | 0,01 | 137,83 | 0,99 | 171,63 | 0,1981 | 0,1005 | |||
| LNG / Cheniere Energy, Inc. | 0,00 | 156,63 | 0,99 | 170,60 | 0,1978 | 0,1000 | |||
| IBM / International Business Machines Corporation | 0,00 | 10,45 | 0,98 | 30,85 | 0,1977 | -0,0040 | |||
| MDT / Medtronic plc | 0,01 | 39,07 | 0,98 | 34,89 | 0,1973 | 0,0019 | |||
| SLB / Schlumberger Limited | 0,03 | 212,45 | 0,98 | 152,84 | 0,1970 | 0,0928 | |||
| ITW / Illinois Tool Works Inc. | 0,00 | 46,95 | 0,97 | 46,46 | 0,1951 | 0,0172 | |||
| CHRW / C.H. Robinson Worldwide, Inc. | 0,01 | 32,97 | 0,96 | 24,67 | 0,1917 | -0,0139 | |||
| ABBV / AbbVie Inc. | 0,01 | 50,16 | 0,95 | 33,05 | 0,1908 | -0,0008 | |||
| ES / Eversource Energy | 0,01 | 17,93 | 0,95 | 20,79 | 0,1901 | -0,0202 | |||
| ADBE / Adobe Inc. | 0,00 | -12,79 | 0,95 | -12,08 | 0,1900 | -0,0986 | |||
| BKNG / Booking Holdings Inc. | 0,00 | -13,98 | 0,93 | 8,18 | 0,1859 | -0,0439 | |||
| GPC / Genuine Parts Company | 0,01 | 22,47 | 0,91 | 24,73 | 0,1834 | -0,0131 | |||
| AMAT / Applied Materials, Inc. | 0,00 | -3,27 | 0,87 | 22,11 | 0,1740 | -0,0165 | |||
| HON / Honeywell International Inc. | 0,00 | -4,37 | 0,84 | 5,26 | 0,1689 | -0,0456 | |||
| SJM / The J. M. Smucker Company | 0,01 | 22,67 | 0,83 | 1,73 | 0,1658 | -0,0519 | |||
| SHOP / Shopify Inc. | 0,01 | 0,82 | 0,1644 | 0,1644 | |||||
| AMGN / Amgen Inc. | 0,00 | -10,91 | 0,81 | -20,22 | 0,1634 | -0,1100 | |||
| MU / Micron Technology, Inc. | 0,01 | -6,23 | 0,79 | 33,00 | 0,1595 | -0,0007 | |||
| GILD / Gilead Sciences, Inc. | 0,01 | -12,82 | 0,79 | -13,79 | 0,1583 | -0,0869 | |||
| CMCSA / Comcast Corporation | 0,02 | -7,98 | 0,76 | -11,06 | 0,1519 | -0,0761 | |||
| LRCX / Lam Research Corporation | 0,01 | -6,62 | 0,74 | 25,17 | 0,1478 | -0,0101 | |||
| PANW / Palo Alto Networks, Inc. | 0,00 | -4,75 | 0,73 | 14,33 | 0,1474 | -0,0250 | |||
| KLAC / KLA Corporation | 0,00 | -9,94 | 0,70 | 18,54 | 0,1401 | -0,0176 | |||
| ADP / Automatic Data Processing, Inc. | 0,00 | -8,11 | 0,68 | -7,26 | 0,1361 | -0,0599 | |||
| ADI / Analog Devices, Inc. | 0,00 | -7,45 | 0,66 | 9,24 | 0,1330 | -0,0297 | |||
| MELI / MercadoLibre, Inc. | 0,00 | -16,04 | 0,64 | 12,43 | 0,1291 | -0,0242 | |||
| PLD / Prologis, Inc. | 0,01 | -31,18 | 0,63 | -35,29 | 0,1263 | -0,1345 | |||
| CRWD / CrowdStrike Holdings, Inc. | 0,00 | -19,33 | 0,63 | 16,51 | 0,1263 | -0,0185 | |||
| VRTX / Vertex Pharmaceuticals Incorporated | 0,00 | -7,53 | 0,61 | -15,12 | 0,1230 | -0,0705 | |||
| APP / AppLovin Corporation | 0,00 | -8,40 | 0,61 | 21,03 | 0,1226 | -0,0127 | |||
| FGXXX / First American Funds Inc - First American Government Obligations Fund Class X | 0,60 | -7,94 | 0,60 | -8,00 | 0,1202 | -0,0542 | |||
| CINF / Cincinnati Financial Corporation | 0,00 | -26,64 | 0,60 | -26,11 | 0,1200 | -0,0967 | |||
| SBUX / Starbucks Corporation | 0,01 | -5,18 | 0,59 | -11,41 | 0,1184 | -0,0602 | |||
| INTC / Intel Corporation | 0,03 | -9,83 | 0,57 | -11,09 | 0,1144 | -0,0574 | |||
| WELL / Welltower Inc. | 0,00 | -34,12 | 0,57 | -33,95 | 0,1142 | -0,1166 | |||
| CEG / Constellation Energy Corporation | 0,00 | -7,94 | 0,56 | 47,26 | 0,1134 | 0,0106 | |||
| DASH / DoorDash, Inc. | 0,00 | -14,87 | 0,53 | 14,85 | 0,1056 | -0,0173 | |||
| MSTR / Strategy Inc | 0,00 | 1,10 | 0,52 | 41,96 | 0,1046 | 0,0060 | |||
| MDLZ / Mondelez International, Inc. | 0,01 | -21,12 | 0,49 | -21,57 | 0,0986 | -0,0694 | |||
| CTAS / Cintas Corporation | 0,00 | -13,28 | 0,48 | -6,02 | 0,0973 | -0,0409 | |||
| FTNT / Fortinet, Inc. | 0,00 | -13,55 | 0,46 | -5,01 | 0,0914 | -0,0372 | |||
| CDNS / Cadence Design Systems, Inc. | 0,00 | -18,67 | 0,45 | -1,55 | 0,0894 | -0,0318 | |||
| SNPS / Synopsys, Inc. | 0,00 | -13,33 | 0,44 | 3,54 | 0,0883 | -0,0256 | |||
| HRL / Hormel Foods Corporation | 0,01 | -46,03 | 0,44 | -47,22 | 0,0876 | -0,1342 | |||
| ORLY / O'Reilly Automotive, Inc. | 0,00 | 1.322,75 | 0,43 | -10,46 | 0,0860 | -0,0423 | |||
| MAR / Marriott International, Inc. | 0,00 | -1,94 | 0,43 | 12,66 | 0,0858 | -0,0161 | |||
| PYPL / PayPal Holdings, Inc. | 0,01 | -16,23 | 0,42 | -4,55 | 0,0843 | -0,0337 | |||
| EQIX / Equinix, Inc. | 0,00 | -46,50 | 0,40 | -47,82 | 0,0794 | -0,1238 | |||
| PDD / PDD Holdings Inc. - Depositary Receipt (Common Stock) | 0,00 | -14,11 | 0,39 | -24,03 | 0,0788 | -0,0598 | |||
| DLR / Digital Realty Trust, Inc. | 0,00 | -30,58 | 0,38 | -15,62 | 0,0760 | -0,0442 | |||
| ASML / ASML Holding N.V. - Depositary Receipt (Common Stock) | 0,00 | -28,00 | 0,36 | -13,04 | 0,0724 | -0,0387 | |||
| ADSK / Autodesk, Inc. | 0,00 | -18,34 | 0,36 | -3,49 | 0,0722 | -0,0277 | |||
| SPG / Simon Property Group, Inc. | 0,00 | -22,28 | 0,35 | -24,95 | 0,0702 | -0,0545 | |||
| CSX / CSX Corporation | 0,01 | -17,81 | 0,35 | -8,95 | 0,0696 | -0,0324 | |||
| MNST / Monster Beverage Corporation | 0,01 | -10,06 | 0,35 | -3,63 | 0,0693 | -0,0269 | |||
| REGN / Regeneron Pharmaceuticals, Inc. | 0,00 | 0,78 | 0,34 | -16,58 | 0,0678 | -0,0408 | |||
| CHTR / Charter Communications, Inc. | 0,00 | 1,25 | 0,33 | 12,24 | 0,0664 | -0,0126 | |||
| ABNB / Airbnb, Inc. | 0,00 | -17,88 | 0,32 | -8,99 | 0,0651 | -0,0305 | |||
| MRVL / Marvell Technology, Inc. | 0,00 | -18,31 | 0,31 | 2,61 | 0,0631 | -0,0190 | |||
| AXON / Axon Enterprise, Inc. | 0,00 | -20,43 | 0,31 | 25,41 | 0,0615 | -0,0041 | |||
| NXPI / NXP Semiconductors N.V. | 0,00 | -11,05 | 0,30 | 2,36 | 0,0610 | -0,0187 | |||
| AEP / American Electric Power Company, Inc. | 0,00 | -7,88 | 0,30 | -12,46 | 0,0606 | -0,0320 | |||
| ROP / Roper Technologies, Inc. | 0,00 | -18,75 | 0,29 | -22,02 | 0,0592 | -0,0420 | |||
| PSA / Public Storage | 0,00 | -31,03 | 0,29 | -32,56 | 0,0588 | -0,0574 | |||
| ED / Consolidated Edison, Inc. | 0,00 | 127,27 | 0,29 | 106,43 | 0,0581 | 0,0205 | |||
| PAYX / Paychex, Inc. | 0,00 | -9,57 | 0,29 | -14,58 | 0,0576 | -0,0327 | |||
| AOS / A. O. Smith Corporation | 0,00 | 0,28 | 0,0556 | 0,0556 | |||||
| PCAR / PACCAR Inc | 0,00 | -7,69 | 0,28 | -9,84 | 0,0552 | -0,0266 | |||
| FAST / Fastenal Company | 0,01 | 77,61 | 0,27 | -3,91 | 0,0544 | -0,0211 | |||
| CPRT / Copart, Inc. | 0,01 | -10,26 | 0,27 | -22,19 | 0,0544 | -0,0390 | |||
| WDAY / Workday, Inc. | 0,00 | -9,76 | 0,27 | -7,22 | 0,0543 | -0,0239 | |||
| ZS / Zscaler, Inc. | 0,00 | -27,29 | 0,25 | 15,28 | 0,0500 | -0,0081 | |||
| VRSK / Verisk Analytics, Inc. | 0,00 | -19,31 | 0,25 | -15,41 | 0,0496 | -0,0289 | |||
| ROST / Ross Stores, Inc. | 0,00 | -17,08 | 0,23 | -17,14 | 0,0466 | -0,0286 | |||
| XEL / Xcel Energy Inc. | 0,00 | -11,19 | 0,22 | -14,45 | 0,0440 | -0,0248 | |||
| IDXX / IDEXX Laboratories, Inc. | 0,00 | -19,07 | 0,21 | 2,90 | 0,0430 | -0,0126 | |||
| VICI / VICI Properties Inc. | 0,01 | -30,47 | 0,21 | -30,36 | 0,0424 | -0,0391 | |||
| INVH / Invitation Homes Inc. | 0,01 | 15,10 | 0,21 | 8,76 | 0,0424 | -0,0099 | |||
| AVB / AvalonBay Communities, Inc. | 0,00 | -23,05 | 0,20 | -27,14 | 0,0394 | -0,0328 | |||
| KDP / Keurig Dr Pepper Inc. | 0,01 | -38,06 | 0,19 | -40,38 | 0,0381 | -0,0470 | |||
| EXR / Extra Space Storage Inc. | 0,00 | -31,68 | 0,19 | -32,37 | 0,0379 | -0,0368 | |||
| BKR / Baker Hughes Company | 0,00 | -29,26 | 0,18 | -38,18 | 0,0368 | -0,0429 | |||
| TEAM / Atlassian Corporation | 0,00 | -0,11 | 0,18 | -4,19 | 0,0368 | -0,0146 | |||
| VTR / Ventas, Inc. | 0,00 | -22,68 | 0,18 | -29,30 | 0,0365 | -0,0322 | |||
| CCEP / COCA COLA EUROPACIFIC COMPANY GUAR REGS 11/27 1.5 | 0,00 | -36,10 | 0,18 | -31,80 | 0,0358 | -0,0344 | |||
| EXC / Exelon Corporation | 0,00 | -34,91 | 0,18 | -38,68 | 0,0354 | -0,0417 | |||
| IRM / Iron Mountain Incorporated | 0,00 | -34,39 | 0,17 | -21,46 | 0,0345 | -0,0244 | |||
| FANG / Diamondback Energy, Inc. | 0,00 | -31,45 | 0,17 | -40,99 | 0,0335 | -0,0425 | |||
| EA / Electronic Arts Inc. | 0,00 | -36,26 | 0,17 | -29,79 | 0,0332 | -0,0298 | |||
| ARE / Alexandria Real Estate Equities, Inc. | 0,00 | 74,66 | 0,16 | 36,75 | 0,0323 | 0,0008 | |||
| DDOG / Datadog, Inc. | 0,00 | -38,71 | 0,16 | -16,93 | 0,0315 | -0,0192 | |||
| MCHP / Microchip Technology Incorporated | 0,00 | -29,30 | 0,16 | 2,65 | 0,0312 | -0,0094 | |||
| AZN / AstraZeneca PLC - Depositary Receipt (Common Stock) | 0,00 | -41,23 | 0,15 | -44,16 | 0,0307 | -0,0428 | |||
| CTSH / Cognizant Technology Solutions Corporation | 0,00 | -38,79 | 0,15 | -37,76 | 0,0302 | -0,0345 | |||
| ODFL / Old Dominion Freight Line, Inc. | 0,00 | -30,69 | 0,14 | -32,08 | 0,0290 | -0,0280 | |||
| GEHC / GE HealthCare Technologies Inc. | 0,00 | -35,04 | 0,14 | -40,66 | 0,0289 | -0,0358 | |||
| TTWO / Take-Two Interactive Software, Inc. | 0,00 | -38,27 | 0,14 | -27,78 | 0,0289 | -0,0244 | |||
| EQR / Equity Residential | 0,00 | -41,39 | 0,14 | -44,96 | 0,0286 | -0,0406 | |||
| WBD / Warner Bros. Discovery, Inc. | 0,01 | -23,66 | 0,14 | -18,45 | 0,0276 | -0,0176 | |||
| TTD / The Trade Desk, Inc. | 0,00 | -39,95 | 0,13 | -21,21 | 0,0262 | -0,0181 | |||
| CSGP / CoStar Group, Inc. | 0,00 | -35,85 | 0,13 | -35,03 | 0,0259 | -0,0272 | |||
| DXCM / DexCom, Inc. | 0,00 | -42,62 | 0,12 | -27,11 | 0,0245 | -0,0201 | |||
| KHC / The Kraft Heinz Company | 0,00 | -41,10 | 0,12 | -50,21 | 0,0244 | -0,0409 | |||
| MCD / McDonald's Corporation | 0,00 | -13,87 | 0,11 | -19,42 | 0,0226 | -0,0149 | |||
| ARM / Arm Holdings plc - Depositary Receipt (Common Stock) | 0,00 | -2,98 | 0,11 | 47,89 | 0,0212 | 0,0019 | |||
| DOC / Healthpeak Properties, Inc. | 0,01 | 0,10 | 0,0203 | 0,0203 | |||||
| UDR / UDR, Inc. | 0,00 | -22,80 | 0,10 | -30,50 | 0,0199 | -0,0182 | |||
| LULU / lululemon athletica inc. | 0,00 | -37,19 | 0,10 | -47,54 | 0,0194 | -0,0298 | |||
| ON / ON Semiconductor Corporation | 0,00 | -27,37 | 0,10 | -6,86 | 0,0192 | -0,0082 | |||
| ANSS / ANSYS, Inc. | 0,00 | -48,78 | 0,09 | -43,23 | 0,0177 | -0,0239 | |||
| GFS / GLOBALFOUNDRIES Inc. | 0,00 | -29,62 | 0,08 | -27,59 | 0,0170 | -0,0142 | |||
| SUI / Sun Communities, Inc. | 0,00 | -42,99 | 0,08 | -44,29 | 0,0158 | -0,0218 | |||
| ESS / Essex Property Trust, Inc. | 0,00 | -48,12 | 0,08 | -52,15 | 0,0157 | -0,0280 | |||
| MAA / Mid-America Apartment Communities, Inc. | 0,00 | -50,46 | 0,07 | -56,10 | 0,0145 | -0,0297 | |||
| CDW / CDW Corporation | 0,00 | -38,41 | 0,07 | -32,04 | 0,0142 | -0,0134 | |||
| BIIB / Biogen Inc. | 0,00 | -45,74 | 0,06 | -50,41 | 0,0124 | -0,0208 | |||
| KMB / Kimberly-Clark Corporation | 0,00 | 0,00 | 0,0002 | 0,0002 | |||||
| NEE / NextEra Energy, Inc. | 0,00 | 0,00 | 0,0001 | 0,0001 | |||||
| KVUE / Kenvue Inc. | 0,00 | -100,00 | 0,00 | -100,00 | -0,2109 | ||||
| KIM / Kimco Realty Corporation | 0,00 | -100,00 | 0,00 | -100,00 | -0,0389 | ||||
| VGK / Vanguard International Equity Index Funds - Vanguard FTSE Europe ETF | 0,00 | -100,00 | 0,00 | -100,00 | -1,5094 | ||||
| PPG / PPG Industries, Inc. | 0,00 | -100,00 | 0,00 | -100,00 | -0,1996 | ||||
| AFL / Aflac Incorporated | 0,00 | -100,00 | 0,00 | -100,00 | -0,1303 | ||||
| SIHY / Harbor ETF Trust - Harbor Scientific Alpha High-Yield ETF | 0,00 | -100,00 | 0,00 | -100,00 | -1,2627 |