Grundlæggende statistik
| Institutionelle ejere | 242 total, 241 long only, 0 short only, 1 long/short - change of 22,84% MRQ |
| Gennemsnitlig porteføljeallokering | 0.5872 % - change of -13,71% MRQ |
| Institutionelle aktier (lange) | 58.634.661 (ex 13D/G) - change of 16,59MM shares 39,45% MRQ |
| Institutionel værdi (lang) | $ 1.613.159 USD ($1000) |
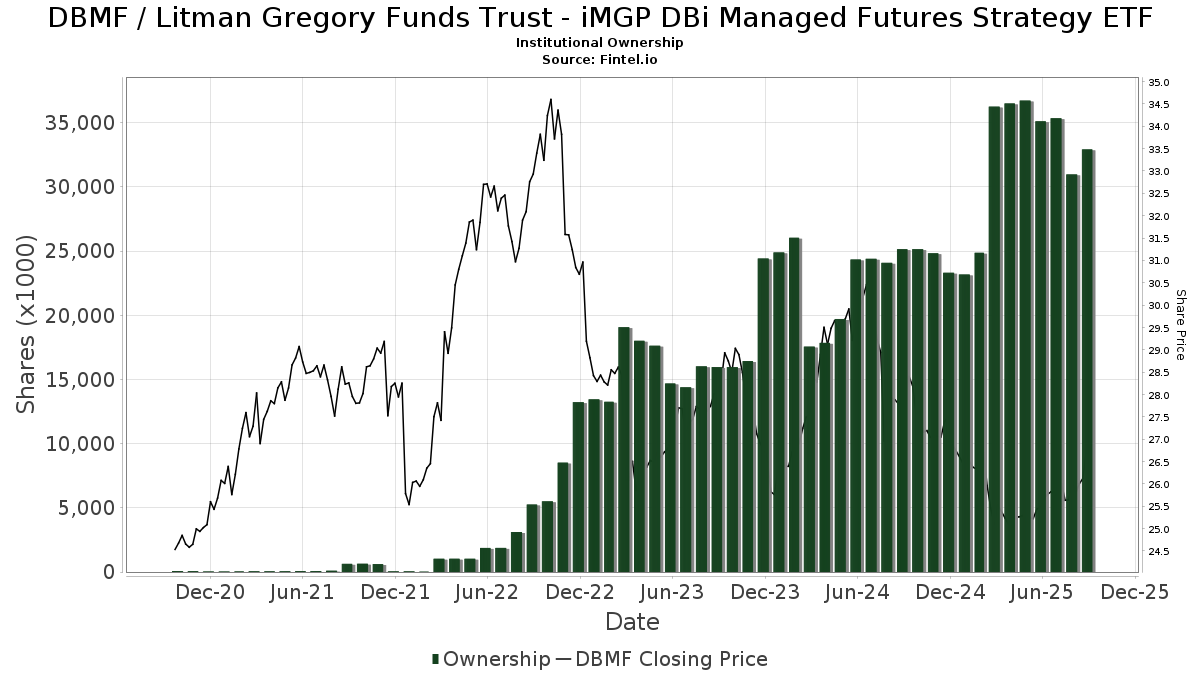
Institutionelt ejerskab og aktionærer
Litman Gregory Funds Trust - iMGP DBi Managed Futures Strategy ETF (US:DBMF) har 242 institutionelle ejere og aktionærer, der har indsendt 13D/G- eller 13F-formularer til Securities Exchange Commission (SEC). Disse institutioner har i alt 58,634,661 aktier. Største aktionærer omfatter Morgan Stanley, Jpmorgan Chase & Co, LPL Financial LLC, Tiaa Trust, National Association, Northwestern Mutual Wealth Management Co, Toroso Investments, LLC, Parcion Private Wealth LLC, Raymond James Financial Inc, Cardinal Point Capital Management, ULC, and Litman Gregory Asset Management LLC .
Litman Gregory Funds Trust - iMGP DBi Managed Futures Strategy ETF (ARCA:DBMF) institutionel ejerskabsstruktur viser aktuelle positioner i virksomheden efter institutioner og fonde, samt seneste ændringer i positionsstørrelse. Større aktionærer kan omfatte individuelle investorer, investeringsforeninger, hedgefonde eller institutioner. Skema 13D angiver, at investoren besidder (eller besidder) mere end 5 % af virksomheden og har til hensigt (eller har til hensigt at) aktivt at forfølge en ændring i forretningsstrategi. Skema 13G indikerer en passiv investering på over 5%.
The share price as of March 13, 2026 is 30,66 / share. Previously, on March 17, 2025, the share price was 25,45 / share. This represents an increase of 20,47% over that period.
Fondens stemningsscore
Fund Sentiment Score (fka Ownership Accumulation Score) finder de aktier, der bliver mest købt af fonde. Det er resultatet af en sofistikeret, multi-faktor kvantitativ model, der identificerer virksomheder med de højeste niveauer af institutionel akkumulering. Scoringsmodellen bruger en kombination af den samlede stigning i oplyste ejere, ændringerne i porteføljeallokeringer i disse ejere og andre målinger. Tallet går fra 0 til 100, hvor højere tal indikerer et højere niveau af akkumulering for sine jævnaldrende, og 50 er gennemsnittet.
Opdateringsfrekvens: Dagligt
Se Ownership Explorer, som giver en liste over højest rangerende virksomheder.
AI+ Ask Fintel’s AI assistant about Litman Gregory Funds Trust - iMGP DBi Managed Futures Strategy ETF.
Select a question to share a public post with an AI-crafted answer.
Thinking of good questions…
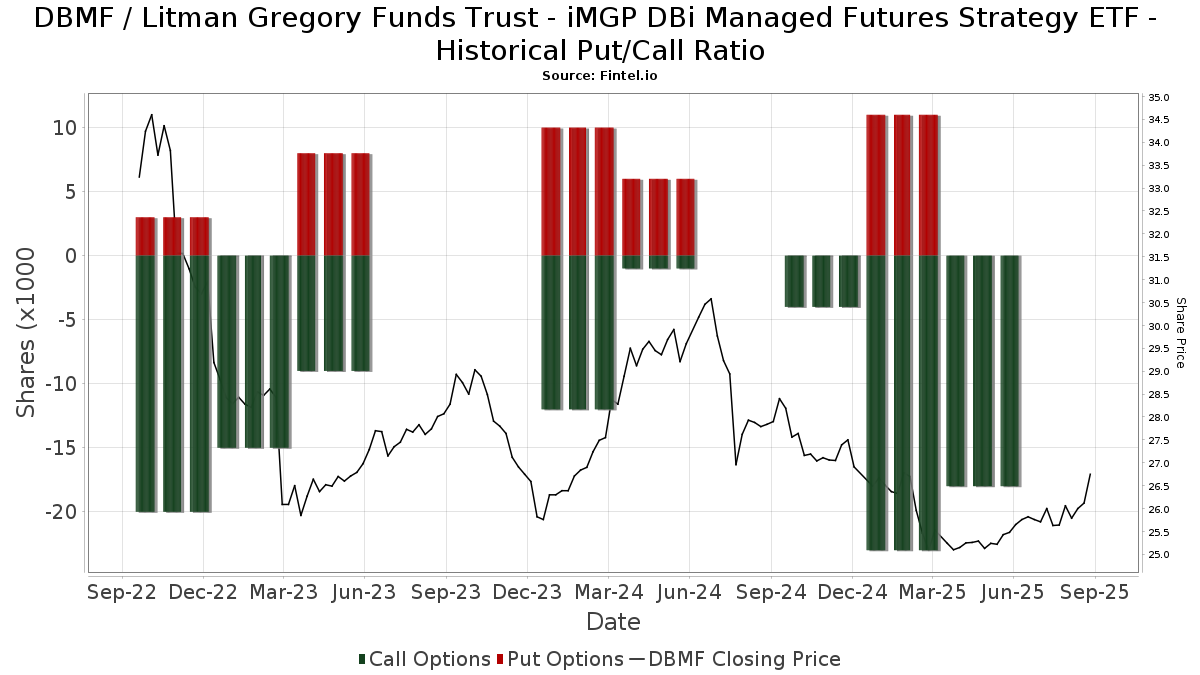
Institutionel Put/Call-forhold
Ud over at indberette standardaktie- og gældsudstedelser skal institutter med mere end 100 mill. aktiver under forvaltning også oplyse deres put- og call-optionsbeholdninger. Da salgsoptioner generelt indikerer negativ stemning, og købsoptioner indikerer positiv stemning, kan vi få en fornemmelse af den overordnede institutionelle stemning ved at plotte forholdet mellem put og kald. Diagrammet til højre viser det historiske put/call-forhold for dette instrument.
Brug af Put/Call Ratio som en indikator for investorernes stemning overvinder en af de vigtigste mangler ved at bruge totalt institutionelt ejerskab, som er, at en betydelig mængde af aktiver under forvaltning investeres passivt for at spore indekser. Passivt forvaltede fonde køber typisk ikke optioner, så indikatoren for put/call-forholdet følger mere nøje følelsen af aktivt forvaltede fonde.
13F og NPORT arkivering
Detaljer om 13F-arkivering er gratis. Detaljer om NP-ansøgninger kræver et premium-medlemskab. Grønne rækker angiver nye positioner. Røde rækker angiver lukkede positioner. Klik på linket ikon for at se den fulde transaktionshistorik.
Opgrader
for at låse premium-data op og eksportere til Excel ![]() .
.
| Fil dato | Kilde | Investor | Type | Gennemsnitlig pris (Øst) |
Aktier | Δ Aktier (%) |
Rapporteret Værdi ($1000) |
Δ Værdi (%) |
Port Alloc (%) |
|
|---|---|---|---|---|---|---|---|---|---|---|
| 2026-01-30 | 13F | Simplicity Wealth,LLC | 30.738 | 39,99 | 862 | 43,91 | ||||
| 2026-02-13 | 13F | Ausdal Financial Partners, Inc. | 30.218 | -1,53 | 848 | 1,07 | ||||
| 2026-02-17 | 13F | GeoWealth Management, LLC | 10.768 | -12,45 | 302 | -9,85 | ||||
| 2026-02-10 | 13F/A | Northwestern Mutual Wealth Management Co | 2.167.671 | 10,07 | 60.825 | 13,10 | ||||
| 2026-01-14 | 13F | Verum Partners LLC | 10.667 | -5,50 | 299 | -2,92 | ||||
| 2026-01-29 | 13F | Quest 10 Wealth Builders, Inc. | 569 | 0,00 | 16 | 0,00 | ||||
| 2026-01-23 | 13F | Galvin, Gaustad & Stein, LLC | 58.914 | 1.653 | ||||||
| 2026-02-17 | 13F | Jones Financial Companies Lllp | 138 | 4 | ||||||
| 2026-01-26 | 13F | Private Trust Co Na | 11.103 | 32,73 | 312 | 36,40 | ||||
| 2026-01-28 | 13F | Leelyn Smith, LLC | 257.482 | -2,21 | 7.225 | 0,47 | ||||
| 2026-02-04 | 13F | Meridian Wealth Management, LLC | 13.477 | 42,98 | 378 | 47,08 | ||||
| 2025-09-25 | NP | FARX - Frontier Asset Absolute Return ETF | 27.384 | 1,36 | 701 | 2,79 | ||||
| 2026-02-13 | 13F | Citigroup Inc | 6.803 | 12,86 | 191 | 15,85 | ||||
| 2026-02-10 | 13F | Advisor Resource Council | 11.219 | 326 | ||||||
| 2025-10-10 | 13F | Castleview Partners, Llc | 0 | -100,00 | 0 | |||||
| 2026-02-12 | 13F | Brinker Capital Investments, LLC | 19.083 | 5,13 | 535 | 8,08 | ||||
| 2026-02-10 | 13F | Principia Wealth Advisory, LLC | 148.138 | 15,07 | 4.157 | 18,24 | ||||
| 2026-02-13 | 13F | Change Path, LLC | 11.495 | -4,66 | 323 | -2,13 | ||||
| 2026-02-12 | 13F | Proficio Capital Partners LLC | 11.786 | 331 | ||||||
| 2026-02-06 | 13F | Copia Wealth Management | 190 | 5 | ||||||
| 2026-01-05 | 13F | City Center Advisors, LLC | 29.712 | 21,14 | 834 | 24,51 | ||||
| 2025-11-12 | 13F | Transce3nd, LLC | 0 | -100,00 | 0 | |||||
| 2026-01-20 | 13F | Steel Peak Wealth Management LLC | 9.254 | 260 | ||||||
| 2026-02-17 | 13F | Creative Planning | 23.220 | 33,23 | 652 | 37,05 | ||||
| 2025-12-09 | 13F | Painted Porch Advisors LLC | 100 | 3 | ||||||
| 2026-01-30 | 13F | Smart Portfolios, LLC | 50.709 | 37,13 | 1.423 | 40,93 | ||||
| 2026-02-06 | 13F | Axxcess Wealth Management, Llc | 870.474 | 107,03 | 24.425 | 112,72 | ||||
| 2026-01-29 | 13F | Live Oak Investment Partners | 138.022 | 4,81 | 3.873 | 7,68 | ||||
| 2026-02-17 | 13F | Torno Capital, Llc | Put | 35.000 | 982 | |||||
| 2025-11-12 | 13F | Creekmur Asset Management LLC | 428 | 0,47 | 12 | 10,00 | ||||
| 2026-02-17 | 13F | Torno Capital, Llc | 15.000 | 421 | ||||||
| 2025-10-22 | 13F | Family Investment Center, Inc. | 0 | -100,00 | 0 | |||||
| 2026-02-13 | 13F | Potomac Fund Management Inc /adv | 859.178 | 4,55 | 24.109 | 7,42 | ||||
| 2026-02-13 | 13F | Evelyn Partners Asset Management Ltd | 302.180 | -16,62 | 8.479 | -14,33 | ||||
| 2026-01-21 | 13F | Stonebridge Financial Group, LLC | 71.817 | 20,52 | 2.015 | 23,85 | ||||
| 2025-09-24 | NP | TNMAX - 1290 Multi-Alternative Strategies Fund Class A | 93.600 | 5,30 | 2.397 | 6,77 | ||||
| 2026-01-26 | 13F | Merit Financial Group, LLC | 293.747 | 175,52 | 8.243 | 183,13 | ||||
| 2026-02-13 | 13F | Toroso Investments, LLC | 1.620.248 | 130,45 | 45.464 | 136,79 | ||||
| 2026-02-17 | 13F | Scarborough Advisors, LLC | 345.677 | 3,32 | 9.700 | 6,15 | ||||
| 2026-02-17 | 13F | Wiley Bros.-aintree Capital, Llc | 10.283 | -1,59 | 289 | 1,77 | ||||
| 2026-01-14 | 13F | Wealthcare Advisory Partners LLC | 12.116 | 2,07 | 340 | 4,63 | ||||
| 2026-01-23 | 13F | R. W. Roge & Company, Inc. | 55.325 | -9,05 | 2 | 0,00 | ||||
| 2026-02-13 | 13F | Fairman Group, LLC | 89.205 | 7,00 | 2.503 | 9,97 | ||||
| 2026-01-16 | 13F | Ronald Blue Trust, Inc. | 50 | 0,00 | 1 | 0,00 | ||||
| 2026-02-11 | 13F | Tiaa Trust, National Association | 3.121.070 | 87.820 | ||||||
| 2026-02-17 | 13F | Strive Financial Group ,LLC | 10.235 | 287 | ||||||
| 2026-01-23 | 13F | Octavia Wealth Advisors, LLC | 7.591 | 213 | ||||||
| 2026-02-17 | 13F | Advisor Group Holdings, Inc. | 27.513 | 29,42 | 772 | 35,92 | ||||
| 2026-02-05 | 13F | Atria Investments Llc | 119.401 | 6,17 | 3.350 | 9,08 | ||||
| 2026-02-06 | 13F | Trajan Wealth LLC | 17.499 | -13,35 | 491 | -10,89 | ||||
| 2026-01-26 | 13F | Greenwood Capital Associates Llc | 35.504 | 36,02 | 996 | 39,89 | ||||
| 2026-01-07 | 13F | Lake Street Financial Llc | 10.157 | -8,13 | 285 | -5,32 | ||||
| 2026-02-17 | 13F | Citadel Advisors Llc | 0 | -100,00 | 0 | |||||
| 2026-02-17 | 13F | Hyundai Investments Co., Ltd. | 17.018 | 479 | ||||||
| 2026-01-26 | 13F | Valmark Advisers, Inc. | 470.247 | -0,82 | 13.195 | 1,90 | ||||
| 2026-02-10 | 13F | West Chester Capital Advisors, Inc | 46.834 | -41,07 | 1.314 | -39,45 | ||||
| 2026-01-16 | 13F | Perigon Wealth Management, LLC | 8.470 | 0,00 | 238 | 2,60 | ||||
| 2026-01-30 | 13F | Ares Financial Consulting, LLC | 34.670 | 973 | ||||||
| 2026-02-12 | 13F | Kovack Advisors, Inc. | 40.398 | 115 | ||||||
| 2026-02-17 | 13F | Hilltop Holdings Inc. | 72.770 | -2,27 | 2.042 | 0,39 | ||||
| 2026-01-27 | 13F | Rainey & Randall Investment Management Inc. | 68.213 | 0,17 | 1.914 | 2,96 | ||||
| 2026-01-23 | 13F | Beacon Harbor Wealth Advisors, Inc. | 437.012 | 12.263 | ||||||
| 2026-02-13 | 13F | Manufacturers Life Insurance Company, The | 0 | -100,00 | 0 | |||||
| 2026-02-18 | 13F | Alpha Capital Advisors Inc /adv | 49.585 | 1.429 | ||||||
| 2026-01-28 | 13F | Legacy Capital Group California, Inc. | 43.758 | -3,75 | 1.228 | -1,13 | ||||
| 2025-11-06 | 13F | Financial Advocates Investment Management | 0 | -100,00 | 0 | |||||
| 2026-02-27 | 13F | Arwa Llc | 28.845 | 809 | ||||||
| 2026-02-17 | 13F | Advisory Services Network, LLC | 0 | -100,00 | 0 | |||||
| 2026-01-22 | 13F | Good Steward Wealth Advisors,LLC | 81.615 | 378,79 | 2.290 | 392,47 | ||||
| 2026-02-11 | 13F | Cerity Partners LLC | 7.940 | -71,70 | 223 | -71,02 | ||||
| 2026-01-15 | 13F | ALM First Financial Advisors, LLC | 472.305 | 0,00 | 13.253 | 2,74 | ||||
| 2026-01-29 | 13F | LFA - Lugano Financial Advisors SA | 3.033 | 50,15 | 85 | 54,55 | ||||
| 2026-02-17 | 13F | Citadel Advisors Llc | Call | 28.700 | 175,96 | 805 | 183,45 | |||
| 2026-01-26 | 13F | AE Wealth Management LLC | 36.136 | 13,86 | 1.014 | 16,97 | ||||
| 2026-01-16 | 13F | Legacy Capital Wealth Partners, LLC | 7.706 | 216 | ||||||
| 2026-02-17 | 13F | Equitable Holdings, Inc. | 210.496 | 14,68 | 5.907 | 17,84 | ||||
| 2026-02-12 | 13F | Litman Gregory Asset Management LLC | 1.114.037 | -3,61 | 31.260 | -0,97 | ||||
| 2026-01-15 | 13F | Lighthouse Wealth Management Inc. | 12.656 | 355 | ||||||
| 2026-02-17 | 13F | Cetera Investment Advisers | 246.435 | 14,95 | 6.915 | 18,09 | ||||
| 2026-02-17 | 13F | Snowden Capital Advisors LLC | 13.026 | 366 | ||||||
| 2025-10-20 | 13F | Northwest Capital Management Inc | 0 | -100,00 | 0 | |||||
| 2026-02-05 | 13F | Cardinal Point Capital Management, ULC | 1.164.616 | 3,70 | 32.679 | 4,04 | ||||
| 2026-02-12 | 13F | CIBC Private Wealth Group, LLC | 30 | -95,88 | 1 | -100,00 | ||||
| 2026-02-03 | 13F | Manning & Napier Advisors Llc | 72.270 | 445,93 | 2.034 | 463,16 | ||||
| 2026-02-03 | 13F | Sound Financial Strategies Group, LLC | 75.842 | 22,59 | 2.128 | 25,99 | ||||
| 2026-01-07 | 13F | Innova Wealth Partners | 428.563 | 1.178,68 | 12.025 | 1.214,21 | ||||
| 2026-02-11 | 13F | Omnitrust Wealth Management, Inc | 11.921 | 335 | ||||||
| 2026-01-28 | 13F | Deane Retirement Strategies, Inc. | 216.508 | 0,46 | 6.075 | 3,23 | ||||
| 2026-02-09 | 13F | Hartland & Co., LLC | 165 | -34,78 | 5 | -33,33 | ||||
| 2026-01-15 | 13F | Professional Financial Advisors, LLC | 200.182 | 3,96 | 5.617 | 6,83 | ||||
| 2025-11-05 | 13F | Burt Wealth Advisors | 0 | -100,00 | 0 | |||||
| 2026-01-26 | 13F | Abbington Investment Group | 33.803 | 0,12 | 949 | 2,82 | ||||
| 2026-02-09 | 13F | Harbour Investments, Inc. | 1.759 | -81,55 | 49 | -81,15 | ||||
| 2026-02-11 | 13F | Simplex Trading, Llc | 463 | 13 | ||||||
| 2025-11-05 | 13F | Bessemer Group Inc | 0 | -100,00 | 0 | |||||
| 2026-02-17 | 13F | Capitolis Liquid Global Markets LLC | 0 | -100,00 | 0 | |||||
| 2026-02-06 | 13F | IFP Advisors, Inc | 0 | -100,00 | 0 | -100,00 | ||||
| 2026-01-20 | 13F | Aspiriant, Llc | 130.604 | 3.665 | ||||||
| 2026-02-12 | 13F | Penserra Capital Management LLC | 531.851 | 15 | ||||||
| 2026-02-12 | 13F | Commonwealth Equity Services, Llc | 548.434 | 4,19 | 15.389 | 109.821,43 | ||||
| 2026-02-12 | 13F | Wedbush Securities Inc | 19.071 | -3,89 | 1 | |||||
| 2026-02-11 | 13F | Vise Technologies, Inc. | 16.349 | 459 | ||||||
| 2026-02-13 | 13F | Blueprint Financial Advisors LLC | 26.539 | -11,63 | 745 | -9,27 | ||||
| 2026-02-17 | 13F | Royal Bank Of Canada | 759.975 | 240,83 | 21.325 | 250,22 | ||||
| 2026-02-02 | 13F | Ashton Thomas Securities, Llc | 270.686 | 3,40 | 7.595 | 6,21 | ||||
| 2026-02-09 | 13F | Frazier Financial Advisors, LLC | 13.200 | 370 | ||||||
| 2026-02-17 | 13F | WFA of San Diego, LLC | 0 | -100,00 | 0 | |||||
| 2026-01-22 | 13F | Trilogy Capital Inc. | 25.246 | 6,70 | 708 | 9,60 | ||||
| 2026-02-19 | 13F | First Growth Capital LLC | 31.944 | 978 | ||||||
| 2026-02-17 | 13F | Two Sigma Securities, Llc | 8.714 | 245 | ||||||
| 2026-01-15 | 13F | Columbus Macro, LLC | 42.260 | 2,86 | 1.186 | 5,71 | ||||
| 2026-01-29 | 13F | UBS Group AG | 7.796 | 29,93 | 219 | 33,74 | ||||
| 2026-02-13 | 13F | SRS Capital Advisors, Inc. | 513 | 4,06 | 14 | 7,69 | ||||
| 2026-02-05 | 13F | Guardian Capital, LLC | 17.520 | 492 | ||||||
| 2026-02-17 | 13F | Bank Of America Corp /de/ | 209.575 | 117,09 | 5.881 | 123,07 | ||||
| 2026-01-16 | 13F | RHS Financial, LLC | 50.388 | -6,95 | 1.414 | -4,40 | ||||
| 2026-02-05 | 13F | New York Life Investment Management Llc | 570.325 | -0,79 | 16.003 | 1,93 | ||||
| 2025-09-25 | NP | ASTIX - Astor Dynamic Allocation Fund Class I shares | 77.299 | -2,60 | 1.980 | -1,25 | ||||
| 2026-01-14 | 13F | ORG Wealth Partners, LLC | 26.672 | -1,86 | 748 | 0,81 | ||||
| 2026-01-29 | 13F | Comerica Bank | 36.369 | -13,67 | 1.021 | -11,30 | ||||
| 2026-02-13 | 13F | Retirement Financial Solutions, Llc | 26.136 | 15,84 | 733 | 18,99 | ||||
| 2026-02-13 | 13F | Morgan Stanley | 7.845.100 | 1,95 | 220.134 | 4,75 | ||||
| 2026-02-18 | 13F | Beacon Pointe Advisors, LLC | 8.415 | 236 | ||||||
| 2026-01-28 | 13F | Salomon & Ludwin, LLC | 637 | 18 | ||||||
| 2026-02-12 | 13F | Steward Partners Investment Advisory, Llc | 16.959 | 15,97 | 476 | 19,05 | ||||
| 2026-01-08 | 13F | Fermata Advisors, LLC | 179.200 | 33,90 | 5.028 | 37,60 | ||||
| 2026-02-13 | 13F | Evelyn Partners Investment Management LLP | 6.250 | 0,00 | 175 | 2,94 | ||||
| 2026-02-05 | 13F | Elyxium Wealth, LLC | 137.007 | 47,34 | 3.844 | 51,40 | ||||
| 2026-02-17 | 13F | Aqr Capital Management Llc | 20.408 | -5,00 | 573 | -2,39 | ||||
| 2026-01-20 | 13F | Signaturefd, Llc | 874 | -6,82 | 25 | -4,00 | ||||
| 2026-02-02 | 13F | Summit Wealth & Retirement Planning, Inc. | 599.282 | 1,65 | 16.816 | 4,43 | ||||
| 2025-11-14 | 13F | L2 Asset Management, LLC | 0 | -100,00 | 0 | |||||
| 2026-02-12 | 13F | Renaissance Technologies Llc | 88.300 | 6,51 | 2.478 | 9,46 | ||||
| 2026-01-07 | 13F | Aventura Private Wealth, LLC | 0 | -100,00 | 0 | |||||
| 2026-01-23 | 13F | Hudson Oak Wealth Advisory LLC | 16.332 | 458 | ||||||
| 2026-02-13 | 13F | Entrewealth, Llc | 130.465 | 11,07 | 3.935 | 22,67 | ||||
| 2026-01-27 | 13F | Able Wealth Management LLC | 7.506 | 211 | ||||||
| 2026-01-21 | 13F | Flagship Harbor Advisors, Llc | 33 | 1 | ||||||
| 2026-02-20 | 13F | Sunbelt Securities, Inc. | 64 | 0,00 | 2 | 0,00 | ||||
| 2026-02-06 | 13F | Lloyd Advisory Services, LLC. | 3.087 | 87 | ||||||
| 2026-02-17 | 13F | Integrated Advisors Network LLC | 10.248 | 2,11 | 288 | 4,74 | ||||
| 2026-01-28 | 13F | Sage Private Wealth Group, Llc | 494.071 | 2,06 | 13.864 | 4,86 | ||||
| 2026-02-13 | 13F | Kestra Advisory Services, LLC | 0 | -100,00 | 0 | |||||
| 2025-11-14 | 13F | Flow Traders U.s. Llc | 0 | -100,00 | 0 | |||||
| 2026-01-12 | 13F | Mkd Wealth Coaches, Llc | 91.904 | -2,22 | 2.579 | 0,47 | ||||
| 2026-02-06 | 13F | Pnc Financial Services Group, Inc. | 66 | 2 | ||||||
| 2026-02-12 | 13F | Bank Of Montreal /can/ | 23.264 | -0,70 | 653 | 2,03 | ||||
| 2026-01-29 | 13F | Sanctuary Advisors, LLC | 97.357 | 27,94 | 2.732 | 31,42 | ||||
| 2026-02-11 | 13F | Howard Bailey Securities, Llc | 10.871 | -84,79 | 305 | -84,37 | ||||
| 2026-01-15 | 13F | Rockland Trust Co | 606.018 | 27,33 | 17.005 | 30,82 | ||||
| 2026-01-28 | 13F | N.E.W. Advisory Services LLC | 32 | 0,00 | 1 | |||||
| 2026-01-14 | 13F | Exchange Traded Concepts, Llc | 27.384 | 0,00 | 768 | 2,81 | ||||
| 2026-02-17 | 13F | Perennial Investment Advisors, LLC | 75.945 | 52,30 | 2.131 | 56,58 | ||||
| 2026-02-04 | 13F | Frontier Asset Management, LLC | 22.446 | -64,58 | 630 | -63,64 | ||||
| 2026-02-13 | 13F | Aptus Capital Advisors, LLC | 634 | 18 | ||||||
| 2026-01-13 | 13F | FMA Wealth Management, LLC | 247.483 | 6.944 | ||||||
| 2026-02-04 | 13F | Nwam Llc | 31.798 | -0,64 | 932 | 1,42 | ||||
| 2025-11-14 | 13F | Strategic Wealth Partners, Ltd. | 21.104 | 576 | ||||||
| 2026-02-17 | 13F | Sky-mountain Capital Management, Inc. | 99.897 | 2.927 | ||||||
| 2025-11-14 | 13F | Susquehanna International Group, Llp | 0 | -100,00 | 0 | |||||
| 2026-02-09 | 13F | Firestone Capital Management | 7.623 | 214 | ||||||
| 2026-02-17 | 13F | Private Advisor Group, LLC | 435.523 | 0,65 | 12.221 | 3,41 | ||||
| 2026-02-13 | 13F | Advyzon Investment Management, LLC | 28.702 | 151,44 | 805 | 158,84 | ||||
| 2026-02-03 | 13F | We Are One Seven, LLC | 14.782 | 1,00 | 415 | 3,76 | ||||
| 2026-01-09 | 13F | Tactive Advisors, LLC | 0 | -100,00 | 0 | |||||
| 2026-02-13 | 13F | Inspire Advisors, LLC | 30.235 | 47,58 | 848 | 51,70 | ||||
| 2025-12-16 | 13F | Garde Capital, Inc. | 0 | -100,00 | 0 | |||||
| 2026-02-13 | 13F | Mml Investors Services, Llc | 244.935 | -3,48 | 6.873 | -0,82 | ||||
| 2026-01-22 | 13F | Networth Advisors, LLC | 27 | 1 | ||||||
| 2026-02-13 | 13F | Resources Investment Advisors, LLC. | 644.354 | -3,02 | 18.081 | -0,36 | ||||
| 2026-02-13 | 13F | National Bank Of Canada /fi/ | 45.288 | 6,83 | 1.268 | 9,78 | ||||
| 2026-02-12 | 13F | Johnson Financial Group, Inc. | 0 | -100,00 | 0 | |||||
| 2026-02-02 | 13F | Advisors Preferred, LLC | 6.449 | 182 | ||||||
| 2026-02-13 | 13F | Evelyn Partners Investment Management Services Ltd | 127.654 | 5,08 | 3.582 | 7,96 | ||||
| 2026-01-23 | 13F | E&G Advisors, LP | 57.057 | -21,15 | 1.601 | -18,98 | ||||
| 2026-01-22 | 13F | Sterneck Capital Management, LLC | 129.200 | 3,48 | 3.625 | 6,34 | ||||
| 2026-01-23 | 13F | Twelve Points Wealth Management LLC | 64.067 | 2,24 | 1.826 | 6,66 | ||||
| 2026-01-12 | 13F | Focus Financial Network, Inc. | 11.816 | 16,82 | 332 | 19,93 | ||||
| 2025-10-22 | 13F | TriaGen Wealth Management LLC | 0 | -100,00 | 0 | |||||
| 2026-02-13 | 13F | Mariner, LLC | 63.901 | 11,62 | 1.793 | 14,72 | ||||
| 2026-02-10 | 13F | IAG Wealth Partners, LLC | 565.318 | 5,48 | 15.863 | 8,38 | ||||
| 2026-01-28 | 13F | Geneos Wealth Management Inc. | 278 | 8 | ||||||
| 2026-02-17 | 13F | Signature Equity Partners, LLC | 860 | 24 | ||||||
| 2026-01-27 | 13F | Brighton Jones Llc | 0 | -100,00 | 0 | |||||
| 2026-02-13 | 13F | Baird Financial Group, Inc. | 0 | -100,00 | 0 | |||||
| 2026-02-06 | 13F | New Millennium Group LLC | 1 | -99,46 | 0 | -100,00 | ||||
| 2026-02-10 | 13F | Root Financial Partners, LLC | 0 | -100,00 | 0 | |||||
| 2026-01-27 | 13F | Leisure Capital Management | 15.265 | 428 | ||||||
| 2026-02-06 | 13F | EverSource Wealth Advisors, LLC | 4.431 | -50,64 | 124 | -49,39 | ||||
| 2026-01-20 | 13F | Ethos Financial Group, LLC | 137.203 | 953,22 | 3.850 | 984,23 | ||||
| 2026-02-17 | 13F | Pinnacle Family Advisors, LLC | 19.068 | 0,87 | 535 | 3,68 | ||||
| 2026-01-14 | 13F | ORG Partners LLC | 13.257 | -6,18 | 372 | -3,64 | ||||
| 2026-02-10 | 13F | Envestnet Asset Management Inc | 622.541 | -4,45 | 17.469 | -1,83 | ||||
| 2025-09-25 | NP | QAI - IQ Hedge Multi-Strategy Tracker ETF | 428.571 | 21,13 | 10.976 | 22,80 | ||||
| 2026-01-28 | 13F | Glassman Wealth Services | 18.287 | 513 | ||||||
| 2026-02-11 | 13F | Harvest Fund Management Co., Ltd | 1.053 | 0,00 | 0 | |||||
| 2026-02-18 | 13F | GWM Advisors LLC | 87.146 | 14,35 | 2.445 | 17,49 | ||||
| 2026-02-13 | 13F | Solstein Capital, LLC | 35 | 0,00 | 1 | |||||
| 2026-01-09 | 13F | Zrc Wealth Management, Llc | 1.145 | -50,00 | 32 | -48,39 | ||||
| 2026-02-02 | 13F | Estate Counselors, LLC | 11.850 | 333 | ||||||
| 2026-02-10 | 13F | MidAtlantic Capital Management, Inc. | 1.725 | 48 | ||||||
| 2026-01-13 | 13F | Matrix Trust Co | 8.251 | -78,77 | 0 | -100,00 | ||||
| 2026-01-21 | 13F | Raleigh Capital Management Inc. | 3.574 | 5,80 | 100 | 8,70 | ||||
| 2026-02-03 | 13F | RFG Advisory, LLC | 10.572 | 1,23 | 297 | 3,86 | ||||
| 2026-01-28 | 13F | Ai Financial Services Llc | 322.366 | -1,92 | 9.046 | 0,40 | ||||
| 2026-02-09 | 13F | Family Office Research LLC | 13.557 | -60,27 | 397 | -57,47 | ||||
| 2026-01-08 | 13F | Wealth Enhancement Advisory Services, Llc | 34.018 | 14,66 | 967 | 15,81 | ||||
| 2026-02-06 | 13F | Ignite Planners, LLC | 12.585 | 367 | ||||||
| 2026-02-11 | 13F | Signet Private Wealth LLC | 12.799 | 359 | ||||||
| 2026-02-06 | 13F | Global Retirement Partners, LLC | 29.058 | 5,55 | 815 | 8,52 | ||||
| 2026-01-26 | 13F | Parcion Private Wealth LLC | 1.556.637 | 1,30 | 43.679 | 4,08 | ||||
| 2026-01-30 | 13F | Bogart Wealth, LLC | 457 | 13 | ||||||
| 2026-02-17 | 13F | Cambria Investment Management, L.P. | 372.915 | 41,47 | 10.464 | 45,36 | ||||
| 2026-01-12 | 13F | Optivise Advisory Services LLC | 44.105 | -21,66 | 1.238 | -19,52 | ||||
| 2026-02-04 | 13F | Englebert Financial Advisers, LLC | 24.748 | 694 | ||||||
| 2026-02-12 | 13F | Empire Financial Management Company, LLC | 211.563 | 0,76 | 5.936 | 3,52 | ||||
| 2026-02-17 | 13F | Stansberry Asset Management, Llc | 117.811 | 1,80 | 3.306 | 4,59 | ||||
| 2026-02-11 | 13F | LPL Financial LLC | 5.637.634 | 6,72 | 158.192 | 9,65 | ||||
| 2026-02-12 | 13F | Beacon Capital Management, Inc. | 161.710 | -32,40 | 4.538 | -30,54 | ||||
| 2026-02-13 | 13F | Integrated Wealth Concepts LLC | 28.951 | -4,77 | 812 | -2,17 | ||||
| 2026-01-20 | 13F | Midwest Financial Group LLC | 80.578 | 10,37 | 2.261 | 13,45 | ||||
| 2026-02-12 | 13F | Philadelphia Trust Co | 15.100 | 0 | ||||||
| 2026-01-14 | 13F | Worth Asset Management, LLC | 114.036 | 1.275,59 | 3.200 | 1.315,49 | ||||
| 2026-01-23 | 13F | Fifth Third Securities, Inc. | 0 | -100,00 | 0 | |||||
| 2026-02-11 | 13F | Capital Analysts, Inc. | 6.777 | 0 | ||||||
| 2026-02-05 | 13F | Allworth Financial LP | 64 | 2 | ||||||
| 2026-01-06 | 13F | Canal Capital Management, LLC | 78.236 | -15,05 | 2.195 | -12,72 | ||||
| 2026-02-05 | 13F | Center for Financial Planning, Inc. | 376 | 11 | ||||||
| 2026-02-13 | 13F | Wells Fargo & Company/mn | 317.329 | -15,31 | 8.904 | -12,98 | ||||
| 2026-01-20 | 13F | Savvy Advisors, Inc. | 40.209 | 0,14 | 1.128 | 2,92 | ||||
| 2026-02-14 | 13F | Rockefeller Capital Management L.P. | 28.216 | 250,29 | 792 | 261,19 | ||||
| 2026-02-17 | 13F | Blueprint Investment Partners LLC | 26.539 | -11,63 | 745 | -9,27 | ||||
| 2026-02-05 | 13F | Proactive Wealth Strategies LLC | 20.078 | 2,20 | 563 | 5,04 | ||||
| 2026-02-11 | 13F | Jpmorgan Chase & Co | 7.374.483 | 139.912,97 | 206.928 | 144.604,20 | ||||
| 2026-02-17 | 13F | Quadrature Capital Ltd | 46.907 | 1.316 | ||||||
| 2025-11-12 | 13F/A | Modern Wealth Management, LLC | 0 | -100,00 | 0 | -100,00 | ||||
| 2026-02-10 | 13F | Avestar Capital, LLC | 144.340 | 0,73 | 4.050 | 3,42 | ||||
| 2026-02-10 | 13F | Bank of New York Mellon Corp | 13.733 | 78,35 | 385 | 83,33 | ||||
| 2026-01-14 | 13F | Eastern Bank | 200 | 0,00 | 6 | 0,00 | ||||
| 2026-01-28 | 13F | West Michigan Advisors, Llc | 7.520 | 2,52 | 220 | 8,96 | ||||
| 2026-02-02 | 13F | Longview Financial Advisors, Inc. | 139.971 | 2,04 | 3.928 | 4,83 | ||||
| 2026-02-17 | 13F | Wealth Watch Advisors, INC | 466 | 5,67 | 13 | 8,33 | ||||
| 2026-01-22 | 13F | Upper Left Wealth Management, LLC | 195.943 | 4,45 | 5.498 | 7,32 | ||||
| 2026-02-05 | 13F | Cambridge Investment Research Advisors, Inc. | 209.240 | 0,14 | 6 | 0,00 | ||||
| 2026-01-26 | 13F | Austin Wealth Management, LLC | 635.783 | 4,21 | 17.980 | 3,95 | ||||
| 2026-02-11 | 13F | Entelevest, LLC | 15.177 | 426 | ||||||
| 2026-02-10 | 13F | Savant Capital, LLC | 965.864 | 0,23 | 27.102 | 2,98 | ||||
| 2026-02-13 | 13F | Stifel Financial Corp | 38.863 | -10,81 | 1.091 | -8,40 | ||||
| 2026-01-26 | 13F | Frankly Finances, LLC | 7.640 | 214 | ||||||
| 2026-02-13 | 13F | Genesis Wealth Advisors, LLC | 0 | -100,00 | 0 | |||||
| 2026-02-13 | 13F | Centaurus Financial, Inc. | 39.149 | 18,10 | 1 | |||||
| 2026-01-15 | 13F | Fortitude Family Office, LLC | 448.656 | 35,07 | 12.589 | 38,78 | ||||
| 2026-01-30 | 13F | Carrera Capital Advisors | 195.638 | 5.490 | ||||||
| 2026-02-02 | 13F | Oppenheimer & Co Inc | 0 | -100,00 | 0 | |||||
| 2026-02-11 | 13F | Empowered Funds, LLC | 204.310 | 112,14 | 5.733 | 117,95 | ||||
| 2026-02-10 | 13F | IFG Advisory, LLC | 69.822 | 1.959 | ||||||
| 2026-02-06 | 13F | Kingdom Financial Group LLC. | 250 | 7 | ||||||
| 2026-02-17 | 13F | Css Llc/il | 205.764 | 0,00 | 5.774 | 2,74 | ||||
| 2026-02-17 | 13F | IHT Wealth Management, LLC | 12.639 | 355 | ||||||
| 2026-02-10 | 13F | Goldstein Advisors, LLC | 1.050.555 | -1,93 | 29.479 | 0,77 | ||||
| 2026-02-12 | 13F | Principal Securities, Inc. | 0 | -100,00 | 0 | -100,00 | ||||
| 2026-02-13 | 13F | Visionary Wealth Advisors | 28.316 | -4,65 | 795 | -2,10 | ||||
| 2026-02-13 | 13F | MAI Capital Management | 50.239 | 4,33 | 1.410 | 7,15 | ||||
| 2025-11-14 | 13F | Hrt Financial Lp | 0 | -100,00 | 0 | |||||
| 2026-01-29 | 13F | Concurrent Investment Advisors, LLC | 47.065 | 44,71 | 1.321 | 48,65 | ||||
| 2026-01-30 | 13F | Us Bancorp \de\ | 350 | 34,10 | 10 | 28,57 | ||||
| 2026-02-17 | 13F | Raymond James Financial Inc | 1.457.155 | 6,53 | 40.888 | 9,46 | ||||
| 2025-11-04 | 13F | Tsfg, Llc | 0 | -100,00 | 0 | |||||
| 2026-02-12 | 13F | Federation des caisses Desjardins du Quebec | 1.081 | 0,00 | 30 | 3,45 | ||||
| 2025-10-27 | 13F | Kiker Wealth Management, LLC | 0 | -100,00 | 0 | |||||
| 2026-01-23 | 13F | Farther Finance Advisors, LLC | 303.933 | 88,93 | 8.528 | 94,13 | ||||
| 2026-01-13 | 13F | CoreCap Advisors, LLC | 127.623 | -21,07 | 3.581 | -18,89 | ||||
| 2026-02-05 | 13F | Thrivent Financial For Lutherans | 26.867 | 1 | ||||||
| 2026-02-17 | 13F | Captrust Financial Advisors | 59.498 | -15,14 | 1.670 | -12,80 | ||||
| 2026-01-26 | 13F | Cwm, Llc | 174.368 | -3,95 | 5 | 0,00 | ||||
| 2026-02-04 | 13F | Atlantic Union Bankshares Corp | 365 | 10 |