Grundlæggende statistik
| Institutionelle aktier (lange) | 50.669.397 - 99,34% (ex 13D/G) - change of -7,39MM shares -12,72% MRQ |
| Institutionel værdi (lang) | $ 5.438.602 USD ($1000) |
Institutionelt ejerskab og aktionærer
Cirrus Logic, Inc. (US:CRUS) har 506 institutionelle ejere og aktionærer, der har indsendt 13D/G- eller 13F-formularer til Securities Exchange Commission (SEC). Disse institutioner har i alt 50,669,397 aktier. Største aktionærer omfatter Vanguard Group Inc, BlackRock, Inc., Lsv Asset Management, State Street Corp, Fuller & Thaler Asset Management, Inc., Wellington Management Group Llp, Earnest Partners Llc, Bank Of America Corp /de/, Dimensional Fund Advisors Lp, and Geode Capital Management, Llc .
Cirrus Logic, Inc. (NasdaqGS:CRUS) institutionel ejerskabsstruktur viser aktuelle positioner i virksomheden efter institutioner og fonde, samt seneste ændringer i positionsstørrelse. Større aktionærer kan omfatte individuelle investorer, investeringsforeninger, hedgefonde eller institutioner. Skema 13D angiver, at investoren besidder (eller besidder) mere end 5 % af virksomheden og har til hensigt (eller har til hensigt at) aktivt at forfølge en ændring i forretningsstrategi. Skema 13G indikerer en passiv investering på over 5%.
The share price as of March 30, 2026 is 138,37 / share. Previously, on March 31, 2025, the share price was 99,66 / share. This represents an increase of 38,85% over that period.

Fondens stemningsscore
Fund Sentiment Score (fka Ownership Accumulation Score) finder de aktier, der bliver mest købt af fonde. Det er resultatet af en sofistikeret, multi-faktor kvantitativ model, der identificerer virksomheder med de højeste niveauer af institutionel akkumulering. Scoringsmodellen bruger en kombination af den samlede stigning i oplyste ejere, ændringerne i porteføljeallokeringer i disse ejere og andre målinger. Tallet går fra 0 til 100, hvor højere tal indikerer et højere niveau af akkumulering for sine jævnaldrende, og 50 er gennemsnittet.
Opdateringsfrekvens: Dagligt
Se Ownership Explorer, som giver en liste over højest rangerende virksomheder.
AI+ Ask Fintel’s AI assistant about Cirrus Logic, Inc..
Select a question to share a public post with an AI-crafted answer.
Thinking of good questions…
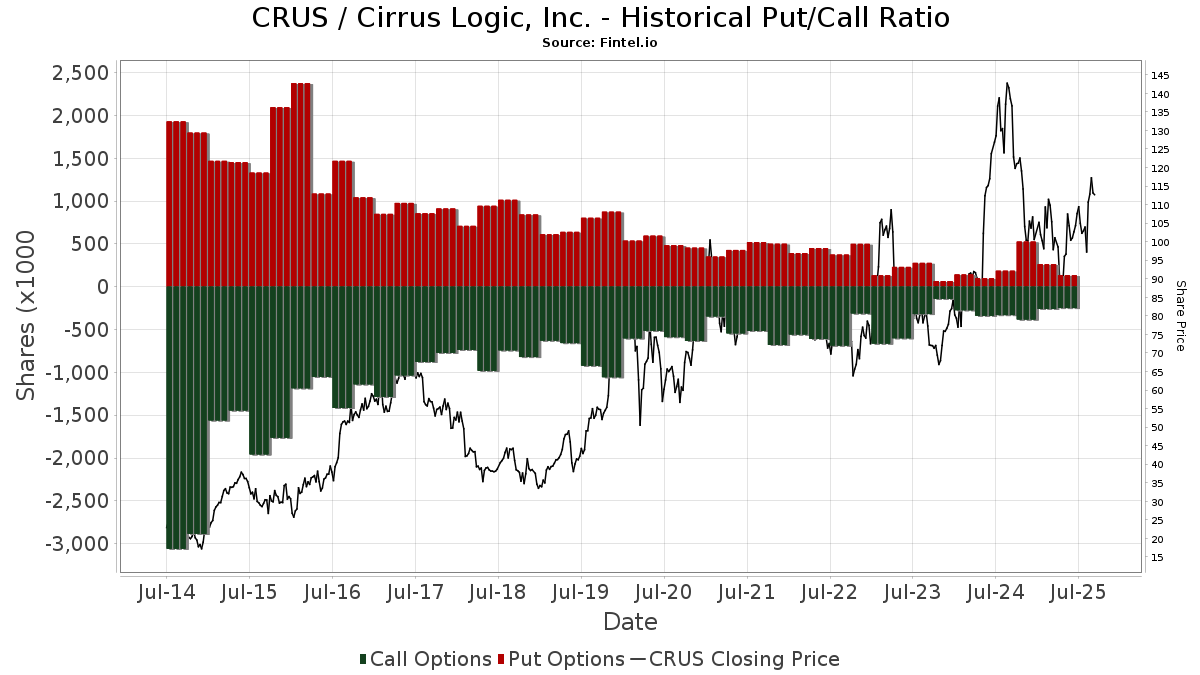
Institutionel Put/Call-forhold
Ud over at indberette standardaktie- og gældsudstedelser skal institutter med mere end 100 mill. aktiver under forvaltning også oplyse deres put- og call-optionsbeholdninger. Da salgsoptioner generelt indikerer negativ stemning, og købsoptioner indikerer positiv stemning, kan vi få en fornemmelse af den overordnede institutionelle stemning ved at plotte forholdet mellem put og kald. Diagrammet til højre viser det historiske put/call-forhold for dette instrument.
Brug af Put/Call Ratio som en indikator for investorernes stemning overvinder en af de vigtigste mangler ved at bruge totalt institutionelt ejerskab, som er, at en betydelig mængde af aktiver under forvaltning investeres passivt for at spore indekser. Passivt forvaltede fonde køber typisk ikke optioner, så indikatoren for put/call-forholdet følger mere nøje følelsen af aktivt forvaltede fonde.
13D/G-arkivering
Vi præsenterer 13D/G ansøgninger separat fra 13F ansøgninger på grund af den forskellige behandling af SEC. 13D/G-ansøgninger kan indgives af grupper af investorer (med én ledende), hvorimod 13F-ansøgninger ikke kan. Dette resulterer i situationer, hvor en investor kan indsende en 13D/G, der rapporterer én værdi for de samlede aktier (der repræsenterer alle de aktier, der ejes af investorgruppen), men derefter indsender en 13F, der rapporterer en anden værdi for de samlede aktier (der udelukkende repræsenterer deres egne) ejendomsret). Det betyder, at aktieejerskab af 13D/G-arkiver og 13F-arkiveringer ofte ikke er direkte sammenlignelige, så vi præsenterer dem separat.
Bemærk: Fra den 16. maj 2021 viser vi ikke længere ejere, der ikke har indsendt en 13D/G inden for det seneste år. Tidligere viste vi den fulde historie af 13D/G-arkiver. Generelt skal enheder, der er forpligtet til at indgive 13D/G-ansøgninger, indgive mindst årligt, før de indsender en afsluttende ansøgning. Dog forlader fonde nogle gange positioner uden at indsende en afsluttende ansøgning (dvs. de afvikler), så visning af den fulde historie resulterede nogle gange i forvirring om det nuværende ejerskab. For at undgå forvirring viser vi nu kun 'aktuelle' ejere - det vil sige - ejere, der har anmeldt inden for det seneste år.
Upgrade to unlock premium data.
| Fil dato | Form | Investor | Forrige Aktier |
Seneste Aktier |
Δ Aktier (Procent) |
Ejendomsret (Procent) |
Δ Ejerskab (Procent) |
|
|---|---|---|---|---|---|---|---|---|
| 2026-03-26 | VANGUARD GROUP INC | 6,622,431 | 0 | -100.00 | 0.00 | -100.00 | ||
| 2025-04-17 | BlackRock, Inc. | 5,563,554 | 4,856,306 | -12.71 | 9.10 | -11.65 |
13F og NPORT arkivering
Detaljer om 13F-arkivering er gratis. Detaljer om NP-ansøgninger kræver et premium-medlemskab. Grønne rækker angiver nye positioner. Røde rækker angiver lukkede positioner. Klik på linket ikon for at se den fulde transaktionshistorik.
Opgrader
for at låse premium-data op og eksportere til Excel ![]() .
.
| Fil dato | Kilde | Investor | Type | Gennemsnitlig pris (Øst) |
Aktier | Δ Aktier (%) |
Rapporteret Værdi ($1000) |
Δ Værdi (%) |
Port Alloc (%) |
|
|---|---|---|---|---|---|---|---|---|---|---|
| 2026-02-13 | 13F | Nfj Investment Group, Llc | 18.773 | -13,96 | 2.225 | -18,62 | ||||
| 2026-02-14 | 13F | Rockefeller Capital Management L.P. | 1.567 | 29,18 | 186 | 22,52 | ||||
| 2026-01-20 | 13F | Investment Research & Advisory Group, Inc. | 300 | 0,00 | 36 | -5,41 | ||||
| 2026-02-11 | 13F | Allianz Asset Management GmbH | 1.073.623 | 33,50 | 127.224 | 26,26 | ||||
| 2026-02-17 | 13F | Cim Investment Mangement Inc | 2.732 | 0,00 | 324 | -5,56 | ||||
| 2026-01-29 | 13F | IMC-Chicago, LLC | Call | 14.700 | -38,75 | 1.742 | -42,08 | |||
| 2026-02-04 | 13F | Bailard, Inc. | 2.700 | 320 | ||||||
| 2026-01-15 | 13F | Alhambra Investment Partners LLC | 2.034 | -6,95 | 241 | -11,72 | ||||
| 2026-02-03 | 13F | Redwood Wealth Management Group, LLC | 1.944 | -2,26 | 230 | -7,63 | ||||
| 2026-02-17 | 13F | Millennium Management Llc | Call | 0 | -100,00 | 0 | ||||
| 2026-02-11 | 13F | Manchester Capital Management LLC | 6 | 1 | ||||||
| 2026-02-05 | 13F | Amalgamated Bank | 23.246 | -0,76 | 3 | 0,00 | ||||
| 2026-02-13 | 13F | Barclays Plc | 100.098 | 1,64 | 11.862 | -3,03 | ||||
| 2026-01-27 | 13F | Bayforest Capital Ltd | 4.640 | -51,44 | 550 | -54,14 | ||||
| 2026-02-11 | 13F | Brand Asset Management Group, Inc. | 2.736 | 26,14 | 324 | 19,56 | ||||
| 2026-02-13 | 13F | Walleye Trading LLC | Put | 1.400 | -80,00 | 166 | -81,19 | |||
| 2026-02-13 | 13F | Walleye Trading LLC | Call | 2.900 | -32,56 | 344 | -36,25 | |||
| 2026-01-14 | 13F | Pallas Capital Advisors LLC | 2.470 | 0,41 | 293 | -5,19 | ||||
| 2026-02-17 | 13F | Creative Planning | 26.570 | 10,35 | 3.149 | 4,38 | ||||
| 2026-02-17 | 13F | Wiley Bros.-aintree Capital, Llc | 6.984 | -2,35 | 828 | -7,70 | ||||
| 2026-03-02 | 13F | Sankala Group LLC | 40 | 6 | ||||||
| 2026-02-11 | 13F | Buckingham Strategic Partners | 0 | -100,00 | 0 | |||||
| 2026-02-12 | 13F | Nuveen, LLC | 114.855 | -23,77 | 13.610 | -27,90 | ||||
| 2026-01-30 | 13F | State of New Jersey Common Pension Fund D | 18.663 | 0,00 | 2.212 | -5,43 | ||||
| 2026-02-10 | 13F | Axq Capital, Lp | 4.987 | 591 | ||||||
| 2026-02-12 | 13F | CIBC Private Wealth Group, LLC | 389 | 29,24 | 46 | 24,32 | ||||
| 2026-02-13 | 13F | Landscape Capital Management, L.l.c. | 0 | -100,00 | 0 | |||||
| 2026-01-16 | 13F | Ronald Blue Trust, Inc. | 7.867 | -5,69 | 932 | -10,81 | ||||
| 2025-11-07 | 13F | HighTower Advisors, LLC | Call | 0 | -100,00 | 0 | -100,00 | |||
| 2026-01-30 | 13F | NJ State Employees Deferred Compensation Plan | 0 | -100,00 | 0 | |||||
| 2026-02-11 | 13F | Cookson Peirce & Co Inc | 2.637 | 22,48 | 312 | 15,99 | ||||
| 2026-01-29 | 13F | DecisionPoint Financial, LLC | 2 | 0,00 | 0 | |||||
| 2026-02-04 | 13F | Versor Investments LP | 3.503 | 415 | ||||||
| 2026-02-17 | 13F | Advisory Services Network, LLC | 2.061 | 2,64 | 244 | -2,79 | ||||
| 2026-02-06 | 13F | Global Retirement Partners, LLC | 835 | 211,57 | 99 | 196,97 | ||||
| 2026-02-12 | 13F | Commonwealth Equity Services, Llc | 1.896 | -10,18 | 225 | |||||
| 2026-02-13 | 13F | Bridgefront Capital, LLC | 4.384 | 4,91 | 520 | -0,76 | ||||
| 2026-02-05 | 13F | Bessemer Group Inc | 823 | 6,06 | 0 | |||||
| 2026-02-17 | 13F | Rexford Capital Inc | 2.060 | 0,00 | 244 | -5,43 | ||||
| 2026-02-10 | 13F | Acadian Asset Management Llc | 704.793 | 7,87 | 83 | 2,47 | ||||
| 2026-03-09 | 13F | EMC Capital Management | 2.602 | -15,00 | 0 | |||||
| 2026-01-14 | 13F | ORG Partners LLC | 111 | 455,00 | 13 | 550,00 | ||||
| 2025-10-15 | 13F | Global X Japan Co., Ltd. | 0 | -100,00 | 0 | |||||
| 2025-11-13 | 13F | Glenmede Investment Management, LP | 126.601 | -4,50 | 15.862 | 14,77 | ||||
| 2026-01-12 | 13F | Rialto Wealth Management, LLC | 11 | 10,00 | 1 | 0,00 | ||||
| 2026-01-27 | 13F | Zurcher Kantonalbank (Zurich Cantonalbank) | 18.854 | 2.234 | ||||||
| 2026-02-13 | 13F | Ubs Asset Management Americas Inc | 374.575 | 40,88 | 44.387 | 33,25 | ||||
| 2026-02-17 | 13F | Bayesian Capital Management, LP | 0 | -100,00 | 0 | |||||
| 2026-02-05 | 13F | Northwestern Mutual Investment Management Company, Llc | 11.417 | -0,22 | 1.353 | -5,65 | ||||
| 2026-02-11 | 13F | Deutsche Bank Ag\ | 39.321 | 204,25 | 4.660 | 187,77 | ||||
| 2026-02-10 | 13F | Future Fund LLC | 19.646 | -27,06 | 2.328 | -31,00 | ||||
| 2025-11-14 | 13F | Cubist Systematic Strategies, LLC | 0 | -100,00 | 0 | |||||
| 2026-02-17 | 13F | Graham Capital Management, L.P. | 1.892 | 14,25 | 224 | 8,21 | ||||
| 2026-01-15 | 13F | Allspring Global Investments Holdings, LLC | 60.160 | -10,21 | 7.199 | -14,52 | ||||
| 2026-02-18 | 13F | GWM Advisors LLC | 7.934 | 139,19 | 940 | 126,51 | ||||
| 2026-01-29 | 13F | IMC-Chicago, LLC | 0 | -100,00 | 0 | -100,00 | ||||
| 2026-02-10 | 13F | American Money Management, LLC | 2.500 | 0,00 | 296 | -5,43 | ||||
| 2026-01-26 | 13F | Mirae Asset Global Investments Co., Ltd. | 11.060 | -0,42 | 1.311 | -5,82 | ||||
| 2026-01-29 | 13F | IMC-Chicago, LLC | Put | 0 | -100,00 | 0 | -100,00 | |||
| 2026-02-17 | 13F | Jump Financial, LLC | 2.100 | -50,82 | 249 | -53,56 | ||||
| 2026-02-18 | 13F | Vident Advisory, LLC | 44.602 | -0,11 | 5.285 | -5,52 | ||||
| 2026-01-16 | 13F | Kendall Capital Management | 10.600 | 0,86 | 1.256 | -4,56 | ||||
| 2026-02-10 | 13F | Globeflex Capital L P | 71.877 | 0,00 | 8.517 | -5,42 | ||||
| 2025-11-14 | 13F | Occudo Quantitative Strategies Lp | 0 | -100,00 | 0 | -100,00 | ||||
| 2025-11-14 | 13F | Point72 (DIFC) Ltd | 0 | -100,00 | 0 | -100,00 | ||||
| 2026-02-06 | 13F | Profund Advisors Llc | 3.797 | 1,99 | 450 | -3,65 | ||||
| 2026-02-12 | 13F | Keystone Financial Services | 0 | -100,00 | 0 | |||||
| 2026-02-11 | 13F | Parallel Advisors, LLC | 1.368 | 6,21 | 162 | 0,62 | ||||
| 2026-02-17 | 13F | Captrust Financial Advisors | 6.396 | -0,96 | 758 | -6,43 | ||||
| 2026-01-29 | 13F | RMG Wealth Management LLC | 287 | 0,00 | 38 | 2,78 | ||||
| 2026-02-13 | 13F | Transamerica Financial Advisors, Inc. | 26 | 3 | ||||||
| 2026-02-02 | 13F | Danske Bank A/s | 200 | -98,17 | 24 | -98,32 | ||||
| 2026-02-17 | 13F | Evolve Private Wealth, Llc | 6.429 | 762 | ||||||
| 2026-02-13 | 13F | Sei Investments Co | 947.058 | 2,17 | 112.227 | -3,37 | ||||
| 2025-10-30 | 13F | Migdal Insurance & Financial Holdings Ltd. | 0 | -100,00 | 0 | |||||
| 2026-02-13 | 13F | Macquarie Group Ltd | 0 | -100,00 | 0 | |||||
| 2025-11-05 | 13F | Optimize Financial Inc | 0 | -100,00 | 0 | -100,00 | ||||
| 2026-01-29 | 13F | Concurrent Investment Advisors, LLC | 2.578 | 305 | ||||||
| 2026-01-26 | 13F | Cwm, Llc | 16.797 | -1,39 | 2 | -50,00 | ||||
| 2026-02-04 | 13F | Virginia Retirement Systems Et Al | 26.088 | -8,10 | 3.091 | -13,08 | ||||
| 2026-02-12 | 13F | Skopos Labs, Inc. | 2.133 | 256 | ||||||
| 2026-02-11 | 13F | Franklin Resources Inc | 146.676 | -4,31 | 17.381 | -9,50 | ||||
| 2026-02-10 | 13F | Jupiter Asset Management Ltd | 142.590 | 0,00 | 16.897 | -5,42 | ||||
| 2026-02-09 | 13F | Huntington National Bank | 711 | -48,44 | 84 | -51,16 | ||||
| 2025-11-12 | 13F | 111 Capital | 0 | -100,00 | 0 | |||||
| 2026-02-13 | 13F | Mariner, LLC | 0 | -100,00 | 0 | |||||
| 2026-02-11 | 13F | Picton Mahoney Asset Management | 8 | -99,89 | 1 | |||||
| 2026-02-02 | 13F | Fifth Third Bancorp | 14.503 | -7,84 | 1.719 | -12,84 | ||||
| 2026-01-30 | 13F | Catalytic Wealth RIA, LLC | 0 | -100,00 | 0 | |||||
| 2026-02-09 | 13F | Keating Financial Advisory Services, Inc. | 82 | 10 | ||||||
| 2026-01-23 | 13F | Smallwood Wealth Investment Management, LLC | 50 | 0,00 | 6 | -16,67 | ||||
| 2026-02-06 | 13F | HighTower Advisors, LLC | 13.112 | 0,48 | 1.554 | -4,96 | ||||
| 2026-02-12 | 13F | MetLife Investment Management, LLC | 24.936 | -5,47 | 2.955 | -10,62 | ||||
| 2026-02-17 | 13F | Bank Of America Corp /de/ | 1.292.520 | -1,87 | 153.164 | -7,19 | ||||
| 2026-02-12 | 13F | Sprott Inc. | 94.840 | 0,00 | 11.239 | -5,42 | ||||
| 2026-02-17 | 13F | Trexquant Investment LP | 55.585 | 424,19 | 6.587 | 395,93 | ||||
| 2026-01-09 | 13F | Assenagon Asset Management S.A. | 144.139 | 223,09 | 17.080 | 205,60 | ||||
| 2025-11-17 | 13F | PharVision Advisers, LLC | 0 | -100,00 | 0 | |||||
| 2026-02-13 | 13F/A | Ontario Teachers Pension Plan Board | 0 | -100,00 | 0 | |||||
| 2026-02-09 | 13F | Legal & General Group Plc | 80.996 | -21,94 | 9.598 | -26,17 | ||||
| 2026-02-17 | 13F | Shelton Capital Management | 1.712 | -10,08 | 203 | -15,13 | ||||
| 2026-02-13 | 13F | Cornerstone Financial Management LLC | 8 | 1 | ||||||
| 2026-01-07 | 13F | Massmutual Trust Co Fsb/adv | 239 | -2,45 | 28 | -6,67 | ||||
| 2026-01-12 | 13F | Byrne Asset Management LLC | 0 | -100,00 | 0 | |||||
| 2026-02-02 | 13F | Truist Financial Corp | 3.225 | 2,19 | 382 | -3,29 | ||||
| 2026-02-13 | 13F | Mml Investors Services, Llc | 5.661 | -2,92 | 671 | -8,22 | ||||
| 2026-01-13 | 13F | CoreCap Advisors, LLC | 6 | -92,77 | 1 | -100,00 | ||||
| 2026-01-21 | 13F | SJS Investment Consulting Inc. | 429 | 6,98 | 51 | 0,00 | ||||
| 2026-02-09 | 13F | Quest Partners LLC | 12.416 | 1.258,42 | 1.471 | 1.190,35 | ||||
| 2026-02-13 | 13F | Atlas Capital Advisors Llc | 3.642 | 485,53 | 432 | 573,44 | ||||
| 2026-02-05 | 13F | AlphaCore Capital LLC | 1.698 | 201 | ||||||
| 2026-02-12 | 13F | Leigh Baldwin & Co., Llc | 0 | -100,00 | 0 | -100,00 | ||||
| 2026-02-17 | 13F | Raymond James Financial Inc | 141.475 | 10,49 | 16.820 | 4,85 | ||||
| 2026-01-30 | 13F | Torren Management, LLC | 292 | 35 | ||||||
| 2026-02-17 | 13F | LMR Partners LLP | 2.500 | 296 | ||||||
| 2026-02-02 | 13F | Horizon Investments, LLC | 27.126 | 49,07 | 3.214 | 41,03 | ||||
| 2026-01-16 | 13F | DiNuzzo Private Wealth, Inc. | 12 | 71,43 | 1 | |||||
| 2026-02-17 | 13F | Magnetar Financial LLC | 13.959 | 1.654 | ||||||
| 2026-02-17 | 13F | Susquehanna Portfolio Strategies, LLC | 3.210 | 0,00 | 380 | -5,47 | ||||
| 2025-11-14 | 13F | DRW Securities, LLC | 0 | -100,00 | 0 | |||||
| 2026-02-13 | 13F | Rhumbline Advisers | 139.981 | -2,67 | 16.588 | -7,95 | ||||
| 2026-02-11 | 13F | Empowered Funds, LLC | 3.934 | -81,49 | 466 | -82,50 | ||||
| 2026-02-11 | 13F | Ing Groep Nv | 52.600 | 54,25 | 6.233 | 45,90 | ||||
| 2026-02-10 | 13F | Holderness Investments Co | 39.095 | -1,67 | 4.633 | -7,01 | ||||
| 2026-01-29 | 13F | Pictet Asset Management Holding SA | 7.423 | -4,88 | 880 | -10,03 | ||||
| 2026-01-20 | 13F | ETF Portfolio Partners, Inc. | 2.400 | 0,00 | 284 | -5,33 | ||||
| 2026-01-29 | 13F | UBS Group AG | 396.170 | 15,78 | 46.946 | 9,50 | ||||
| 2026-02-06 | 13F | Covestor Ltd | 1.014 | -38,36 | 0 | |||||
| 2026-02-10 | 13F | Sittner & Nelson, Llc | 120 | 0,00 | 17 | 13,33 | ||||
| 2026-02-13 | 13F | MAI Capital Management | 1.141 | 290,75 | 135 | 275,00 | ||||
| 2026-02-18 | 13F | Mackenzie Financial Corp | 1.215.655 | -12,04 | 146.077 | -15,64 | ||||
| 2026-02-12 | 13F | Rossby Financial, LCC | 17 | 2 | ||||||
| 2026-02-13 | 13F | Pinnacle Wealth Planning Services, Inc. | 61 | 7 | ||||||
| 2026-02-17 | 13F | Maryland State Retirement & Pension System | 2.513 | 0,00 | 298 | -5,41 | ||||
| 2026-01-29 | 13F | Dunhill Financial, LLC | 1 | 0 | ||||||
| 2026-02-11 | 13F | Twin Tree Management, LP | Call | 0 | -100,00 | 0 | -100,00 | |||
| 2026-02-11 | 13F | Twin Tree Management, LP | Put | 0 | -100,00 | 0 | -100,00 | |||
| 2026-01-23 | 13F | Avion Wealth | 5 | -44,44 | 0 | |||||
| 2026-02-12 | 13F | Voya Investment Management Llc | 32.607 | 4,93 | 3.864 | -0,77 | ||||
| 2026-02-13 | 13F | SRS Capital Advisors, Inc. | 1.049 | -96,36 | 124 | -96,57 | ||||
| 2026-02-12 | 13F | Empirical Finance, LLC | 9.607 | 0,00 | 1.138 | -5,40 | ||||
| 2025-11-13 | 13F | Vinva Investment Management Ltd | 0 | -100,00 | 0 | |||||
| 2026-02-17 | 13F | Citadel Advisors Llc | Call | 22.400 | -38,96 | 2.654 | -42,28 | |||
| 2025-11-06 | 13F | Whipplewood Advisors, LLC | 0 | -100,00 | 0 | |||||
| 2026-02-17 | 13F | Citadel Advisors Llc | 114.997 | 36,68 | 13.627 | 29,28 | ||||
| 2025-11-14 | 13F | Point72 Hong Kong Ltd | 0 | -100,00 | 0 | |||||
| 2026-02-17 | 13F | Citadel Advisors Llc | Put | 15.300 | -17,74 | 1.813 | -22,19 | |||
| 2026-02-11 | 13F | IMA Wealth, Inc. | 27 | 1.250,00 | 3 | |||||
| 2026-02-12 | 13F | Bank Of Montreal /can/ | 5.237 | 16,12 | 621 | 9,73 | ||||
| 2026-02-13 | 13F | Neuberger Berman Group LLC | 5.269 | 3,31 | 624 | -2,19 | ||||
| 2025-10-21 | 13F | Simon Quick Advisors, Llc | 0 | -100,00 | 0 | -100,00 | ||||
| 2026-02-13 | 13F | Wells Fargo & Company/mn | 77.137 | 0,55 | 9.141 | -4,90 | ||||
| 2026-02-06 | 13F | Tortoise Investment Management, LLC | 0 | -100,00 | 0 | |||||
| 2026-02-13 | 13F | Heron Bay Capital Management | 24.719 | -0,46 | 2.929 | -5,85 | ||||
| 2026-02-11 | 13F | CLARET ASSET MANAGEMENT Corp | 2.159 | -0,23 | 0 | |||||
| 2026-01-28 | 13F | N.E.W. Advisory Services LLC | 500 | 0,00 | 59 | -4,84 | ||||
| 2026-02-02 | 13F | Strs Ohio | 1.224 | 0,16 | 145 | -5,23 | ||||
| 2026-02-11 | 13F | Commonwealth Retirement Investments LLC | 200 | 24 | ||||||
| 2026-01-16 | 13F | Linden Thomas Advisory Services, LLC | 12.924 | 1,04 | 1.531 | -4,43 | ||||
| 2026-01-15 | 13F | Krs Capital Management, Llc | 1.815 | 0,00 | 215 | -5,29 | ||||
| 2026-02-17 | 13F | Two Sigma Advisers, Lp | 43.700 | 360,00 | 5.178 | 335,13 | ||||
| 2026-01-21 | 13F | Yousif Capital Management, Llc | 15.710 | -2,35 | 1.974 | -2,08 | ||||
| 2026-02-19 | 13F | CI Private Wealth, LLC | 193.777 | 1.408,58 | 2.928 | 81,91 | ||||
| 2026-02-17 | 13F | Algert Global Llc | 72.191 | -11,72 | 9 | -20,00 | ||||
| 2026-02-10 | 13F | New Mexico Educational Retirement Board | 11.300 | 0,00 | 1 | 0,00 | ||||
| 2026-01-12 | 13F | Roble, Belko & Company, Inc | 2.000 | 0,00 | 0 | |||||
| 2026-02-13 | 13F | Charles Schwab Investment Management Inc | 669.045 | -3,26 | 79.282 | -8,50 | ||||
| 2026-02-03 | 13F | Crestwood Advisors Group LLC | 1.838 | 218 | ||||||
| 2026-02-09 | 13F | Smithfield Trust Co | 85 | 0,00 | 0 | |||||
| 2026-02-04 | 13F | Ameritas Advisory Services, LLC | 0 | -100,00 | 0 | |||||
| 2026-02-17 | 13F | Susquehanna International Group, Llp | Call | 39.800 | -40,69 | 4.716 | -43,90 | |||
| 2026-02-17 | 13F | Susquehanna International Group, Llp | 10.345 | -57,87 | 1.226 | -60,18 | ||||
| 2026-02-09 | 13F | Atlantic Trust, LLC | 51 | 0,00 | 6 | 0,00 | ||||
| 2026-02-17 | 13F | Susquehanna International Group, Llp | Put | 6.700 | -4,29 | 794 | -9,58 | |||
| 2026-02-13 | 13F | Pathstone Holdings, LLC | 5.789 | 1,08 | 686 | -4,32 | ||||
| 2026-01-13 | 13F | Dakota Wealth Management | 11.645 | 1.380 | ||||||
| 2026-02-13 | 13F | Y-Intercept (Hong Kong) Ltd | 39.096 | 313,23 | 4.633 | 290,89 | ||||
| 2026-02-10 | 13F | Envestnet Asset Management Inc | 112.613 | -8,13 | 13.345 | -13,11 | ||||
| 2026-02-06 | 13F | GPS Wealth Strategies Group, LLC | 0 | -100,00 | 0 | |||||
| 2026-02-10 | 13F | Daiwa Securities Group Inc. | 3.030 | 558,70 | 0 | |||||
| 2026-02-10 | 13F | Hillsdale Investment Management Inc. | 35.470 | 286,80 | 4.203 | 266,11 | ||||
| 2026-02-12 | 13F | Hrt Financial Lp | 0 | -100,00 | 0 | |||||
| 2026-01-28 | 13F | Klp Kapitalforvaltning As | 24.300 | 1,25 | 2.880 | -4,22 | ||||
| 2025-11-13 | 13F | Blueshift Asset Management, LLC | 0 | -100,00 | 0 | -100,00 | ||||
| 2025-11-14 | 13F | Two Sigma Securities, Llc | 0 | -100,00 | 0 | |||||
| 2026-02-11 | 13F | Simplex Trading, Llc | Put | 0 | -100,00 | 0 | ||||
| 2026-01-12 | 13F | CVA Family Office, LLC | 1.211 | 10.909,09 | 144 | 14.200,00 | ||||
| 2026-02-17 | 13F | Mirabella Financial Services Llp | 3.174 | 376 | ||||||
| 2026-01-29 | 13F | Inscription Capital, LLC | 13.733 | 7,75 | 1.627 | 1,94 | ||||
| 2026-02-13 | 13F | Arkadios Wealth Advisors | 6.803 | 4,68 | 806 | -0,98 | ||||
| 2026-02-06 | 13F | Lsv Asset Management | 2.356.245 | 1,02 | 279 | -4,45 | ||||
| 2026-02-17 | 13F | Janus Henderson Group Plc | 23.206 | 0,00 | 2.749 | -5,50 | ||||
| 2026-02-12 | 13F | Earnest Partners Llc | 1.333.852 | -1,10 | 158.061 | -6,46 | ||||
| 2026-01-29 | 13F | Sanctuary Advisors, LLC | 8.852 | -0,82 | 1.049 | -6,17 | ||||
| 2026-02-17 | 13F | Defiance ETFs, LLC | 316.029 | 38.050 | ||||||
| 2026-01-05 | 13F | GAMMA Investing LLC | 2.352 | 7,45 | 279 | 1,46 | ||||
| 2026-02-03 | 13F | Navigoe, LLC | 8 | 0,00 | 0 | |||||
| 2026-02-13 | 13F | Natixis | 0 | -100,00 | 0 | -100,00 | ||||
| 2026-02-10 | 13F | Godfrey Financial Associates, Inc. | 110 | 13 | ||||||
| 2026-02-06 | 13F | IFP Advisors, Inc | 223 | -7,08 | 26 | -13,33 | ||||
| 2026-02-17 | 13F | State Of Wisconsin Investment Board | 34.048 | -6,72 | 4.035 | -11,79 | ||||
| 2026-01-30 | 13F | Interchange Capital Partners, LLC | 6.392 | 173,05 | 757 | 158,36 | ||||
| 2026-02-13 | 13F | Peak6 Llc | Put | 0 | -100,00 | 0 | -100,00 | |||
| 2025-10-27 | 13F | Sumitomo Mitsui Trust Holdings, Inc. | 0 | -100,00 | 0 | |||||
| 2026-02-13 | 13F | Peak6 Llc | 0 | -100,00 | 0 | -100,00 | ||||
| 2026-02-13 | 13F | Neo Ivy Capital Management | 0 | -100,00 | 0 | -100,00 | ||||
| 2026-02-17 | 13F | Watershed Asset Management, L.L.C. | 3.802 | 451 | ||||||
| 2026-01-29 | 13F | Calamos Wealth Management LLC | 0 | -100,00 | 0 | |||||
| 2026-02-13 | 13F | Martingale Asset Management L P | 38.380 | -0,87 | 4.548 | -6,23 | ||||
| 2026-02-17 | 13F | Css Llc/il | 6.730 | 0,90 | 798 | -4,55 | ||||
| 2026-02-10 | 13F | Savant Capital, LLC | 0 | -100,00 | 0 | |||||
| 2026-02-12 | 13F | Quadrant Capital Group Llc | 3.385 | 0,42 | 401 | -4,98 | ||||
| 2026-01-16 | 13F | Crewe Advisors LLC | 8 | 0,00 | 1 | -100,00 | ||||
| 2026-02-06 | 13F | Gsa Capital Partners Llp | 4.807 | 134,15 | 1 | |||||
| 2025-11-14 | 13F | AXA Investment Managers S.A. | 56.170 | 7.038 | ||||||
| 2026-02-17 | 13F | Aquatic Capital Management LLC | 13.110 | 1.554 | ||||||
| 2026-02-17 | 13F | Tower Research Capital LLC (TRC) | 7.398 | 159,31 | 877 | 145,38 | ||||
| 2026-02-09 | 13F | Investors Portfolio Services LLC | 13 | 1 | ||||||
| 2026-02-17 | 13F | Susquehanna Fundamental Investments, Llc | 61.637 | -23,03 | 7.304 | -27,20 | ||||
| 2026-02-10 | 13F | Bnp Paribas Arbitrage, Sa | 88.395 | 79,29 | 10.475 | 69,56 | ||||
| 2026-02-17 | 13F | Summit Trail Advisors, Llc | 29.321 | 9,16 | 3.475 | 3,24 | ||||
| 2026-02-17 | 13F | Alliancebernstein L.p. | 85.057 | -46,26 | 10.079 | -49,17 | ||||
| 2025-11-13 | 13F | Twin Tree Management, LP | 0 | -100,00 | 0 | -100,00 | ||||
| 2025-10-30 | 13F | Twin Peaks Wealth Advisors, LLC | 0 | -100,00 | 0 | |||||
| 2026-01-27 | 13F | Brighton Jones Llc | 0 | -100,00 | 0 | |||||
| 2026-02-23 | 13F | Mv Capital Management, Inc. | 3 | 0,00 | 0 | |||||
| 2026-02-05 | 13F | HFM Investment Advisors, LLC | 4 | 33,33 | 0 | |||||
| 2026-02-06 | 13F | ProShare Advisors LLC | 8.852 | 23,05 | 1.049 | 16,32 | ||||
| 2026-02-17 | 13F | Zacks Investment Management | 57.084 | 0,46 | 6.764 | -4,99 | ||||
| 2026-01-30 | 13F | United Community Bank | 0 | -100,00 | 0 | |||||
| 2026-02-11 | 13F | O'shaughnessy Asset Management, Llc | 11.880 | 64,00 | 1.408 | 55,13 | ||||
| 2026-02-12 | 13F | Xponance, Inc. | 5.177 | -14,63 | 613 | -19,24 | ||||
| 2026-02-17 | 13F | Cresset Asset Management, LLC | 18.115 | -4,10 | 2.147 | -9,30 | ||||
| 2026-01-27 | 13F | GHP Investment Advisors, Inc. | 105 | 12 | ||||||
| 2026-02-10 | 13F | Commonwealth Of Pennsylvania Public School Empls Retrmt Sys | 12.770 | -3,07 | 1.513 | -8,30 | ||||
| 2026-01-08 | 13F | Tompkins Financial Corp | 15 | 2 | ||||||
| 2026-02-13 | 13F | Edgestream Partners, L.P. | 84.846 | 139,36 | 10.054 | 126,39 | ||||
| 2026-02-12 | 13F | Jane Street Group, Llc | Call | 11.900 | -26,09 | 1.410 | -30,09 | |||
| 2026-02-12 | 13F | Jane Street Group, Llc | 2.722 | -92,11 | 323 | -92,55 | ||||
| 2026-02-12 | 13F | Jane Street Group, Llc | Put | 4.700 | -31,88 | 557 | -35,65 | |||
| 2026-02-17 | 13F | Royal Bank Of Canada | 62.273 | 36,97 | 7.379 | 29,52 | ||||
| 2026-02-13 | 13F | Truvestments Capital Llc | 700 | -4,11 | 83 | -9,89 | ||||
| 2026-02-13 | 13F | Prudential Financial Inc | 36.911 | 25,03 | 4.374 | 18,25 | ||||
| 2026-02-05 | 13F | Atria Investments Llc | 4.396 | 10,48 | 521 | 4,42 | ||||
| 2026-02-11 | 13F | Rise Advisors, LLC | 0 | -100,00 | 0 | -100,00 | ||||
| 2026-02-11 | 13F | Zions Bancorporation, National Association /ut/ | 15 | 2 | ||||||
| 2026-01-16 | 13F | PFS Partners, LLC | 33 | 0,00 | 4 | -25,00 | ||||
| 2026-02-12 | 13F | Principal Securities, Inc. | 0 | -100,00 | 0 | -100,00 | ||||
| 2026-02-17 | 13F | Summit Partners Public Asset Management, Llc | 18.000 | -14,29 | 2.133 | -18,93 | ||||
| 2026-01-08 | 13F | Wealth Enhancement Advisory Services, Llc | 16.507 | 23,53 | 2.031 | 22,64 | ||||
| 2026-02-12 | 13F | Dimensional Fund Advisors Lp | 1.244.258 | 7,15 | 147.452 | 1,36 | ||||
| 2025-11-13 | 13F | GeoWealth Management, LLC | 0 | -100,00 | 0 | -100,00 | ||||
| 2026-02-11 | 13F | Letko, Brosseau & Associates Inc | 450.284 | -0,40 | 53.359 | -5,79 | ||||
| 2026-02-17 | 13F | XTX Topco Ltd | 6.694 | 39,66 | 793 | 32,17 | ||||
| 2026-02-13 | 13F | Ieq Capital, Llc | 56.543 | -35,79 | 6.700 | -39,27 | ||||
| 2026-02-12 | 13F | Haven Private, LLC | 2.658 | 2,43 | 315 | -3,38 | ||||
| 2026-01-28 | 13F | CAPROCK Group, Inc. | 26.045 | 42,96 | 3.086 | 48,37 | ||||
| 2026-02-09 | 13F | Geode Capital Management, Llc | 1.237.758 | 0,19 | 146.698 | -5,24 | ||||
| 2026-01-15 | 13F | Fifth Third Wealth Advisors LLC | 1.729 | -1,71 | 205 | -7,27 | ||||
| 2026-01-08 | 13F | True Wealth Design, LLC | 553 | 0,91 | 66 | -4,41 | ||||
| 2026-02-12 | 13F | BlackRock, Inc. | 4.951.354 | -1,53 | 586.735 | -6,86 | ||||
| 2026-01-15 | 13F | Burns Matteson Capital Management, LLC | 0 | -100,00 | 0 | -100,00 | ||||
| 2026-02-05 | 13F | DnB Asset Management AS | 532.180 | 0,00 | 63.063 | -5,42 | ||||
| 2026-01-28 | 13F | Geneos Wealth Management Inc. | 100 | 0,00 | 12 | -8,33 | ||||
| 2026-02-13 | 13F | Virtus ETF Advisers LLC | 8.600 | 0,00 | 1.019 | -5,39 | ||||
| 2026-02-06 | 13F | Mach-1 Financial Group, Inc. | 6.210 | 736 | ||||||
| 2026-02-13 | 13F/A | Alberta Investment Management Corp | 0 | -100,00 | 0 | -100,00 | ||||
| 2026-02-11 | 13F | Fox Run Management, L.l.c. | 12.859 | 205,73 | 1.524 | 189,54 | ||||
| 2026-02-17 | 13F | Worldquant Millennium Advisors Llc | 34.625 | 58,39 | 4.103 | 49,85 | ||||
| 2026-02-20 | 13F | Sunbelt Securities, Inc. | 5 | 0,00 | 1 | |||||
| 2026-02-17 | 13F | Quantinno Capital Management LP | 778.228 | 30,04 | 92.220 | 23,00 | ||||
| 2026-02-10 | 13F | Bank of New York Mellon Corp | 350.862 | -3,13 | 41.577 | -8,38 | ||||
| 2026-01-14 | 13F | Jfs Wealth Advisors, Llc | 38 | 52,00 | 5 | 33,33 | ||||
| 2026-02-12 | 13F | Swiss National Bank | 101.200 | 1,81 | 11.992 | -3,70 | ||||
| 2026-02-13 | 13F | Entropy Technologies, LP | 0 | -100,00 | 0 | |||||
| 2026-02-12 | 13F | Oak Associates Ltd /oh/ | 41.675 | -4,86 | 4.938 | 98.660,00 | ||||
| 2026-02-17 | 13F | Redwood Investment Management, Llc | 9.191 | -3,00 | 1 | 0,00 | ||||
| 2026-01-12 | 13F | E. Ohman J:or Asset Management AB | 24.084 | 6,39 | 2.854 | 0,60 | ||||
| 2026-02-17 | 13F | California State Teachers Retirement System | 48.724 | 0,67 | 5.774 | -4,80 | ||||
| 2026-01-28 | 13F | HB Wealth Management, LLC | 1.992 | 16,97 | 236 | 10,80 | ||||
| 2026-02-11 | 13F | SOUTH STATE Corp | 11 | 0,00 | 1 | 0,00 | ||||
| 2026-02-17 | 13F | Qube Research & Technologies Ltd | 204.010 | 1,54 | 24.175 | -3,96 | ||||
| 2026-02-05 | 13F | Thrivent Financial For Lutherans | 25.039 | -1,19 | 3 | -33,33 | ||||
| 2026-02-17 | 13F | Fred Alger Management, Llc | 2.470 | -3,21 | 293 | -8,46 | ||||
| 2026-01-16 | 13F | Empirical Financial Services, LLC d.b.a. Empirical Wealth Management | 3.585 | 82,63 | 425 | 73,06 | ||||
| 2026-02-13 | 13F | Citigroup Inc | 52.210 | -8,59 | 6.187 | -13,54 | ||||
| 2026-02-13 | 13F | Smartleaf Asset Management LLC | 329 | -76,25 | 40 | -77,19 | ||||
| 2026-02-17 | 13F | CWM Advisors, LLC | 15.230 | 15,02 | 1.805 | 8,74 | ||||
| 2026-02-17 | 13F | MIRAE ASSET GLOBAL ETFS HOLDINGS Ltd. | 6.185 | 293,70 | 733 | 273,47 | ||||
| 2026-02-10 | 13F | Rothschild Investment Llc | 201 | -47,79 | 24 | -52,08 | ||||
| 2026-01-08 | 13F | Cooper Financial Group | 0 | -100,00 | 0 | |||||
| 2026-01-20 | 13F | Cromwell Holdings LLC | 10 | 0,00 | 1 | 0,00 | ||||
| 2026-02-13 | 13F | Bridgewater Associates, LP | 37.127 | -38,55 | 4.400 | -41,89 | ||||
| 2026-01-29 | 13F | Teachers Retirement System Of The State Of Kentucky | 35.357 | -1,91 | 4 | 0,00 | ||||
| 2026-01-29 | 13F | St Germain D J Co Inc | 1.514 | 179 | ||||||
| 2026-02-13 | 13F | Parkside Financial Bank & Trust | 695 | 1,16 | 82 | -4,65 | ||||
| 2026-01-28 | 13F | Quaker Wealth Management, LLC | 3 | 0,00 | 0 | |||||
| 2026-02-12 | 13F | Ci Investments Inc. | 0 | -100,00 | 0 | |||||
| 2026-01-29 | 13F | Nbc Securities, Inc. | 147 | -0,68 | 17 | -5,56 | ||||
| 2025-10-28 | 13F | Campbell & CO Investment Adviser LLC | 0 | -100,00 | 0 | |||||
| 2025-11-06 | 13F | CBIZ Investment Advisory Services, LLC | 0 | -100,00 | 0 | |||||
| 2026-02-13 | 13F | JustInvest LLC | 9.079 | 5,03 | 1.076 | -0,74 | ||||
| 2025-10-28 | 13F | Qrg Capital Management, Inc. | 0 | -100,00 | 0 | -100,00 | ||||
| 2026-02-09 | 13F | Glenview Trust Co | 11.989 | 0,26 | 1.421 | -5,21 | ||||
| 2026-02-12 | 13F | California Public Employees Retirement System | 96.553 | 0,15 | 11.442 | -5,27 | ||||
| 2026-02-02 | 13F | Sachetta, LLC | 6 | 0,00 | 1 | |||||
| 2026-02-09 | 13F/A | Fideuram - Intesa Sanpaolo Private Banking S.p.a. | 6 | 1 | ||||||
| 2026-02-13 | 13F | Squarepoint Ops LLC | Put | 0 | -100,00 | 0 | -100,00 | |||
| 2026-02-17 | 13F | Advisor Group Holdings, Inc. | 11.716 | -0,39 | 1.388 | -4,34 | ||||
| 2026-01-21 | 13F | Aaron Wealth Advisors LLC | 14.602 | 15,10 | 1.730 | 8,87 | ||||
| 2026-02-13 | 13F | Sterling Capital Management LLC | 5.713 | 80,79 | 677 | 71,14 | ||||
| 2026-02-12 | 13F | State Board Of Administration Of Florida Retirement System | 43.972 | -6,37 | 5.211 | -11,44 | ||||
| 2026-02-13 | 13F | Inspire Advisors, LLC | 1.778 | -9,75 | 211 | -14,63 | ||||
| 2026-01-22 | 13F | Bartlett & Co. Wealth Management Llc | 800 | 300,00 | 95 | 276,00 | ||||
| 2026-01-26 | 13F | Cornerstone Wealth Group, LLC | 2.148 | 25,10 | 255 | 18,14 | ||||
| 2026-02-09 | 13F | Coldstream Capital Management Inc | 2.187 | 8,37 | 259 | 2,78 | ||||
| 2026-01-22 | 13F | Venturi Wealth Management, LLC | 0 | -100,00 | 0 | |||||
| 2026-01-23 | 13F | Robeco Institutional Asset Management B.V. | 436.989 | 26,64 | 51.783 | 19,78 | ||||
| 2026-02-11 | 13F | Vise Technologies, Inc. | 3.415 | 77,68 | 405 | 68,33 | ||||
| 2026-01-23 | 13F | Ritholtz Wealth Management | 6.481 | 51,82 | 768 | 43,63 | ||||
| 2026-02-09 | 13F | Morningstar Investment Management LLC | 5.972 | 0,00 | 1 | |||||
| 2026-02-13 | 13F | Kayne Anderson Rudnick Investment Management Llc | 4 | 0,00 | 0 | |||||
| 2026-02-17 | 13F | Awm Capital, Llc | 2.009 | 0,00 | 238 | -5,18 | ||||
| 2026-02-03 | 13F | NewEdge Wealth, LLC | 10.118 | 21,77 | 1.199 | 20,77 | ||||
| 2026-02-12 | 13F | Penserra Capital Management LLC | 316.029 | 17,02 | 37 | 12,12 | ||||
| 2026-01-09 | 13F | Diversified Trust Co | 8.995 | 0,23 | 1.066 | -5,25 | ||||
| 2026-02-11 | 13F | Vestcor Inc | 5.998 | 0,00 | 1 | |||||
| 2026-02-12 | 13F | New York State Common Retirement Fund | 30.471 | 0,45 | 3.611 | -5,00 | ||||
| 2026-02-10 | 13F | One Capital Management, LLC | 16.508 | 42,78 | 1.956 | 35,08 | ||||
| 2026-02-17 | 13F | Aqr Capital Management Llc | 811.568 | -9,47 | 96.171 | -14,32 | ||||
| 2026-02-17 | 13F | Delaware Management Holdings, Inc. | 18.427 | 2.183 | ||||||
| 2026-02-11 | 13F | Meeder Asset Management Inc | 15.241 | 1.806 | ||||||
| 2026-01-23 | 13F | Private Wealth Management Group, LLC | 48 | 0,00 | 6 | -16,67 | ||||
| 2026-02-17 | 13F | SageView Advisory Group, LLC | 1 | 0 | ||||||
| 2026-02-13 | 13F | Axa S.a. | 4.229 | -14,67 | 501 | -19,19 | ||||
| 2026-02-13 | 13F | State Street Corp | 1.939.124 | -0,03 | 229.786 | -5,45 | ||||
| 2026-02-09 | 13F | Jackson Creek Investment Advisors LLC | 7.091 | -1,18 | 1 | |||||
| 2026-02-17 | 13F | Capital Fund Management S.a. | 23.943 | -56,15 | 2.837 | -58,53 | ||||
| 2025-11-14 | 13F | Scientech Research LLC | 0 | -100,00 | 0 | -100,00 | ||||
| 2026-01-27 | 13F | Meritage Portfolio Management | 2.137 | -17,78 | 253 | -22,15 | ||||
| 2026-02-05 | 13F | Dana Investment Advisors, Inc. | 66.266 | -0,14 | 7.853 | -5,56 | ||||
| 2026-02-17 | 13F/A | RBF Capital, LLC | 20.000 | 0,00 | 2.370 | -5,39 | ||||
| 2025-11-14 | 13F | Balyasny Asset Management Llc | 0 | -100,00 | 0 | |||||
| 2026-01-20 | 13F | AdvisorNet Financial, Inc | 12 | 0,00 | 1 | 0,00 | ||||
| 2026-02-02 | 13F | Principal Financial Group Inc | 109.784 | -3,70 | 13.009 | -8,92 | ||||
| 2026-02-05 | 13F | Td Private Client Wealth Llc | 2.507 | -3,91 | 297 | -8,90 | ||||
| 2026-02-11 | 13F | Group One Trading, L.p. | Call | 0 | -100,00 | 0 | -100,00 | |||
| 2026-02-11 | 13F | Group One Trading, L.p. | Put | 0 | -100,00 | 0 | -100,00 | |||
| 2026-01-28 | 13F | Arizona State Retirement System | 14.293 | -5,78 | 1.694 | -10,89 | ||||
| 2026-02-10 | 13F | Bruce G. Allen Investments, LLC | 8 | 0,00 | 1 | -100,00 | ||||
| 2025-11-14 | 13F | Wolverine Trading, Llc | 4.155 | 515 | ||||||
| 2025-11-14 | 13F | Wolverine Trading, Llc | Call | 16.000 | 14,29 | 1.985 | 33,78 | |||
| 2025-11-14 | 13F | Wolverine Trading, Llc | Put | 3.000 | 30,43 | 372 | 53,09 | |||
| 2026-02-13 | 13F | Squarepoint Ops LLC | 206.684 | -4,66 | 24.492 | -9,82 | ||||
| 2026-02-12 | 13F | Brown Brothers Harriman & Co | 158 | 0,00 | 19 | -5,26 | ||||
| 2026-02-05 | 13F | John G Ullman & Associates Inc | 3.900 | 0,00 | 462 | -5,33 | ||||
| 2026-02-17 | 13F | Mercer Global Advisors Inc /adv | 22.120 | 25,14 | 2.621 | 18,38 | ||||
| 2025-11-14 | 13F | Boothbay Fund Management, Llc | 0 | -100,00 | 0 | -100,00 | ||||
| 2026-02-13 | 13F | Walleye Trading LLC | 0 | -100,00 | 0 | -100,00 | ||||
| 2026-01-30 | 13F | Kohmann Bosshard Financial Services, LLC | 280 | 33 | ||||||
| 2026-02-05 | 13F | 1620 Investment Advisors, Inc. | 670 | 0,75 | 79 | -4,82 | ||||
| 2026-02-06 | 13F | Pzena Investment Management Llc | 2.222 | 0,00 | 263 | -5,40 | ||||
| 2026-02-17 | 13F | Price T Rowe Associates Inc /md/ | 276.554 | -33,89 | 33 | -38,46 | ||||
| 2025-11-14 | 13F | ISAM Funds (UK) Ltd | 0 | -100,00 | 0 | |||||
| 2026-02-05 | 13F | Elyxium Wealth, LLC | 79 | 9 | ||||||
| 2026-02-04 | 13F | Oregon Public Employees Retirement Fund | 10.219 | -1,50 | 1.211 | -6,85 | ||||
| 2026-02-09 | 13F | Hantz Financial Services, Inc. | 917 | 43,28 | 0 | |||||
| 2026-02-02 | 13F | Bay Harbor Wealth Management, LLC | 6 | 50,00 | 1 | |||||
| 2026-02-06 | 13F | Banque Cantonale Vaudoise | 551 | 81,85 | 65 | |||||
| 2026-02-17 | 13F | Northern Trust Corp | 439.911 | -3,74 | 52.129 | -8,96 | ||||
| 2026-02-17 | 13F | Summit Global Investments | 0 | -100,00 | 0 | |||||
| 2026-02-11 | 13F | Group One Trading, L.p. | 70 | 8 | ||||||
| 2026-02-09 | 13F | Royce & Associates Lp | 668.334 | -6,40 | 79.198 | -11,47 | ||||
| 2026-02-10 | 13F | Connor, Clark & Lunn Investment Management Ltd. | 53.681 | 32,69 | 6.361 | 25,51 | ||||
| 2025-11-03 | 13F | Stonegate Investment Group, LLC | 2.298 | 6,19 | 288 | 27,56 | ||||
| 2026-02-06 | 13F | Cullen/frost Bankers, Inc. | 385 | 7,84 | 46 | 2,27 | ||||
| 2026-02-13 | 13F | Colony Group, LLC | 29.066 | 262,60 | 3.444 | 293,60 | ||||
| 2026-02-17 | 13F | Schonfeld Strategic Advisors LLC | 0 | -100,00 | 0 | |||||
| 2026-02-17 | 13F | Gotham Asset Management, LLC | 230.556 | 22,12 | 27.321 | 15,50 | ||||
| 2026-01-15 | 13F | Highline Wealth Partners Llc | 3 | 0,00 | 0 | |||||
| 2026-02-11 | 13F | Erste Asset Management GmbH | 0 | 0 | ||||||
| 2026-01-20 | 13F | SS&H Financial Advisors, Inc. | 3.700 | 0,00 | 0 | -100,00 | ||||
| 2026-02-09 | 13F | Community Bank & Trust, Waco, Texas | 3.500 | 0,00 | 0 | |||||
| 2026-02-13 | 13F | Morgan Stanley | 629.527 | 2,93 | 74.599 | -2,64 | ||||
| 2026-02-13 | 13F | Panagora Asset Management Inc | 218.025 | -10,31 | 25.836 | -15,17 | ||||
| 2026-02-13 | 13F | Headlands Technologies LLC | 5.203 | 617 | ||||||
| 2026-02-17 | 13F | Public Employees Retirement System Of Ohio | 17.321 | -3,50 | 2.053 | -8,72 | ||||
| 2025-11-10 | 13F | Optiver Holding B.V. | 0 | -100,00 | 0 | |||||
| 2026-01-28 | 13F | DekaBank Deutsche Girozentrale | 1.994 | 0,00 | 0 | |||||
| 2026-01-16 | 13F | First Pacific Financial | 57 | 7 | ||||||
| 2026-02-17 | 13F | Jones Financial Companies Lllp | 709 | -7,92 | 84 | -13,40 | ||||
| 2026-01-09 | 13F | SG Americas Securities, LLC | 19.788 | -88,44 | 2 | -90,48 | ||||
| 2025-11-14 | 13F | PineBridge Investments, L.P. | 5.179 | -84,37 | 649 | -81,24 | ||||
| 2026-02-06 | 13F | Larson Financial Group LLC | 565 | 106,20 | 67 | 94,12 | ||||
| 2026-02-12 | 13F | denkapparat Operations GmbH | 4.866 | 0,00 | 577 | -5,42 | ||||
| 2026-02-13 | 13F | Healthcare Of Ontario Pension Plan Trust Fund | 0 | -100,00 | 0 | |||||
| 2026-02-09 | 13F | Hartland & Co., LLC | 560 | 153,39 | 66 | 144,44 | ||||
| 2026-02-17 | 13F | Caisse De Depot Et Placement Du Quebec | 430.134 | -18,06 | 50.971 | -22,51 | ||||
| 2025-11-07 | 13F | Shell Asset Management Co | 1.347 | -59,66 | 0 | |||||
| 2026-01-23 | 13F | Rsm Us Wealth Management Llc | 6.236 | 10,08 | 751 | 5,78 | ||||
| 2026-02-17 | 13F | Voloridge Investment Management, Llc | 190.682 | 22,46 | 22.596 | 15,82 | ||||
| 2026-02-12 | 13F/A | Pinebridge Investments Llc | 11.743 | 1.392 | ||||||
| 2026-02-03 | 13F | Farmers & Merchants Investments Inc | 48 | 0,00 | 6 | -16,67 | ||||
| 2026-02-24 | 13F | Bell Investment Advisors, Inc | 95 | 66,67 | 11 | 57,14 | ||||
| 2026-01-14 | 13F | Thompson Investment Management, Inc. | 0 | -100,00 | 0 | |||||
| 2026-02-10 | 13F | Nomura Asset Management Co Ltd | 280 | 0,00 | 33 | -5,71 | ||||
| 2026-02-11 | 13F | Janney Montgomery Scott LLC | 5.575 | -13,07 | 1 | |||||
| 2026-02-12 | 13F | Cloud Capital Management, LLC | 0 | -100,00 | 0 | |||||
| 2026-02-13 | 13F | Umb Bank N A/mo | 643 | 11,44 | 76 | 5,56 | ||||
| 2026-02-17 | 13F | Dark Forest Capital Management Lp | 0 | -100,00 | 0 | |||||
| 2025-11-12 | 13F | R Squared Ltd | 0 | -100,00 | 0 | |||||
| 2026-02-17 | 13F | Summit Partners Public Asset Management, Llc | Call | 0 | -100,00 | 0 | ||||
| 2026-02-02 | 13F | Hussman Strategic Advisors, Inc. | 10.500 | 1.244 | ||||||
| 2026-01-07 | 13F | Sagespring Wealth Partners, Llc | 2.161 | 256 | ||||||
| 2026-01-21 | 13F | Capital Advisors, Ltd. LLC | 4 | 0,00 | 0 | |||||
| 2026-02-10 | 13F | Root Financial Partners, LLC | 175 | 31,58 | 21 | 25,00 | ||||
| 2026-02-10 | 13F | Natixis Advisors, L.p. | 260.657 | 31,47 | 31 | 25,00 | ||||
| 2026-01-14 | 13F | Wolff Wiese Magana Llc | 70 | 0,00 | 8 | 0,00 | ||||
| 2026-02-13 | 13F | Caitong International Asset Management Co., Ltd | 0 | -100,00 | 0 | |||||
| 2026-02-18 | 13F | EP Wealth Advisors, Inc. | 6.267 | 9,20 | 743 | 24,08 | ||||
| 2025-11-14 | 13F | Nissay Asset Management Corp /japan/ /adv | 0 | -100,00 | 0 | |||||
| 2026-02-19 | 13F | Invesco Ltd. | 642.501 | 133,63 | 76.136 | 120,97 | ||||
| 2026-02-13 | 13F | First Trust Advisors Lp | 352.786 | 14,27 | 41.805 | 8,08 | ||||
| 2026-02-13 | 13F | Van Eck Associates Corp | 84.081 | 0,80 | 10 | -10,00 | ||||
| 2026-02-13 | 13F | Boston Partners | 222.247 | -6,73 | 26.501 | -11,45 | ||||
| 2026-02-17 | 13F | Bank Of America Corp /de/ | Call | 0 | -100,00 | 0 | ||||
| 2026-02-20 | 13F | Kovitz Investment Group Partners, LLC | 1.896 | -78,89 | 225 | -80,09 | ||||
| 2026-02-17 | 13F | Grantham, Mayo, Van Otterloo & Co. LLC | 233.062 | -38,02 | 27.618 | -41,38 | ||||
| 2026-01-28 | 13F | Chicago Partners Investment Group LLC | 7.628 | 14,07 | 971 | 7,65 | ||||
| 2026-02-13 | 13F | Treasurer of the State of North Carolina | 115.018 | -21,17 | 14 | -27,78 | ||||
| 2026-02-17 | 13F | Utah Retirement Systems | 2.699 | 0,00 | 320 | -5,62 | ||||
| 2025-10-07 | 13F | Oak Thistle LLC | 0 | -100,00 | 0 | |||||
| 2026-01-08 | 13F | Occidental Asset Management, LLC | 1.911 | 226 | ||||||
| 2026-02-03 | 13F | Sequoia Financial Advisors, LLC | 4.931 | 42,27 | 584 | 34,56 | ||||
| 2026-01-13 | 13F | Mather Group, Llc. | 0 | -100,00 | 0 | |||||
| 2026-01-27 | 13F | Financial Management Professionals, Inc. | 2.236 | 44.620,00 | 265 | |||||
| 2026-02-12 | 13F | Elo Mutual Pension Insurance Co | 14.328 | 36,91 | 1.698 | 29,44 | ||||
| 2026-02-17 | 13F | Cetera Investment Advisers | 19.026 | -7,03 | 2.255 | -12,06 | ||||
| 2026-02-12 | 13F | Colonial Trust Advisors | 0 | -100,00 | 0 | |||||
| 2026-02-13 | 13F | Victory Capital Management Inc | 23.390 | -25,80 | 2.772 | -29,83 | ||||
| 2025-11-12 | 13F | NewSquare Capital LLC | 0 | -100,00 | 0 | -100,00 | ||||
| 2026-01-08 | 13F | Adirondack Trust Co | 100 | 0,00 | 12 | -8,33 | ||||
| 2026-02-11 | 13F | Los Angeles Capital Management Llc | 16.757 | 0,00 | 2.221 | 5,81 | ||||
| 2026-02-17 | 13F | Ancora Advisors, LLC | 67 | 8 | ||||||
| 2026-01-30 | 13F | American Capital Advisory, LLC | 3 | 0,00 | 0 | |||||
| 2026-01-28 | 13F | WPG Advisers, LLC | 66 | 0,00 | 8 | -12,50 | ||||
| 2026-02-17 | 13F | Wellington Management Group Llp | 1.575.051 | -1,64 | 186.644 | -6,97 | ||||
| 2026-01-08 | 13F | Chesapeake Asset Management Llc | 58 | 7 | ||||||
| 2026-02-13 | 13F | Marshall Wace, Llp | 3.086 | -93,46 | 366 | -93,82 | ||||
| 2026-02-17 | 13F | Altshuler Shaham Ltd | 34 | 4 | ||||||
| 2026-02-11 | 13F | Cerity Partners LLC | 34.941 | 155,16 | 4.141 | 141,40 | ||||
| 2025-12-16 | 13F | Lindenwold Advisors | 4.246 | 0,93 | 532 | 21,23 | ||||
| 2026-02-05 | 13F | Navalign, LLC | 23 | 3 | ||||||
| 2026-02-13 | 13F | American Century Companies Inc | 237.367 | 194,43 | 28.128 | 178,49 | ||||
| 2026-01-29 | 13F | Vanguard Group Inc | 6.477.451 | -2,19 | 767.578 | -7,49 | ||||
| 2026-01-09 | 13F | Zrc Wealth Management, Llc | 159 | 329,73 | 19 | 350,00 | ||||
| 2026-02-17 | 13F | Two Sigma Investments, Lp | 84.296 | 454,54 | 9.989 | 424,63 | ||||
| 2026-02-11 | 13F | Syon Capital Llc | 10.018 | 1.187 | ||||||
| 2026-02-12 | 13F | Federated Hermes, Inc. | 58.890 | 31,06 | 6.978 | 23,97 | ||||
| 2026-02-13 | 13F | Fieldview Capital Management, LLC | 2.299 | 272 | ||||||
| 2026-01-22 | 13F | Harwood Advisory Group, LLC | 151 | 0,00 | 18 | -5,56 | ||||
| 2026-01-28 | 13F | Salomon & Ludwin, LLC | 33 | 0,00 | 4 | -25,00 | ||||
| 2026-02-13 | 13F | Stifel Financial Corp | 69.913 | 97,17 | 8.285 | 86,52 | ||||
| 2026-02-11 | 13F | Ameritas Investment Partners, Inc. | 9.352 | 1.108 | ||||||
| 2026-02-17 | 13F | Fmr Llc | 1.185.669 | 15,33 | 140.502 | 9,08 | ||||
| 2026-01-14 | 13F | Exchange Traded Concepts, Llc | 2.060 | 244 | ||||||
| 2026-01-26 | 13F | Moran Wealth Management, LLC | 45.067 | -5,96 | 5.340 | -11,06 | ||||
| 2026-02-11 | 13F | Illinois Municipal Retirement Fund | 32.893 | -16,13 | 3.898 | -20,68 | ||||
| 2026-02-17 | 13F | D. E. Shaw & Co., Inc. | 77.106 | 3.404,82 | 9.137 | 3.222,55 | ||||
| 2026-02-13 | 13F | Police & Firemen's Retirement System of New Jersey | 21.415 | -6,55 | 2.538 | -11,63 | ||||
| 2026-02-17 | 13F | Glenmede Trust Co Na | 127.381 | -21,18 | 15.095 | -6,28 | ||||
| 2026-02-17 | 13F | Polar Asset Management Partners Inc. | 0 | -100,00 | 0 | -100,00 | ||||
| 2026-02-09 | 13F | Harbour Investments, Inc. | 261 | -23,46 | 31 | -28,57 | ||||
| 2026-02-17 | 13F | Capstone Investment Advisors, Llc | 0 | -100,00 | 0 | -100,00 | ||||
| 2026-01-30 | 13F | New York State Teachers Retirement System | 58.873 | -2,30 | 7 | -14,29 | ||||
| 2026-01-23 | 13F | Optima Capital Llc | 15 | 2 | ||||||
| 2026-01-29 | 13F | Comerica Bank | 14.002 | -2,49 | 1.659 | -7,78 | ||||
| 2025-11-14 | 13F | Binnacle Investments Inc | 26 | 188,89 | 3 | |||||
| 2026-02-09 | 13F | MQS Management LLC | 2.659 | 315 | ||||||
| 2026-01-30 | 13F | Camden Capital, LLC | 4.810 | 33,72 | 570 | 26,44 | ||||
| 2026-02-13 | 13F | Kestra Advisory Services, LLC | 307 | 36 | ||||||
| 2025-11-14 | 13F | Woodline Partners LP | 0 | -100,00 | 0 | |||||
| 2026-01-15 | 13F | Fortitude Family Office, LLC | 11 | -26,67 | 1 | 0,00 | ||||
| 2026-02-10 | 13F | Norges Bank | 587.966 | 69.674 | ||||||
| 2026-02-17 | 13F | Voleon Capital Management Lp | 2.337 | -70,03 | 277 | -71,72 | ||||
| 2025-10-24 | 13F | Hemington Wealth Management | 88 | -2,22 | 0 | |||||
| 2026-02-11 | 13F | Jpmorgan Chase & Co | 280.942 | -2,55 | 33.292 | -7,83 | ||||
| 2026-01-29 | 13F | Rakuten Securities, Inc. | 2 | -77,78 | 0 | -100,00 | ||||
| 2026-02-10 | 13F | Impact Partnership Wealth, LLC | 3.780 | 20,34 | 448 | 13,74 | ||||
| 2026-01-14 | 13F | USA Financial Portformulas Corp | 8 | 1 | ||||||
| 2025-11-10 | 13F | Semanteon Capital Management, LP | 0 | -100,00 | 0 | |||||
| 2026-01-29 | 13F | State Of Michigan Retirement System | 12.041 | -1,63 | 1.427 | -6,98 | ||||
| 2026-02-11 | 13F | Inceptionr Llc | 0 | -100,00 | 0 | |||||
| 2026-01-29 | 13F | UMA Financial Services, Inc. | 8 | 100,00 | 1 | |||||
| 2026-01-23 | 13F | Farther Finance Advisors, LLC | 2.632 | -12,03 | 312 | -16,84 | ||||
| 2026-01-30 | 13F | Mitsubishi UFJ Trust & Banking Corp | 28.549 | 7,42 | 3.383 | 1,62 | ||||
| 2026-02-06 | 13F | Handelsbanken Fonder AB | 16.095 | -0,62 | 2 | -50,00 | ||||
| 2026-02-17 | 13F | Guggenheim Capital Llc | 9.393 | -0,49 | 1.113 | -5,84 | ||||
| 2026-01-09 | 13F | Somerset Trust Co | 3.555 | -0,17 | 421 | -5,61 | ||||
| 2026-01-29 | 13F | Quent Capital, LLC | 611 | 1,16 | 72 | -4,00 | ||||
| 2026-01-27 | 13F | Lecap Asset Management Ltd | 7.495 | 888 | ||||||
| 2026-01-22 | 13F | Triad Wealth Partners, LLC | 5.159 | 611 | ||||||
| 2026-02-03 | 13F | Denali Advisors Llc | 4.207 | 61,37 | 499 | 52,76 | ||||
| 2026-01-27 | 13F | Krilogy Financial LLC | 1.824 | -0,05 | 234 | 7,37 | ||||
| 2026-02-13 | 13F | Toroso Investments, LLC | 6.593 | -1,02 | 781 | -6,35 | ||||
| 2026-02-17 | 13F | Coppell Advisory Solutions LLC | 26.993 | 11,50 | 3.250 | 8,23 | ||||
| 2026-02-02 | 13F | Total Clarity Wealth Management, Inc. | 0 | -100,00 | 0 | |||||
| 2025-11-14 | 13F | Virtu Financial LLC | 0 | -100,00 | 0 | |||||
| 2026-02-17 | 13F | Ameriprise Financial Inc | 77.020 | -5,51 | 9.128 | -10,62 | ||||
| 2026-02-12 | 13F | Aviva Plc | 8.981 | 3,90 | 1.064 | -1,75 | ||||
| 2026-02-17 | 13F | Canada Pension Plan Investment Board | 149.600 | 98,41 | 17.728 | 87,67 | ||||
| 2026-02-11 | 13F | First Command Advisory Services, Inc. | 16 | 2 | ||||||
| 2025-11-06 | 13F | Abich Financial Wealth Management LLC | 368 | 2.353,33 | 46 | 4.500,00 | ||||
| 2026-01-26 | 13F | KBC Group NV | 1.326 | 0,00 | 0 | |||||
| 2026-02-06 | 13F | Pnc Financial Services Group, Inc. | 10.128 | 314,74 | 1.200 | 293,44 | ||||
| 2026-02-13 | 13F | Public Employees Retirement Association Of Colorado | 5.022 | 0,00 | 1 | |||||
| 2026-02-17 | 13F | Prelude Capital Management, Llc | 2.693 | 319 | ||||||
| 2026-02-23 | 13F | Kera Capital Partners, Inc. | 7.662 | 49,91 | 999 | 55,94 | ||||
| 2026-01-15 | 13F | Retirement Systems of Alabama | 81.943 | -0,99 | 9.710 | -6,36 | ||||
| 2026-02-12 | 13F | Callan Family Office, LLC | 7.495 | 102,46 | 888 | 91,79 | ||||
| 2026-01-30 | 13F/A | M&t Bank Corp | 4.043 | 111,34 | 479 | 99,58 | ||||
| 2026-02-12 | 13F | Ensign Peak Advisors, Inc | 8.198 | -3,60 | 971 | -8,83 | ||||
| 2026-02-12 | 13F | BRYN MAWR TRUST Co | 4.675 | -1,54 | 554 | -6,90 | ||||
| 2026-02-13 | 13F | BNP Paribas Asset Management Holding S.A. | 83.692 | 15.006,86 | 10 | |||||
| 2026-02-17 | 13F | TCG Advisory Services, LLC | 4.587 | 544 | ||||||
| 2026-02-02 | 13F | CENTRAL TRUST Co | 1 | 0 | ||||||
| 2026-01-07 | 13F | CWA Asset Management Group, LLC | 22.196 | 5,52 | 2.630 | -0,19 | ||||
| 2026-01-26 | 13F | Reyes Financial Architecture, Inc. | 598 | -21,21 | 71 | -26,32 | ||||
| 2026-02-10 | 13F/A | Northwestern Mutual Wealth Management Co | 2.477 | -2,29 | 294 | -7,57 | ||||
| 2026-02-17 | 13F | Spears Abacus Advisors LLC | 10.693 | 1.267 | ||||||
| 2026-01-15 | 13F | Foster & Motley Inc | 21.428 | 139,63 | 3 | 100,00 | ||||
| 2026-01-30 | 13F | Cardinal Capital Management | 23.790 | 0,55 | 2.819 | -4,89 | ||||
| 2026-02-17 | 13F | Amundi | 85.045 | 87,59 | 10.078 | 73,62 | ||||
| 2026-02-03 | 13F | Bokf, Na | 16.491 | -12,31 | 1.954 | -17,06 | ||||
| 2026-02-12 | 13F | Wealthspire Advisors, LLC | 0 | -100,00 | 0 | |||||
| 2026-02-03 | 13F | Crossmark Global Holdings, Inc. | 59.111 | 2,20 | 7.005 | -3,34 | ||||
| 2025-11-14 | 13F | Texas Permanent School Fund | 0 | -100,00 | 0 | |||||
| 2026-02-04 | 13F | Pacer Advisors, Inc. | 0 | -100,00 | 0 | |||||
| 2026-02-17 | 13F | Man Group plc | 99.076 | 345,87 | 11.741 | 321,70 | ||||
| 2026-02-18 | 13F/A | Fuller & Thaler Asset Management, Inc. | 1.578.555 | 0,72 | 187.059 | -4,74 | ||||
| 2026-02-10 | 13F | Principia Wealth Advisory, LLC | 8 | 0,00 | 1 | -100,00 | ||||
| 2026-02-11 | 13F | Simplex Trading, Llc | 210 | -97,87 | 25 | 2.300,00 | ||||
| 2026-02-17 | 13F/A | Beverly Hills Private Wealth, LLC | 2.954 | -2,64 | 350 | -7,89 | ||||
| 2026-02-11 | 13F | Simplex Trading, Llc | Call | 800 | -42,86 | 95 | ||||
| 2026-02-13 | 13F | Dynamic Technology Lab Private Ltd | 4.670 | 553 | ||||||
| 2026-02-10 | 13F | Intech Investment Management Llc | 17.932 | -1,63 | 2.125 | -6,96 | ||||
| 2026-01-15 | 13F | Vaughan Nelson Investment Management, L.p. | 388.225 | 546,33 | 46.005 | 511,35 | ||||
| 2026-01-08 | 13F | Versant Capital Management, Inc | 5.913 | 14,11 | 701 | 7,86 | ||||
| 2025-12-03 | 13F | Severin Investments, LLC | 0 | -100,00 | 0 | -100,00 | ||||
| 2026-01-27 | 13F | Optas, LLC | 8.030 | 298,71 | 952 | 277,38 | ||||
| 2026-02-12 | 13F | Renaissance Technologies Llc | 152.043 | 44,09 | 18.017 | 36,29 | ||||
| 2026-02-06 | 13F | EverSource Wealth Advisors, LLC | 1.211 | -1,22 | 144 | -6,54 | ||||
| 2026-02-06 | 13F | Leonteq Securities AG | 107 | 0,00 | 13 | -7,69 | ||||
| 2026-02-10 | 13F | Sivia Capital Partners, LLC | 1.859 | 0,00 | 220 | -5,17 | ||||
| 2025-11-14 | 13F | Point72 Asia (Singapore) Pte. Ltd. | 0 | -100,00 | 0 | |||||
| 2026-01-23 | 13F | State of Alaska, Department of Revenue | 56.759 | -0,64 | 7 | -14,29 | ||||
| 2026-01-26 | 13F | Merit Financial Group, LLC | 5.673 | 9,50 | 672 | 3,54 | ||||
| 2025-11-14 | 13F | Full Sail Capital, LLC | 1.837 | 230 | ||||||
| 2026-02-13 | 13F | Bank Of Nova Scotia | 14.100 | 1.671 | ||||||
| 2026-02-18 | 13F | State of Tennessee, Treasury Department | 23.785 | -5,48 | 3.100 | -1,65 | ||||
| 2026-02-19 | 13F | Mcguire Capital Advisors Inc | 29 | 3 | ||||||
| 2026-02-13 | 13F | Journey Strategic Wealth Llc | 1.727 | 0,12 | 205 | -5,56 | ||||
| 2026-02-13 | 13F | S&t Bank/pa | 0 | -100,00 | 0 | |||||
| 2026-02-17 | 13F | Ameriflex Group, Inc. | 57 | -50,00 | 7 | -57,14 | ||||
| 2026-01-28 | 13F | Teacher Retirement System Of Texas | 15.520 | -24,68 | 1.839 | -28,75 | ||||
| 2026-02-13 | 13F | Jacobs Levy Equity Management, Inc | 466.766 | 54,88 | 55.312 | 46,48 | ||||
| 2026-02-13 | 13F | Brown Advisory Inc | 3.031 | 15,51 | 359 | 9,45 | ||||
| 2026-01-27 | 13F | Evergreen Capital Management Llc | 13.631 | 276,86 | 1.615 | 256,51 | ||||
| 2026-01-22 | 13F | Bear Mountain Capital, Inc. | 0 | -100,00 | 0 | |||||
| 2026-02-13 | 13F | Quarry LP | 50 | 6 | ||||||
| 2026-02-02 | 13F | CX Institutional | 10 | 0,00 | 0 | |||||
| 2025-11-14 | 13F | Centiva Capital, LP | 0 | -100,00 | 0 | |||||
| 2026-02-13 | 13F | Kilter Group LLC | 19 | 2 | ||||||
| 2026-02-05 | 13F | Allworth Financial LP | 7.069 | 0,20 | 838 | -5,21 | ||||
| 2026-02-09 | 13F | New Age Alpha Advisors, LLC | 12.349 | 4,84 | 1.463 | -0,81 | ||||
| 2026-02-10 | 13F | Baker Avenue Asset Management, LP | 11.848 | 8,01 | 1.404 | 2,11 | ||||
| 2025-11-13 | 13F | Winton Capital Group Ltd | 0 | -100,00 | 0 | -100,00 | ||||
| 2026-02-17 | 13F | Russell Investments Group, Ltd. | 146.064 | 22,18 | 17.374 | 16,18 | ||||
| 2026-02-11 | 13F | LPL Financial LLC | 10.282 | -23,65 | 1.218 | -27,80 | ||||
| 2026-01-20 | 13F | Thurston, Springer, Miller, Herd & Titak, Inc. | 175 | 21 | ||||||
| 2026-02-12 | 13F | Skandinaviska Enskilda Banken AB (publ) | 15.248 | 0,00 | 1.807 | -5,45 | ||||
| 2026-02-10 | 13F | CIBC Asset Management Inc | 1.702 | 0,00 | 202 | -5,63 | ||||
| 2025-11-14 | 13F | Sherbrooke Park Advisers Llc | 0 | -100,00 | 0 | |||||
| 2026-02-10 | 13F | Quantbot Technologies LP | 0 | -100,00 | 0 | |||||
| 2026-02-11 | 13F | Financiere des Professionnels - Fonds d,investissement inc. | 4.622 | 0,00 | 548 | -5,53 | ||||
| 2026-02-04 | 13F | Swiss Life Asset Management Ltd | 4.218 | 72,73 | 500 | 63,61 | ||||
| 2025-10-31 | 13F | Symphony Financial, Ltd. Co. | 0 | -100,00 | 0 | -100,00 | ||||
| 2025-11-13 | 13F | Farringdon Capital, Ltd. | 0 | -100,00 | 0 | |||||
| 2026-02-13 | 13F | Integrated Wealth Concepts LLC | 0 | -100,00 | 0 | |||||
| 2026-02-04 | 13F | Securian Asset Management, Inc | 3.644 | -5,20 | 432 | -10,40 | ||||
| 2026-02-06 | 13F | Addison Advisors LLC | 23 | 0,00 | 3 | 0,00 | ||||
| 2026-03-06 | 13F | Hsbc Holdings Plc | 5.559 | -56,88 | 663 | -59,00 | ||||
| 2026-02-13 | 13F | Manufacturers Life Insurance Company, The | 0 | -100,00 | 0 | |||||
| 2026-01-20 | 13F | Signaturefd, Llc | 1.361 | -1,66 | 161 | -6,94 | ||||
| 2026-02-13 | 13F | Great West Life Assurance Co /can/ | 30.190 | -22,76 | 4 | -25,00 | ||||
| 2025-11-14 | 13F | Peak6 Llc | Call | 0 | -100,00 | 0 | -100,00 | |||
| 2026-02-17 | 13F | Millennium Management Llc | 289.330 | -36,45 | 34.286 | -39,89 | ||||
| 2026-01-22 | 13F | Massachusetts Financial Services Co /ma/ | 105.107 | 18,60 | 12.455 | 12,18 | ||||
| 2026-01-23 | 13F | Westside Investment Management, Inc. | 279 | 0,00 | 33 | -2,94 | ||||
| 2026-01-30 | 13F | Ares Financial Consulting, LLC | 7 | 1 | ||||||
| 2026-02-03 | 13F | Mitsubishi UFJ Kokusai Asset Management Co., Ltd. | 59 | 0,00 | 7 | 0,00 | ||||
| 2026-02-17 | 13F | Hancock Whitney Corp | 8.395 | 0,78 | 995 | -4,70 | ||||
| 2026-02-17 | 13F | Lazard Asset Management Llc | 236.475 | -9,98 | 28.022 | -14,86 | ||||
| 2026-02-17 | 13F | Tudor Investment Corp Et Al | 20.643 | 2.446 | ||||||
| 2026-02-10 | 13F | Goldman Sachs Group Inc | 128.259 | 26,52 | 15.199 | 19,66 | ||||
| 2026-02-12 | 13F | Steward Partners Investment Advisory, Llc | 484 | -21,94 | 57 | -25,97 | ||||
| 2026-02-10 | 13F | State of Wyoming | 1.130 | -82,69 | 134 | -83,72 | ||||
| 2026-02-05 | 13F | Arbejdsmarkedets Tillaegspension | 185.552 | 21.988 | ||||||
| 2026-02-13 | 13F | Verition Fund Management LLC | 42.697 | 24,09 | 5.060 | 17,38 | ||||
| 2025-10-30 | 13F | Rakuten Investment Management, Inc. | 0 | -100,00 | 0 | |||||
| 2026-02-05 | 13F | North Dakota State Investment Board | 1.807 | 214 | ||||||
| 2026-02-12 | 13F | Alps Advisors Inc | 3.936 | 0,85 | 466 | -4,70 | ||||
| 2026-02-03 | 13F | SBI Securities Co., Ltd. | 42 | 0,00 | 5 | -20,00 | ||||
| 2026-02-17 | 13F | Engineers Gate Manager LP | 40.911 | 71,94 | 4.848 | 62,60 | ||||
| 2026-01-15 | 13F | Nisa Investment Advisors, Llc | 52 | -57,38 | 6 | -60,00 | ||||
| 2026-01-27 | 13F | WealthCollab, LLC | 140 | 8,53 | 17 | 0,00 | ||||
| 2026-01-23 | 13F | Assetmark, Inc | 633 | 2.537,50 | 75 | 2.400,00 | ||||
| 2026-01-30 | 13F | Us Bancorp \de\ | 2.683 | 1,44 | 318 | -4,23 | ||||
| 2026-01-16 | 13F | Louisiana State Employees Retirement System | 14.100 | -1,40 | 1.671 | -6,76 | ||||
| 2026-02-10 | 13F | Mutual Of America Capital Management Llc | 21.238 | -10,41 | 2.517 | -15,29 | ||||
| 2026-02-13 | 13F | Aviso Wealth Management | 2.080 | -8,77 | 246 | -13,68 | ||||
| 2026-01-28 | 13F | Universal- Beteiligungs- und Servicegesellschaft mbH | 129.880 | 9,81 | 15.391 | 3,86 | ||||
| 2025-11-10 | 13F | Counterpoint Mutual Funds LLC | 0 | -100,00 | 0 | |||||
| 2025-11-14 | 13F | ExodusPoint Capital Management, LP | 0 | -100,00 | 0 | -100,00 | ||||
| 2025-11-12 | 13F | Aster Capital Management (DIFC) Ltd | 0 | -100,00 | 0 | |||||
| 2026-01-23 | 13F | Burney Co/ | 95.825 | -26,31 | 11.355 | -30,30 | ||||
| 2026-02-11 | 13F | Brandywine Global Investment Management, LLC | 5.875 | 696 | ||||||
| 2026-02-17 | 13F | Brevan Howard Capital Management LP | 12.164 | -3,44 | 1.441 | -8,68 | ||||
| 2025-11-14 | 13F | Mubadala Investment Co PJSC | 0 | -100,00 | 0 | -100,00 |