Grundlæggende statistik
| Institutionelle aktier (lange) | 526.454.534 - 68,49% (ex 13D/G) - change of -43,44MM shares -7,62% MRQ |
| Institutionel værdi (lang) | $ 3.197.246 USD ($1000) |
Institutionelt ejerskab og aktionærer
Algonquin Power & Utilities Corp. (US:AQN) har 274 institutionelle ejere og aktionærer, der har indsendt 13D/G- eller 13F-formularer til Securities Exchange Commission (SEC). Disse institutioner har i alt 526,454,534 aktier. Største aktionærer omfatter EdgePoint Investment Group Inc., Starboard Value LP, FIL Ltd, Vanguard Group Inc, Bank Of Montreal /can/, Royal Bank Of Canada, Ariel Investments, Llc, BRITISH COLUMBIA INVESTMENT MANAGEMENT Corp, Principal Financial Group Inc, and VGTSX - Vanguard Total International Stock Index Fund Investor Shares .
Algonquin Power & Utilities Corp. (NYSE:AQN) institutionel ejerskabsstruktur viser aktuelle positioner i virksomheden efter institutioner og fonde, samt seneste ændringer i positionsstørrelse. Større aktionærer kan omfatte individuelle investorer, investeringsforeninger, hedgefonde eller institutioner. Skema 13D angiver, at investoren besidder (eller besidder) mere end 5 % af virksomheden og har til hensigt (eller har til hensigt at) aktivt at forfølge en ændring i forretningsstrategi. Skema 13G indikerer en passiv investering på over 5%.
The share price as of March 20, 2026 is 6,26 / share. Previously, on March 21, 2025, the share price was 5,11 / share. This represents an increase of 22,50% over that period.

Fondens stemningsscore
Fund Sentiment Score (fka Ownership Accumulation Score) finder de aktier, der bliver mest købt af fonde. Det er resultatet af en sofistikeret, multi-faktor kvantitativ model, der identificerer virksomheder med de højeste niveauer af institutionel akkumulering. Scoringsmodellen bruger en kombination af den samlede stigning i oplyste ejere, ændringerne i porteføljeallokeringer i disse ejere og andre målinger. Tallet går fra 0 til 100, hvor højere tal indikerer et højere niveau af akkumulering for sine jævnaldrende, og 50 er gennemsnittet.
Opdateringsfrekvens: Dagligt
Se Ownership Explorer, som giver en liste over højest rangerende virksomheder.
AI+ Ask Fintel’s AI assistant about Algonquin Power & Utilities Corp..
Select a question to share a public post with an AI-crafted answer.
Thinking of good questions…
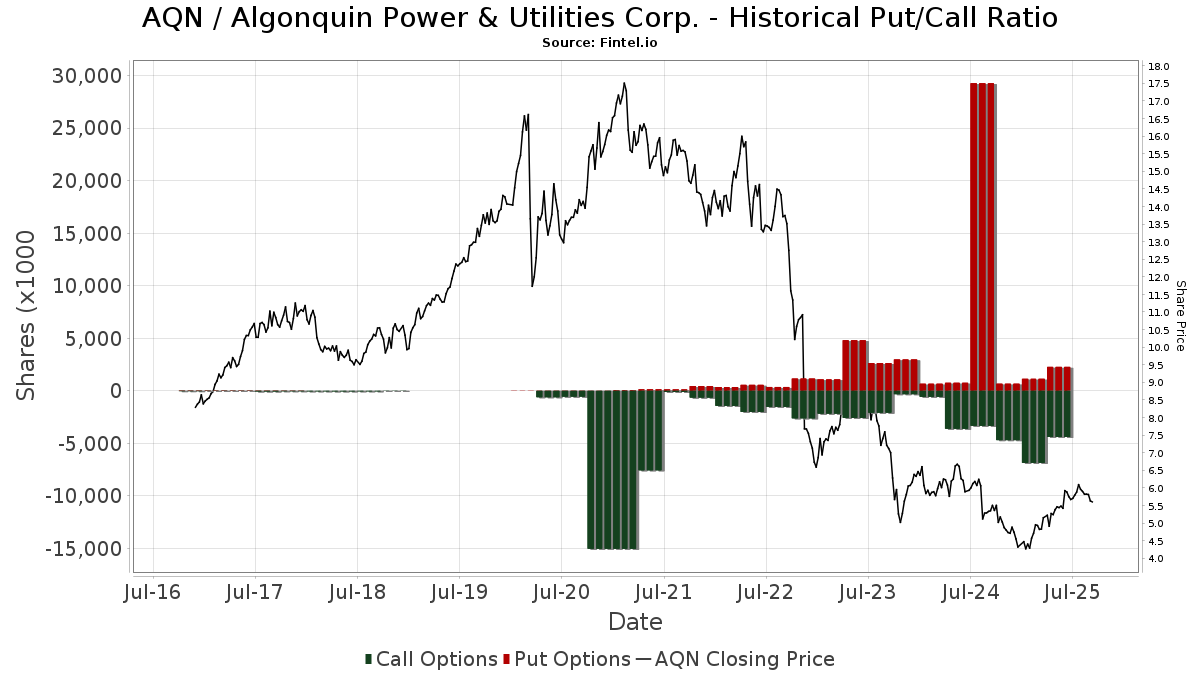
Institutionel Put/Call-forhold
Ud over at indberette standardaktie- og gældsudstedelser skal institutter med mere end 100 mill. aktiver under forvaltning også oplyse deres put- og call-optionsbeholdninger. Da salgsoptioner generelt indikerer negativ stemning, og købsoptioner indikerer positiv stemning, kan vi få en fornemmelse af den overordnede institutionelle stemning ved at plotte forholdet mellem put og kald. Diagrammet til højre viser det historiske put/call-forhold for dette instrument.
Brug af Put/Call Ratio som en indikator for investorernes stemning overvinder en af de vigtigste mangler ved at bruge totalt institutionelt ejerskab, som er, at en betydelig mængde af aktiver under forvaltning investeres passivt for at spore indekser. Passivt forvaltede fonde køber typisk ikke optioner, så indikatoren for put/call-forholdet følger mere nøje følelsen af aktivt forvaltede fonde.
13D/G-arkivering
Vi præsenterer 13D/G ansøgninger separat fra 13F ansøgninger på grund af den forskellige behandling af SEC. 13D/G-ansøgninger kan indgives af grupper af investorer (med én ledende), hvorimod 13F-ansøgninger ikke kan. Dette resulterer i situationer, hvor en investor kan indsende en 13D/G, der rapporterer én værdi for de samlede aktier (der repræsenterer alle de aktier, der ejes af investorgruppen), men derefter indsender en 13F, der rapporterer en anden værdi for de samlede aktier (der udelukkende repræsenterer deres egne) ejendomsret). Det betyder, at aktieejerskab af 13D/G-arkiver og 13F-arkiveringer ofte ikke er direkte sammenlignelige, så vi præsenterer dem separat.
Bemærk: Fra den 16. maj 2021 viser vi ikke længere ejere, der ikke har indsendt en 13D/G inden for det seneste år. Tidligere viste vi den fulde historie af 13D/G-arkiver. Generelt skal enheder, der er forpligtet til at indgive 13D/G-ansøgninger, indgive mindst årligt, før de indsender en afsluttende ansøgning. Dog forlader fonde nogle gange positioner uden at indsende en afsluttende ansøgning (dvs. de afvikler), så visning af den fulde historie resulterede nogle gange i forvirring om det nuværende ejerskab. For at undgå forvirring viser vi nu kun 'aktuelle' ejere - det vil sige - ejere, der har anmeldt inden for det seneste år.
Upgrade to unlock premium data.
| Fil dato | Form | Investor | Forrige Aktier |
Seneste Aktier |
Δ Aktier (Procent) |
Ejendomsret (Procent) |
Δ Ejerskab (Procent) |
|
|---|---|---|---|---|---|---|---|---|
| 2026-01-08 | EdgePoint Investment Group Inc. | 56,764,441 | 81,727,385 | 43.98 | 10.64 | 43.98 | ||
| 2025-11-05 | FIL Ltd | 28,538,005 | 49,923,003 | 74.94 | 6.50 | 75.68 | ||
| 2025-04-24 | BlackRock, Inc. | 39,975,062 | 33,913,091 | -15.16 | 4.40 | -15.38 | ||
| 2025-03-14 | Starboard Value LP | 62,141,000 | 66,433,000 | 6.91 | 8.70 | -3.33 |
13F og NPORT arkivering
Detaljer om 13F-arkivering er gratis. Detaljer om NP-ansøgninger kræver et premium-medlemskab. Grønne rækker angiver nye positioner. Røde rækker angiver lukkede positioner. Klik på linket ikon for at se den fulde transaktionshistorik.
Opgrader
for at låse premium-data op og eksportere til Excel ![]() .
.
| Fil dato | Kilde | Investor | Type | Gennemsnitlig pris (Øst) |
Aktier | Δ Aktier (%) |
Rapporteret Værdi ($1000) |
Δ Værdi (%) |
Port Alloc (%) |
|
|---|---|---|---|---|---|---|---|---|---|---|
| 2026-02-13 | 13F | Mariner, LLC | 76.599 | -0,96 | 471 | 13,49 | ||||
| 2026-02-17 | 13F | Balyasny Asset Management Llc | 640.354 | -0,25 | 3.938 | 14,24 | ||||
| 2026-02-11 | 13F | Tacita Capital Inc | 24.111 | 257,20 | 148 | 311,11 | ||||
| 2026-02-13 | 13F | Y-Intercept (Hong Kong) Ltd | 870.445 | 5.353 | ||||||
| 2025-11-14 | 13F | Ubs Asset Management Americas Inc | 0 | -100,00 | 0 | |||||
| 2025-11-14 | 13F | Susquehanna International Group, Llp | Call | 0 | -100,00 | 0 | -100,00 | |||
| 2026-02-03 | 13F | Crossmark Global Holdings, Inc. | 36.792 | -29,60 | 226 | -19,29 | ||||
| 2026-02-05 | 13F | ARS Investment Partners, LLC | 863.660 | 29,65 | 5.312 | 48,48 | ||||
| 2026-02-13 | 13F | Arrowstreet Capital, Limited Partnership | 3.944.942 | 6,12 | 24.259 | 21,46 | ||||
| 2026-01-09 | 13F | SG Americas Securities, LLC | 12.321 | -22,22 | 0 | |||||
| 2026-02-10 | 13F | Quantbot Technologies LP | 48.996 | -87,70 | 301 | -85,92 | ||||
| 2026-01-30 | 13F | Us Bancorp \de\ | 36.626 | -1,26 | 225 | 13,07 | ||||
| 2026-02-03 | 13F | Ballentine Partners, LLC | 17.880 | -24,27 | 110 | -13,49 | ||||
| 2026-02-17 | 13F | Royal Bank Of Canada | Put | 407.700 | 0,00 | 2.507 | 14,53 | |||
| 2026-02-17 | 13F | Massar Capital Management, LP | 0 | -100,00 | 0 | |||||
| 2026-02-17 | 13F | Quadrature Capital Ltd | 223.700 | 29,61 | 1.377 | 48,70 | ||||
| 2026-02-17 | 13F | Qube Research & Technologies Ltd | 2.618.838 | 155,52 | 16.106 | 192,61 | ||||
| 2026-02-12 | 13F | Nuveen, LLC | 549.708 | 0,00 | 3.385 | 14,52 | ||||
| 2025-11-14 | 13F | Strategic Wealth Partners, Ltd. | 315 | 0,00 | 2 | 0,00 | ||||
| 2026-01-22 | 13F | Bfsg, Llc | 47.310 | 0,00 | 291 | 14,17 | ||||
| 2026-02-13 | 13F | BRITISH COLUMBIA INVESTMENT MANAGEMENT Corp | 13.084.592 | -0,23 | 80.461 | 14,17 | ||||
| 2025-11-20 | 13F | First Affirmative Financial Network | 0 | -100,00 | 0 | |||||
| 2026-02-17 | 13F | Jain Global LLC | 41.181 | -84,91 | 253 | -82,73 | ||||
| 2026-02-17 | 13F | Royal Bank Of Canada | Call | 2.100 | 0,00 | 13 | 18,18 | |||
| 2026-02-11 | 13F | Group One Trading, L.p. | Call | 0 | -100,00 | 0 | -100,00 | |||
| 2026-02-12 | 13F | Quadrant Capital Group Llc | 26.450 | 2,17 | 163 | 16,55 | ||||
| 2026-01-27 | 13F | TD Waterhouse Canada Inc. | 1.258.625 | -4,15 | 7.730 | 3,16 | ||||
| 2025-10-30 | 13F | Twin Peaks Wealth Advisors, LLC | 0 | -100,00 | 0 | |||||
| 2026-02-12 | 13F | Steward Partners Investment Advisory, Llc | 1.765 | 10,45 | 11 | 25,00 | ||||
| 2026-02-05 | 13F | Phoenix Holdings Ltd. | 27.516 | -6,08 | 169 | 7,64 | ||||
| 2026-01-21 | 13F/A | Euro Pacific Asset Management, LLC | 354.050 | -0,17 | 2 | 100,00 | ||||
| 2026-02-13 | 13F | Neuberger Berman Group LLC | 4.540.036 | 8,63 | 27.921 | 24,41 | ||||
| 2026-02-14 | 13F | Rockefeller Capital Management L.P. | 467 | -51,15 | 3 | -60,00 | ||||
| 2026-02-02 | 13F | Millstone Evans Group, LLC | 0 | -100,00 | 0 | |||||
| 2026-02-17 | 13F | Graham Capital Management, L.P. | 0 | -100,00 | 0 | |||||
| 2026-02-17 | 13F | Equitable Holdings, Inc. | 17.069 | 0,01 | 105 | 14,29 | ||||
| 2026-01-20 | 13F | Signaturefd, Llc | 44.040 | -2,68 | 271 | 11,57 | ||||
| 2025-11-13 | 13F | Marshall Wace, Llp | 0 | -100,00 | 0 | -100,00 | ||||
| 2026-01-14 | 13F | A. D. Beadell Investment Counsel, Inc. | 12.500 | 0,00 | 0 | |||||
| 2026-02-02 | 13F | Triasima Portfolio Management inc. | 201.732 | 1,39 | 1.242 | 16,18 | ||||
| 2026-02-17 | 13F | Optiver Holding B.V. | 3 | 0 | ||||||
| 2025-09-24 | NP | IDEV - iShares Core MSCI International Developed Markets ETF | 626.658 | -0,12 | 3.695 | 9,29 | ||||
| 2026-02-17 | 13F | Tower Research Capital LLC (TRC) | 11.900 | 76,32 | 73 | 102,78 | ||||
| 2026-02-17 | 13F | Fmr Llc | 3.963 | 10,82 | 24 | 26,32 | ||||
| 2025-09-24 | NP | TNVAX - 1290 GAMCO Small/Mid Cap Value Fund Class A | 323.000 | 0,00 | 1.906 | 9,67 | ||||
| 2026-02-12 | 13F | Jane Street Group, Llc | 2.360.297 | -31,01 | 14.517 | -21,03 | ||||
| 2026-01-29 | 13F | Pictet Asset Management Holding SA | 133.733 | 1,49 | 823 | 16,24 | ||||
| 2026-02-17 | 13F | Lazard Asset Management Llc | 0 | -100,00 | 0 | |||||
| 2026-01-30 | 13F | Samalin Investment Counsel, LLC | 110.540 | -0,96 | 680 | 13,36 | ||||
| 2026-02-11 | 13F | Group One Trading, L.p. | 7.479 | 74,78 | 46 | 104,55 | ||||
| 2026-02-12 | 13F | Bank Of Nova Scotia Trust Co | 22.500 | -8,16 | 138 | 5,34 | ||||
| 2026-02-17 | 13F | Guardian Partners Inc. | 0 | -100,00 | 0 | |||||
| 2026-01-27 | 13F | WealthCollab, LLC | 719 | 0,00 | 4 | 33,33 | ||||
| 2026-02-17 | 13F | Toronto Dominion Bank | Put | 11.200 | -2,61 | 69 | 11,48 | |||
| 2026-02-17 | 13F | Credit Agricole S A | 256.873 | -37,91 | 1.580 | -28,91 | ||||
| 2026-02-13 | 13F | First Trust Advisors Lp | 6.858.330 | 1,29 | 42.179 | 16,01 | ||||
| 2026-02-17 | 13F | Toronto Dominion Bank | Call | 6.300 | 0,00 | 39 | 15,15 | |||
| 2026-02-13 | 13F | Aviso Financial Inc. | 1.040 | 6 | ||||||
| 2026-02-17 | 13F | Two Sigma Securities, Llc | 56.626 | 46,52 | 348 | 68,12 | ||||
| 2026-02-13 | 13F | Bank Of Nova Scotia | 10.276.178 | 1,04 | 63.187 | 15,59 | ||||
| 2026-01-28 | 13F | Kingswood Wealth Advisors, Llc | 13.760 | -11,85 | 85 | 1,20 | ||||
| 2026-02-17 | 13F | EdgePoint Investment Group Inc. | 81.727.385 | 32,56 | 502.563 | 51,70 | ||||
| 2026-02-17 | 13F | Susquehanna International Group, Llp | 140.886 | 34,77 | 866 | 54,37 | ||||
| 2026-02-17 | 13F | State Of Wisconsin Investment Board | 18.579 | 114 | ||||||
| 2025-09-22 | 13F | GatePass Capital, LLC | 0 | -100,00 | 0 | -100,00 | ||||
| 2026-02-17 | 13F | Russell Investments Group, Ltd. | 183.915 | 15,55 | 1.132 | 32,44 | ||||
| 2025-11-14 | 13F | AXA Investment Managers S.A. | 578.910 | 3.109 | ||||||
| 2025-09-26 | NP | John Hancock Preferred Income Fund Ii | 0 | -100,00 | 0 | -100,00 | ||||
| 2026-02-11 | 13F | Cerity Partners LLC | 53.392 | 1,45 | 328 | 16,31 | ||||
| 2026-02-13 | 13F | Callodine Capital Management, LP | 5.749.636 | 3,01 | 35.360 | 17,97 | ||||
| 2026-01-27 | 13F | Hennessy Advisors Inc | 141.064 | -2,76 | 868 | 11,44 | ||||
| 2025-09-25 | NP | DFA INVESTMENT TRUST CO - The Canadian Small Company Series This fund is a listed as child fund of Dimensional Fund Advisors Lp and if that institution has disclosed ownership in this security, then these positions will not be double counted when calculating total shares and total value | 524.908 | 0,00 | 3.095 | 9,40 | ||||
| 2026-01-15 | 13F | Founders Capital Management | 0 | -100,00 | 0 | -100,00 | ||||
| 2026-02-17 | 13F | Tudor Investment Corp Et Al | 10.056 | 62 | ||||||
| 2026-02-17 | 13F | Aquatic Capital Management LLC | 325.064 | -30,10 | 1.999 | -19,94 | ||||
| 2026-02-13 | 13F | Stifel Financial Corp | 85.641 | -3,47 | 527 | 10,50 | ||||
| 2025-11-14 | 13F | ExodusPoint Capital Management, LP | 0 | -100,00 | 0 | |||||
| 2025-09-26 | NP | FXINX - Fidelity Flex International Focused Index Fund | 1.471 | 9 | ||||||
| 2026-01-23 | 13F | Natural Investments, Llc | 20.207 | 0,00 | 0 | |||||
| 2026-01-27 | 13F | Evergreen Capital Management Llc | 14.296 | -8,14 | 89 | 4,76 | ||||
| 2026-01-09 | 13F | Post Resch Tallon Group Inc. | 27.000 | -12,90 | 166 | 0,00 | ||||
| 2026-02-05 | 13F | Cambridge Investment Research Advisors, Inc. | 15.416 | -1,93 | 0 | |||||
| 2026-02-12 | 13F | Commonwealth Equity Services, Llc | 248.893 | 7,22 | 1.531 | 152.900,00 | ||||
| 2026-02-17 | 13F | D. E. Shaw & Co., Inc. | 5.349.003 | 52,66 | 32.896 | 74,80 | ||||
| 2025-09-25 | NP | DXIV - Dimensional International Vector Equity ETF | 8.300 | 0,00 | 49 | 9,09 | ||||
| 2026-01-27 | 13F | Zurcher Kantonalbank (Zurich Cantonalbank) | 233.481 | 16,73 | 1.438 | 33,67 | ||||
| 2026-02-17 | 13F | Toronto Dominion Bank | 8.470.658 | 27,58 | 52.088 | 45,99 | ||||
| 2026-02-13 | 13F | BNP Paribas Asset Management Holding S.A. | 578.910 | 5 | ||||||
| 2026-02-10 | 13F | CIBC World Markets Inc. | 3.700.005 | -42,83 | 22.755 | -34,57 | ||||
| 2026-02-17 | 13F | Aqr Capital Management Llc | 11.252 | -63,71 | 69 | -58,43 | ||||
| 2026-01-23 | 13F | Farther Finance Advisors, LLC | 3.852 | 24 | ||||||
| 2026-01-23 | 13F | Valley National Advisers Inc | 325 | 0,00 | 0 | |||||
| 2026-01-29 | 13F | UMA Financial Services, Inc. | 619 | 0,00 | 4 | 0,00 | ||||
| 2026-01-23 | 13F | Westside Investment Management, Inc. | 1.355 | 0,00 | 8 | 14,29 | ||||
| 2026-02-10 | 13F | Norges Bank | 10.906.124 | 67.065 | ||||||
| 2026-02-11 | 13F | Franklin Resources Inc | 607.652 | 1.315,45 | 3.737 | 1.412,96 | ||||
| 2026-01-30 | 13F | North Star Investment Management Corp. | 1.800 | 0,00 | 11 | 22,22 | ||||
| 2025-09-25 | NP | GASFX - Hennessy Gas Utility Fund Investor Class | 166.064 | 46,10 | 980 | 60,23 | ||||
| 2026-01-26 | 13F | Cwm, Llc | 2.433 | 2,49 | 0 | |||||
| 2026-02-12 | 13F | Hrt Financial Lp | 41.894 | -58,37 | 0 | |||||
| 2026-03-20 | 13F | Purpose Unlimited Inc. | 75.578 | 465 | ||||||
| 2026-02-13 | 13F | Focused Alpha, Llc | 34.721 | 214 | ||||||
| 2026-02-13 | 13F | Toroso Investments, LLC | 106.624 | -41,96 | 656 | -33,57 | ||||
| 2026-02-11 | 13F | Simplex Trading, Llc | 157.355 | 39,71 | 968 | |||||
| 2026-02-17 | 13F | Greenland Capital Management LP | 531.730 | -42,66 | 3.274 | -34,33 | ||||
| 2025-09-25 | NP | DFA INVESTMENT DIMENSIONS GROUP INC - International Vector Equity Portfolio Shares | 0 | -100,00 | 0 | |||||
| 2026-02-03 | 13F | Credit Industriel Et Commercial | 130.000 | 0,00 | 800 | 14,47 | ||||
| 2026-02-18 | 13F | GWM Advisors LLC | 7.627 | 47 | ||||||
| 2026-02-11 | 13F | Simplex Trading, Llc | Call | 200 | -96,83 | 1 | ||||
| 2026-02-17 | 13F | Royal Bank Of Canada | 18.169.106 | -38,16 | 111.742 | -29,17 | ||||
| 2025-09-29 | NP | PFFA - Virtus InfraCap U.S. Preferred Stock ETF | 21.798 | 9,65 | 129 | 20,75 | ||||
| 2025-09-25 | NP | DFIC - Dimensional International Core Equity 2 ETF | 242.510 | 69,67 | 1.431 | 86,20 | ||||
| 2026-01-21 | 13F | Cidel Asset Management Inc | 2.487.838 | -23,54 | 15.318 | -12,42 | ||||
| 2026-02-06 | 13F | HighTower Advisors, LLC | 12.260 | -88,04 | 75 | -86,36 | ||||
| 2026-02-17 | 13F | Amundi | 82.747 | 509 | ||||||
| 2026-02-17 | 13F | Two Sigma Advisers, Lp | 92.400 | 43,48 | 568 | 64,64 | ||||
| 2025-10-29 | 13F | Formidable Asset Management, LLC | 0 | -100,00 | 0 | |||||
| 2025-11-21 | 13F | Nebula Research & Development LLC | 0 | -100,00 | 0 | |||||
| 2026-02-10 | 13F | Bank of New York Mellon Corp | 15.324 | -0,46 | 94 | 14,63 | ||||
| 2026-02-13 | 13F | Maven Securities LTD | 120.890 | 743 | ||||||
| 2026-02-13 | 13F | Ariel Investments, Llc | 15.920.654 | -2,60 | 97.912 | 11,55 | ||||
| 2026-02-10 | 13F | CIBC Asset Management Inc | 753.293 | 12,14 | 4.635 | 28,51 | ||||
| 2026-02-11 | 13F | Fiera Capital Corp | 0 | -100,00 | 0 | |||||
| 2026-02-13 | 13F | Manufacturers Life Insurance Company, The | 0 | -100,00 | 0 | |||||
| 2026-02-02 | 13F | Intact Investment Management Inc. | 4.066.619 | -12,59 | 25.005 | 0,00 | ||||
| 2026-02-05 | 13F | John G Ullman & Associates Inc | 86.250 | 16,01 | 530 | 32,83 | ||||
| 2026-02-17 | 13F | Infrastructure Capital Advisors, Llc | 26.642 | 9,43 | 164 | 20,74 | ||||
| 2026-02-13 | 13F | Charles Schwab Investment Management Inc | 2.744.967 | 0,92 | 16.901 | 15,59 | ||||
| 2026-01-22 | 13F | Massachusetts Financial Services Co /ma/ | 25.812 | 107,66 | 159 | 139,39 | ||||
| 2026-02-13 | 13F | K2 Principal Fund, L.p. | 200.000 | 1.230 | ||||||
| 2025-11-14 | 13F | Sagard Holdings Management Inc. | 118 | -41,58 | 1 | -100,00 | ||||
| 2026-02-12 | 13F | Northwest & Ethical Investments L.P. | 935.263 | -20,10 | 5.757 | -8,39 | ||||
| 2026-02-17 | 13F | CastleKnight Management LP | 37.000 | 0,00 | 228 | 14,65 | ||||
| 2026-02-12 | 13F | Bank Of Montreal /can/ | 20.717.144 | 23,09 | 127.395 | 40,86 | ||||
| 2026-02-18 | 13F | Mackenzie Financial Corp | 885.632 | 40,56 | 5.479 | 61,83 | ||||
| 2026-02-13 | 13F | Ingalls & Snyder Llc | 0 | -100,00 | 0 | |||||
| 2026-02-17 | 13F | Citadel Advisors Llc | 2.310.227 | -48,03 | 14.208 | -40,48 | ||||
| 2026-02-04 | 13F | Swiss Life Asset Management Ltd | 34.797 | 0,00 | 214 | 13,90 | ||||
| 2025-11-14 | 13F | Centiva Capital, LP | 0 | -100,00 | 0 | -100,00 | ||||
| 2026-02-17 | 13F | Bank Of America Corp /de/ | 2.706.849 | -34,33 | 16.647 | -24,79 | ||||
| 2026-01-12 | 13F | Salem Investment Counselors Inc | 0 | -100,00 | 0 | |||||
| 2026-01-20 | 13F | Savvy Advisors, Inc. | 13.642 | -15,27 | 84 | -3,49 | ||||
| 2026-02-13 | 13F | Public Sector Pension Investment Board | 0 | -100,00 | 0 | |||||
| 2026-02-17 | 13F | Man Group plc | 1.832.026 | 70,99 | 11.267 | 95,83 | ||||
| 2025-09-26 | NP | FZILX - Fidelity ZERO International Index Fund This fund is a listed as child fund of Fmr Llc and if that institution has disclosed ownership in this security, then these positions will not be double counted when calculating total shares and total value | 150.027 | 12,19 | 885 | 22,78 | ||||
| 2026-02-17 | 13F | Canada Pension Plan Investment Board | 361.300 | 2.222 | ||||||
| 2026-02-17 | 13F | Schonfeld Strategic Advisors LLC | 39.931 | -76,00 | 246 | -72,56 | ||||
| 2025-11-14 | 13F | Caption Management, LLC | Call | 0 | -100,00 | 0 | ||||
| 2026-01-07 | 13F | Central Pacific Bank - Trust Division | 5.000 | 0,00 | 31 | 15,38 | ||||
| 2025-09-26 | NP | EPDPX - EuroPac International Dividend Income Fund Class A | 350.000 | 0,00 | 2.064 | 9,38 | ||||
| 2026-02-10 | 13F | State of Wyoming | 12.356 | 11,64 | 76 | 27,12 | ||||
| 2026-02-12 | 13F | Brown Brothers Harriman & Co | 580 | 4 | ||||||
| 2025-11-14 | 13F | Cubist Systematic Strategies, LLC | 1.719.208 | 9.235 | ||||||
| 2026-02-17 | 13F | PDT Partners, LLC | 867.937 | -13,92 | 5.338 | -1,42 | ||||
| 2026-01-09 | 13F | Pacifica Partners Inc. | 0 | -100,00 | 0 | |||||
| 2026-02-13 | 13F | State Street Corp | 2.551.100 | 15,57 | 15.855 | 32,16 | ||||
| 2026-02-03 | 13F | Manning & Napier Advisors Llc | 1.375.000 | 0,00 | 8.456 | 14,53 | ||||
| 2026-02-11 | 13F | 111 Capital | 0 | -100,00 | 0 | -100,00 | ||||
| 2026-02-17 | 13F | Leonteq Securities AG | 0 | -100,00 | 0 | |||||
| 2026-02-17 | 13F | Creative Planning | 71.555 | -7,55 | 440 | 6,02 | ||||
| 2026-01-29 | 13F | UBS Group AG | 2.168.586 | -26,77 | 13.337 | -16,14 | ||||
| 2026-02-11 | 13F | Janney Montgomery Scott LLC | 0 | -100,00 | 0 | |||||
| 2026-02-09 | 13F | Legal & General Group Plc | 6.939.528 | -9,22 | 42.728 | 3,98 | ||||
| 2026-02-12 | 13F | Principal Securities, Inc. | 0 | -100,00 | 0 | -100,00 | ||||
| 2026-02-11 | 13F | LPL Financial LLC | 37.364 | 5,73 | 230 | 21,16 | ||||
| 2026-02-17 | 13F | SIG North Trading, ULC | 260.663 | 95,45 | 1.603 | 123,88 | ||||
| 2025-11-14 | 13F | Capstone Investment Advisors, Llc | 0 | -100,00 | 0 | |||||
| 2026-02-17 | 13F | SIG North Trading, ULC | Put | 138.600 | -21,87 | 852 | -10,50 | |||
| 2026-02-11 | 13F | Deutsche Bank Ag\ | 77.852 | -0,83 | 479 | 13,54 | ||||
| 2026-02-17 | 13F | SIG North Trading, ULC | Call | 66.400 | -66,90 | 408 | -62,12 | |||
| 2026-02-13 | 13F | Morgan Stanley | 4.093.676 | -1,00 | 25.176 | 13,38 | ||||
| 2026-02-13 | 13F | American Century Companies Inc | 172.630 | -27,94 | 1.062 | -17,56 | ||||
| 2026-02-13 | 13F | National Bank Of Canada /fi/ | Put | 373 | -23,57 | 229 | -12,60 | |||
| 2026-01-29 | 13F | Vanguard Group Inc | 34.456.155 | 2,11 | 211.871 | 16,81 | ||||
| 2026-02-13 | 13F | Cornerstone Financial Management LLC | 81 | 0 | ||||||
| 2026-02-13 | 13F | Great West Life Assurance Co /can/ | 226.608 | -55,26 | 1 | -50,00 | ||||
| 2026-02-13 | 13F | Squarepoint Ops LLC | 26.936 | -82,89 | 166 | -80,47 | ||||
| 2026-02-13 | 13F | Wells Fargo & Company/mn | 35.902 | -32,45 | 221 | -22,81 | ||||
| 2026-02-05 | 13F | Gamco Investors, Inc. Et Al | 3.286.322 | 8,46 | 20.211 | 24,22 | ||||
| 2026-02-13 | 13F | Southeast Asset Advisors Inc. | 0 | -100,00 | 0 | |||||
| 2026-02-13 | 13F | Dynamic Technology Lab Private Ltd | 35.424 | -83,78 | 218 | -81,42 | ||||
| 2025-11-14 | 13F | Skopos Labs, Inc. | 0 | -100,00 | 0 | |||||
| 2026-02-17 | 13F | Investment Management Corp of Ontario | 85.690 | 231,53 | 527 | 281,16 | ||||
| 2026-02-12 | 13F | Wedbush Securities Inc | 10.200 | 0,00 | 0 | |||||
| 2026-01-14 | 13F | Spire Wealth Management | 3.800 | -76,62 | 23 | -73,56 | ||||
| 2026-02-17 | 13F | Private Advisor Group, LLC | 12.268 | 0,00 | 75 | 15,38 | ||||
| 2026-02-13 | 13F | HITE Hedge Asset Management LLC | 200.000 | 1.230 | ||||||
| 2026-02-10 | 13F | Td Asset Management Inc | 2.433.309 | 4,56 | 14.982 | 19,76 | ||||
| 2026-02-17 | 13F | Point72 Asset Management, L.P. | 1.859.307 | 555,33 | 11.435 | 650,26 | ||||
| 2026-01-12 | 13F | Roble, Belko & Company, Inc | 60 | 0,00 | 0 | |||||
| 2026-02-06 | 13F | Larson Financial Group LLC | 163 | 87,36 | 1 | |||||
| 2026-02-13 | 13F | Caitong International Asset Management Co., Ltd | 2 | -75,00 | 0 | |||||
| 2026-02-09 | 13F | Geode Capital Management, Llc | 1.919.900 | 8,52 | 14.529 | 23,10 | ||||
| 2026-02-13 | 13F | C M Bidwell & Associates Ltd | 13.490 | 83 | ||||||
| 2026-02-17 | 13F | Cetera Investment Advisers | 230.833 | 6,69 | 1.421 | 22,18 | ||||
| 2026-02-17 | 13F | Anson Funds Management LP | 0 | -100,00 | 0 | |||||
| 2026-02-17 | 13F | Northern Trust Corp | 452.349 | -14,98 | 2.782 | -2,66 | ||||
| 2026-02-17 | 13F | PharVision Advisers, LLC | 0 | -100,00 | 0 | |||||
| 2026-02-12 | 13F | Federation des caisses Desjardins du Quebec | 3.028.957 | -52,38 | 18.614 | -45,37 | ||||
| 2026-02-13 | 13F | National Bank Of Canada /fi/ | 5.423.404 | -45,28 | 33.313 | -37,40 | ||||
| 2026-02-17 | 13F | Magnetar Financial LLC | 43.781 | -83,90 | 269 | -81,56 | ||||
| 2026-02-19 | 13F | Invesco Ltd. | 3.053.534 | 0,45 | 18.779 | 15,04 | ||||
| 2026-02-13 | 13F | SRS Capital Advisors, Inc. | 1.032 | 6.780,00 | 6 | |||||
| 2026-02-11 | 13F | Vise Technologies, Inc. | 0 | -100,00 | 0 | |||||
| 2026-02-13 | 13F | Kayne Anderson Capital Advisors Lp | 770.878 | -1,18 | 4.741 | 13,15 | ||||
| 2026-01-21 | 13F | Crews Bank & Trust | 367 | 0,00 | 2 | 100,00 | ||||
| 2026-02-05 | 13F | Center for Financial Planning, Inc. | 2 | 0,00 | 0 | |||||
| 2025-09-25 | NP | Dfa Investment Dimensions Group Inc - Va International Small Portfolio This fund is a listed as child fund of Dimensional Fund Advisors Lp and if that institution has disclosed ownership in this security, then these positions will not be double counted when calculating total shares and total value | 16.126 | -78,33 | 95 | -78,36 | ||||
| 2026-02-13 | 13F | Barclays Plc | 435.026 | -5,12 | 2.675 | 8,65 | ||||
| 2025-09-25 | NP | VT - Vanguard Total World Stock Index Fund ETF Shares | 511.284 | 0,00 | 3.015 | 9,40 | ||||
| 2026-02-05 | 13F | Td Private Client Wealth Llc | 36 | 0 | ||||||
| 2026-02-17 | 13F | Alliancebernstein L.p. | 106.021 | 0,00 | 652 | 14,59 | ||||
| 2025-09-25 | NP | DFAX - Dimensional World ex U.S. Core Equity 2 ETF | 223.474 | 562,69 | 1.318 | 562,31 | ||||
| 2026-02-17 | 13F | Public Employees Retirement System Of Ohio | 2.936.911 | 2,03 | 18.066 | 16,86 | ||||
| 2025-09-29 | NP | PXF - Invesco FTSE RAFI Developed Markets ex-U.S. ETF This fund is a listed as child fund of Invesco Ltd. and if that institution has disclosed ownership in this security, then these positions will not be double counted when calculating total shares and total value | 132.079 | 0,00 | 781 | 9,86 | ||||
| 2026-02-11 | 13F | Jpmorgan Chase & Co | 261.344 | -3,69 | 1.607 | 10,30 | ||||
| 2026-02-12 | 13F | BlackRock, Inc. | 4.630.028 | 2,76 | 28.475 | 17,68 | ||||
| 2026-02-13 | 13F | Van Eck Associates Corp | 287.813 | 6,77 | 2 | 0,00 | ||||
| 2026-02-10 | 13F | Connor, Clark & Lunn Investment Management Ltd. | 4.943.308 | 48,61 | 30.398 | 70,06 | ||||
| 2026-02-13 | 13F | National Bank Of Canada /fi/ | Call | 1.387 | 8,61 | 853 | 24,20 | |||
| 2026-01-14 | 13F | Wedge Capital Management L L P/nc | 472.980 | 2.909 | ||||||
| 2026-01-30 | 13F | R Squared Ltd | 11.059 | 68 | ||||||
| 2025-11-07 | 13F | Sierra Ocean, Llc | 0 | -100,00 | 0 | |||||
| 2025-09-25 | NP | VGTSX - Vanguard Total International Stock Index Fund Investor Shares | 11.145.476 | 2,14 | 65.718 | 11,74 | ||||
| 2026-02-11 | 13F | Heartland Advisors Inc | 500.000 | 3.075 | ||||||
| 2025-11-14 | 13F | Mount Yale Investment Advisors, LLC | 0 | -100,00 | 0 | |||||
| 2026-02-11 | 13F | Westerkirk Capital Inc. | 0 | -100,00 | 0 | |||||
| 2026-02-11 | 13F | Picton Mahoney Asset Management | 3.519.080 | 193,40 | 21.670 | 361.050,00 | ||||
| 2026-02-10 | 13F | Jupiter Asset Management Ltd | 918.774 | 4.665,18 | 5.657 | 5.392,23 | ||||
| 2026-02-17 | 13F | Raymond James Financial Inc | 80.678 | -21,40 | 496 | -9,98 | ||||
| 2026-02-13 | 13F | DKRT Investments Corp. | 175.000 | -12,50 | 1.076 | 0,19 | ||||
| 2026-02-13 | 13F | Aigen Investment Management, Lp | 0 | -100,00 | 0 | |||||
| 2026-02-13 | 13F | Alberta Investment Management Corp | 2.553.200 | 0,00 | 15.702 | 14,53 | ||||
| 2026-02-17 | 13F | Susquehanna Advisors Group, Inc. | 386.400 | 117,81 | 2.376 | 149,58 | ||||
| 2026-02-13 | 13F | Citigroup Inc | 216.524 | -47,76 | 1.333 | -40,17 | ||||
| 2026-02-17 | 13F | Gotham Asset Management, LLC | 293.195 | -49,77 | 1.803 | -42,47 | ||||
| 2026-02-17 | 13F | Farringdon Capital, Ltd. | 18.232 | 112 | ||||||
| 2025-09-24 | NP | IXUS - iShares Core MSCI Total International Stock ETF | 871.523 | 4,76 | 5.139 | 14,61 | ||||
| 2026-02-10 | 13F | Envestnet Asset Management Inc | 37.920 | 233,66 | 233 | 281,97 | ||||
| 2026-02-18 | 13F | Vident Advisory, LLC | 31.199 | 9,61 | 192 | 25,66 | ||||
| 2026-01-16 | 13F | Ronald Blue Trust, Inc. | 21 | -99,03 | 0 | -100,00 | ||||
| 2026-02-17 | 13F | Engineers Gate Manager LP | 144.825 | -9,99 | 891 | 3,01 | ||||
| 2025-11-14 | 13F | Weiss Asset Management LP | 50.000 | 269 | ||||||
| 2025-11-13 | 13F | Bank Of Montreal /can/ | Put | 0 | -100,00 | 0 | -100,00 | |||
| 2026-02-13 | 13F | JustInvest LLC | 86.259 | 5,65 | 530 | 21,00 | ||||
| 2025-09-24 | NP | SFNNX - Schwab Fundamental International Large Company Index Fund Institutional Shares | 182.306 | 6,89 | 1.075 | 16,87 | ||||
| 2025-09-25 | NP | TLTD - FlexShares Morningstar Developed Markets ex-US Factor Tilt Index Fund | 1.333 | -74,04 | 8 | -74,07 | ||||
| 2026-02-13 | 13F | MAI Capital Management | 439 | 0,00 | 3 | 0,00 | ||||
| 2025-09-26 | NP | John Hancock Tax-advantaged Dividend Income Fund | 2.145.700 | 0,00 | 12.660 | 9,67 | ||||
| 2026-02-12 | 13F | BRYN MAWR TRUST Co | 0 | -100,00 | 0 | -100,00 | ||||
| 2026-02-02 | 13F | Horizon Investments, LLC | 242.117 | 32,53 | 1.489 | 51,78 | ||||
| 2026-02-10 | 13F | Savant Capital, LLC | 18.498 | 114 | ||||||
| 2026-02-13 | 13F | Johnson Investment Counsel Inc | 0 | -100,00 | 0 | |||||
| 2026-01-29 | 13F | Nbc Securities, Inc. | 2.621 | 0,50 | 16 | 14,29 | ||||
| 2026-01-08 | 13F | Value Partners Investments Inc. | 87.404 | 49,75 | 538 | 71,88 | ||||
| 2026-02-17 | 13F | XTX Topco Ltd | 137.453 | -26,94 | 845 | -16,34 | ||||
| 2025-10-21 | 13F | Global Retirement Partners, LLC | 0 | -100,00 | 0 | -100,00 | ||||
| 2025-09-26 | NP | John Hancock Premium Dividend Fund | 1.547.596 | -6,07 | 9.131 | 3,00 | ||||
| 2025-11-14 | 13F | Jane Street Group, Llc | Put | 0 | -100,00 | 0 | -100,00 | |||
| 2026-02-17 | 13F | Blackstone Group Inc | 0 | -100,00 | 0 | |||||
| 2026-02-12 | 13F | Campbell & CO Investment Adviser LLC | 662.965 | 1.208,63 | 4.077 | 1.398,90 | ||||
| 2026-01-28 | 13F | DekaBank Deutsche Girozentrale | 109.141 | 0,00 | 1 | |||||
| 2026-01-07 | 13F | CWA Asset Management Group, LLC | 498.575 | 17,66 | 3.066 | 34,77 | ||||
| 2026-02-10 | 13F | Goldman Sachs Group Inc | 5.711.454 | -42,19 | 35.125 | -33,79 | ||||
| 2026-02-13 | 13F | Transamerica Financial Advisors, Inc. | 14 | 0 | ||||||
| 2026-02-13 | 13F | Mufg Securities (canada), Ltd. | 0 | -100,00 | 0 | |||||
| 2025-11-07 | 13F | Shell Asset Management Co | 11.200 | -70,91 | 0 | |||||
| 2026-02-17 | 13F | Advisor Group Holdings, Inc. | 21.126 | -13,22 | 130 | -2,27 | ||||
| 2026-02-12 | 13F | Scotia Capital Inc. | 684.990 | -13,03 | 4.207 | -0,21 | ||||
| 2026-01-28 | 13F | Davis-rea Ltd. | 12.264 | 0,00 | 76 | 15,15 | ||||
| 2026-02-05 | 13F | Bessemer Group Inc | 467 | 0 | ||||||
| 2026-02-03 | 13F | SBI Securities Co., Ltd. | 4.994 | 1,90 | 31 | 15,38 | ||||
| 2025-09-26 | NP | FTIHX - Fidelity Total International Index Fund This fund is a listed as child fund of Fmr Llc and if that institution has disclosed ownership in this security, then these positions will not be double counted when calculating total shares and total value | 347.073 | 7,49 | 2.046 | 17,59 | ||||
| 2026-02-10 | 13F | Moors & Cabot, Inc. | 17.200 | 0,80 | 106 | 15,38 | ||||
| 2025-12-02 | 13F | IFP Advisors, Inc | 0 | -100,00 | 0 | |||||
| 2025-09-25 | NP | DFAI - Dimensional International Core Equity Market ETF | 168.716 | 9,80 | 995 | 20,46 | ||||
| 2025-11-14 | 13F | Nomura Holdings Inc | Call | 0 | -100,00 | 0 | -100,00 | |||
| 2026-02-17 | 13F | Yaupon Capital Management LP | 866.736 | -85,28 | 5.330 | -83,14 | ||||
| 2025-09-25 | NP | VFSNX - Vanguard FTSE All-World ex-US Small-Cap Index Fund Institutional Shares | 2.539.165 | 3,57 | 14.972 | 13,31 | ||||
| 2026-02-10 | 13F | Foundations Investment Advisors, LLC | 14.202 | 6,65 | 87 | 22,54 | ||||
| 2026-01-29 | 13F | Washington Capital Management Inc | 59.800 | 368 | ||||||
| 2026-02-17 | 13F | DZ BANK AG Deutsche Zentral Genossenschafts Bank, Frankfurt am Main | 1.552.488 | -3,12 | 9.548 | 10,83 | ||||
| 2026-02-09 | 13F | Terril Brothers, Inc. | 56.328 | 11,26 | 346 | 27,68 | ||||
| 2026-02-13 | 13F | Quinn Opportunity Partners LLC | 430.000 | 0,00 | 2.644 | 14,51 | ||||
| 2026-01-23 | 13F | Assetmark, Inc | 20.246 | 7.934,13 | 125 | 12.300,00 | ||||
| 2026-01-15 | 13F | Allspring Global Investments Holdings, LLC | 54.000 | 38,11 | 332 | 58,85 | ||||
| 2026-02-17 | 13F | Jump Financial, LLC | 203.834 | -60,65 | 1.254 | -54,94 | ||||
| 2026-02-13 | 13F | Natixis | 172.843 | 21,06 | 1.065 | 39,58 | ||||
| 2026-02-04 | 13F | Atlantic Union Bankshares Corp | 850 | 5 | ||||||
| 2026-01-28 | 13F | Chicago Partners Investment Group LLC | 33.960 | -12,74 | 217 | -3,14 | ||||
| 2025-11-12 | 13F | Group One Trading, L.p. | Put | 0 | -100,00 | 0 | -100,00 | |||
| 2026-02-11 | 13F | Empowered Funds, LLC | 295.515 | 1.817 | ||||||
| 2026-02-17 | 13F | FIL Ltd | 48.999.903 | -1,85 | 301.307 | 12,29 | ||||
| 2026-02-12 | 13F | Swiss National Bank | 1.445.100 | 1,31 | 8.904 | 16,10 | ||||
| 2026-02-13 | 13F | Peak6 Llc | Call | 18.400 | 0,00 | 113 | 15,31 | |||
| 2026-01-27 | 13F | Krilogy Financial LLC | 1.597.165 | -7,49 | 10.286 | 6,57 | ||||
| 2026-02-02 | 13F | Cornerstone Planning Group LLC | 361 | 334,94 | 2 | -85,71 | ||||
| 2025-09-25 | NP | DFIS - Dimensional International Small Cap ETF | 331.110 | 0,00 | 1.957 | 9,83 | ||||
| 2026-02-12 | 13F | Renaissance Technologies Llc | 1.234.992 | -42,16 | 7.595 | -33,75 | ||||
| 2026-02-17 | 13F | Trexquant Investment LP | 1.111.876 | 125,15 | 6.838 | 157,94 | ||||
| 2025-11-12 | 13F | Simplex Trading, Llc | Put | 0 | -100,00 | 0 | ||||
| 2025-11-14 | 13F | Gluskin Sheff & Assoc Inc | 0 | -100,00 | 0 | -100,00 | ||||
| 2026-02-05 | 13F | Gabelli Funds Llc | 2.186.122 | 1,34 | 13.445 | 16,07 | ||||
| 2026-01-20 | 13F | Packer & Co Ltd | 4.513.113 | 0,00 | 28 | 12,50 | ||||
| 2026-02-13 | 13F | Beutel, Goodman & Co Ltd. | 262.070 | -41,42 | 2 | -50,00 | ||||
| 2026-02-05 | 13F | Allworth Financial LP | 954 | -11,67 | 6 | 0,00 | ||||
| 2026-02-17 | 13F | Two Sigma Investments, Lp | 718.039 | 43,15 | 4.416 | 63,94 | ||||
| 2026-02-17 | 13F | Jones Financial Companies Lllp | 0 | -100,00 | 0 | |||||
| 2025-11-14 | 13F | Citadel Advisors Llc | Put | 0 | -100,00 | 0 | -100,00 | |||
| 2025-09-25 | NP | DFIEX - International Core Equity Portfolio - Institutional Class This fund is a listed as child fund of Dimensional Fund Advisors Lp and if that institution has disclosed ownership in this security, then these positions will not be double counted when calculating total shares and total value | 747.141 | 0,00 | 4.405 | 9,41 | ||||
| 2026-02-13 | 13F | Rhumbline Advisers | 205 | 0,00 | 1 | 0,00 | ||||
| 2026-03-06 | 13F | Hsbc Holdings Plc | 0 | -100,00 | 0 | |||||
| 2025-11-13 | 13F | Macquarie Group Ltd | 0 | -100,00 | 0 | -100,00 | ||||
| 2026-01-22 | 13F | Alpha Omega Wealth Management LLC | 0 | -100,00 | 0 | |||||
| 2025-09-25 | NP | DFA INVESTMENT DIMENSIONS GROUP INC - World ex U.S. Core Equity Portfolio Institutional Class Shares | 23.300 | 0,00 | 137 | 9,60 | ||||
| 2025-09-26 | NP | FITFX - Fidelity Flex International Index Fund This fund is a listed as child fund of Fmr Llc and if that institution has disclosed ownership in this security, then these positions will not be double counted when calculating total shares and total value | 76.821 | 58,41 | 453 | 57,49 | ||||
| 2026-02-17 | 13F | Algert Global Llc | 56.565 | 110,99 | 0 | |||||
| 2026-02-24 | 13F | Bell Investment Advisors, Inc | 392 | 0,00 | 2 | 0,00 | ||||
| 2026-01-21 | 13F | SJS Investment Consulting Inc. | 400 | 0,00 | 2 | 0,00 | ||||
| 2026-02-18 | 13F | Guardian Capital Lp | 76.301 | 0,00 | 469 | 14,39 | ||||
| 2025-09-25 | NP | DFA INVESTMENT DIMENSIONS GROUP INC - International Social Core Equity Portfolio Institutional Class This fund is a listed as child fund of Dimensional Fund Advisors Lp and if that institution has disclosed ownership in this security, then these positions will not be double counted when calculating total shares and total value | 68.283 | 189,33 | 403 | 189,21 | ||||
| 2026-02-11 | 13F | RWC Asset Management LLP | 2.331.095 | -23,45 | 14.336 | -12,33 | ||||
| 2026-02-13 | 13F | Flow Traders U.s. Llc | 10.435 | 0 | ||||||
| 2026-02-17 | 13F | Consultiva Wealth Management, Corp. | 1.000 | 0,00 | 6 | 20,00 | ||||
| 2026-02-17 | 13F | Quantinno Capital Management LP | 23.440 | 144 | ||||||
| 2026-02-18 | 13F | State of Tennessee, Treasury Department | 0 | -100,00 | 0 | |||||
| 2026-01-30 | 13F | Bogart Wealth, LLC | 1 | 0,00 | 0 | |||||
| 2026-02-12 | 13F | Dimensional Fund Advisors Lp | 7.572.396 | 3,64 | 46.572 | 18,70 | ||||
| 2026-02-06 | 13F | EverSource Wealth Advisors, LLC | 2.232 | 321,93 | 14 | 550,00 | ||||
| 2026-01-22 | 13F | Apollon Wealth Management, LLC | 21.889 | 135 | ||||||
| 2025-09-26 | NP | John Hancock Preferred Income Fund | 0 | -100,00 | 0 | -100,00 | ||||
| 2026-02-17 | 13F | Starboard Value LP | 63.489.420 | 0,00 | 390.460 | 14,52 | ||||
| 2026-02-17 | 13F | Zimmer Partners, LP | 0 | -100,00 | 0 | |||||
| 2025-11-14 | 13F | Axa S.a. | 0 | -100,00 | 0 | |||||
| 2026-02-12 | 13F | Advisors Asset Management, Inc. | 103.387 | -27,32 | 636 | -16,78 | ||||
| 2026-02-05 | 13F | GABELLI & Co INVESTMENT ADVISERS, INC. | 62.000 | 0,00 | 381 | 14,76 | ||||
| 2026-02-11 | 13F | Parallel Advisors, LLC | 1.402 | 0,00 | 9 | 14,29 | ||||
| 2026-02-13 | 13F | Quarry LP | 0 | -100,00 | 0 | |||||
| 2026-02-02 | 13F | Principal Financial Group Inc | 12.069.980 | 74.263 | ||||||
| 2026-02-05 | 13F | Stephens Inc /ar/ | 13.505 | 0,00 | 83 | 15,28 | ||||
| 2026-02-10 | 13F | Natixis Advisors, L.p. | 0 | -100,00 | 0 | |||||
| 2025-11-14 | 13F | Jane Street Group, Llc | Call | 0 | -100,00 | 0 | -100,00 | |||
| 2026-02-11 | 13F | Private Management Group Inc | 6.432.155 | -1,11 | 39.558 | 13,26 | ||||
| 2026-02-13 | 13F | Smartleaf Asset Management LLC | 3.859 | 0,00 | 24 | 20,00 | ||||
| 2026-01-07 | 13F | Hilltop National Bank | 4.000 | 0,00 | 25 | 14,29 | ||||
| 2026-02-17 | 13F | Millennium Management Llc | 1.145.029 | 661,78 | 7.043 | 772,74 | ||||
| 2026-02-17 | 13F | Corvex Management LP | 6.183.855 | 0,00 | 38.031 | 14,52 |