Grundlæggende statistik
| Institutionelle ejere | 336 total, 333 long only, 0 short only, 3 long/short - change of -14,03% MRQ |
| Gennemsnitlig porteføljeallokering | 0.1749 % - change of -24,90% MRQ |
| Institutionelle aktier (lange) | 198.241.369 (ex 13D/G) - change of -47,95MM shares -19,48% MRQ |
| Institutionel værdi (lang) | $ 4.017.936 USD ($1000) |
Institutionelt ejerskab og aktionærer
América Móvil, S.A.B. de C.V. - Depositary Receipt (Common Stock) (US:AMX) har 336 institutionelle ejere og aktionærer, der har indsendt 13D/G- eller 13F-formularer til Securities Exchange Commission (SEC). Disse institutioner har i alt 198,241,369 aktier. Største aktionærer omfatter Capital International Investors, Fmr Llc, Lazard Asset Management Llc, Westwood Global Investments, LLC, NEWFX - NEW WORLD FUND INC Class A, Robeco Institutional Asset Management B.V., FAMKX - Fidelity Advisor Emerging Markets Fund Class A, CAIBX - CAPITAL INCOME BUILDER Class A, Boston Partners, and Discovery Capital Management, Llc / Ct .
América Móvil, S.A.B. de C.V. - Depositary Receipt (Common Stock) (NYSE:AMX) institutionel ejerskabsstruktur viser aktuelle positioner i virksomheden efter institutioner og fonde, samt seneste ændringer i positionsstørrelse. Større aktionærer kan omfatte individuelle investorer, investeringsforeninger, hedgefonde eller institutioner. Skema 13D angiver, at investoren besidder (eller besidder) mere end 5 % af virksomheden og har til hensigt (eller har til hensigt at) aktivt at forfølge en ændring i forretningsstrategi. Skema 13G indikerer en passiv investering på over 5%.
The share price as of March 20, 2026 is 23,33 / share. Previously, on March 21, 2025, the share price was 14,09 / share. This represents an increase of 65,58% over that period.

Fondens stemningsscore
Fund Sentiment Score (fka Ownership Accumulation Score) finder de aktier, der bliver mest købt af fonde. Det er resultatet af en sofistikeret, multi-faktor kvantitativ model, der identificerer virksomheder med de højeste niveauer af institutionel akkumulering. Scoringsmodellen bruger en kombination af den samlede stigning i oplyste ejere, ændringerne i porteføljeallokeringer i disse ejere og andre målinger. Tallet går fra 0 til 100, hvor højere tal indikerer et højere niveau af akkumulering for sine jævnaldrende, og 50 er gennemsnittet.
Opdateringsfrekvens: Dagligt
Se Ownership Explorer, som giver en liste over højest rangerende virksomheder.
AI+ Ask Fintel’s AI assistant about América Móvil, S.A.B. de C.V. - Depositary Receipt (Common Stock).
Select a question to share a public post with an AI-crafted answer.
Thinking of good questions…
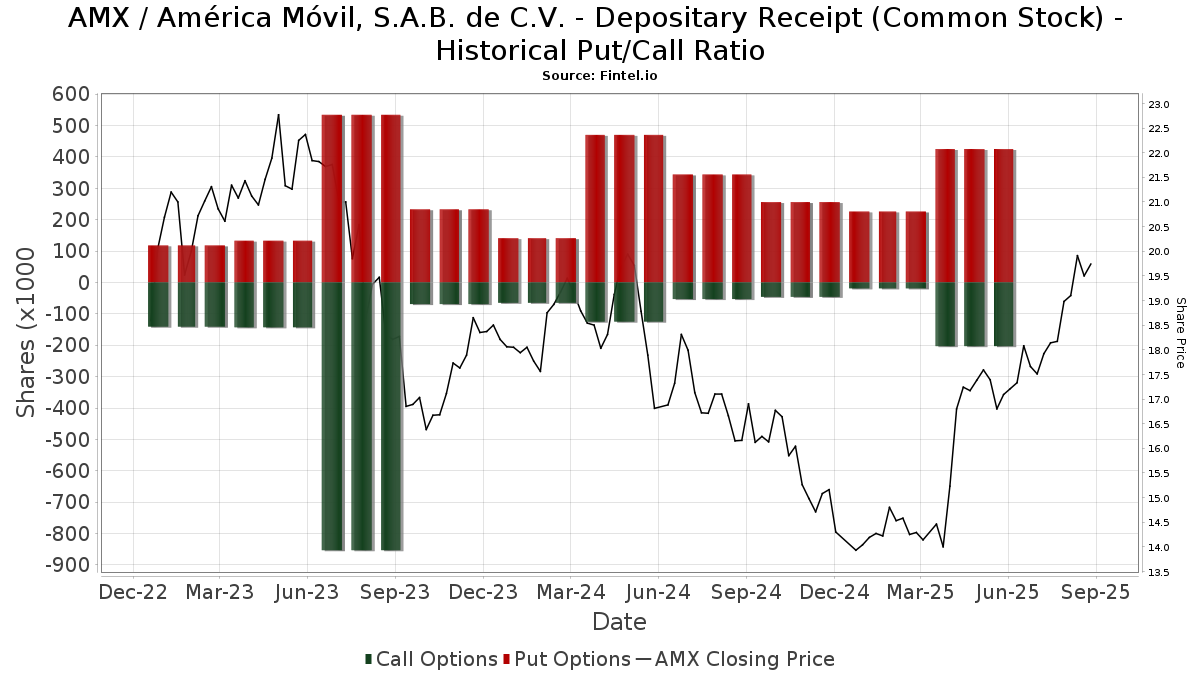
Institutionel Put/Call-forhold
Ud over at indberette standardaktie- og gældsudstedelser skal institutter med mere end 100 mill. aktiver under forvaltning også oplyse deres put- og call-optionsbeholdninger. Da salgsoptioner generelt indikerer negativ stemning, og købsoptioner indikerer positiv stemning, kan vi få en fornemmelse af den overordnede institutionelle stemning ved at plotte forholdet mellem put og kald. Diagrammet til højre viser det historiske put/call-forhold for dette instrument.
Brug af Put/Call Ratio som en indikator for investorernes stemning overvinder en af de vigtigste mangler ved at bruge totalt institutionelt ejerskab, som er, at en betydelig mængde af aktiver under forvaltning investeres passivt for at spore indekser. Passivt forvaltede fonde køber typisk ikke optioner, så indikatoren for put/call-forholdet følger mere nøje følelsen af aktivt forvaltede fonde.
13F og NPORT arkivering
Detaljer om 13F-arkivering er gratis. Detaljer om NP-ansøgninger kræver et premium-medlemskab. Grønne rækker angiver nye positioner. Røde rækker angiver lukkede positioner. Klik på linket ikon for at se den fulde transaktionshistorik.
Opgrader
for at låse premium-data op og eksportere til Excel ![]() .
.
| Fil dato | Kilde | Investor | Type | Gennemsnitlig pris (Øst) |
Aktier | Δ Aktier (%) |
Rapporteret Værdi ($1000) |
Δ Værdi (%) |
Port Alloc (%) |
|
|---|---|---|---|---|---|---|---|---|---|---|
| 2026-02-17 | 13F | PharVision Advisers, LLC | 13.869 | 287 | ||||||
| 2026-02-11 | 13F | Modus Advisors, LLC | 5.600 | 116 | ||||||
| 2026-02-11 | 13F | Janney Montgomery Scott LLC | 153.418 | 870,88 | 3 | |||||
| 2026-02-11 | 13F | Buckingham Strategic Partners | 0 | -100,00 | 0 | |||||
| 2026-02-17 | 13F | Scientech Research LLC | 10.163 | 210 | ||||||
| 2026-02-12 | 13F | Tocqueville Asset Management L.p. | 9.800 | 0,00 | 203 | -1,46 | ||||
| 2025-09-25 | NP | DFAE - Dimensional Emerging Core Equity Market ETF | 424.156 | 3,65 | 7.664 | 8,65 | ||||
| 2026-02-05 | 13F | Cambridge Investment Research Advisors, Inc. | 14.952 | -25,37 | 0 | |||||
| 2026-02-13 | 13F | Umb Bank N A/mo | 7.085 | 0,00 | 146 | -1,35 | ||||
| 2026-02-09 | 13F | Hartland & Co., LLC | 4.485 | 0,00 | 93 | -2,13 | ||||
| 2025-11-12 | 13F | CIBC Bancorp USA Inc. | 9.593 | 201 | ||||||
| 2025-09-26 | NP | PID - Invesco International Dividend Achievers ETF This fund is a listed as child fund of Invesco Ltd. and if that institution has disclosed ownership in this security, then these positions will not be double counted when calculating total shares and total value | 978.698 | -23,70 | 17.685 | -20,03 | ||||
| 2026-02-03 | 13F | Washington Trust Advisors, Inc. | 1.200 | 0,00 | 25 | -4,00 | ||||
| 2026-02-17 | 13F | Wellington Management Group Llp | 1.226.544 | -4,06 | 25.353 | -5,57 | ||||
| 2026-02-17 | 13F | Russell Investments Group, Ltd. | 1.389.292 | 3,92 | 28.717 | 2,28 | ||||
| 2026-02-17 | 13F | Aqr Capital Management Llc | 43.253 | -3,16 | 894 | -4,59 | ||||
| 2025-11-14 | 13F | Susquehanna International Group, Llp | 0 | -100,00 | 0 | -100,00 | ||||
| 2026-01-30 | 13F | Mitsubishi UFJ Trust & Banking Corp | 18.673 | -2,90 | 386 | -4,47 | ||||
| 2025-09-25 | NP | DFA INVESTMENT DIMENSIONS GROUP INC - Emerging Markets Sustainability Core 1 Portfolio Institutional Class This fund is a listed as child fund of Dimensional Fund Advisors Lp and if that institution has disclosed ownership in this security, then these positions will not be double counted when calculating total shares and total value | 62.004 | 0,00 | 1.120 | 4,87 | ||||
| 2026-02-13 | 13F | First Trust Advisors Lp | 1.865.335 | -3,19 | 38.556 | -4,71 | ||||
| 2026-02-13 | 13F | Y-Intercept (Hong Kong) Ltd | 122.436 | 2.531 | ||||||
| 2025-09-25 | NP | EMGAX - Wells Fargo Emerging Markets Equity Fund Class A | 1.482.980 | -20,67 | 26.797 | -16,86 | ||||
| 2026-02-03 | 13F | We Are One Seven, LLC | 10.727 | 1,85 | 222 | 0,00 | ||||
| 2026-02-17 | 13F | Citadel Advisors Llc | Call | 17.500 | -59,86 | 362 | -60,55 | |||
| 2026-02-03 | 13F | Ethic Inc. | 29.375 | 607 | ||||||
| 2026-02-11 | 13F | Brandes Investment Partners, Lp | 2.762.821 | -11,86 | 57.108 | -13,25 | ||||
| 2026-02-17 | 13F | Citadel Advisors Llc | Put | 27.500 | -56,69 | 568 | -57,39 | |||
| 2026-02-17 | 13F | Citadel Advisors Llc | 325.214 | 2.326,43 | 6.722 | 2.292,17 | ||||
| 2026-02-11 | 13F | Parallel Advisors, LLC | 6.731 | 15,36 | 139 | 13,93 | ||||
| 2026-02-03 | 13F | Manning & Napier Advisors Llc | 200.113 | -1,27 | 4.176 | -1,88 | ||||
| 2026-02-17 | 13F | Rexford Capital Inc | 10.758 | 17,32 | 222 | 15,63 | ||||
| 2026-01-27 | 13F | Elevated Capital Advisors, LLC | 264 | 5 | ||||||
| 2025-11-14 | 13F | Credit Agricole S A | 0 | -100,00 | 0 | |||||
| 2026-02-04 | 13F | LRI Investments, LLC | 346 | 0,00 | 7 | 0,00 | ||||
| 2025-10-09 | 13F | Independence Bank of Kentucky | 0 | -100,00 | 0 | -100,00 | ||||
| 2026-02-17 | 13F | Bedell Frazier Investment Counseling, LLC | 10.000 | 0,00 | 207 | -1,90 | ||||
| 2026-02-06 | 13F | Motco | 1.200 | 0,00 | 25 | -4,00 | ||||
| 2026-02-11 | 13F | Fox Run Management, L.l.c. | 54.639 | 1.129 | ||||||
| 2026-01-23 | 13F | Diversify Advisory Services, LLC | 21.577 | 0,29 | 441 | -9,26 | ||||
| 2026-02-12 | 13F | Dalton Investments LLC | 66.800 | 33,60 | 1.381 | 31,43 | ||||
| 2026-01-22 | 13F | Financial Consulate, Inc | 38 | 1 | ||||||
| 2026-02-17 | 13F | Ancora Advisors, LLC | 39 | 1 | ||||||
| 2026-02-04 | 13F | Bailard, Inc. | 50.200 | 0,40 | 1.038 | -1,24 | ||||
| 2025-09-26 | NP | FAMKX - Fidelity Advisor Emerging Markets Fund Class A This fund is a listed as child fund of Fmr Llc and if that institution has disclosed ownership in this security, then these positions will not be double counted when calculating total shares and total value | 7.205.400 | 186,20 | 130.202 | 199,99 | ||||
| 2026-02-10 | 13F | Peapack Gladstone Financial Corp | 14.950 | 0 | ||||||
| 2026-01-29 | 13F | Advantage Trust Co | 0 | -100,00 | 0 | |||||
| 2026-01-29 | 13F | Sanctuary Advisors, LLC | 58.358 | 4,81 | 1.206 | 3,17 | ||||
| 2026-02-03 | 13F | Garner Asset Management Corp | 400 | 8 | ||||||
| 2026-02-13 | 13F | Bridgefront Capital, LLC | 12.912 | 267 | ||||||
| 2025-09-24 | NP | SNTKX - Steward International Enhanced Index Fund Class A | 77.435 | 0,00 | 1.399 | 4,87 | ||||
| 2025-09-23 | NP | VVIFX - Voya VACS Series EME Fund | 57.081 | 0,00 | 1.031 | 4,78 | ||||
| 2026-02-06 | 13F | Larson Financial Group LLC | 385 | 1,05 | 8 | 0,00 | ||||
| 2026-02-17 | 13F | Bank Of America Corp /de/ | 548.689 | -15,06 | 11.341 | -16,40 | ||||
| 2026-02-12 | 13F | FreeGulliver LLC | 14.027 | 290 | ||||||
| 2026-02-03 | 13F | Sageworth Trust Co | 0 | -100,00 | 0 | |||||
| 2026-02-13 | 13F | Arkadios Wealth Advisors | 12.835 | 12,20 | 265 | 10,42 | ||||
| 2026-02-11 | 13F | Cerity Partners LLC | 25.856 | 64,71 | 534 | 62,31 | ||||
| 2026-02-19 | 13F | CI Private Wealth, LLC | 66.871 | 0,63 | 1.377 | -1,36 | ||||
| 2025-09-26 | NP | RTNAX - Tax-Managed International Equity Fund Class A | 384.689 | 504,32 | 6.951 | 533,64 | ||||
| 2026-02-13 | 13F | Stifel Financial Corp | 100.879 | -1,95 | 2.085 | -3,47 | ||||
| 2026-02-17 | 13F | United Capital Financial Advisers, Llc | 21.454 | 4,92 | 443 | 3,26 | ||||
| 2026-02-17 | 13F | Schonfeld Strategic Advisors LLC | 71.519 | 1.478 | ||||||
| 2026-01-08 | 13F | Grove Bank & Trust | 0 | -100,00 | 0 | |||||
| 2026-02-06 | 13F | EverSource Wealth Advisors, LLC | 3.157 | 40,00 | 65 | 38,30 | ||||
| 2026-02-13 | 13F | Magnolia Capital Advisors Llc | 12.966 | 0,00 | 268 | -1,47 | ||||
| 2026-02-12 | 13F | Raiffeisen Bank International AG | 100.120 | 31,01 | 2.090 | 30,64 | ||||
| 2026-02-17 | 13F | Virtus Investment Advisers, Inc. | 0 | -100,00 | 0 | |||||
| 2026-01-16 | 13F | Ronald Blue Trust, Inc. | 1.527 | -26,34 | 32 | -27,91 | ||||
| 2026-02-13 | 13F | Schroder Investment Management Group | 883.272 | 29,39 | 18.257 | 27,35 | ||||
| 2026-01-20 | 13F | SOA Wealth Advisors, LLC. | 784 | 0,00 | 16 | 0,00 | ||||
| 2026-02-17 | 13F | Mirabella Financial Services Llp | 0 | -100,00 | 0 | |||||
| 2026-01-20 | 13F | Hanson & Doremus Investment Management | 3.600 | 0,00 | 0 | |||||
| 2026-01-27 | 13F | Checchi Capital Advisers, LLC | 9.787 | 0,69 | 202 | -0,98 | ||||
| 2026-02-17 | 13F | Jones Financial Companies Lllp | 4.595 | 201,91 | 95 | 203,23 | ||||
| 2026-02-13 | 13F | American Century Companies Inc | 3.332.881 | 36,29 | 68.891 | 34,15 | ||||
| 2025-11-14 | 13F | Wolverine Trading, Llc | 16.614 | -66,65 | 348 | -60,21 | ||||
| 2026-02-13 | 13F | Wells Fargo & Company/mn | 647.294 | -3,17 | 13.380 | -4,69 | ||||
| 2025-11-14 | 13F | Wolverine Trading, Llc | Call | 50.200 | 1.051 | |||||
| 2025-11-14 | 13F | Wolverine Trading, Llc | Put | 81.400 | -62,24 | 1.704 | -54,89 | |||
| 2026-01-26 | 13F | Cwm, Llc | 14.546 | -30,53 | 0 | |||||
| 2026-02-11 | 13F | LPL Financial LLC | 190.401 | 11,38 | 3.936 | 9,61 | ||||
| 2026-02-10 | 13F | Westwood Global Investments, LLC | 12.597.066 | -4,10 | 260.381 | -5,60 | ||||
| 2026-02-02 | 13F | Oppenheimer Asset Management Inc. | 22.049 | -20,37 | 456 | -21,69 | ||||
| 2026-02-13 | 13F | Ieq Capital, Llc | 19.274 | -3,33 | 398 | -4,78 | ||||
| 2025-09-26 | NP | UUPIX - Ultraemerging Markets Profund Investor Class | 4.587 | 31,85 | 83 | 38,98 | ||||
| 2026-01-28 | 13F | CAPROCK Group, Inc. | 12.408 | 256 | ||||||
| 2026-01-30 | 13F | North Star Investment Management Corp. | 18.125 | 0,54 | 375 | -1,06 | ||||
| 2026-01-12 | 13F | Beacon Financial Strategies CORP | 2.100 | 43 | ||||||
| 2026-02-05 | 13F | May Hill Capital, LLC | 19.490 | 403 | ||||||
| 2026-01-16 | 13F | Piscataqua Savings Bank | 500 | 0,00 | 10 | 0,00 | ||||
| 2025-09-26 | NP | JDIBX - John Hancock Disciplined Value International Fund Class A | 2.200.965 | 39.771 | ||||||
| 2026-02-09 | 13F | Smithfield Trust Co | 606 | 0,00 | 0 | |||||
| 2026-01-30 | 13F | State of New Jersey Common Pension Fund D | 292.458 | 0,00 | 6.045 | -1,56 | ||||
| 2026-02-11 | 13F | Capital International Sarl | 1.086.490 | -18,43 | 22.458 | -19,71 | ||||
| 2026-02-17 | 13F | GAM Holding AG | 106.249 | 37,79 | 2.196 | 35,64 | ||||
| 2026-02-13 | 13F | NLB Skladi, upravljanje premozenja, d.o.o. | 25.000 | 517 | ||||||
| 2026-01-21 | 13F | TSP Capital Management Group, LLC | 3.900 | -3,94 | ||||||
| 2026-02-13 | 13F | Marshall Wace, Llp | 471.645 | 9.749 | ||||||
| 2026-02-13 | 13F | State Street Corp | 40.710 | 152,57 | 841 | 148,82 | ||||
| 2026-01-09 | 13F | Capstone Wealth Management Group LLC | 19.101 | 0,00 | 395 | -1,75 | ||||
| 2026-02-06 | 13F | Global Retirement Partners, LLC | 10.447 | 169,04 | 216 | 165,43 | ||||
| 2026-02-04 | 13F | First Foundation Advisors | 13.095 | 0,00 | 271 | -1,46 | ||||
| 2026-02-19 | 13F | Invesco Ltd. | 759.349 | -11,93 | 15.696 | -13,31 | ||||
| 2026-02-13 | 13F | Morgan Stanley | 3.970.788 | 9,78 | 82.076 | 8,05 | ||||
| 2026-02-17 | 13F | Susquehanna International Group, Llp | Put | 0 | -100,00 | 0 | -100,00 | |||
| 2026-02-12 | 13F | Federation des caisses Desjardins du Quebec | 314 | 6 | ||||||
| 2026-02-11 | 13F | Capital Group Private Client Services, Inc. | 380.377 | -5,18 | 7.862 | -6,67 | ||||
| 2026-01-16 | 13F | West Branch Capital LLC | 300 | 0,00 | 6 | 0,00 | ||||
| 2026-02-02 | 13F | Truist Financial Corp | 0 | -100,00 | 0 | |||||
| 2026-02-17 | 13F | North Capital, Inc. | 0 | -100,00 | 0 | |||||
| 2026-02-17 | 13F | Northern Trust Corp | 965.410 | -4,02 | 19.955 | -5,53 | ||||
| 2026-02-11 | 13F | O'shaughnessy Asset Management, Llc | 86.787 | 23,42 | 1.794 | 21,48 | ||||
| 2025-09-25 | NP | DFEM - Dimensional Emerging Markets Core Equity 2 ETF | 344.062 | 25,76 | 6.217 | 31,83 | ||||
| 2026-02-17 | 13F | Brevan Howard Capital Management LP | 0 | -100,00 | 0 | |||||
| 2026-02-13 | 13F | BNP Paribas Asset Management Holding S.A. | 8.850 | -4,32 | 0 | |||||
| 2026-02-11 | 13F | Simplex Trading, Llc | 1.138 | -89,28 | 24 | |||||
| 2026-02-13 | 13F | Barclays Plc | 1.826 | 14,27 | 38 | 12,12 | ||||
| 2026-01-20 | 13F | Princeton Global Asset Management LLC | 268 | 0,00 | 6 | 0,00 | ||||
| 2026-02-09 | 13F | King Luther Capital Management Corp | 16.000 | -5,88 | 331 | -7,56 | ||||
| 2026-02-13 | 13F | Kestra Advisory Services, LLC | 9.777 | 202 | ||||||
| 2026-02-17 | 13F | Delaware Management Holdings, Inc. | 2.349.114 | 48.557 | ||||||
| 2025-11-12 | 13F/A | Norges Bank | 95.201 | 0,00 | 1.557 | -3,77 | ||||
| 2026-02-05 | 13F | Center for Financial Planning, Inc. | 160 | 0,00 | 3 | 0,00 | ||||
| 2026-02-05 | 13F | Leuthold Group, Llc | 22.545 | 466 | ||||||
| 2026-02-12 | 13F | Hrt Financial Lp | 0 | -100,00 | 0 | |||||
| 2026-02-11 | 13F | Capital International Inc /ca/ | 1.351.016 | -35,79 | 27.926 | -36,80 | ||||
| 2026-01-27 | 13F | Proffitt & Goodson Inc | 292 | 0,00 | 6 | 0,00 | ||||
| 2026-02-13 | 13F | Brown Advisory Inc | 13.184 | 1,45 | 273 | 0,00 | ||||
| 2026-02-13 | 13F | MAI Capital Management | 40.373 | -0,70 | 835 | -2,23 | ||||
| 2025-09-26 | NP | MSTFX - Morningstar International Equity Fund | 62.295 | 13,65 | 1.126 | 19,17 | ||||
| 2026-02-06 | 13F | FourThought Financial Partners, LLC | 9.769 | 0,00 | 202 | -1,95 | ||||
| 2025-09-25 | NP | DEHP - Dimensional Emerging Markets High Profitability ETF | 42.811 | 23,76 | 774 | 29,70 | ||||
| 2025-09-25 | NP | CAIBX - CAPITAL INCOME BUILDER Class A | 6.231.217 | 0,00 | 112.598 | 4,81 | ||||
| 2026-02-02 | 13F | Montag A & Associates Inc | 1.962 | -5,63 | 41 | -6,98 | ||||
| 2026-02-13 | 13F | Boston Partners | 4.835.629 | 7,25 | 99.952 | 5,56 | ||||
| 2026-02-12 | 13F | BlackRock, Inc. | 554.837 | 44,29 | 11.468 | 42,04 | ||||
| 2026-02-06 | 13F | Kilter Group LLC | 0 | -100,00 | 0 | |||||
| 2026-02-13 | 13F | Citigroup Inc | 407.257 | 16,77 | 8.418 | 14,94 | ||||
| 2026-02-17 | 13F | Raymond James Financial Inc | 115.824 | 1,52 | 2.394 | -0,04 | ||||
| 2026-02-17 | 13F | Warren Averett Asset Management, LLC | 11.656 | 12,59 | 241 | 10,60 | ||||
| 2026-01-21 | 13F | Sound Income Strategies, LLC | 132 | 0,00 | 3 | 0,00 | ||||
| 2026-02-13 | 13F | JustInvest LLC | 15.220 | 24,51 | 315 | 22,66 | ||||
| 2026-02-17 | 13F | Limestone Investment Advisors LP | 21.248 | 0,00 | 439 | -1,57 | ||||
| 2026-02-05 | 13F | High Note Wealth, LLC | 11 | 0,00 | 0 | |||||
| 2026-02-12 | 13F | Principal Securities, Inc. | 0 | -100,00 | 0 | -100,00 | ||||
| 2026-02-17 | 13F | Engineers Gate Manager LP | 76.528 | 1.582 | ||||||
| 2026-02-13 | 13F | Caitong International Asset Management Co., Ltd | 1.085 | 21.600,00 | 22 | |||||
| 2026-01-23 | 13F | Assetmark, Inc | 185.146 | 9,11 | 3.827 | 7,38 | ||||
| 2026-02-11 | 13F | Capital International Ltd /ca/ | 558.108 | -17,85 | 11.536 | -19,14 | ||||
| 2026-02-17 | 13F | Ameriprise Financial Inc | 241.239 | 0,37 | 4.986 | -1,21 | ||||
| 2026-02-12 | 13F | Renaissance Technologies Llc | 1.428.528 | -20,65 | 29.528 | -21,89 | ||||
| 2026-02-17 | 13F | American Trust Investment Advisors, LLC | 106.225 | -0,18 | 2.196 | -1,75 | ||||
| 2026-02-13 | 13F | SRS Capital Advisors, Inc. | 2.412 | 34,00 | 50 | 32,43 | ||||
| 2026-02-12 | 13F | APG Asset Management N.V. | 26.779 | -31,12 | 471 | -32,13 | ||||
| 2026-02-13 | 13F | Wealth Alliance | 0 | -100,00 | 0 | |||||
| 2026-02-19 | 13F | Atomi Financial Group, Inc. | 20.981 | 29,87 | 434 | 27,73 | ||||
| 2026-02-10 | 13F | Connor, Clark & Lunn Investment Management Ltd. | 561.947 | 6,14 | 11.615 | 4,47 | ||||
| 2026-02-17 | 13F | Laird Norton Trust Company, Llc | 12.480 | 258 | ||||||
| 2026-01-23 | 13F | Ritholtz Wealth Management | 10.190 | 211 | ||||||
| 2025-11-12 | 13F | Tiaa Trust, National Association | 0 | -100,00 | 0 | |||||
| 2026-02-09 | 13F | Hantz Financial Services, Inc. | 118.916 | -0,62 | 2 | 0,00 | ||||
| 2025-10-31 | 13F | Whittier Trust Co | 0 | -100,00 | 0 | |||||
| 2026-02-13 | 13F | Rhumbline Advisers | 6.979 | -12,19 | 144 | -13,25 | ||||
| 2026-01-20 | 13F | AdvisorNet Financial, Inc | 232 | 0,00 | 5 | 0,00 | ||||
| 2026-03-06 | 13F | Union Savings Bank | 700 | 0,00 | 14 | 16,67 | ||||
| 2026-01-29 | 13F | Vanguard Group Inc | 141.722 | -10,41 | 2.929 | -11,80 | ||||
| 2026-01-07 | 13F | Hilltop National Bank | 1.498 | 0,00 | 31 | -3,23 | ||||
| 2026-02-12 | 13F | Hollencrest Capital Management | 259 | 0,00 | 5 | 0,00 | ||||
| 2026-02-24 | 13F | Bell Investment Advisors, Inc | 120 | 71,43 | 2 | 100,00 | ||||
| 2026-01-12 | 13F | Silverberg Bernstein Capital Management LLC | 15.492 | 0,00 | 320 | -1,54 | ||||
| 2026-02-17 | 13F | Holocene Advisors, LP | 205.874 | 4.255 | ||||||
| 2026-01-08 | 13F | Versant Capital Management, Inc | 748 | 0,00 | 15 | 0,00 | ||||
| 2026-02-04 | 13F | Western Pacific Wealth Management, LP | 0 | -100,00 | 0 | |||||
| 2025-11-06 | 13F | Ameritas Advisory Services, LLC | 0 | -100,00 | 0 | |||||
| 2026-02-10 | 13F | Natixis Advisors, L.p. | 54.290 | -65,09 | 1 | -66,67 | ||||
| 2026-01-23 | 13F | Rsm Us Wealth Management Llc | 18.975 | 4,04 | 396 | 3,13 | ||||
| 2026-02-10 | 13F/A | Northwestern Mutual Wealth Management Co | 77.387 | -0,09 | 1.600 | -1,66 | ||||
| 2026-02-12 | 13F | Wealthspire Advisors, LLC | 14.670 | 31,62 | 303 | 29,49 | ||||
| 2026-02-17 | 13F | SageView Advisory Group, LLC | 789 | 16 | ||||||
| 2026-02-17 | 13F | Ibex Wealth Advisors | 12.188 | 0,00 | 252 | -1,57 | ||||
| 2025-12-16 | 13F | Garde Capital, Inc. | 0 | -100,00 | 0 | |||||
| 2026-02-12 | 13F | Campbell & CO Investment Adviser LLC | 303.053 | 6.264 | ||||||
| 2026-01-26 | 13F | Private Trust Co Na | 4.042 | 0,00 | 84 | -1,19 | ||||
| 2026-01-23 | 13F | Farther Finance Advisors, LLC | 19.083 | 243,90 | 394 | 239,66 | ||||
| 2026-02-11 | 13F | Fca Corp /tx | 10.000 | 0,00 | 207 | -1,90 | ||||
| 2026-02-09 | 13F | Bleakley Financial Group, LLC | 13.601 | 15,80 | 281 | 14,23 | ||||
| 2026-02-03 | 13F | Sequoia Financial Advisors, LLC | 36.232 | 62,48 | 749 | 59,83 | ||||
| 2026-02-13 | 13F | Pathstone Holdings, LLC | 0 | -100,00 | 0 | |||||
| 2026-01-20 | 13F | Signaturefd, Llc | 9.925 | 0,23 | 205 | -0,97 | ||||
| 2025-09-25 | NP | Dfa Investment Trust Co - The Emerging Markets Series This fund is a listed as child fund of Dimensional Fund Advisors Lp and if that institution has disclosed ownership in this security, then these positions will not be double counted when calculating total shares and total value | 7.345 | 0,00 | 133 | 4,76 | ||||
| 2026-01-08 | 13F | Tuttle Tactical Management LLC | 13.282 | 275 | ||||||
| 2026-01-30 | 13F | Us Bancorp \de\ | 229.185 | -0,17 | 4.737 | -1,74 | ||||
| 2026-01-15 | 13F | Highline Wealth Partners Llc | 302 | 0,00 | 6 | 0,00 | ||||
| 2026-02-17 | 13F | Cape Investment Advisory, Inc. | 236 | 0,00 | 5 | 0,00 | ||||
| 2026-01-05 | 13F | Rosenberg Matthew Hamilton | 515 | 0,00 | 11 | 0,00 | ||||
| 2025-11-20 | 13F | First Affirmative Financial Network | 13.336 | 10,18 | 280 | 29,03 | ||||
| 2026-02-17 | 13F | Jain Global LLC | 98.999 | 13,40 | 2.046 | 11,62 | ||||
| 2026-02-06 | 13F | Pnc Financial Services Group, Inc. | 25.250 | -39,90 | 522 | -40,93 | ||||
| 2026-01-29 | 13F | Sava Infond d.o.o. | 20.000 | 0,00 | 413 | -1,67 | ||||
| 2026-02-17 | 13F | Fmr Llc | 24.465.658 | 3,86 | 505.705 | 2,22 | ||||
| 2025-09-26 | NP | RGEAX - Global Equity Fund Class A | 166.500 | -7,27 | 3.009 | -2,81 | ||||
| 2026-02-12 | 13F | Steward Partners Investment Advisory, Llc | 2.594 | -0,46 | 54 | -1,85 | ||||
| 2026-02-02 | 13F | Advisors Preferred, LLC | 0 | -100,00 | 0 | |||||
| 2025-09-25 | NP | Elevation Series Trust - The Opal International Dividend Income ETF | 102.056 | 1.844 | ||||||
| 2026-02-10 | 13F | Rothschild Investment Llc | 2.546 | 0,00 | 53 | -1,89 | ||||
| 2026-02-13 | 13F | National Bank Of Canada /fi/ | 4.125 | -4,09 | 85 | -5,56 | ||||
| 2026-01-27 | 13F | Asset Management One Co., Ltd. | 160.122 | 0,44 | 3.339 | -0,27 | ||||
| 2026-02-02 | 13F | Fifth Third Bancorp | 1.012 | -15,67 | 21 | -20,00 | ||||
| 2026-02-13 | 13F | Neuberger Berman Group LLC | 16.298 | 337 | ||||||
| 2026-02-13 | 13F | Financial Freedom, LLC | 1.699 | 1,19 | 35 | 0,00 | ||||
| 2026-02-12 | 13F | Quadrant Capital Group Llc | 68.274 | 0,32 | 1.411 | -1,26 | ||||
| 2026-03-16 | 13F | Bank of New Hampshire | 1.150 | 0,00 | 24 | -4,17 | ||||
| 2026-02-12 | 13F | Callan Family Office, LLC | 55.800 | 1.153 | ||||||
| 2025-09-29 | NP | VRAI - Virtus Real Asset Income ETF | 10.074 | -8,83 | 182 | -4,21 | ||||
| 2026-02-13 | 13F | Ubs Asset Management Americas Inc | 870 | 18 | ||||||
| 2026-02-17 | 13F | Advisor Group Holdings, Inc. | 36.572 | -13,91 | 756 | -14,09 | ||||
| 2026-02-09 | 13F | Delta Asset Management Llc/tn | 5.800 | 0,00 | 120 | -1,65 | ||||
| 2025-11-13 | 13F | Nemes Rush Group LLC | 0 | -100,00 | 0 | |||||
| 2025-11-14 | 13F | Walleye Capital LLC | Call | 0 | -100,00 | 0 | ||||
| 2025-09-25 | NP | VMNVX - Vanguard Global Minimum Volatility Fund Admiral Shares | 151.487 | -50,35 | 2.737 | -47,96 | ||||
| 2025-11-14 | 13F | Walleye Capital LLC | Put | 0 | -100,00 | 0 | ||||
| 2025-11-14 | 13F | Walleye Capital LLC | 0 | -100,00 | 0 | |||||
| 2026-02-13 | 13F | Pin Oak Investment Advisors Inc | 10.850 | 0,00 | 0 | -100,00 | ||||
| 2026-02-13 | 13F | Mml Investors Services, Llc | 43.731 | 8,85 | 904 | 7,12 | ||||
| 2025-09-26 | NP | FTCEX - Fidelity Total International Equity Fund Fidelity Advisor Total International Equity Fund: Class C This fund is a listed as child fund of Fmr Llc and if that institution has disclosed ownership in this security, then these positions will not be double counted when calculating total shares and total value | 140.611 | 14,13 | 2.541 | 19,59 | ||||
| 2026-02-03 | 13F | Crossmark Global Holdings, Inc. | 125.542 | -13,63 | 2.595 | -15,01 | ||||
| 2026-02-04 | 13F | Abc Arbitrage Sa | 100.147 | 2.070 | ||||||
| 2026-02-06 | 13F | Profund Advisors Llc | 45.031 | 10,36 | 931 | 8,64 | ||||
| 2026-01-23 | 13F | Westside Investment Management, Inc. | 75 | 0,00 | 2 | 0,00 | ||||
| 2025-09-25 | NP | DFCEX - Emerging Markets Core Equity Portfolio - Institutional Class This fund is a listed as child fund of Dimensional Fund Advisors Lp and if that institution has disclosed ownership in this security, then these positions will not be double counted when calculating total shares and total value | 2.718.239 | 0,00 | 49.119 | 4,81 | ||||
| 2026-02-10 | 13F | Greenwich Wealth Management LLC | 153.440 | 0,00 | 3 | 0,00 | ||||
| 2026-02-18 | 13F | GWM Advisors LLC | 25.093 | 28,88 | 519 | 26,96 | ||||
| 2026-03-11 | 13F | Larry Mathis Financial Planning, LLC | 13.250 | 274 | ||||||
| 2025-11-12 | 13F | Group One Trading, L.p. | 0 | -100,00 | 0 | -100,00 | ||||
| 2026-02-13 | 13F | Pinnacle Wealth Planning Services, Inc. | 386 | 8 | ||||||
| 2026-02-27 | 13F | Strategic Investment Solutions, Inc. /IL | 700 | 0,00 | 14 | 0,00 | ||||
| 2025-09-25 | NP | DEXC - Dimensional Emerging Markets ex China Core Equity ETF | 23.670 | 14,74 | 428 | 20,28 | ||||
| 2026-01-26 | 13F | Valmark Advisers, Inc. | 12.840 | 0,00 | 265 | -1,49 | ||||
| 2026-02-13 | 13F | Mariner, LLC | 37.999 | 7,21 | 786 | 5,51 | ||||
| 2026-02-17 | 13F | Opal Capital Llc | 128.624 | 2.659 | ||||||
| 2026-02-11 | 13F | Franklin Resources Inc | 15.088 | 34,64 | 312 | 32,34 | ||||
| 2026-02-17 | 13F | Guggenheim Capital Llc | 11.666 | -29,36 | 241 | -30,35 | ||||
| 2026-01-30 | 13F/A | M&t Bank Corp | 165.510 | 0,00 | 3.421 | -1,55 | ||||
| 2026-02-13 | 13F | Arrowstreet Capital, Limited Partnership | 0 | -100,00 | 0 | |||||
| 2026-02-12 | 13F | Brown Brothers Harriman & Co | 932 | 116,74 | 19 | 111,11 | ||||
| 2026-02-12 | 13F | Commonwealth Equity Services, Llc | 92.692 | -9,87 | 1.916 | 95.650,00 | ||||
| 2026-02-17 | 13F | Creative Planning | 126.167 | 18,47 | 2.608 | 16,59 | ||||
| 2026-01-09 | 13F | SG Americas Securities, LLC | 0 | -100,00 | 0 | |||||
| 2025-11-14 | 13F | Squarepoint Ops LLC | 0 | -100,00 | 0 | |||||
| 2026-01-14 | 13F | Eastern Bank | 1.342 | 0,00 | 28 | -3,57 | ||||
| 2025-11-14 | 13F | Aigen Investment Management, Lp | 0 | -100,00 | 0 | |||||
| 2026-02-10 | 13F | Bank of New York Mellon Corp | 38.886 | -4,51 | 804 | -6,08 | ||||
| 2025-09-26 | NP | RINYX - International Developed Markets Fund Class Y | 80.426 | 0,00 | 1.453 | 4,83 | ||||
| 2026-02-09 | 13F | AIA Group Ltd | 320.221 | -2,75 | 6.619 | -4,30 | ||||
| 2026-02-13 | 13F | Toroso Investments, LLC | 103.771 | -8,32 | 2.145 | -9,76 | ||||
| 2026-01-27 | 13F | Evergreen Capital Management Llc | 24.352 | -41,19 | 503 | -42,12 | ||||
| 2026-01-29 | 13F | UBS Group AG | 356.338 | -61,40 | 7.366 | -62,00 | ||||
| 2025-09-23 | NP | IEMGX - Voya Multi-Manager Emerging Markets Equity Fund Class I | 39.453 | -17,90 | 713 | -14,01 | ||||
| 2026-01-28 | 13F | Geneos Wealth Management Inc. | 3.005 | 0,00 | 62 | -1,59 | ||||
| 2026-01-15 | 13F | Investment Partners Asset Management, Inc. | 12.247 | 0,00 | 253 | -1,56 | ||||
| 2026-02-17 | 13F | Advisory Services Network, LLC | 0 | -100,00 | 0 | |||||
| 2026-01-20 | 13F | Nvwm, Llc | 3.600 | 0,00 | 74 | -1,33 | ||||
| 2026-02-17 | 13F | Amundi | 2.142.482 | -0,12 | 44.285 | -1,18 | ||||
| 2026-01-28 | 13F | Teacher Retirement System Of Texas | 1.660.300 | 10,64 | 34.318 | 8,90 | ||||
| 2026-01-26 | 13F | PFG Investments, LLC | 9.991 | 0,80 | 207 | -0,96 | ||||
| 2026-02-23 | 13F | Vinland Capital Management Gestora de Recursos LTDA. | 0 | -100,00 | 0 | -100,00 | ||||
| 2025-09-29 | NP | CNGLX - Commonwealth Global Fund | 10.000 | 0,00 | 181 | 4,65 | ||||
| 2026-02-06 | 13F | Banque Cantonale Vaudoise | 45.300 | 0,00 | 936 | |||||
| 2026-01-21 | 13F | Yousif Capital Management, Llc | 12.818 | 0,00 | 265 | -1,86 | ||||
| 2026-01-16 | 13F | Trust Co Of Vermont | 1.498 | 0,00 | 31 | -3,23 | ||||
| 2026-02-11 | 13F | TCTC Holdings, LLC | 3.600 | 0,00 | 74 | -1,33 | ||||
| 2026-02-12 | 13F | Bank Of Montreal /can/ | 29.945 | 2,47 | 619 | 0,82 | ||||
| 2026-01-26 | 13F | Merit Financial Group, LLC | 0 | -100,00 | 0 | |||||
| 2025-10-17 | 13F | Hm Payson & Co | 0 | -100,00 | 0 | -100,00 | ||||
| 2026-02-10 | 13F | Bnp Paribas Arbitrage, Sa | 314.197 | 495,70 | 6.494 | 486,63 | ||||
| 2026-03-12 | 13F | Nalls Sherbakoff Group, Llc | 273 | 6 | ||||||
| 2026-02-13 | 13F | Walleye Trading LLC | 8.644 | -83,09 | 179 | -83,41 | ||||
| 2026-02-13 | 13F | Walleye Trading LLC | Put | 3.400 | -89,73 | 70 | -89,93 | |||
| 2026-02-13 | 13F | Walleye Trading LLC | Call | 1.100 | -69,44 | 23 | -70,67 | |||
| 2026-01-30 | 13F | Verity Asset Management, Inc. | 21.908 | 453 | ||||||
| 2026-02-06 | 13F | HighTower Advisors, LLC | 25.451 | 9,47 | 526 | 7,79 | ||||
| 2026-02-06 | 13F | Leonteq Securities AG | 234 | 0,00 | 5 | 0,00 | ||||
| 2026-02-03 | 13F | Chesapeake Capital Corp /il/ | 37.043 | 0,00 | 766 | -1,54 | ||||
| 2026-02-09 | 13F | Harbour Investments, Inc. | 2.052 | 5,18 | 42 | 5,00 | ||||
| 2026-02-12 | 13F | Brinker Capital Investments, LLC | 12.954 | -0,24 | 268 | -1,84 | ||||
| 2026-01-22 | 13F | Pinnacle Bancorp, Inc. | 522 | -16,21 | 11 | -23,08 | ||||
| 2026-02-17 | 13F | Aquatic Capital Management LLC | 0 | -100,00 | 0 | |||||
| 2026-02-02 | 13F | Horizon Investments, LLC | 0 | -100,00 | 0 | |||||
| 2026-02-13 | 13F | Sei Investments Co | 233.460 | -5,90 | 4.826 | -7,37 | ||||
| 2026-02-09 | 13F | Huntington National Bank | 13.354 | -0,31 | 276 | -1,78 | ||||
| 2026-01-27 | 13F | Brighton Jones Llc | 0 | -100,00 | 0 | |||||
| 2026-02-17 | 13F | Henry James International Management Inc. | 142.572 | -0,13 | 2.947 | -1,70 | ||||
| 2026-02-17 | 13F | Lazard Asset Management Llc | 17.667.555 | -0,20 | 365.188 | -1,77 | ||||
| 2026-01-23 | 13F | Robeco Institutional Asset Management B.V. | 8.376.918 | 93,77 | 173.151 | 90,73 | ||||
| 2026-02-03 | 13F | NewEdge Wealth, LLC | 12.936 | 18,36 | 267 | 6,37 | ||||
| 2026-02-09 | 13F | Morningstar Investment Management LLC | 0 | -100,00 | 0 | |||||
| 2026-02-04 | 13F | Raelipskie Partnership | 1.800 | 0,00 | 37 | 0,00 | ||||
| 2026-02-10 | 13F | Eurizon Capital SGR S.p.A. | 72.940 | 1.508 | ||||||
| 2026-02-17 | 13F | Parvin Asset Management, LLC | 2.750 | 0,00 | 57 | -1,75 | ||||
| 2025-09-25 | NP | NEWFX - NEW WORLD FUND INC Class A | 10.094.064 | 0,00 | 182.400 | 4,81 | ||||
| 2026-02-17 | 13F | Royal Bank Of Canada | 379.396 | -3,03 | 7.842 | -4,55 | ||||
| 2026-01-14 | 13F | Klein Pavlis & Peasley Financial, Inc. | 53.660 | 111,58 | 1.109 | 108,46 | ||||
| 2026-01-29 | 13F | Nbc Securities, Inc. | 20.082 | -20,83 | 415 | -21,99 | ||||
| 2026-01-22 | 13F | Bartlett & Co. Wealth Management Llc | 5.400 | 0,00 | 112 | -1,77 | ||||
| 2026-02-04 | 13F | Tsfg, Llc | 0 | -100,00 | 0 | |||||
| 2026-02-17 | 13F | Public Employees Retirement System Of Ohio | 9.040 | -77,93 | 187 | -78,37 | ||||
| 2026-01-21 | 13F | Perfromance Wealth Partners, LLC | 11.800 | 0,00 | 244 | -1,62 | ||||
| 2026-01-29 | 13F | Ashton Thomas Private Wealth, LLC | 13.306 | 13,56 | 275 | 11,79 | ||||
| 2026-02-11 | 13F | Capital Wealth Planning, LLC | 334.948 | 55,91 | 6.923 | 53,47 | ||||
| 2026-02-05 | 13F | Thrivent Financial For Lutherans | 103.236 | 84,89 | 2 | 100,00 | ||||
| 2025-09-25 | NP | DFA INVESTMENT DIMENSIONS GROUP INC - World ex U.S. Core Equity Portfolio Institutional Class Shares | 2.021 | -72,41 | 37 | -71,43 | ||||
| 2026-01-23 | 13F | Lester Murray Antman dba SimplyRich | 11.666 | 0,00 | 0 | |||||
| 2026-02-17 | 13F | Cetera Investment Advisers | 71.913 | -12,04 | 1.486 | -13,40 | ||||
| 2025-11-05 | 13F | Plante Moran Financial Advisors, LLC | 0 | -100,00 | 0 | -100,00 | ||||
| 2025-11-13 | 13F | Glenmede Investment Management, LP | 1.318.446 | 0,35 | 27.687 | 17,47 | ||||
| 2026-01-06 | 13F | Investors Research Corp | 2.100 | -91,83 | 43 | -92,02 | ||||
| 2026-02-12 | 13F | Moneta Group Investment Advisors Llc | 11.095 | -0,51 | 229 | -2,14 | ||||
| 2026-02-05 | 13F | Allworth Financial LP | 32.779 | -2,06 | 678 | -3,56 | ||||
| 2026-02-17 | 13F | Wiley Bros.-aintree Capital, Llc | 21.909 | -4,05 | 453 | -5,64 | ||||
| 2026-02-11 | 13F | Jpmorgan Chase & Co | 312.870 | -1,77 | 6.467 | -3,30 | ||||
| 2025-11-13 | 13F | Banco BTG Pactual S.A. | 0 | -100,00 | 0 | -100,00 | ||||
| 2026-02-06 | 13F | Heritage Investors Management Corp | 58.256 | 0,00 | 1 | 0,00 | ||||
| 2026-02-04 | 13F | Birchbrook, Inc. | 1.200 | 0,00 | 25 | -4,00 | ||||
| 2026-02-13 | 13F | Atlas Capital Advisors Llc | 1.786 | 0,00 | 37 | 12,50 | ||||
| 2025-09-25 | NP | DFSE - Dimensional Emerging Markets Sustainability Core 1 ETF | 26.783 | 0,00 | 484 | 4,77 | ||||
| 2026-01-05 | 13F | GAMMA Investing LLC | 1.541 | 10,47 | 32 | 6,90 | ||||
| 2026-02-10 | 13F | Envestnet Asset Management Inc | 833.986 | 2,65 | 17.238 | 1,04 | ||||
| 2026-01-27 | 13F | First Horizon Corp | 840 | 0,00 | 17 | 0,00 | ||||
| 2026-01-14 | 13F | Jfs Wealth Advisors, Llc | 354 | 0,00 | 7 | 0,00 | ||||
| 2026-02-13 | 13F | Itau Unibanco Holding S.A. | 2.450.123 | 23,60 | 50.758 | 21,93 | ||||
| 2026-02-17 | 13F | Auxier Asset Management | 75.515 | -0,92 | 1.561 | -2,50 | ||||
| 2026-01-14 | 13F | Generali Investments CEE, investicni spolecnost, a.s. | 30.312 | -35,37 | 627 | -36,38 | ||||
| 2026-02-17 | 13F | Perritt Capital Management Inc | 0 | -100,00 | 0 | |||||
| 2026-02-10 | 13F | Goldman Sachs Group Inc | 1.408.154 | -8,10 | 29.107 | -9,54 | ||||
| 2026-02-04 | 13F | Atlantic Union Bankshares Corp | 600 | 0,00 | 12 | 0,00 | ||||
| 2026-02-06 | 13F | Axxcess Wealth Management, Llc | 36.505 | 1,19 | 755 | -0,40 | ||||
| 2026-02-12 | 13F | Helium Advisors LLC | 0 | -100,00 | 0 | |||||
| 2026-02-11 | 13F | Capital Group Investment Management Pte. Ltd. | 116.927 | -17,05 | 2.417 | -18,38 | ||||
| 2026-02-14 | 13F | Rockefeller Capital Management L.P. | 1.150.998 | 55,01 | 23.819 | 52,75 | ||||
| 2026-01-15 | 13F | Allspring Global Investments Holdings, LLC | 2.589.651 | -5,57 | 53.528 | -5,75 | ||||
| 2026-01-16 | 13F | DiNuzzo Private Wealth, Inc. | 748 | 0,00 | 15 | 7,14 | ||||
| 2026-02-12 | 13F | Advisors Asset Management, Inc. | 64.769 | 51,78 | 1.339 | 49,33 | ||||
| 2026-02-13 | 13F | Pacific Center for Financial Services | 200 | 0,00 | 4 | 0,00 | ||||
| 2025-10-30 | 13F | Twin Peaks Wealth Advisors, LLC | 0 | -100,00 | 0 | |||||
| 2026-02-10 | 13F | Savant Capital, LLC | 12.047 | -3,65 | 249 | -4,96 | ||||
| 2025-11-14 | 13F | Tower Research Capital LLC (TRC) | 0 | -100,00 | 0 | |||||
| 2025-12-15 | 13F | FNY Investment Advisers, LLC | 0 | -100,00 | 0 | |||||
| 2026-01-08 | 13F | Wealth Enhancement Advisory Services, Llc | 28.207 | 0,85 | 573 | -1,04 | ||||
| 2026-02-04 | 13F | NAN FUNG TRINITY (HK) Ltd | 1.433.900 | 0,00 | 29.639 | -1,57 | ||||
| 2026-02-17 | 13F | XTX Topco Ltd | 106.100 | 535,60 | 2.193 | 526,57 | ||||
| 2026-02-18 | 13F | Vident Advisory, LLC | 18.034 | 373 | ||||||
| 2026-02-11 | 13F | Capital International Investors | 40.354.741 | -28,27 | 834.191 | -29,39 | ||||
| 2026-01-26 | 13F | Mirae Asset Global Investments Co., Ltd. | 18.853 | 6,44 | 390 | 4,85 | ||||
| 2026-01-28 | 13F | Field & Main Bank | 13.000 | 0,00 | 269 | -1,83 | ||||
| 2026-01-14 | 13F | TrueMark Investments, LLC | 128.624 | 14,95 | 2.659 | 13,15 | ||||
| 2026-02-17 | 13F | Millennium Management Llc | 192.219 | 410,80 | 3.973 | 402,91 | ||||
| 2026-02-12 | 13F | Dimensional Fund Advisors Lp | 4.215.162 | 1,72 | 87.129 | 0,12 | ||||
| 2026-02-12 | 13F | Qtron Investments LLC | 0 | -100,00 | 0 | |||||
| 2025-11-13 | 13F | Canada Pension Plan Investment Board | 0 | -100,00 | 0 | -100,00 | ||||
| 2026-01-22 | 13F | Maseco Llp | 3.000 | 0,00 | 62 | -3,17 | ||||
| 2026-02-06 | 13F | IFP Advisors, Inc | 4.449 | 0,00 | 92 | -2,15 | ||||
| 2025-09-25 | NP | DAADX - Emerging Markets ex China Core Equity Portfolio Institutional Class | 80.990 | -27,16 | 1.463 | -23,64 | ||||
| 2025-09-25 | NP | DFAX - Dimensional World ex U.S. Core Equity 2 ETF | 50.516 | 0,57 | 913 | 5,43 | ||||
| 2026-01-21 | 13F | Newbridge Financial Services Group, Inc. | 155 | 0,00 | 3 | 0,00 | ||||
| 2026-01-08 | 13F | Armstrong Advisory Group, Inc | 4.782 | 0,00 | 99 | -2,00 | ||||
| 2026-02-05 | 13F | Commerzbank Aktiengesellschaft /fi | 10.750 | -53,32 | 0 | |||||
| 2026-02-12 | 13F | Jane Street Group, Llc | Call | 44.800 | 96,49 | 926 | 93,72 | |||
| 2026-02-12 | 13F | Jane Street Group, Llc | 517.699 | 10.701 | ||||||
| 2026-02-05 | 13F | Gabelli Funds Llc | 294.500 | 0,00 | 6.087 | -1,57 | ||||
| 2026-02-17 | 13F | Aspen Grove Capital, LLC | 0 | -100,00 | 0 | |||||
| 2026-01-21 | 13F | First United Bank Trust/ | 2.350 | 0,00 | 49 | -2,04 | ||||
| 2026-02-17 | 13F | Quantinno Capital Management LP | 65.170 | 18,58 | 1.347 | 16,72 | ||||
| 2026-02-05 | 13F | Bessemer Group Inc | 12.992 | 1,40 | 0 | |||||
| 2026-02-17 | 13F | Jump Financial, LLC | 11.731 | 242 | ||||||
| 2026-02-17 | 13F | Susquehanna International Group, Llp | Call | 0 | -100,00 | 0 | -100,00 | |||
| 2026-02-09 | 13F | Genus Capital Management Inc. | 15.079 | 7,10 | 312 | 5,42 | ||||
| 2025-09-26 | NP | UBPIX - Ultralatin America Profund Investor Class | 18.793 | 5,75 | 340 | 10,78 | ||||
| 2026-01-08 | 13F | True Wealth Design, LLC | 72 | 0,00 | 1 | 0,00 | ||||
| 2025-09-25 | NP | RGLGX - American Funds Global Insight Fund Class R-6 This fund is a listed as child fund of Capital World Investors and if that institution has disclosed ownership in this security, then these positions will not be double counted when calculating total shares and total value | 2.603.625 | -6,50 | 47.048 | -2,00 | ||||
| 2026-01-14 | 13F | Spire Wealth Management | 2.198 | -3,09 | 45 | -4,26 | ||||
| 2026-02-17 | 13F | Qube Research & Technologies Ltd | 752.056 | 15.545 | ||||||
| 2026-01-29 | 13F | Camelot Portfolios, LLC | 1.500 | 31 | ||||||
| 2026-02-17 | 13F | Balyasny Asset Management Llc | 55.990 | 1.157 | ||||||
| 2025-11-13 | 13F | IPG Investment Advisors LLC | 0 | -100,00 | 0 | |||||
| 2026-01-29 | 13F | Kercheville Advisors, LLC | 0 | -100,00 | 0 | |||||
| 2026-01-30 | 13F | ABS Direct Equity Fund LLC | 273.800 | 1.549,40 | 5.659 | 1.526,15 | ||||
| 2026-02-13 | 13F | Macquarie Group Ltd | 0 | -100,00 | 0 | |||||
| 2026-01-13 | 13F | CoreCap Advisors, LLC | 1.032 | 0,00 | 21 | 0,00 | ||||
| 2026-02-13 | 13F | Smartleaf Asset Management LLC | 132 | 10,00 | 3 | 0,00 | ||||
| 2026-02-17 | 13F | Price T Rowe Associates Inc /md/ | 9.700 | 0,00 | 0 | |||||
| 2026-02-11 | 13F | J.w. Cole Advisors, Inc. | 11.608 | 0,11 | 55 | -77,37 | ||||
| 2026-01-26 | 13F | PDS Planning, Inc | 15.600 | 322 | ||||||
| 2026-02-26 | 13F | TD Capital Management LLC | 200 | 0,00 | 4 | 0,00 | ||||
| 2026-02-12 | 13F | CIBC Private Wealth Group, LLC | 8.251 | -13,99 | 171 | -15,42 | ||||
| 2026-01-22 | 13F | Glass Jacobson Investment Advisors llc | 1.493 | 0,00 | 31 | -3,23 | ||||
| 2026-02-03 | 13F | Gateway Investment Advisers Llc | 12.112 | 0,00 | 250 | -1,57 | ||||
| 2026-02-17 | 13F | Discovery Capital Management, Llc / Ct | 4.291.383 | -8,33 | 88.703 | -9,77 | ||||
| 2026-02-05 | 13F | Atria Investments Llc | 0 | -100,00 | 0 | |||||
| 2025-10-31 | 13F | Whittier Trust Co Of Nevada Inc | 0 | -100,00 | 0 | |||||
| 2026-02-10 | 13F | 3Chopt Investment Partners, LLC | 0 | -100,00 | 0 | |||||
| 2026-02-10 | 13F | Essex Financial Services, Inc. | 53.340 | 0,10 | 1.103 | -1,43 | ||||
| 2026-02-17 | 13F | Glenmede Trust Co Na | 1.314.144 | 0,02 | 27.163 | 45,39 | ||||
| 2026-02-12 | 13F | Skopos Labs, Inc. | 48.159 | 152,88 | 1.004 | 201,50 | ||||
| 2025-11-19 | 13F | Captrust Financial Advisors | 0 | -100,00 | 0 |
Other Listings
| DE:MV90 | 20,20 € |