Grundlæggende statistik
| Institutionelle aktier (lange) | 419.270.594 - 44,96% (ex 13D/G) - change of 11,43MM shares 2,80% MRQ |
| Institutionel værdi (lang) | $ 9.880.405 USD ($1000) |
Institutionelt ejerskab og aktionærer
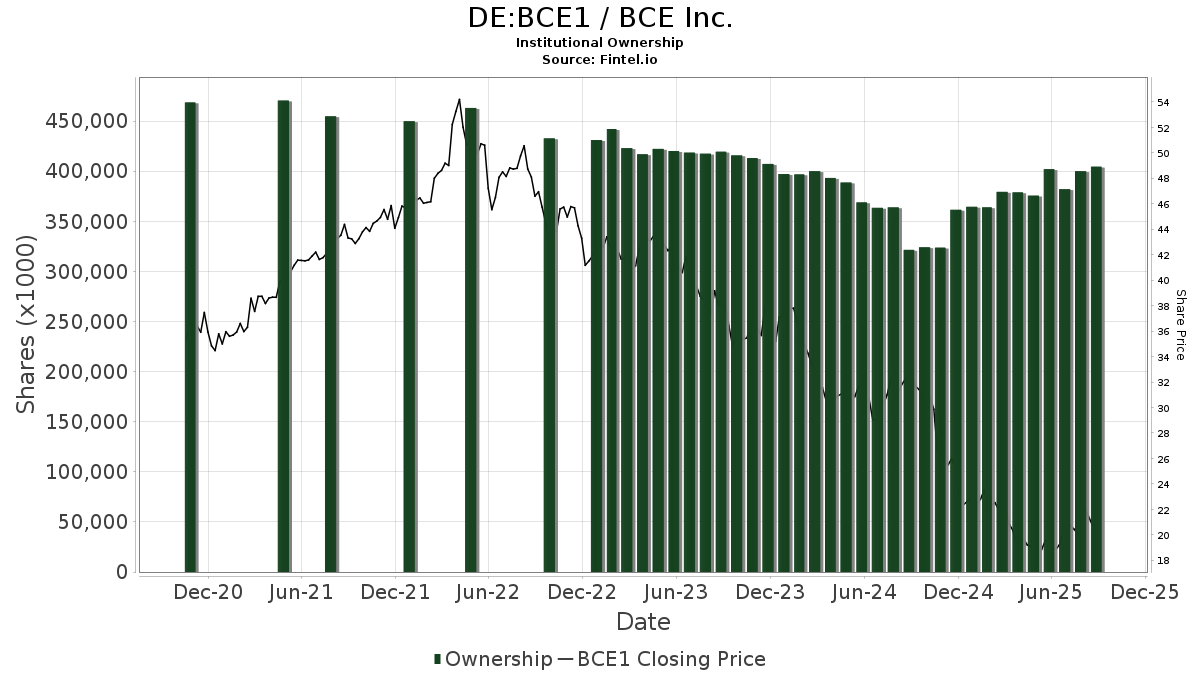
BCE Inc. (DE:BCE1) har 467 institutionelle ejere og aktionærer, der har indsendt 13D/G- eller 13F-formularer til Securities Exchange Commission (SEC). Disse institutioner har i alt 419,286,974 aktier. Største aktionærer omfatter Royal Bank Of Canada, FIL Ltd, Bank Of Montreal /can/, Caisse De Depot Et Placement Du Quebec, CIBC World Markets Inc., National Bank Of Canada /fi/, Vanguard Group Inc, Bank Of Nova Scotia, Arrowstreet Capital, Limited Partnership, and Royal Bank Of Canada .
BCE Inc. (DB:BCE1) institutionel ejerskabsstruktur viser aktuelle positioner i virksomheden efter institutioner og fonde, samt seneste ændringer i positionsstørrelse. Større aktionærer kan omfatte individuelle investorer, investeringsforeninger, hedgefonde eller institutioner. Skema 13D angiver, at investoren besidder (eller besidder) mere end 5 % af virksomheden og har til hensigt (eller har til hensigt at) aktivt at forfølge en ændring i forretningsstrategi. Skema 13G indikerer en passiv investering på over 5%.
The share price as of March 9, 2026 is 22,08 / share. Previously, on March 11, 2025, the share price was 22,83 / share. This represents a decline of 3,29% over that period.
Fondens stemningsscore
Fund Sentiment Score (fka Ownership Accumulation Score) finder de aktier, der bliver mest købt af fonde. Det er resultatet af en sofistikeret, multi-faktor kvantitativ model, der identificerer virksomheder med de højeste niveauer af institutionel akkumulering. Scoringsmodellen bruger en kombination af den samlede stigning i oplyste ejere, ændringerne i porteføljeallokeringer i disse ejere og andre målinger. Tallet går fra 0 til 100, hvor højere tal indikerer et højere niveau af akkumulering for sine jævnaldrende, og 50 er gennemsnittet.
Opdateringsfrekvens: Dagligt
Se Ownership Explorer, som giver en liste over højest rangerende virksomheder.
AI+ Ask Fintel’s AI assistant about BCE Inc..
Select a question to share a public post with an AI-crafted answer.
Thinking of good questions…
13F og NPORT arkivering
Detaljer om 13F-arkivering er gratis. Detaljer om NP-ansøgninger kræver et premium-medlemskab. Grønne rækker angiver nye positioner. Røde rækker angiver lukkede positioner. Klik på linket ikon for at se den fulde transaktionshistorik.
Opgrader
for at låse premium-data op og eksportere til Excel ![]() .
.
| Fil dato | Kilde | Investor | Type | Gennemsnitlig pris (Øst) |
Aktier | Δ Aktier (%) |
Rapporteret Værdi ($1000) |
Δ Værdi (%) |
Port Alloc (%) |
|
|---|---|---|---|---|---|---|---|---|---|---|
| 2026-02-11 | 13F | CLARET ASSET MANAGEMENT Corp | 229.992 | -6,43 | 5 | 0,00 | ||||
| 2026-02-12 | 13F | Lansforsakringar Fondforvaltning AB (publ) | 23.843 | 0,00 | 569 | 2,15 | ||||
| 2026-02-17 | 13F | Advisory Services Network, LLC | 0 | -100,00 | 0 | |||||
| 2026-02-10 | 13F | Quantbot Technologies LP | 170.944 | 305,05 | 4.072 | 312,46 | ||||
| 2026-02-17 | 13F | Northern Trust Corp | 681.352 | 23,58 | 16.230 | 25,85 | ||||
| 2026-02-02 | 13F | Pittenger & Anderson Inc | 58.825 | 1.401 | ||||||
| 2026-02-03 | 13F | Coston, McIsaac & Partners | 0 | -100,00 | 0 | |||||
| 2025-10-15 | 13F | DAVENPORT & Co LLC | 0 | -100,00 | 0 | |||||
| 2026-02-12 | 13F | Hrt Financial Lp | 31.139 | -88,45 | 1 | -100,00 | ||||
| 2025-09-25 | NP | DIHP - Dimensional International High Profitability ETF | 1.285 | 756,67 | 30 | 866,67 | ||||
| 2026-02-05 | 13F | Pinnacle Associates Ltd | 36.112 | -2,17 | 860 | -0,35 | ||||
| 2025-09-26 | NP | GYLD - Arrow Dow Jones Global Yield ETF | 9.330 | 32,79 | 218 | 39,10 | ||||
| 2026-02-11 | 13F | Zions Bancorporation, National Association /ut/ | 53 | -45,92 | 1 | -50,00 | ||||
| 2025-09-24 | NP | IDEV - iShares Core MSCI International Developed Markets ETF | 52.833 | -0,15 | 1.232 | 4,76 | ||||
| 2025-11-14 | 13F | PineBridge Investments, L.P. | 0 | -100,00 | 0 | -100,00 | ||||
| 2026-02-14 | 13F | Rockefeller Capital Management L.P. | 4.600 | 176,61 | 110 | 186,84 | ||||
| 2026-01-16 | 13F | Louisbourg Investments Inc. | 1.317 | -54,27 | 31 | -53,73 | ||||
| 2026-02-10 | 13F | Envestnet Asset Management Inc | 915.168 | -11,49 | 21.803 | -9,84 | ||||
| 2026-02-11 | 13F | Prudential Plc | 0 | -100,00 | 0 | |||||
| 2026-02-13 | 13F | Healthcare Of Ontario Pension Plan Trust Fund | 83.751 | -19,04 | 1.995 | -17,47 | ||||
| 2026-02-17 | 13F | Capital Fund Management S.a. | Put | 99.000 | -66,28 | 2.358 | -65,66 | |||
| 2026-02-13 | 13F | Pathstone Holdings, LLC | 11.288 | -28,53 | 269 | -27,37 | ||||
| 2026-02-17 | 13F | Capital Fund Management S.a. | Call | 286.600 | -52,31 | 6.827 | -51,44 | |||
| 2025-09-25 | NP | DFAI - Dimensional International Core Equity Market ETF | 2.658 | 0,00 | 62 | 6,90 | ||||
| 2026-02-13 | 13F | SRS Capital Advisors, Inc. | 3.333 | 61,17 | 79 | 64,58 | ||||
| 2026-02-18 | 13F | Garton & Associates Financial Advisors LLC | 552 | 13 | ||||||
| 2025-11-14 | 13F | Wolverine Trading, Llc | 14.112 | 328 | ||||||
| 2026-02-05 | 13F | Intrua Financial, LLC | 50.482 | 0,04 | 1.202 | 1,86 | ||||
| 2025-11-14 | 13F | Wolverine Trading, Llc | Call | 142.600 | -10,14 | 3.318 | -4,08 | |||
| 2026-01-29 | 13F | Sanctuary Advisors, LLC | 19.975 | -6,66 | 476 | -4,80 | ||||
| 2025-11-14 | 13F | Wolverine Trading, Llc | Put | 59.100 | -4,68 | 1.375 | 1,78 | |||
| 2026-01-29 | 13F | UBS Group AG | Call | 150.000 | -34,12 | 3.573 | -32,90 | |||
| 2026-02-13 | 13F | Stifel Financial Corp | 164.921 | -6,62 | 3.928 | -4,89 | ||||
| 2026-01-29 | 13F | UBS Group AG | 1.999.868 | -19,91 | 47.637 | -18,44 | ||||
| 2026-01-20 | 13F | Trust Co Of Toledo Na /oh/ | 68 | 0,00 | 2 | 0,00 | ||||
| 2026-02-03 | 13F | Costello Asset Management, INC | 100 | 0,00 | 2 | 0,00 | ||||
| 2026-02-10 | 13F | Godfrey Financial Associates, Inc. | 54 | 1 | ||||||
| 2025-09-29 | NP | KNCT - Invesco Dynamic Networking ETF This fund is a listed as child fund of Invesco Ltd. and if that institution has disclosed ownership in this security, then these positions will not be double counted when calculating total shares and total value | 2.346 | -7,53 | 55 | -3,57 | ||||
| 2026-01-21 | 13F | Flagship Harbor Advisors, Llc | 536 | 13 | ||||||
| 2026-02-12 | 13F | Principal Securities, Inc. | 0 | -100,00 | 0 | |||||
| 2026-02-17 | 13F | Guardian Partners Inc. | 0 | -100,00 | 0 | |||||
| 2026-02-17 | 13F | Ninepoint Partners LP | 345.023 | 356,03 | 8.218 | 364,56 | ||||
| 2026-02-11 | 13F | Fiera Capital Corp | 9.715 | -9,07 | 232 | -7,23 | ||||
| 2026-02-17 | 13F | Cetera Investment Advisers | 66.439 | -50,39 | 1.586 | -49,38 | ||||
| 2026-01-22 | 13F | Financial Consulate, Inc | 12 | 0 | ||||||
| 2026-02-17 | 13F | Janus Henderson Group Plc | 17.398 | 0,00 | 416 | 2,22 | ||||
| 2026-01-08 | 13F | Versant Capital Management, Inc | 10.749 | 39,45 | 257 | 42,22 | ||||
| 2026-01-23 | 13F | Smallwood Wealth Investment Management, LLC | 471 | 0,00 | 11 | 0,00 | ||||
| 2025-10-31 | 13F | Whittier Trust Co | 0 | -100,00 | 0 | -100,00 | ||||
| 2026-02-17 | 13F | Wiley Bros.-aintree Capital, Llc | 0 | -100,00 | 0 | |||||
| 2026-02-19 | 13F | Invesco Ltd. | 1.875.714 | 10,86 | 44.680 | 12,89 | ||||
| 2026-01-28 | 13F | City State Bank | 155 | 0,00 | 4 | 0,00 | ||||
| 2026-02-02 | 13F | Oppenheimer Asset Management Inc. | 518.213 | -16,97 | 12.344 | -15,44 | ||||
| 2026-02-06 | 13F | Creative Financial Designs Inc /adv | 46 | 0,00 | 1 | 0,00 | ||||
| 2026-02-09 | 13F | Employees Retirement System of Texas | 1.187 | 0 | ||||||
| 2026-01-26 | 13F | Duff & Phelps Investment Management Co | 1.127.288 | -7,32 | 26.852 | -5,62 | ||||
| 2025-11-14 | 13F | Schonfeld Strategic Advisors LLC | 0 | -100,00 | 0 | |||||
| 2026-02-13 | 13F | Headlands Technologies LLC | 9.621 | 229 | ||||||
| 2026-02-17 | 13F | Two Sigma Investments, Lp | 5.948.303 | 90,94 | 141.689 | 94,45 | ||||
| 2026-01-29 | 13F | Kestra Private Wealth Services, Llc | 0 | -100,00 | 0 | |||||
| 2026-02-17 | 13F | Bank Of America Corp /de/ | Call | 0 | -100,00 | 0 | -100,00 | |||
| 2025-11-14 | 13F | Gluskin Sheff & Assoc Inc | 0 | -100,00 | 0 | -100,00 | ||||
| 2026-01-16 | 13F | FNY Investment Advisers, LLC | Call | 0 | -100,00 | 0 | ||||
| 2026-02-03 | 13F | SBI Securities Co., Ltd. | 17.074 | -10,06 | 407 | -8,56 | ||||
| 2026-03-09 | 13F | Flax Pond Capital, Llc | 201.169 | 4.792 | ||||||
| 2026-03-06 | 13F | Hsbc Holdings Plc | Call | 0 | -100,00 | 0 | ||||
| 2026-01-27 | 13F | Elevated Capital Advisors, LLC | 300 | 7 | ||||||
| 2026-02-17 | 13F | State Of Wisconsin Investment Board | 26.239 | 627 | ||||||
| 2026-02-17 | 13F | United Capital Financial Advisers, Llc | 16.150 | 26,45 | 385 | 28,86 | ||||
| 2025-10-30 | 13F | Twin Peaks Wealth Advisors, LLC | 0 | -100,00 | 0 | |||||
| 2025-11-04 | 13F | IMC-Chicago, LLC | 0 | -100,00 | 0 | -100,00 | ||||
| 2026-02-12 | 13F | Northwest & Ethical Investments L.P. | 472.006 | 16,69 | 11.240 | 18,93 | ||||
| 2026-02-17 | 13F | Private Advisor Group, LLC | 23.758 | 2,24 | 566 | 4,05 | ||||
| 2026-01-21 | 13F | Raleigh Capital Management Inc. | 7 | 0,00 | 0 | |||||
| 2026-01-23 | 13F | Transcend Wealth Collective, Llc | 11.583 | 0,00 | 276 | 1,85 | ||||
| 2025-09-25 | NP | DFIEX - International Core Equity Portfolio - Institutional Class This fund is a listed as child fund of Dimensional Fund Advisors Lp and if that institution has disclosed ownership in this security, then these positions will not be double counted when calculating total shares and total value | 6.541 | 0,00 | 153 | 4,83 | ||||
| 2026-01-07 | 13F | Aventura Private Wealth, LLC | 590 | 0,00 | 14 | 7,69 | ||||
| 2026-01-29 | 13F | Nbc Securities, Inc. | 4.821 | -20,58 | 115 | -19,15 | ||||
| 2026-01-29 | 13F | Quent Capital, LLC | 82 | 0,00 | 2 | 0,00 | ||||
| 2026-03-04 | 13F | SHP Wealth Management | 13 | 0 | ||||||
| 2026-02-06 | 13F | Motco | 106 | 0,00 | 3 | 0,00 | ||||
| 2026-02-11 | 13F | XML Financial, LLC | 0 | -100,00 | 0 | |||||
| 2025-09-26 | NP | FTIHX - Fidelity Total International Index Fund This fund is a listed as child fund of Fmr Llc and if that institution has disclosed ownership in this security, then these positions will not be double counted when calculating total shares and total value | 33.163 | 7,05 | 774 | 12,35 | ||||
| 2026-01-06 | 13F | Investors Research Corp | 553 | 0,00 | 13 | 8,33 | ||||
| 2026-02-13 | 13F | Prudential Financial Inc | 61.414 | 234,23 | 1.467 | 241,72 | ||||
| 2026-01-28 | 13F | Geneos Wealth Management Inc. | 646 | 0,00 | 15 | 0,00 | ||||
| 2026-03-06 | 13F | Hsbc Holdings Plc | 0 | -100,00 | 0 | |||||
| 2026-02-17 | 13F | Alliancebernstein L.p. | 9.562 | -0,04 | 228 | 1,79 | ||||
| 2026-01-23 | 13F | Halbert Hargrove Global Advisors, Llc | 0 | -100,00 | 0 | |||||
| 2026-01-23 | 13F | Steigerwald, Gordon & Koch Inc. | 172 | 4 | ||||||
| 2026-01-14 | 13F | Mitchell & Pahl Private Wealth, Llc | 30.350 | 3,22 | 723 | 5,09 | ||||
| 2026-02-17 | 13F | Clear Street Markets Llc | 7.316 | 248,38 | 174 | 255,10 | ||||
| 2026-02-04 | 13F | KLCM Advisors, Inc. | 8.486 | 202 | ||||||
| 2026-02-13 | 13F | Canerector Inc | 0 | -100,00 | 0 | |||||
| 2025-09-29 | NP | PXF - Invesco FTSE RAFI Developed Markets ex-U.S. ETF This fund is a listed as child fund of Invesco Ltd. and if that institution has disclosed ownership in this security, then these positions will not be double counted when calculating total shares and total value | 64.199 | 21,10 | 1.501 | 27,66 | ||||
| 2026-02-12 | 13F | Logan Capital Management Inc | 0 | -100,00 | 0 | |||||
| 2026-02-13 | 13F | Sei Investments Co | 217.586 | 39,01 | 5.186 | 39,87 | ||||
| 2025-09-25 | NP | IPAYX - Integrity Dividend Summit Fund Class I | 6.000 | 0,00 | 140 | 4,51 | ||||
| 2026-02-13 | 13F | Bridgewater Associates, LP | 27.818 | 49,37 | 664 | 52,64 | ||||
| 2025-09-26 | NP | TDVI - FT Vest Technology Dividend Target Income ETF | 95.104 | 33,58 | 2.219 | 40,03 | ||||
| 2025-11-14 | 13F | Jain Global LLC | 0 | -100,00 | 0 | -100,00 | ||||
| 2026-01-30 | 13F | Caldwell Securities, Inc | 8.729 | -7,15 | 208 | -5,48 | ||||
| 2026-02-04 | 13F | Swiss Life Asset Management Ltd | 0 | -100,00 | 0 | |||||
| 2025-09-25 | NP | BBCA - JPMorgan BetaBuilders Canada ETF | 1.069.291 | -3,56 | 24.942 | -31,54 | ||||
| 2026-01-21 | 13F | Sound Income Strategies, LLC | 183 | 0,00 | 4 | 0,00 | ||||
| 2026-01-08 | 13F | Wealth Enhancement Advisory Services, Llc | 44.311 | -1,05 | 1.032 | -1,15 | ||||
| 2026-02-17 | 13F | PDT Partners, LLC | 0 | -100,00 | 0 | |||||
| 2026-01-26 | 13F | Provenance Wealth Advisors, LLC | 10.210 | 0,00 | 243 | 2,10 | ||||
| 2026-01-14 | 13F | Jfs Wealth Advisors, Llc | 17 | 0 | ||||||
| 2026-02-17 | 13F | Murchinson Ltd. | Call | 37.500 | 50,00 | 893 | 52,91 | |||
| 2026-02-09 | 13F | Nicola Wealth Management Ltd. | 729.000 | 15,28 | 17.392 | 17,68 | ||||
| 2026-02-11 | 13F | Manchester Capital Management LLC | 660 | 16 | ||||||
| 2026-02-11 | 13F | Vise Technologies, Inc. | 13.680 | 34,05 | 326 | 36,55 | ||||
| 2026-01-21 | 13F | Cidel Asset Management Inc | 16.171 | -53,56 | 386 | -52,52 | ||||
| 2026-02-17 | 13F | Murchinson Ltd. | Put | 37.500 | 50,00 | 893 | 52,91 | |||
| 2026-02-05 | 13F | AlphaCore Capital LLC | 8.855 | 211 | ||||||
| 2026-01-16 | 13F | FNY Investment Advisers, LLC | 4.600 | -88,38 | 0 | |||||
| 2026-02-11 | 13F | Flagship Wealth Advisors, Llc | 2.532 | 0,00 | 60 | 1,69 | ||||
| 2026-02-17 | 13F | Gotham Asset Management, LLC | 0 | -100,00 | 0 | |||||
| 2026-02-17 | 13F | SIG North Trading, ULC | 115.745 | -90,88 | 2.757 | -90,71 | ||||
| 2025-11-14 | 13F | Hilltop Holdings Inc. | 0 | -100,00 | 0 | -100,00 | ||||
| 2025-10-30 | 13F | CBOE Vest Financial, LLC | 0 | -100,00 | 0 | -100,00 | ||||
| 2025-09-26 | NP | FZILX - Fidelity ZERO International Index Fund This fund is a listed as child fund of Fmr Llc and if that institution has disclosed ownership in this security, then these positions will not be double counted when calculating total shares and total value | 59.311 | 11,98 | 1.383 | 17,50 | ||||
| 2026-02-10 | 13F | Savant Capital, LLC | 16.075 | 2,04 | 383 | 3,80 | ||||
| 2026-02-13 | 13F | Verition Fund Management LLC | 0 | -100,00 | 0 | |||||
| 2026-02-11 | 13F | Allianz Asset Management GmbH | 20.468 | 3,92 | 489 | 6,09 | ||||
| 2026-02-17 | 13F | XTX Topco Ltd | 58.739 | 1.399 | ||||||
| 2026-02-03 | 13F | Legacy Wealth Managment, LLC/ID | 0 | -100,00 | 0 | |||||
| 2026-02-05 | 13F | Bessemer Group Inc | 1.819.058 | 2.674.985,29 | 43 | |||||
| 2026-01-08 | 13F | Old Port Advisors | 70.030 | -0,75 | 1.668 | 1,09 | ||||
| 2026-01-20 | 13F | Cromwell Holdings LLC | 239 | 6 | ||||||
| 2026-02-11 | 13F | Prestige Wealth Management Group LLC | 139 | 3 | ||||||
| 2026-02-17 | 13F | Investment Management Corp of Ontario | 114.339 | 230,62 | 2.724 | 237,00 | ||||
| 2026-02-06 | 13F | IFP Advisors, Inc | 1.262 | 8,51 | 30 | 11,11 | ||||
| 2026-02-17 | 13F | Consultiva Wealth Management, Corp. | 0 | -100,00 | 0 | |||||
| 2026-02-06 | 13F | Harvest Portfolios Group Inc. | 1.107.223 | 44,39 | 26.411 | 47,40 | ||||
| 2026-02-17 | 13F | SIG North Trading, ULC | Put | 5.091.600 | -24,32 | 121.282 | -22,93 | |||
| 2026-02-17 | 13F | SIG North Trading, ULC | Call | 5.898.100 | 41,99 | 140.493 | 44,60 | |||
| 2026-02-17 | 13F | Quantinno Capital Management LP | 183.507 | 61,21 | 4.377 | 64,39 | ||||
| 2026-02-03 | 13F | Asset Planning,Inc | 3.542 | -8,59 | 84 | 2,44 | ||||
| 2026-01-22 | 13F | City Holding Co | 57 | 0,00 | 1 | 0,00 | ||||
| 2026-02-13 | 13F | Parkside Financial Bank & Trust | 6.579 | -5,51 | 157 | -3,70 | ||||
| 2026-02-12 | 13F | Dimensional Fund Advisors Lp | 402.471 | 15,10 | 9.586 | 17,20 | ||||
| 2026-02-17 | 13F | Susquehanna Portfolio Strategies, LLC | 498.867 | -13,42 | 11.883 | -11,82 | ||||
| 2025-10-29 | 13F | Maryland State Retirement & Pension System | 0 | -100,00 | 0 | |||||
| 2026-02-12 | 13F | Swiss National Bank | 197.809 | -7,79 | 4.728 | -5,70 | ||||
| 2026-02-17 | 13F | Citadel Advisors Llc | Put | 140.000 | -16,27 | 3.335 | -14,73 | |||
| 2026-02-17 | 13F | Citadel Advisors Llc | Call | 805.700 | 39,49 | 19.192 | 42,05 | |||
| 2026-02-17 | 13F | Citadel Advisors Llc | 283.817 | -84,88 | 6.761 | -84,60 | ||||
| 2025-11-21 | 13F | Nebula Research & Development LLC | 0 | -100,00 | 0 | |||||
| 2026-02-17 | 13F | Lombard Odier Asset Management (Switzerland) SA | 0 | -100,00 | 0 | |||||
| 2026-02-13 | 13F | Timelo Investment Management Inc. | 80.000 | -15,79 | 1.906 | -14,27 | ||||
| 2026-01-27 | 13F | Lorne Steinberg Wealth Management Inc. | 186.577 | -0,78 | 4.457 | 2,04 | ||||
| 2026-02-17 | 13F | Qube Research & Technologies Ltd | 61.021 | -50,48 | 1.456 | -49,44 | ||||
| 2026-02-11 | 13F | Simplex Trading, Llc | 0 | -100,00 | 0 | |||||
| 2026-02-11 | 13F | Metis Global Partners, LLC | 11.038 | -4,48 | 263 | -2,59 | ||||
| 2025-09-24 | NP | IXUS - iShares Core MSCI Total International Stock ETF | 80.242 | -19,02 | 1.872 | -15,03 | ||||
| 2026-01-08 | 13F | True Wealth Design, LLC | 97 | 15,48 | 2 | 100,00 | ||||
| 2025-10-08 | 13F | Retirement Wealth Solutions LLC | 0 | -100,00 | 0 | -100,00 | ||||
| 2026-02-10 | 13F | Natixis Advisors, L.p. | 28.137 | 52,47 | 1 | |||||
| 2026-02-12 | 13F | APG Asset Management N.V. | 412.878 | -11,08 | 8.397 | -9,09 | ||||
| 2026-02-12 | 13F | Jane Street Group, Llc | 847.688 | 36,85 | 20.192 | 39,55 | ||||
| 2026-02-12 | 13F | Jane Street Group, Llc | Put | 33.800 | -64,97 | 805 | -64,29 | |||
| 2026-02-12 | 13F | Federation des caisses Desjardins du Quebec | 8.744.821 | 6,21 | 208.459 | 8,29 | ||||
| 2026-02-02 | 13F | Principal Financial Group Inc | 23.000 | -6,88 | 549 | -4,85 | ||||
| 2026-02-12 | 13F | Jane Street Group, Llc | Call | 574.600 | 7,14 | 13.687 | 9,25 | |||
| 2026-02-13 | 13F | Dynamic Technology Lab Private Ltd | 28.692 | 3,34 | 683 | 5,24 | ||||
| 2026-02-17 | 13F | Laird Norton Trust Company, Llc | 15.983 | 386 | ||||||
| 2026-01-05 | 13F | GAMMA Investing LLC | 819 | 52,51 | 20 | 58,33 | ||||
| 2026-02-17 | 13F | Warren Averett Asset Management, LLC | 44.232 | 1.054 | ||||||
| 2026-01-07 | 13F | Hilltop National Bank | 935 | -25,20 | 22 | -24,14 | ||||
| 2026-01-09 | 13F | Pacifica Partners Inc. | 19.488 | -7,05 | 461 | -6,11 | ||||
| 2026-02-12 | 13F | SWAN Capital LLC | 178 | 0,00 | 4 | 0,00 | ||||
| 2026-02-13 | 13F | Centiva Capital, LP | 26.138 | 623 | ||||||
| 2026-02-17 | 13F | SageView Advisory Group, LLC | 27 | 1 | ||||||
| 2026-02-05 | 13F | Allworth Financial LP | 4.082 | 43,88 | 97 | 46,97 | ||||
| 2026-01-21 | 13F | Westfuller Advisors, LLC | 46 | 0,00 | 1 | 0,00 | ||||
| 2026-02-24 | 13F | Bell Investment Advisors, Inc | 107 | 148,84 | 3 | 100,00 | ||||
| 2025-09-25 | NP | FEDM - FlexShares ESG & Climate Developed Markets ex-US Core Index Fund | 3.402 | -3,52 | 79 | 1,28 | ||||
| 2026-02-06 | 13F | Pnc Financial Services Group, Inc. | 33.378 | 2,91 | 795 | 4,88 | ||||
| 2026-02-17 | 13F | Capstone Investment Advisors, Llc | 31.502 | -52,81 | 750 | -51,95 | ||||
| 2026-02-17 | 13F | Utah Retirement Systems | 34.015 | 0,00 | 812 | 2,14 | ||||
| 2026-01-21 | 13F | Indiana Trust & Investment Management CO | 21 | 0 | ||||||
| 2026-02-02 | 13F | Cornerstone Planning Group LLC | 14 | -53,33 | 0 | |||||
| 2026-02-13 | 13F | Colony Group, LLC | 13.985 | 333 | ||||||
| 2026-02-13 | 13F | Manufacturers Life Insurance Company, The | 0 | -100,00 | 0 | |||||
| 2025-11-14 | 13F | Axa S.a. | 0 | -100,00 | 0 | -100,00 | ||||
| 2026-02-17 | 13F | Capital Fund Management S.a. | 240.434 | 16,24 | 5.727 | 18,38 | ||||
| 2026-01-22 | 13F | Harwood Advisory Group, LLC | 74 | 0,00 | 2 | 0,00 | ||||
| 2025-11-14 | 13F | Skopos Labs, Inc. | 0 | -100,00 | 0 | |||||
| 2026-02-13 | 13F | Wells Fargo & Company/mn | 315.617 | -12,26 | 7.533 | -10,37 | ||||
| 2025-10-07 | 13F | Sonora Investment Management Group, LLC | 9.168 | 214 | ||||||
| 2026-02-17 | 13F | Point72 Asset Management, L.P. | Call | 0 | -100,00 | 0 | ||||
| 2026-02-17 | 13F | Ewing Morris & Co. Investment Partners Ltd. | 0 | -100,00 | 0 | |||||
| 2026-01-27 | 13F | TD Waterhouse Canada Inc. | 1.325.288 | -19,33 | 31.575 | -18,29 | ||||
| 2026-02-03 | 13F | Sequoia Financial Advisors, LLC | 27.210 | 34,42 | 648 | 37,00 | ||||
| 2025-10-06 | 13F | Grove Bank & Trust | 0 | -100,00 | 0 | |||||
| 2026-02-09 | 13F | First National Trust Co | 10.376 | 0,00 | 247 | 2,07 | ||||
| 2026-01-15 | 13F | Mn Services Vermogensbeheer B.V. | 27.598 | 6,15 | 1 | |||||
| 2026-02-12 | 13F | Scotia Capital Inc. | 3.863.473 | -8,87 | 92.041 | -7,11 | ||||
| 2026-01-05 | 13F | Roxbury Financial LLC | 100 | -66,22 | 2 | -66,67 | ||||
| 2026-02-13 | 13F | Natixis | 431.290 | 70,44 | 10.273 | 73,59 | ||||
| 2026-02-03 | 13F | K.J. Harrison & Partners Inc | 255.788 | -0,69 | 6.110 | 2,16 | ||||
| 2026-02-17 | 13F | Tudor Investment Corp Et Al | Call | 10.500 | -53,54 | 250 | -52,65 | |||
| 2026-02-17 | 13F | Aqr Capital Management Llc | 196.315 | 565,66 | 4.655 | 575,62 | ||||
| 2026-01-09 | 13F | Park Place Capital Corp | 280 | 0,00 | 7 | 0,00 | ||||
| 2026-02-11 | 13F | Havemeyer Place LP | 33.623 | 801 | ||||||
| 2026-01-29 | 13F | St Germain D J Co Inc | 549 | 0,00 | 13 | 8,33 | ||||
| 2026-01-26 | 13F | Cwm, Llc | 6.690 | -0,24 | 0 | |||||
| 2026-02-11 | 13F | Twin Tree Management, LP | Call | 168.500 | 4.014 | |||||
| 2026-02-11 | 13F | Twin Tree Management, LP | Put | 124.700 | 2.970 | |||||
| 2026-02-12 | 13F | Steward Partners Investment Advisory, Llc | 5.821 | 73,04 | 139 | 76,92 | ||||
| 2026-02-11 | 13F | Twin Tree Management, LP | 239.637 | 13,12 | 5.708 | 15,22 | ||||
| 2025-09-24 | NP | IVLU - iShares Edge MSCI Intl Value Factor ETF | 14.638 | 341 | ||||||
| 2026-01-30 | 13F | Us Bancorp \de\ | 11.007 | 72,82 | 262 | 77,03 | ||||
| 2026-02-10 | 13F | Hillsdale Investment Management Inc. | 1.659.910 | -1,95 | 39.665 | 0,29 | ||||
| 2026-01-14 | 13F | ORG Partners LLC | 1.298 | 0,00 | 31 | 0,00 | ||||
| 2025-11-04 | 13F | Umb Bank N A/mo | 0 | -100,00 | 0 | -100,00 | ||||
| 2026-02-12 | 13F | Campbell & CO Investment Adviser LLC | 23.605 | -15,31 | 562 | -13,67 | ||||
| 2026-02-13 | 13F | DKRT Investments Corp. | 6.400 | 0,00 | 152 | 2,01 | ||||
| 2026-02-17 | 13F | Brevan Howard Capital Management LP | 0 | -100,00 | 0 | |||||
| 2026-01-28 | 13F | WPG Advisers, LLC | 855 | 427,78 | 20 | 566,67 | ||||
| 2026-02-10 | 13F | Nomura Asset Management Co Ltd | 0 | 0 | ||||||
| 2026-02-11 | 13F | Jpmorgan Chase & Co | 1.949.877 | -1,56 | 46.446 | 0,25 | ||||
| 2026-01-28 | 13F | DekaBank Deutsche Girozentrale | 73.808 | 0,00 | 3 | 100,00 | ||||
| 2025-09-24 | NP | ACWX - iShares MSCI ACWI ex U.S. ETF | 12.098 | 0,00 | 282 | 5,22 | ||||
| 2026-02-06 | 13F | Bare Financial Services, Inc | 254 | -3,05 | 6 | 0,00 | ||||
| 2026-02-17 | 13F | FIL Ltd | 37.579.448 | 5,60 | 896.398 | 7,80 | ||||
| 2026-02-02 | 13F | Total Clarity Wealth Management, Inc. | 40.007 | 31,49 | 953 | 33,90 | ||||
| 2026-02-11 | 13F | LPL Financial LLC | 154.084 | -11,96 | 3.670 | -10,33 | ||||
| 2025-09-25 | NP | DFIC - Dimensional International Core Equity 2 ETF | 21 | -99,96 | 0 | -100,00 | ||||
| 2026-02-13 | 13F | Aigen Investment Management, Lp | 0 | -100,00 | 0 | |||||
| 2025-11-07 | 13F | Beacon Capital Management, LLC | 0 | -100,00 | 0 | -100,00 | ||||
| 2025-11-07 | 13F | Sierra Ocean, Llc | 0 | -100,00 | 0 | -100,00 | ||||
| 2026-01-21 | 13F | Capital Investment Advisory Services, LLC | 12.900 | -4,64 | 307 | -2,85 | ||||
| 2026-02-06 | 13F | EverSource Wealth Advisors, LLC | 3.945 | -17,85 | 94 | -16,96 | ||||
| 2025-09-25 | NP | IQDF - FlexShares International Quality Dividend Index Fund | 92.018 | 38,29 | 2.147 | 45,00 | ||||
| 2026-02-13 | 13F | Cornerstone Financial Management LLC | 120 | 3 | ||||||
| 2026-02-05 | 13F | Cambridge Investment Research Advisors, Inc. | 23.257 | -8,08 | 1 | |||||
| 2025-09-24 | NP | SFNNX - Schwab Fundamental International Large Company Index Fund Institutional Shares | 145.066 | 12,61 | 3.384 | 18,16 | ||||
| 2026-01-15 | 13F | Frank, Rimerman Advisors LLC | 32.347 | -1,42 | 771 | 0,39 | ||||
| 2026-01-20 | 13F | SOA Wealth Advisors, LLC. | 48 | 0,00 | 1 | 0,00 | ||||
| 2026-02-11 | 13F | Cerity Partners LLC | 22.506 | -20,05 | 536 | -18,54 | ||||
| 2026-02-11 | 13F | Letko, Brosseau & Associates Inc | 7.338.441 | 4,15 | 175.277 | 6,44 | ||||
| 2026-02-13 | 13F | Beutel, Goodman & Co Ltd. | 7.808 | -20,22 | 0 | |||||
| 2026-02-13 | 13F | State Street Corp | 203.732 | -4,23 | 4.908 | -2,46 | ||||
| 2026-02-17 | 13F | Wellington Management Group Llp | 0 | -100,00 | 0 | |||||
| 2025-09-26 | NP | BKIE - BNY Mellon International Equity ETF | 38.793 | 41,12 | 907 | 48,77 | ||||
| 2025-09-25 | NP | SPQAX - Pgim Jennison Global Equity Income Fund Class A | 310.182 | 0,00 | 7.235 | 4,96 | ||||
| 2025-09-25 | NP | DFAX - Dimensional World ex U.S. Core Equity 2 ETF | 9.642 | 0,00 | 225 | 5,63 | ||||
| 2026-01-16 | 13F | Crewe Advisors LLC | 269 | 0,00 | 6 | 0,00 | ||||
| 2026-02-11 | 13F | Fox Run Management, L.l.c. | 0 | -100,00 | 0 | |||||
| 2025-09-25 | NP | DFA INVESTMENT DIMENSIONS GROUP INC - International Social Core Equity Portfolio Institutional Class This fund is a listed as child fund of Dimensional Fund Advisors Lp and if that institution has disclosed ownership in this security, then these positions will not be double counted when calculating total shares and total value | 548 | -87,36 | 13 | -88,12 | ||||
| 2026-02-17 | 13F | Quadrature Capital Ltd | 4.228.659 | 100.999 | ||||||
| 2026-02-17 | 13F | Cape Investment Advisory, Inc. | 50 | 1 | ||||||
| 2026-02-13 | 13F | First Trust Advisors Lp | 2.253.993 | -0,82 | 53.713 | 1,08 | ||||
| 2026-02-13 | 13F | Squarepoint Ops LLC | 61.810 | -49,46 | 1.472 | -48,53 | ||||
| 2026-02-17 | 13F | Ancora Advisors, LLC | 184 | 26,90 | 4 | 33,33 | ||||
| 2026-02-04 | 13F | Ameritas Advisory Services, LLC | 0 | -100,00 | 0 | |||||
| 2025-11-14 | 13F | Quantessence Capital LLC | 0 | -100,00 | 0 | -100,00 | ||||
| 2025-09-29 | NP | VWID - Virtus WMC Global Factor Opportunities ETF | 4.807 | -0,83 | 112 | 4,67 | ||||
| 2026-01-20 | 13F | Pflug Koory, LLC | 410 | 0,00 | 10 | 0,00 | ||||
| 2026-02-17 | 13F | Susquehanna Fundamental Investments, Llc | 150.458 | -71,20 | 3.584 | -70,68 | ||||
| 2026-02-18 | 13F | Guardian Capital Lp | 9.039 | 0,00 | 216 | 1,90 | ||||
| 2025-09-26 | NP | FSGEX - Fidelity Series Global ex U.S. Index Fund This fund is a listed as child fund of Fmr Llc and if that institution has disclosed ownership in this security, then these positions will not be double counted when calculating total shares and total value | 134.485 | -4,04 | 3.137 | 0,71 | ||||
| 2025-09-26 | NP | FSGJX - Fidelity SAI Global ex U.S. Low Volatility Index Fund | 445.413 | 4,08 | 10.390 | 9,23 | ||||
| 2026-02-03 | 13F | McIlrath & Eck, LLC | 0 | -100,00 | 0 | |||||
| 2026-02-17 | 13F | Sender Co & Partners, Inc. | 0 | -100,00 | 0 | |||||
| 2026-01-20 | 13F | Independence Bank of Kentucky | 1.855 | -11,03 | 44 | -8,33 | ||||
| 2026-02-17 | 13F | Nomura Holdings Inc | Call | 0 | -100,00 | 0 | ||||
| 2026-02-17 | 13F | Nomura Holdings Inc | 0 | -100,00 | 0 | |||||
| 2026-02-10 | 13F | Gulf International Bank (UK) Ltd | 35 | 0,00 | 0 | |||||
| 2026-02-17 | 13F | PenderFund Capital Management Ltd. | 352 | 0,00 | 8 | 0,00 | ||||
| 2026-02-13 | 13F | American Century Companies Inc | 243.879 | 168,18 | 5.817 | 173,87 | ||||
| 2026-02-17 | 13F | Two Sigma Advisers, Lp | 2.440.700 | 56,11 | 58.137 | 58,99 | ||||
| 2026-02-13 | 13F | Cullen Capital Management, LLC | 5.693.693 | -10,89 | 135.624 | -9,26 | ||||
| 2026-02-04 | 13F | Tsfg, Llc | 10 | 0,00 | 0 | |||||
| 2025-11-14 | 13F | AXA Investment Managers S.A. | 47.584 | 1.113 | ||||||
| 2026-02-05 | 13F | Cardinal Point Capital Management, ULC | 59.687 | -1,13 | 1.426 | 1,06 | ||||
| 2026-01-23 | 13F | Brown, Lisle/cummings, Inc. | 342 | -67,05 | 8 | -66,67 | ||||
| 2026-02-13 | 13F | BRITISH COLUMBIA INVESTMENT MANAGEMENT Corp | 488.772 | -8,93 | 11.659 | -7,00 | ||||
| 2026-02-17 | 13F | Nomura Holdings Inc | Put | 0 | -100,00 | 0 | ||||
| 2026-02-19 | 13F | CI Private Wealth, LLC | 17.601 | 3,52 | 363 | -8,56 | ||||
| 2026-02-10 | 13F | Forsta Ap-fonden | 1.300 | 0,00 | 31 | 3,33 | ||||
| 2025-09-26 | NP | FSGGX - Fidelity Global ex U.S. Index Fund This fund is a listed as child fund of Fmr Llc and if that institution has disclosed ownership in this security, then these positions will not be double counted when calculating total shares and total value | 31.635 | 5,39 | 738 | 10,49 | ||||
| 2026-02-11 | 13F | Janney Montgomery Scott LLC | 405.221 | -7,51 | 10 | -10,00 | ||||
| 2026-02-17 | 13F | Millennium Management Llc | Put | 892.500 | -28,80 | 29.220 | -24,94 | |||
| 2026-01-08 | 13F | Tompkins Financial Corp | 341 | 0,00 | 8 | 14,29 | ||||
| 2026-02-12 | 13F | Triumph Capital Management | 2.780 | -84,13 | 66 | -83,86 | ||||
| 2026-02-13 | 13F | Bridgefront Capital, LLC | 0 | -100,00 | 0 | |||||
| 2026-02-17 | 13F | Millennium Management Llc | 249.561 | -53,33 | 5.946 | -52,46 | ||||
| 2025-09-25 | NP | PCLRX - PGIM INCOME BUILDER FUND Class R | 11.893 | -5,60 | 277 | -1,07 | ||||
| 2026-02-17 | 13F | Millennium Management Llc | Call | 960.000 | -34,61 | 31.430 | -27,08 | |||
| 2026-02-13 | 13F | Marshall Wace, Llp | 332.278 | 7.915 | ||||||
| 2026-03-05 | 13F | Bayban | 475 | 11 | ||||||
| 2026-02-17 | 13F | Jones Financial Companies Lllp | 335.261 | 4,72 | 7.986 | 7,96 | ||||
| 2026-02-23 | 13F | Mv Capital Management, Inc. | 2 | 0 | ||||||
| 2025-09-25 | NP | DFALX - Large Cap International Portfolio - Institutional Class This fund is a listed as child fund of Dimensional Fund Advisors Lp and if that institution has disclosed ownership in this security, then these positions will not be double counted when calculating total shares and total value | 17.800 | 0,00 | 415 | 4,80 | ||||
| 2026-02-10 | 13F | Goldman Sachs Group Inc | Put | 5.887.000 | 22,98 | 140.228 | 25,24 | |||
| 2026-02-03 | 13F | We Are One Seven, LLC | 10.095 | -19,31 | 240 | -17,81 | ||||
| 2026-02-13 | 13F | Baird Financial Group, Inc. | 13.569 | 7,64 | 323 | 9,86 | ||||
| 2026-02-17 | 13F | Point72 Asset Management, L.P. | 337.700 | 8.058 | ||||||
| 2026-02-17 | 13F | Credit Agricole S A | 34.556 | 51,65 | 823 | 54,70 | ||||
| 2026-01-30 | 13F | Jennison Associates Llc | 11.748 | -1,22 | 280 | 0,36 | ||||
| 2026-02-10 | 13F | Goldman Sachs Group Inc | 7.803.912 | 15,57 | 185.889 | 17,70 | ||||
| 2026-02-05 | 13F | AustralianSuper Pty Ltd | 219.665 | -30,75 | 5.240 | -29,30 | ||||
| 2025-11-03 | 13F | Private Wealth Asset Management, LLC | 0 | -100,00 | 0 | -100,00 | ||||
| 2026-02-11 | 13F | Vermillion Wealth Management, Inc. | 300 | 0,00 | 7 | 0,00 | ||||
| 2026-01-23 | 13F | Westside Investment Management, Inc. | 297 | 0,00 | 7 | 16,67 | ||||
| 2026-02-17 | 13F | Royal Bank Of Canada | Put | 11.070.600 | -28,71 | 263.702 | -27,40 | |||
| 2026-02-06 | 13F | Addison Advisors LLC | 135 | -36,62 | 3 | -25,00 | ||||
| 2026-02-13 | 13F | 1832 Asset Management L.P. | 1.386.551 | 268,13 | 33.028 | 274,92 | ||||
| 2026-01-26 | 13F | Merit Financial Group, LLC | 23.536 | 11,02 | 561 | 13,13 | ||||
| 2026-02-02 | 13F | Blake Schutter Theil Wealth Advisors, LLC | 11.845 | 0,00 | 282 | 1,81 | ||||
| 2026-01-21 | 13F | Stone House Investment Management, LLC | 0 | -100,00 | 0 | |||||
| 2026-02-17 | 13F | Amundi | 789.342 | -17,86 | 18.802 | -15,63 | ||||
| 2026-01-30 | 13F/A | M&t Bank Corp | 14.220 | 0,37 | 339 | 2,11 | ||||
| 2025-09-26 | NP | FITFX - Fidelity Flex International Index Fund This fund is a listed as child fund of Fmr Llc and if that institution has disclosed ownership in this security, then these positions will not be double counted when calculating total shares and total value | 30.573 | 312,76 | 713 | 334,76 | ||||
| 2026-01-12 | 13F | Viking Fund Management Llc | 0 | -100,00 | 0 | |||||
| 2026-02-09 | 13F | Huntington National Bank | 231 | -77,59 | 6 | -79,17 | ||||
| 2026-02-11 | 13F | Tacita Capital Inc | 24.290 | -0,10 | 580 | 1,94 | ||||
| 2026-01-27 | 13F | WealthCollab, LLC | 475 | -6,86 | 11 | 0,00 | ||||
| 2026-01-28 | 13F | Kingswood Wealth Advisors, Llc | 13.500 | -13,16 | 322 | -11,57 | ||||
| 2026-01-28 | 13F | Gold Investment Management Ltd. | 148.876 | 2,82 | 3.551 | 4,97 | ||||
| 2026-02-23 | 13F | Monetary Solutions, Ltd | 200 | 5 | ||||||
| 2026-02-12 | 13F | Hollencrest Capital Management | 58 | 0,00 | 1 | 0,00 | ||||
| 2026-01-16 | 13F | Trust Co Of Vermont | 0 | -100,00 | 0 | |||||
| 2026-02-13 | 13F | Toroso Investments, LLC | 0 | -100,00 | 0 | |||||
| 2026-02-17 | 13F | BCV Asset Management Inc. | 76.881 | 2.692 | ||||||
| 2026-02-13 | 13F | MAI Capital Management | 2.687 | -7,15 | 64 | -4,48 | ||||
| 2026-02-18 | 13F | State of Tennessee, Treasury Department | 500.476 | -1,54 | 13.009 | 9,50 | ||||
| 2025-09-24 | NP | ACWI - iShares MSCI ACWI ETF | 23.695 | 0,00 | 553 | 4,94 | ||||
| 2026-01-21 | 13F | Country Trust Bank | 240 | 0,00 | 6 | 0,00 | ||||
| 2026-02-17 | 13F | Man Group plc | 49.533 | -87,69 | 1.182 | -87,44 | ||||
| 2026-02-10 | 13F | CIBC Asset Management Inc | 1.957.700 | -25,25 | 46.731 | -23,56 | ||||
| 2026-01-21 | 13F/A | Euro Pacific Asset Management, LLC | 125.946 | -6,27 | 3 | -33,33 | ||||
| 2025-11-12 | 13F | Catalyst Funds Management Pty Ltd | 0 | -100,00 | 0 | |||||
| 2026-01-22 | 13F | Venturi Wealth Management, LLC | 8.535 | 203 | ||||||
| 2026-02-10 | 13F | Bruce G. Allen Investments, LLC | 155 | -17,11 | 4 | -25,00 | ||||
| 2026-02-17 | 13F | Royal Bank Of Canada | Call | 9.458.900 | 2,37 | 225.311 | 4,25 | |||
| 2025-09-26 | NP | FSCJX - Fidelity SAI Canada Equity Index Fund | 243.883 | 36,85 | 5.689 | 43,64 | ||||
| 2026-02-17 | 13F | Royal Bank Of Canada | 56.433.740 | -3,22 | 1.344.251 | -1,44 | ||||
| 2026-01-07 | 13F | Harbor Investment Advisory, Llc | 5 | 0 | ||||||
| 2026-02-17 | 13F | Raymond James Financial Inc | 389.623 | -6,86 | 9.281 | -5,14 | ||||
| 2026-02-13 | 13F | Citigroup Inc | 474.256 | -27,85 | 11.327 | -26,27 | ||||
| 2026-02-17 | 13F | Canada Pension Plan Investment Board | 7.304.557 | 37,03 | 174.242 | 39,92 | ||||
| 2026-02-12 | 13F | Brinker Capital Investments, LLC | 34.764 | 5,28 | 828 | 7,25 | ||||
| 2025-11-05 | 13F | SOUTH STATE Corp | 0 | -100,00 | 0 | -100,00 | ||||
| 2026-02-11 | 13F | Clearbridge Investments, LLC | 3.141.172 | -2,95 | 74.823 | -1,16 | ||||
| 2026-02-09 | 13F | Harbour Investments, Inc. | 4.794 | 118,21 | 114 | 123,53 | ||||
| 2025-11-14 | 13F | Mount Yale Investment Advisors, LLC | 0 | -100,00 | 0 | -100,00 | ||||
| 2026-02-11 | 13F | Westerkirk Capital Inc. | 2.664 | -93,20 | 64 | -93,12 | ||||
| 2026-01-30 | 13F | Lincluden Management Ltd | 1.885.402 | -3,19 | 62 | 35,56 | ||||
| 2026-02-06 | 13F | Kingdom Financial Group LLC. | 154 | 4 | ||||||
| 2026-02-13 | 13F | Public Sector Pension Investment Board | 0 | -100,00 | 0 | |||||
| 2026-02-24 | 13F | DGS Capital Management, LLC | 26.091 | 621 | ||||||
| 2026-01-05 | 13F | Miller Global Investments, LLC | 165 | 4 | ||||||
| 2026-02-02 | 13F | Intact Investment Management Inc. | 3.848.390 | 23,32 | 91.794 | 25,87 | ||||
| 2026-02-13 | 13F | Rhumbline Advisers | 2.922 | -15,60 | 70 | -13,75 | ||||
| 2026-01-29 | 13F | Quadcap Wealth Management, LLC | 14.093 | -8,14 | 336 | -6,42 | ||||
| 2026-02-06 | 13F | Global Retirement Partners, LLC | 15.110 | 658,15 | 360 | 680,43 | ||||
| 2026-02-12 | 13F | Skandinaviska Enskilda Banken AB (publ) | 0 | -100,00 | 0 | |||||
| 2026-02-13 | 13F | Korea Investment CORP | 295.573 | 6,14 | 7.060 | 8,47 | ||||
| 2025-09-25 | NP | VEU - Vanguard FTSE All-World ex-US Index Fund ETF Shares | 659.256 | 4,56 | 15.378 | 9,73 | ||||
| 2026-02-13 | 13F | Ossiam | 36.900 | -52,57 | 881 | -51,54 | ||||
| 2026-02-13 | 13F | Great West Life Assurance Co /can/ | 262.660 | -43,44 | 6 | -40,00 | ||||
| 2026-02-13 | 13F | Ingalls & Snyder Llc | 37.330 | 17,06 | 1 | |||||
| 2025-11-07 | 13F | Shell Asset Management Co | 2.376 | 0,00 | 0 | |||||
| 2026-02-13 | 13F | National Bank Of Canada /fi/ | 21.548.119 | 5,01 | 513.512 | 7,13 | ||||
| 2026-01-09 | 13F | SG Americas Securities, LLC | 15.190 | 0 | ||||||
| 2025-11-14 | 13F | Strategic Wealth Partners, Ltd. | 162 | 0,00 | 4 | 0,00 | ||||
| 2025-12-09 | 13F/A | Tudor Investment Corp Et Al | Put | 13.900 | -11,46 | 325 | -6,61 | |||
| 2025-09-25 | NP | DFSI - Dimensional International Sustainability Core 1 ETF | 340 | 0,00 | 8 | 0,00 | ||||
| 2026-01-22 | 13F | Massachusetts Financial Services Co /ma/ | 1.806.619 | 3,77 | 43.034 | 5,68 | ||||
| 2026-02-09 | 13F | Kingsview Wealth Management, LLC | 26.426 | 143,09 | 629 | 147,64 | ||||
| 2026-02-13 | 13F | Kestra Advisory Services, LLC | 0 | -100,00 | 0 | |||||
| 2026-01-30 | 13F | Caldwell Trust Co | 0 | -100,00 | 0 | |||||
| 2026-02-11 | 13F | MCF Advisors LLC | 192 | 0,00 | 5 | 0,00 | ||||
| 2026-01-30 | 13F | Exencial Wealth Advisors, Llc | 15.990 | 1,06 | 381 | 2,70 | ||||
| 2026-02-12 | 13F | Bank Of Nova Scotia Trust Co | 189.079 | -37,60 | 4.504 | -36,46 | ||||
| 2026-02-13 | 13F | Quarry LP | 157 | 3,97 | 4 | 0,00 | ||||
| 2026-02-12 | 13F | Wealthspire Advisors, LLC | 0 | -100,00 | 0 | |||||
| 2026-01-23 | 13F | Assetmark, Inc | 1 | 0,00 | 0 | |||||
| 2025-10-21 | 13F | Jarislowsky, Fraser Ltd | 199.725 | 12,74 | 4.668 | 19,08 | ||||
| 2025-09-26 | NP | PID - Invesco International Dividend Achievers ETF This fund is a listed as child fund of Invesco Ltd. and if that institution has disclosed ownership in this security, then these positions will not be double counted when calculating total shares and total value | 1.529.052 | 10,04 | 35.673 | 15,38 | ||||
| 2026-02-13 | 13F | DeepCurrents Investment Group LLC | 27.579 | 657 | ||||||
| 2026-02-13 | 13F | Walleye Capital LLC | Call | 85.900 | 21.375,00 | 2.046 | 22.633,33 | |||
| 2026-02-13 | 13F | DeepCurrents Investment Group LLC | Call | 2.500 | 0,00 | 5.955 | 2,32 | |||
| 2026-02-13 | 13F | Walleye Capital LLC | Put | 66.000 | -49,58 | 1.572 | -48,64 | |||
| 2026-02-13 | 13F | DeepCurrents Investment Group LLC | Put | 2.500 | 0,00 | 5.955 | 2,32 | |||
| 2026-01-23 | 13F | Farther Finance Advisors, LLC | 6.566 | -5,63 | 156 | -3,70 | ||||
| 2026-02-06 | 13F | Envestnet Portfolio Solutions, Inc. | 12.662 | -10,14 | 302 | -8,21 | ||||
| 2025-09-23 | NP | Dnp Select Income Fund Inc | 1.216.375 | 0,00 | 28.378 | 4,86 | ||||
| 2026-02-05 | 13F | John G Ullman & Associates Inc | 233.327 | 86,45 | 5.558 | 89,85 | ||||
| 2026-02-13 | 13F | Dixon Mitchell Investment Counsel Inc. | 4.164 | 101 | ||||||
| 2026-02-17 | 13F | Public Employees Retirement System Of Ohio | 622.569 | -7,71 | 14.860 | -5,77 | ||||
| 2025-09-24 | NP | INTF - iShares Edge MSCI Multifactor Intl ETF | 36.519 | -1,56 | 852 | 3,28 | ||||
| 2025-11-14 | 13F | Sagard Holdings Management Inc. | 4.866 | 0,00 | 114 | 5,61 | ||||
| 2025-09-25 | NP | TLTD - FlexShares Morningstar Developed Markets ex-US Factor Tilt Index Fund | 8.064 | 43,39 | 189 | 1,62 | ||||
| 2026-02-13 | 13F | Victory Capital Management Inc | 71.600 | 2.344 | ||||||
| 2026-02-17 | 13F | Caisse De Depot Et Placement Du Quebec | 34.107.306 | 0,00 | 814.644 | 2,19 | ||||
| 2025-09-25 | NP | JFLI - JPMorgan Flexible Income ETF | 1.022 | 27,27 | 24 | 35,29 | ||||
| 2025-09-25 | NP | NFRA - FlexShares STOXX Global Broad Infrastructure Index Fund | 861.413 | 19,89 | 20.137 | 26,35 | ||||
| 2026-01-27 | 13F | Godsey & Gibb Associates | 95 | 0,00 | 2 | 0,00 | ||||
| 2026-02-17 | 13F | Susquehanna International Group, Llp | Put | 195.900 | -47,30 | 4.666 | -46,33 | |||
| 2026-02-17 | 13F | Susquehanna International Group, Llp | Call | 699.500 | -28,03 | 16.662 | -26,71 | |||
| 2026-02-17 | 13F | Ameriprise Financial Inc | 87.916 | -70,41 | 2.128 | -76,51 | ||||
| 2026-01-30 | 13F | Turning Point Benefit Group, Inc. | 40 | 0,00 | 1 | |||||
| 2026-02-10 | 13F/A | Northwestern Mutual Wealth Management Co | 10.360 | -3,56 | 247 | -1,99 | ||||
| 2025-09-25 | NP | DFA INVESTMENT DIMENSIONS GROUP INC - International Sustainability Core 1 Portfolio Shares | 21.361 | 40,89 | 498 | 47,77 | ||||
| 2026-02-17 | 13F | Susquehanna International Group, Llp | 11.134 | -85,15 | 265 | -84,88 | ||||
| 2026-02-12 | 13F | Renaissance Technologies Llc | 12.500 | 298 | ||||||
| 2026-02-17 | 13F | Fmr Llc | 272.470 | 3.238,27 | 6.499 | 3.320,53 | ||||
| 2026-02-17 | 13F | Parvin Asset Management, LLC | 7.200 | -5,57 | 172 | -3,93 | ||||
| 2026-01-29 | 13F | Vanguard Group Inc | 18.020.124 | 4,05 | 429.834 | 6,21 | ||||
| 2026-02-02 | 13F | Montag A & Associates Inc | 159 | 0,00 | 4 | 0,00 | ||||
| 2026-02-17 | 13F | Mercer Global Advisors Inc /adv | 8.525 | -35,62 | 203 | -34,30 | ||||
| 2026-01-20 | 13F | Signaturefd, Llc | 17.979 | -6,69 | 428 | -4,89 | ||||
| 2026-02-05 | 13F | Td Private Client Wealth Llc | 6.870 | -1,35 | 164 | 1,23 | ||||
| 2026-02-18 | 13F | Achmea Investment Management B.V. | 28.270 | 0,00 | 1 | |||||
| 2025-11-13 | 13F | Entropy Technologies, LP | 0 | -100,00 | 0 | -100,00 | ||||
| 2025-09-26 | NP | MSTVX - Morningstar Alternatives Fund | -342 | 288,64 | ||||||
| 2026-02-14 | 13F | Whipplewood Advisors, LLC | 17 | 0 | ||||||
| 2025-09-25 | NP | VT - Vanguard Total World Stock Index Fund ETF Shares | 211.153 | 7,93 | 4.925 | 13,27 | ||||
| 2026-02-18 | 13F | Mackenzie Financial Corp | 2.254.977 | 11,63 | 53.072 | 12,46 | ||||
| 2026-02-13 | 13F | JustInvest LLC | 17.869 | 60,95 | 426 | 64,09 | ||||
| 2026-01-26 | 13F | Private Trust Co Na | 0 | -100,00 | 0 | |||||
| 2026-02-17 | 13F | Voloridge Investment Management, Llc | 749.098 | 17.844 | ||||||
| 2025-09-26 | NP | EPDPX - EuroPac International Dividend Income Fund Class A | 70.000 | 600,00 | 1.633 | 635,14 | ||||
| 2026-02-17 | 13F | Russell Investments Group, Ltd. | 213.310 | 42,48 | 5.077 | 45,31 | ||||
| 2026-02-13 | 13F | Caitong International Asset Management Co., Ltd | 0 | -100,00 | 0 | |||||
| 2026-02-13 | 13F | Bollard Group LLC | 7.953 | -57,14 | 0 | |||||
| 2026-02-13 | 13F | Resources Management Corp /ct/ /adv | 0 | -100,00 | 0 | |||||
| 2026-02-06 | 13F | Entrust Financial Llc | 431 | 10 | ||||||
| 2026-02-17 | 13F | Bank Of America Corp /de/ | 4.555.165 | -25,70 | 108.504 | -24,34 | ||||
| 2026-01-16 | 13F | Ronald Blue Trust, Inc. | 120 | -76,38 | 3 | -81,82 | ||||
| 2026-02-10 | 13F | Td Asset Management Inc | 6.376.749 | -7,23 | 152.307 | -5,20 | ||||
| 2026-02-02 | 13F | Millstone Evans Group, LLC | 155 | 0,00 | 4 | 0,00 | ||||
| 2026-02-10 | 13F | Connor, Clark & Lunn Investment Management Ltd. | 184.427 | -53,62 | 4.399 | -52,66 | ||||
| 2026-02-13 | 13F | Peak6 Llc | 0 | -100,00 | 0 | |||||
| 2026-02-12 | 13F | Nuveen, LLC | 61.013 | 0,00 | 1.457 | 2,17 | ||||
| 2026-02-13 | 13F | Walleye Capital LLC | 0 | -100,00 | 0 | -100,00 | ||||
| 2026-02-05 | 13F | Gabelli Funds Llc | 817.500 | -0,18 | 19.473 | 1,65 | ||||
| 2026-02-13 | 13F | Integrated Wealth Concepts LLC | 0 | -100,00 | 0 | |||||
| 2026-02-06 | 13F | Larson Financial Group LLC | 1.387 | -7,72 | 33 | -5,71 | ||||
| 2026-02-17 | 13F | Tower Research Capital LLC (TRC) | 13.653 | -67,82 | 325 | -67,24 | ||||
| 2026-02-17 | 13F | Trexquant Investment LP | 128.253 | 3.055 | ||||||
| 2026-02-10 | 13F | ESL Trust Services, LLC | 0 | -100,00 | 0 | |||||
| 2026-02-12 | 13F | Foster Dykema Cabot & Partners, Llc | 0 | -100,00 | 0 | |||||
| 2026-01-22 | 13F | Addenda Capital Inc. | 463.466 | -6,39 | 15.379 | -5,75 | ||||
| 2026-02-12 | 13F | Colonial Trust Co / SC | 2.500 | 60 | ||||||
| 2026-02-17 | 13F | Balyasny Asset Management Llc | 792.499 | 899,12 | 18.877 | 917,63 | ||||
| 2026-02-06 | 13F | Cullen/frost Bankers, Inc. | 76 | 2 | ||||||
| 2026-02-10 | 13F | Bank of New York Mellon Corp | 121.921 | 1,74 | 2.904 | 3,60 | ||||
| 2025-11-14 | 13F | ExodusPoint Capital Management, LP | 173.853 | -3,44 | 4.066 | 135.433,33 | ||||
| 2026-02-13 | 13F | Aviso Financial Inc. | 0 | -100,00 | 0 | |||||
| 2026-02-13 | 13F | Smartleaf Asset Management LLC | 1.411 | 1.641,98 | 33 | 3.200,00 | ||||
| 2026-02-17 | 13F | Zimmer Partners, LP | 106 | 3 | ||||||
| 2026-02-12 | 13F | CIBC Private Wealth Group, LLC | 1.019 | -7,70 | 24 | -4,00 | ||||
| 2026-01-26 | 13F | Asset Dedication, LLC | 245 | 0,00 | 6 | 0,00 | ||||
| 2026-02-11 | 13F | Winton Capital Group Ltd | 0 | -100,00 | 0 | |||||
| 2026-01-20 | 13F | AdvisorNet Financial, Inc | 304 | -19,79 | 7 | -12,50 | ||||
| 2026-02-10 | 13F | Meramec Financial Planners, LLC | 5.122 | 128 | ||||||
| 2026-02-11 | 13F | Picton Mahoney Asset Management | 1.963.939 | 234,29 | 46.913 | 360.761,54 | ||||
| 2026-02-03 | 13F/A | Broadwater Capital Management Llc | 0 | 0 | ||||||
| 2026-01-30 | 13F | Mitsubishi UFJ Trust & Banking Corp | 20.600 | 486 | ||||||
| 2026-02-12 | 13F | Litman Gregory Asset Management LLC | 24 | 1 | ||||||
| 2026-02-17 | 13F | Abel Hall, LLC | 10.500 | 0,00 | 250 | 2,04 | ||||
| 2026-01-28 | 13F | Financial Perspectives, Inc | 0 | -100,00 | 0 | |||||
| 2026-02-10 | 13F | State of Wyoming | 17.550 | 117,10 | 418 | 121,16 | ||||
| 2026-02-12 | 13F | Advisors Asset Management, Inc. | 22.343 | -15,46 | 532 | -13,92 | ||||
| 2026-02-17 | 13F | Captrust Financial Advisors | 10.266 | -7,56 | 245 | -5,79 | ||||
| 2026-02-10 | 13F | Acadian Asset Management Llc | 0 | -100,00 | 0 | |||||
| 2026-02-04 | 13F | Atlantic Union Bankshares Corp | 3.600 | 0,00 | 86 | 1,19 | ||||
| 2026-01-15 | 13F | Bernard Wealth Management Corp. | 589 | 0,00 | 14 | 7,69 | ||||
| 2026-02-09 | 13F | Arrow Investment Advisors, LLC | 9.332 | -3,84 | 222 | -2,20 | ||||
| 2026-02-17 | 13F | Fairscale Capital, LLC | 2.059 | -10,67 | 50 | -9,26 | ||||
| 2026-02-10 | 13F | Root Financial Partners, LLC | 386 | 115,64 | 9 | 125,00 | ||||
| 2026-02-02 | 13F | Truist Financial Corp | 58.452 | -3,84 | 1.392 | -2,04 | ||||
| 2026-02-13 | 13F | Ubs Asset Management Americas Inc | 379 | 9 | ||||||
| 2025-09-26 | NP | PASIX - PACE Alternative Strategies Investments Class A | Short | -16.380 | -382 | |||||
| 2026-02-19 | 13F | Birchwood Financial Partners, Inc. | 198 | 5 | ||||||
| 2026-01-12 | 13F | Avanza Fonder AB | 47.683 | 79,29 | 1.561 | 80,67 | ||||
| 2026-02-10 | 13F | Intech Investment Management Llc | 0 | -100,00 | 0 | |||||
| 2026-02-12 | 13F | Aviva Plc | 63.595 | 5,77 | 1.518 | 8,20 | ||||
| 2026-01-27 | 13F | Zurcher Kantonalbank (Zurich Cantonalbank) | 91.653 | 2.189 | ||||||
| 2026-02-11 | 13F | Cedar Mountain Advisors, LLC | 206 | 0,00 | 5 | 0,00 | ||||
| 2026-02-17 | 13F | D. E. Shaw & Co., Inc. | 603.989 | 36,14 | 14.403 | 38,88 | ||||
| 2026-02-17 | 13F | D. E. Shaw & Co., Inc. | Call | 2.531.400 | 22,95 | 60.389 | 25,56 | |||
| 2026-02-05 | 13F | Berkeley Capital Partners, LLC | 29.722 | -51,36 | 708 | -50,52 | ||||
| 2026-02-17 | 13F | D. E. Shaw & Co., Inc. | Put | 2.119.000 | 73,83 | 50.551 | 77,52 | |||
| 2025-09-25 | NP | JNBAX - JPMorgan Income Builder Fund Class A | 136.026 | 27,11 | 3.173 | 33,39 | ||||
| 2026-02-17 | 13F | Caption Management, LLC | 0 | -100,00 | 0 | |||||
| 2026-01-13 | 13F | CoreCap Advisors, LLC | 852 | 0,00 | 20 | 5,26 | ||||
| 2026-02-13 | 13F | USS Investment Management Ltd | 156.806 | 9,93 | 3.738 | 12,12 | ||||
| 2026-01-07 | 13F | Massmutual Trust Co Fsb/adv | 1.594 | -17,15 | 38 | -17,78 | ||||
| 2026-01-26 | 13F | Old Point Trust & Financial Services N A | 500 | 0,00 | 12 | 0,00 | ||||
| 2026-01-15 | 13F | Lodestone Wealth Management LLC | 51 | 1 | ||||||
| 2026-02-12 | 13F | Commonwealth Equity Services, Llc | 76.480 | -7,04 | 1.822 | 182.000,00 | ||||
| 2026-02-03 | 13F | CGC Financial Services, LLC | 599 | 0,00 | 14 | 0,00 | ||||
| 2026-03-02 | 13F | Tobam | 78.077 | 7,27 | 3 | 0,00 | ||||
| 2026-02-13 | 13F | Arrowstreet Capital, Limited Partnership | 14.151.211 | -12,71 | 337.453 | -10,96 | ||||
| 2026-02-13 | 13F/A | Alberta Investment Management Corp | 0 | -100,00 | 0 | |||||
| 2026-02-17 | 13F | DZ BANK AG Deutsche Zentral Genossenschafts Bank, Frankfurt am Main | 4.109.074 | 1.231,37 | 97.878 | 1.256,97 | ||||
| 2026-01-27 | 13F | Probity Advisors, Inc. | 21.082 | 0,54 | 502 | 2,45 | ||||
| 2026-01-22 | 13F | Fiduciary Alliance LLC | 0 | -100,00 | 0 | |||||
| 2025-11-04 | 13F | Money Concepts Capital Corp | 0 | -100,00 | 0 | -100,00 | ||||
| 2026-02-13 | 13F | Centaurus Financial, Inc. | 6.446 | 4,17 | 0 | |||||
| 2026-01-29 | 13F | D.a. Davidson & Co. | 21.850 | 0,00 | 520 | 1,76 | ||||
| 2025-11-14 | 13F | Raymond James Financial Inc | Call | 0 | -100,00 | 0 | -100,00 | |||
| 2026-02-11 | 13F | Deutsche Bank Ag\ | 284.161 | 2,87 | 6.769 | 4,77 | ||||
| 2026-01-29 | 13F | Quest 10 Wealth Builders, Inc. | 177 | -0,56 | 4 | 0,00 | ||||
| 2026-01-22 | 13F | Maseco Llp | 252 | 6 | ||||||
| 2026-02-09 | 13F | Morningstar Investment Management LLC | 134.571 | -37,60 | 3 | -40,00 | ||||
| 2026-02-05 | 13F | Abacus Wealth Partners, LLC | 8.565 | 204 | ||||||
| 2026-02-11 | 13F | Franklin Resources Inc | 1.119.197 | 267,40 | 26.697 | 275,17 | ||||
| 2026-02-17 | 13F | Sciencast Management LP | 39.840 | -33,60 | 949 | -32,43 | ||||
| 2026-02-17 | 13F | Advisor Group Holdings, Inc. | 30.715 | -9,14 | 732 | -8,73 | ||||
| 2026-01-29 | 13F | Pictet Asset Management Holding SA | 26.439 | -4,11 | 631 | -2,02 | ||||
| 2026-02-09 | 13F | Legal & General Group Plc | 2.533.452 | 14,03 | 60.511 | 16,53 | ||||
| 2026-02-13 | 13F | Golden State Wealth Management, LLC | 0 | -100,00 | 0 | |||||
| 2026-02-17 | 13F | Polar Asset Management Partners Inc. | 235.000 | 17,50 | 5.607 | 19,99 | ||||
| 2026-02-13 | 13F | Walleye Trading LLC | Put | 42.100 | -48,60 | 1.003 | -47,68 | |||
| 2026-02-13 | 13F | Walleye Trading LLC | Call | 305.900 | 26,77 | 7.287 | 29,09 | |||
| 2026-02-13 | 13F/A | Ontario Teachers Pension Plan Board | 0 | -100,00 | 0 | |||||
| 2026-02-02 | 13F | Oppenheimer & Co Inc | 30.297 | -55,70 | 722 | -54,91 | ||||
| 2026-02-13 | 13F | Walleye Trading LLC | 3.357 | -96,79 | 80 | -96,77 | ||||
| 2026-02-17 | 13F | Optiver Holding B.V. | 5 | -96,77 | 0 | -100,00 | ||||
| 2026-02-03 | 13F | Crossmark Global Holdings, Inc. | 41.441 | -36,43 | 987 | -35,24 | ||||
| 2026-01-29 | 13F | Dunhill Financial, LLC | 0 | -100,00 | 0 | -100,00 | ||||
| 2026-01-29 | 13F | UMA Financial Services, Inc. | 43 | 1 | ||||||
| 2026-02-11 | 13F | J.w. Cole Advisors, Inc. | 13.733 | -3,16 | 321 | -3,02 | ||||
| 2026-02-12 | 13F | BlackRock, Inc. | 901.959 | 17,78 | 21.485 | 19,94 | ||||
| 2025-11-24 | 13F | Greenfield Seitz Capital Management, LLC | 0 | -100,00 | 0 | -100,00 | ||||
| 2026-02-02 | 13F | Fifth Third Bancorp | 2.066 | -8,06 | 49 | -5,77 | ||||
| 2026-02-05 | 13F | Tucker Asset Management Llc | 293 | 7 | ||||||
| 2026-02-10 | 13F | Essex Financial Services, Inc. | 9.346 | -8,55 | 223 | -6,30 | ||||
| 2026-02-13 | 13F | Barclays Plc | 477.586 | 57,36 | 11.376 | 60,27 | ||||
| 2025-09-25 | NP | DFA INVESTMENT DIMENSIONS GROUP INC - World ex U.S. Core Equity Portfolio Institutional Class Shares | 156 | 0,00 | 4 | 0,00 | ||||
| 2026-01-30 | 13F | Bogart Wealth, LLC | 886 | -9,13 | 21 | -4,55 | ||||
| 2026-02-12 | 13F | Quadrant Capital Group Llc | 4.409 | -13,72 | 105 | -11,76 | ||||
| 2026-02-17 | 13F | Anson Funds Management LP | Call | 500.000 | 11.928 | |||||
| 2026-02-09 | 13F | Geode Capital Management, Llc | 1.955.684 | 9,63 | 52.750 | 12,50 | ||||
| 2025-09-25 | NP | DXIV - Dimensional International Vector Equity ETF | 200 | 0,00 | 5 | 0,00 | ||||
| 2026-02-23 | 13F | Virtu Financial LLC | 20.412 | 0 | ||||||
| 2026-02-13 | 13F | Neuberger Berman Group LLC | 600.864 | 2,16 | 14.343 | 4,31 | ||||
| 2025-09-24 | NP | TOK - iShares MSCI Kokusai ETF | 211 | 0,00 | 5 | 0,00 | ||||
| 2026-02-13 | 13F | Morgan Stanley | 5.610.568 | 30,81 | 133.644 | 33,21 | ||||
| 2026-02-17 | 13F | EFG International AG | 131 | 3 | ||||||
| 2026-02-18 | 13F | GWM Advisors LLC | 753 | -64,88 | 18 | -66,00 | ||||
| 2026-02-12 | 13F | Penserra Capital Management LLC | 57 | -24,00 | 0 | |||||
| 2026-02-13 | 13F | Pinnacle Wealth Planning Services, Inc. | 4.076 | 97 | ||||||
| 2026-02-13 | 13F | Mufg Securities (canada), Ltd. | 1.419.886 | -7,98 | 33.877 | -6,04 | ||||
| 2026-01-22 | 13F | Vision Financial Markets Llc | 2.100 | 0,00 | 50 | 2,04 | ||||
| 2026-02-10 | 13F | Bnp Paribas Arbitrage, Sa | 30.020 | 65,47 | 715 | 68,63 | ||||
| 2025-11-13 | 13F | Magnetar Financial LLC | 0 | -100,00 | 0 | -100,00 | ||||
| 2026-01-27 | 13F | Bayforest Capital Ltd | 0 | -100,00 | 0 | |||||
| 2025-11-13 | 13F | Jump Financial, LLC | 0 | -100,00 | 0 | |||||
| 2026-01-12 | 13F | CVA Family Office, LLC | 95 | 0,00 | 2 | 0,00 | ||||
| 2026-02-10 | 13F | CIBC World Markets Inc. | Put | 3.657.000 | 0,00 | 87.256 | 2,13 | |||
| 2026-02-12 | 13F | BRYN MAWR TRUST Co | 498 | 66,00 | 12 | 57,14 | ||||
| 2026-01-26 | 13F | Riverview Trust Co | 648 | 0,00 | 15 | 0,00 | ||||
| 2026-02-10 | 13F | CIBC World Markets Inc. | Call | 441.500 | -25,36 | 10.534 | -23,77 | |||
| 2026-02-10 | 13F | CIBC World Markets Inc. | 23.812.924 | 13,58 | 568.176 | 16,00 | ||||
| 2026-02-11 | 13F | Parallel Advisors, LLC | 4.450 | -11,86 | 106 | -10,17 | ||||
| 2025-09-26 | NP | ETISX - E*TRADE No Fee International Index Fund | 979 | 103,96 | 23 | 120,00 | ||||
| 2026-02-13 | 13F | BNP Paribas Asset Management Holding S.A. | 50.641 | 2 | ||||||
| 2025-09-25 | NP | VGTSX - Vanguard Total International Stock Index Fund Investor Shares | 4.407.580 | 1,99 | 102.810 | 7,04 | ||||
| 2026-02-17 | 13F | Guggenheim Capital Llc | 38.558 | -2,03 | 918 | -0,22 | ||||
| 2026-02-03 | 13F | ASR Vermogensbeheer N.V. | 7.207 | 0,00 | 172 | 2,38 | ||||
| 2026-02-12 | 13F | Bank Of Montreal /can/ | Call | 40.000 | 954 | |||||
| 2026-02-12 | 13F | Bank Of Montreal /can/ | Put | 1.925.000 | 0,00 | 45.919 | 2,11 | |||
| 2026-02-12 | 13F | Bank Of Montreal /can/ | 36.251.026 | -0,12 | 864.728 | 1,98 | ||||
| 2026-02-04 | 13F | Community Bank, N.A. | 129 | -62,06 | 3 | -57,14 | ||||
| 2026-02-06 | 13F | Griffin Asset Management, Inc. | 16.286 | -19,83 | 388 | -18,53 | ||||
| 2026-02-13 | 13F | Charles Schwab Investment Management Inc | 2.196.611 | 11,64 | 52.465 | 14,09 | ||||
| 2026-02-06 | 13F/A | Rathbone Brothers plc | 41.668 | -3,81 | 995 | -1,68 | ||||
| 2025-09-24 | NP | CRBN - iShares MSCI ACWI Low Carbon Target ETF | 17.280 | -2,04 | 403 | 2,81 | ||||
| 2025-11-14 | 13F | Binnacle Investments Inc | 4.164 | 17,13 | 97 | 24,36 | ||||
| 2026-02-12 | 13F | Brown Brothers Harriman & Co | 420 | 10 | ||||||
| 2026-02-13 | 13F | Mariner, LLC | 78.874 | -22,03 | 1.879 | -20,63 | ||||
| 2026-02-02 | 13F | CENTRAL TRUST Co | 681 | 0,00 | 16 | 6,67 | ||||
| 2026-02-17 | 13F | Creative Planning | 271.542 | 133,80 | 6.468 | 138,14 | ||||
| 2025-09-25 | NP | DIHRX - International High Relative Profitability Portfolio Institutional Class This fund is a listed as child fund of Dimensional Fund Advisors Lp and if that institution has disclosed ownership in this security, then these positions will not be double counted when calculating total shares and total value | 16.155 | 0,00 | 377 | 4,74 | ||||
| 2026-02-17 | 13F | Toronto Dominion Bank | Call | 1.625.000 | 60,38 | 38.763 | 63,76 | |||
| 2026-01-14 | 13F | Spire Wealth Management | 1.750 | -10,26 | 42 | -8,89 | ||||
| 2025-09-24 | NP | SWMIX - Laudus International MarketMasters Fund Select Shares | 7.049 | 0,00 | 164 | 5,13 | ||||
| 2026-02-17 | 13F | Ameriflex Group, Inc. | 222 | -50,00 | 5 | -50,00 | ||||
| 2025-11-13 | 13F | Macquarie Group Ltd | 0 | -100,00 | 0 | -100,00 | ||||
| 2025-09-25 | NP | VIHAX - Vanguard International High Dividend Yield Index Fund Admiral Shares | 235.568 | 7,57 | 5.495 | 12,88 | ||||
| 2026-02-11 | 13F | Hilton Head Capital Partners, LLC | 19 | 0 | ||||||
| 2026-02-17 | 13F | Toronto Dominion Bank | 7.110.824 | 5,61 | 169.622 | 7,84 | ||||
| 2026-02-17 | 13F | Toronto Dominion Bank | Put | 4.622.900 | 31,85 | 110.274 | 34,63 | |||
| 2025-09-24 | NP | RVRB - Reverb ETF | 75 | 0,00 | 2 | 0,00 | ||||
| 2026-02-11 | 13F | 111 Capital | 13.483 | 322 | ||||||
| 2026-01-22 | 13F | V-Square Quantitative Management LLC | 5.066 | 166 | ||||||
| 2026-02-17 | 13F | Engineers Gate Manager LP | 0 | -100,00 | 0 | |||||
| 2026-02-13 | 13F | Bank Of Nova Scotia | 17.136.466 | 15,12 | 408.749 | 17,50 | ||||
| 2025-09-29 | NP | PTIN - Pacer Trendpilot International ETF | 2.573 | -4,63 | 60 | -6,25 | ||||
| 2026-02-10 | 13F | Norges Bank | 3.848.869 | 91.811 | ||||||
| 2026-02-04 | 13F | Plato Investment Management Ltd | 67.350 | 1.616 | ||||||
| 2026-01-22 | 13F | JCIC Asset Management Inc. | 1.208 | -8,35 | 29 | -6,67 | ||||
| 2026-02-06 | 13F | HighTower Advisors, LLC | 51.022 | -7,72 | 1.216 | -6,03 | ||||
| 2025-10-31 | 13F | Whittier Trust Co Of Nevada Inc | 0 | -100,00 | 0 | -100,00 |