Grundlæggende statistik
| Institutionelle ejere | 347 total, 307 long only, 12 short only, 28 long/short - change of -5,68% MRQ |
| Gennemsnitlig porteføljeallokering | 0.2895 % - change of 23,27% MRQ |
| Institutionelle aktier (lange) | 26.128.280 (ex 13D/G) - change of -1,01MM shares -3,72% MRQ |
| Institutionel værdi (lang) | $ 3.222.426 USD ($1000) |
Institutionelt ejerskab og aktionærer
SPDR Series Trust - State Street SPDR S&P Oil & Gas Exploration & Production ETF (US:XOP) har 347 institutionelle ejere og aktionærer, der har indsendt 13D/G- eller 13F-formularer til Securities Exchange Commission (SEC). Disse institutioner har i alt 26,130,320 aktier. Største aktionærer omfatter Bank Of America Corp /de/, Goldman Sachs Group Inc, Soros Fund Management Llc, Healthcare Of Ontario Pension Plan Trust Fund, Susquehanna International Group, Llp, UBS Group AG, Elliott Investment Management L.P., Goldman Sachs Group Inc, Citigroup Inc, and Morgan Stanley .
SPDR Series Trust - State Street SPDR S&P Oil & Gas Exploration & Production ETF (ARCA:XOP) institutionel ejerskabsstruktur viser aktuelle positioner i virksomheden efter institutioner og fonde, samt seneste ændringer i positionsstørrelse. Større aktionærer kan omfatte individuelle investorer, investeringsforeninger, hedgefonde eller institutioner. Skema 13D angiver, at investoren besidder (eller besidder) mere end 5 % af virksomheden og har til hensigt (eller har til hensigt at) aktivt at forfølge en ændring i forretningsstrategi. Skema 13G indikerer en passiv investering på over 5%.
The share price as of March 20, 2026 is 177,12 / share. Previously, on March 21, 2025, the share price was 131,36 / share. This represents an increase of 34,84% over that period.

Fondens stemningsscore
Fund Sentiment Score (fka Ownership Accumulation Score) finder de aktier, der bliver mest købt af fonde. Det er resultatet af en sofistikeret, multi-faktor kvantitativ model, der identificerer virksomheder med de højeste niveauer af institutionel akkumulering. Scoringsmodellen bruger en kombination af den samlede stigning i oplyste ejere, ændringerne i porteføljeallokeringer i disse ejere og andre målinger. Tallet går fra 0 til 100, hvor højere tal indikerer et højere niveau af akkumulering for sine jævnaldrende, og 50 er gennemsnittet.
Opdateringsfrekvens: Dagligt
Se Ownership Explorer, som giver en liste over højest rangerende virksomheder.
AI+ Ask Fintel’s AI assistant about SPDR Series Trust - State Street SPDR S&P Oil & Gas Exploration & Production ETF.
Select a question to share a public post with an AI-crafted answer.
Thinking of good questions…
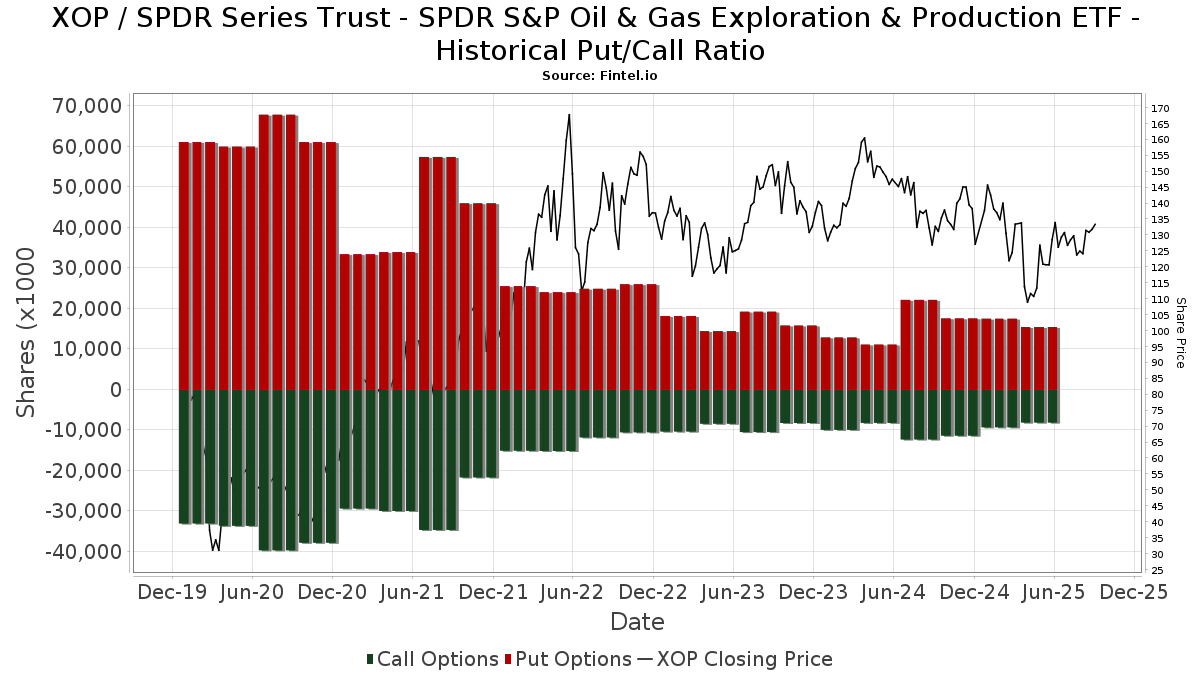
Institutionel Put/Call-forhold
Ud over at indberette standardaktie- og gældsudstedelser skal institutter med mere end 100 mill. aktiver under forvaltning også oplyse deres put- og call-optionsbeholdninger. Da salgsoptioner generelt indikerer negativ stemning, og købsoptioner indikerer positiv stemning, kan vi få en fornemmelse af den overordnede institutionelle stemning ved at plotte forholdet mellem put og kald. Diagrammet til højre viser det historiske put/call-forhold for dette instrument.
Brug af Put/Call Ratio som en indikator for investorernes stemning overvinder en af de vigtigste mangler ved at bruge totalt institutionelt ejerskab, som er, at en betydelig mængde af aktiver under forvaltning investeres passivt for at spore indekser. Passivt forvaltede fonde køber typisk ikke optioner, så indikatoren for put/call-forholdet følger mere nøje følelsen af aktivt forvaltede fonde.
13F og NPORT arkivering
Detaljer om 13F-arkivering er gratis. Detaljer om NP-ansøgninger kræver et premium-medlemskab. Grønne rækker angiver nye positioner. Røde rækker angiver lukkede positioner. Klik på linket ikon for at se den fulde transaktionshistorik.
Opgrader
for at låse premium-data op og eksportere til Excel ![]() .
.
| Fil dato | Kilde | Investor | Type | Gennemsnitlig pris (Øst) |
Aktier | Δ Aktier (%) |
Rapporteret Værdi ($1000) |
Δ Værdi (%) |
Port Alloc (%) |
|
|---|---|---|---|---|---|---|---|---|---|---|
| 2025-11-12 | 13F | CIBC Bancorp USA Inc. | 1.535 | 203 | ||||||
| 2026-01-26 | 13F | Mirae Asset Global Investments Co., Ltd. | 16.770 | 179,50 | 2.117 | 166,96 | ||||
| 2026-01-05 | 13F | Chesapeake Asset Management Llc | 0 | -100,00 | 0 | -100,00 | ||||
| 2026-02-17 | 13F | Hartree Partners, LP | 0 | -100,00 | 0 | |||||
| 2025-11-10 | 13F | Waratah Capital Advisors Ltd. | Call | 0 | -100,00 | 0 | -100,00 | |||
| 2025-11-14 | 13F | Whitebox Advisors Llc | 0 | -100,00 | 0 | -100,00 | ||||
| 2026-02-03 | 13F | Fiduciary Counselling Inc | 2.022 | 0,00 | 255 | -4,49 | ||||
| 2026-02-13 | 13F | Pacific Center for Financial Services | 39 | 0,00 | 5 | 0,00 | ||||
| 2026-02-17 | 13F | Meridian Wealth Advisors, LLC | 1.900 | 240 | ||||||
| 2026-01-26 | 13F | Whittier Trust Co | 1.030 | -2,83 | 129 | -8,51 | ||||
| 2026-02-14 | 13F | Torrey Growth & Income Advisors | 0 | -100,00 | 0 | |||||
| 2026-01-29 | 13F | Camelot Portfolios, LLC | 0 | 0 | ||||||
| 2026-02-06 | 13F | IFP Advisors, Inc | 288 | -0,69 | 36 | -5,26 | ||||
| 2026-02-13 | 13F | Arete Wealth Advisors, LLC | 26.852 | 3 | ||||||
| 2026-01-08 | 13F | Ulland Investment Advisors, LLC | 25 | 0,00 | 0 | |||||
| 2026-02-11 | 13F | Allianz Asset Management GmbH | Put | 148.500 | 2,06 | 18.750 | -2,53 | |||
| 2026-01-29 | 13F | Concurrent Investment Advisors, LLC | 2.154 | 272 | ||||||
| 2026-01-30 | 13F | Skylands Capital, LLC | 61.630 | 48,94 | 7.781 | 42,25 | ||||
| 2026-02-02 | 13F | Ping Capital Management, Inc. | 40.000 | 21,21 | 5.050 | 15,77 | ||||
| 2026-02-19 | 13F | CI Private Wealth, LLC | 22.377 | 62,13 | 1.782 | -2,36 | ||||
| 2026-02-11 | 13F | Arrowroot Family Office, LLC | 8.355 | -2,54 | 1.055 | -6,97 | ||||
| 2026-02-13 | 13F | Natixis | 4.323 | 62,58 | 546 | 55,27 | ||||
| 2025-11-05 | 13F | J.w. Cole Advisors, Inc. | 0 | -100,00 | 0 | -100,00 | ||||
| 2026-01-30 | 13F | W.G. Shaheen & Associates DBA Whitney & Co | 54.508 | 2,37 | 6.882 | -2,22 | ||||
| 2025-11-13 | 13F | Marshall Wace, Llp | Put | 0 | -100,00 | 0 | ||||
| 2026-02-17 | 13F | Hbk Investments L P | Put | 0 | -100,00 | 0 | ||||
| 2026-01-28 | 13F | WIT Partners Advisory Pte. Ltd. | 2.500 | 0,00 | 300 | -5,38 | ||||
| 2026-01-14 | 13F | Canoe Financial LP | 0 | -100,00 | 0 | |||||
| 2026-01-27 | 13F | Berger Financial Group, Inc | 4.449 | 6,54 | 562 | 1,63 | ||||
| 2026-02-26 | 13F/A | Sculptor Capital LP | 0 | -100,00 | 0 | |||||
| 2026-02-09 | 13F | Parkside Investments, LLC | 0 | -100,00 | 0 | -100,00 | ||||
| 2026-02-06 | 13F | Mizuho Markets Cayman LP | 9.873 | 284,76 | 1.247 | 267,55 | ||||
| 2026-01-28 | 13F | HB Wealth Management, LLC | 9.990 | 0,16 | 1.261 | -4,32 | ||||
| 2026-02-17 | 13F | Capital Fund Management S.a. | Put | 214.500 | -24,68 | 27.083 | -28,07 | |||
| 2026-02-17 | 13F | Capital Fund Management S.a. | Call | 176.800 | 10,16 | 22.323 | 5,20 | |||
| 2026-02-17 | 13F | D. E. Shaw & Co., Inc. | 14.923 | -58,49 | 1.884 | -60,35 | ||||
| 2025-11-12 | 13F | Cresset Asset Management, LLC | 2.105 | 3,34 | 278 | 8,59 | ||||
| 2026-02-09 | 13F | Jefferies Financial Group Inc. | Put | 30.000 | -26,83 | 3.788 | -30,13 | |||
| 2026-02-09 | 13F | Jefferies Financial Group Inc. | 4.899 | -62,46 | 619 | -64,17 | ||||
| 2026-03-13 | 13F | ARP Global Capital Ltd | 76.000 | 9.596 | ||||||
| 2026-01-09 | 13F | Dynamic Advisor Solutions LLC | 9.601 | -11,13 | 1.212 | -15,13 | ||||
| 2026-02-17 | 13F | J. Goldman & Co LP | 3.369 | 0,00 | 425 | -4,49 | ||||
| 2026-01-28 | 13F | Deane Retirement Strategies, Inc. | 37.469 | 4.731 | ||||||
| 2026-02-13 | 13F | Vontobel Holding Ltd. | 5.728 | 68,32 | 723 | 61,02 | ||||
| 2026-01-15 | 13F | Founders Capital Management | 252 | 0,00 | 32 | -6,06 | ||||
| 2025-10-08 | 13F/A | New York State Common Retirement Fund | 0 | -100,00 | 0 | -100,00 | ||||
| 2026-01-23 | 13F | LOM Asset Management Ltd | 350 | -60,23 | 44 | -62,07 | ||||
| 2026-01-21 | 13F | Access Financial Services, Inc. | 7.352 | -0,19 | 928 | -4,62 | ||||
| 2026-02-03 | 13F | Insight 2811, Inc. | 1.949 | 0,00 | 246 | -4,28 | ||||
| 2026-02-13 | 13F | Financial Sense Advisors, Inc. | 0 | -100,00 | 0 | |||||
| 2026-02-12 | 13F | Jane Street Group, Llc | Call | 829.000 | 18,18 | 104.670 | 12,87 | |||
| 2026-02-12 | 13F | Jane Street Group, Llc | Put | 1.367.900 | 33,71 | 172.711 | 27,71 | |||
| 2026-02-12 | 13F | Schneider Downs Wealth Management Advisors, LP | 2.361 | 0,00 | 298 | -4,49 | ||||
| 2026-02-17 | 13F | Concorde Financial Corp | 3.462 | 0,00 | 484 | 5,69 | ||||
| 2025-11-12 | 13F | Aster Capital Management (DIFC) Ltd | 0 | -100,00 | 0 | |||||
| 2026-01-29 | 13F | IMC-Chicago, LLC | 0 | -100,00 | 0 | |||||
| 2026-02-17 | 13F | Creative Planning | 3.499 | 3,86 | 442 | -0,90 | ||||
| 2026-02-17 | 13F | Tower Research Capital LLC (TRC) | 15 | 275,00 | 2 | |||||
| 2025-11-04 | 13F | Thrivent Financial For Lutherans | 0 | -100,00 | 0 | |||||
| 2026-02-09 | 13F | MTM Investment Management, LLC | 0 | -100,00 | 0 | |||||
| 2026-02-13 | 13F | SRS Capital Advisors, Inc. | 90 | 11 | ||||||
| 2026-02-13 | 13F | Neuberger Berman Group LLC | 6.550 | -0,30 | 827 | -4,72 | ||||
| 2026-02-17 | 13F | Point72 Asset Management, L.P. | Call | 50.000 | 6.313 | |||||
| 2026-02-17 | 13F | Susquehanna International Group, Llp | 168.263 | 1,64 | 21.245 | -2,92 | ||||
| 2026-02-12 | 13F | Great Valley Advisor Group, Inc. | 0 | -100,00 | 0 | |||||
| 2026-02-17 | 13F | Susquehanna International Group, Llp | Put | 2.722.400 | -28,53 | 343.730 | -31,74 | |||
| 2026-02-17 | 13F | Balyasny Asset Management Llc | Put | 330.900 | -4,06 | 41.779 | -8,37 | |||
| 2026-02-04 | 13F | Fourth Dimension Wealth, LLC | 652 | -0,46 | 82 | -4,65 | ||||
| 2026-02-13 | 13F | Mariner, LLC | 10.044 | 32,98 | 1.268 | 27,05 | ||||
| 2026-01-13 | 13F | CoreCap Advisors, LLC | 23 | -81,30 | 3 | -87,50 | ||||
| 2026-02-12 | 13F | DRW Securities, LLC | Put | 12.500 | 1.578 | |||||
| 2026-02-17 | 13F | Susquehanna International Group, Llp | Call | 1.452.800 | 11,16 | 183.431 | 6,17 | |||
| 2026-02-12 | 13F | DRW Securities, LLC | Call | 50.000 | 6.313 | |||||
| 2026-02-10 | 13F | Crestmont Private Wealth LLC | 1.856 | 0,00 | 234 | -4,49 | ||||
| 2026-02-05 | 13F | Allworth Financial LP | 874 | 174,84 | 110 | 161,90 | ||||
| 2026-02-06 | 13F | Vestmark Advisory Solutions, Inc. | 3.510 | 443 | ||||||
| 2026-02-12 | 13F | Jane Street Group, Llc | 4.772 | -71,93 | 603 | -73,21 | ||||
| 2026-02-17 | 13F | Ancora Advisors, LLC | 600 | 0,00 | 76 | -5,06 | ||||
| 2026-02-17 | 13F | Nokomis Capital, L.L.C. | 0 | -100,00 | 0 | |||||
| 2026-02-17 | 13F | Balyasny Asset Management Llc | Call | 154.500 | -22,52 | 19.507 | -26,00 | |||
| 2026-02-17 | 13F | Credit Agricole S A | 6.337 | 141,41 | 800 | 130,55 | ||||
| 2026-01-30 | 13F | Us Bancorp \de\ | 5.064 | 1,81 | 639 | -2,74 | ||||
| 2026-01-30 | 13F | Caldwell Trust Co | 82 | 0,00 | 10 | 0,00 | ||||
| 2026-02-27 | 13F | Strategic Investment Solutions, Inc. /IL | 50 | -75,00 | 6 | -76,92 | ||||
| 2026-02-06 | 13F | Frisch Financial Group, Inc. | 21.494 | -1,64 | 2.714 | -6,06 | ||||
| 2026-02-12 | 13F | Wealthspire Advisors, LLC | 3.246 | 120,37 | 410 | 110,82 | ||||
| 2026-02-12 | 13F | Chilton Capital Management Llc | 168 | 0,00 | 21 | -4,55 | ||||
| 2025-11-14 | 13F | Capstone Investment Advisors, Llc | 0 | -100,00 | 0 | -100,00 | ||||
| 2025-11-14 | 13F | Capstone Investment Advisors, Llc | Call | 835.100 | 148,54 | 110.400 | 161,19 | |||
| 2025-11-14 | 13F | Capstone Investment Advisors, Llc | Put | 1.246.800 | 127,85 | 164.827 | 139,44 | |||
| 2026-02-12 | 13F | Hollencrest Capital Management | 287 | 0,70 | 36 | -2,70 | ||||
| 2026-01-22 | 13F | Pinnacle Bancorp, Inc. | 28 | 4 | ||||||
| 2026-02-17 | 13F | Silvercrest Asset Management Group Llc | 12.265 | 0,00 | 1.549 | -4,50 | ||||
| 2026-02-17 | 13F | Bank Of America Corp /de/ | Put | 0 | -100,00 | 0 | ||||
| 2026-02-13 | 13F | DLD Asset Management, LP | Put | 6.000 | 758 | |||||
| 2026-02-17 | 13F | Bank Of America Corp /de/ | Call | 0 | -100,00 | 0 | ||||
| 2026-02-18 | 13F | EP Wealth Advisors, Inc. | 79.193 | -72,89 | 9.999 | -72,80 | ||||
| 2025-10-15 | 13F | Financial Management Professionals, Inc. | 0 | -100,00 | 0 | -100,00 | ||||
| 2026-02-12 | 13F | Pettinga Financial Advisors, LLC | 14.223 | -7,47 | 1.796 | -11,66 | ||||
| 2026-01-28 | 13F | Rockingstone Advisors LLC | 5.870 | 4,63 | 741 | 0,00 | ||||
| 2026-02-13 | 13F | Mml Investors Services, Llc | 11.795 | -64,81 | 1.489 | -66,40 | ||||
| 2026-02-11 | 13F | O'shaughnessy Asset Management, Llc | 63 | -70,56 | 8 | -75,00 | ||||
| 2026-02-17 | 13F | Jones Financial Companies Lllp | 7.619 | 15,88 | 962 | 6,54 | ||||
| 2026-02-06 | 13F | Cadence Wealth Management LLC | 235.924 | 66,46 | 29.788 | 58,98 | ||||
| 2026-02-13 | 13F | Pin Oak Investment Advisors Inc | 135 | 0,00 | 0 | -100,00 | ||||
| 2026-01-07 | 13F | Harbor Investment Advisory, Llc | 800 | 0,00 | 101 | -3,81 | ||||
| 2026-02-17 | 13F | Two Sigma Investments, Lp | 458.394 | 1.112,71 | 57.877 | 1.058,21 | ||||
| 2026-01-15 | 13F | Nikulski Financial, Inc. | 15.758 | 184,80 | 1.990 | 172,09 | ||||
| 2026-02-14 | 13F | Howe & Rusling Inc | 35 | 0,00 | 4 | 0,00 | ||||
| 2026-01-23 | 13F | Assetmark, Inc | 92 | -20,00 | 12 | -26,67 | ||||
| 2025-11-14 | 13F | Strategic Wealth Partners, Ltd. | 146 | 0,00 | 19 | 5,56 | ||||
| 2025-11-14 | 13F | Polymer Capital Management (US) LLC | Call | 0 | -100,00 | 0 | -100,00 | |||
| 2026-02-05 | 13F | AlphaCore Capital LLC | 171 | 0,00 | 22 | -4,55 | ||||
| 2026-02-13 | 13F | Arkadios Wealth Advisors | 24.364 | -6,75 | 3.076 | -10,94 | ||||
| 2026-02-13 | 13F | Boston Partners | 2.775 | 0,00 | 350 | -4,37 | ||||
| 2026-02-06 | 13F | Copia Wealth Management | 442 | 0,00 | 56 | -5,17 | ||||
| 2025-09-26 | NP | OWSMX - Old Westbury Small & Mid Cap Strategies Fund | 102.937 | 0,00 | 13.191 | 15,75 | ||||
| 2026-02-17 | 13F | Perritt Capital Management Inc | 0 | -100,00 | 0 | |||||
| 2026-02-12 | 13F | Insigneo Advisory Services, Llc | 0 | -100,00 | 0 | |||||
| 2026-01-23 | 13F | U.S. Capital Wealth Advisors, LLC | 5.845 | 2,56 | 738 | -1,99 | ||||
| 2026-02-10 | 13F | Caz Investments Lp | 15.000 | 0,00 | 1.894 | -4,54 | ||||
| 2026-01-27 | 13F | Friedenthal Financial | 0 | -100,00 | 0 | |||||
| 2026-02-17 | 13F | Van Den Berg Management I, Inc | 3.492 | -7,67 | 441 | -11,82 | ||||
| 2026-03-06 | 13F | Hsbc Holdings Plc | 0 | -100,00 | 0 | |||||
| 2025-11-06 | 13F | Centerpoint Advisors, LLC | 0 | -100,00 | 0 | |||||
| 2026-02-17 | 13F | Jump Financial, LLC | 0 | -100,00 | 0 | |||||
| 2026-02-17 | 13F | Private Advisor Group, LLC | 3.718 | -58,39 | 469 | -60,29 | ||||
| 2026-01-29 | 13F | Kestra Private Wealth Services, Llc | 6.940 | -13,08 | 876 | -16,97 | ||||
| 2025-10-16 | 13F | Lowe Wealth Advisors, LLC | 612 | 0,00 | 81 | 5,26 | ||||
| 2026-01-26 | 13F | AE Wealth Management LLC | 2.149 | -4,28 | 271 | -8,45 | ||||
| 2026-02-06 | 13F | Mizuho Markets Americas Llc | 6.827 | 57,78 | 862 | 50,52 | ||||
| 2026-02-05 | 13F | Western Wealth Management, LLC | 1.629 | 0,18 | 206 | -4,21 | ||||
| 2025-11-14 | 13F | Lazard Asset Management Llc | 0 | -100,00 | 0 | |||||
| 2026-01-14 | 13F | Spire Wealth Management | 150 | -7,98 | 19 | -14,29 | ||||
| 2026-02-13 | 13F | Walleye Capital LLC | 0 | -100,00 | 0 | -100,00 | ||||
| 2026-02-13 | 13F | Southeast Asset Advisors Inc. | 0 | -100,00 | 0 | |||||
| 2026-02-17 | 13F | Aqr Capital Management Llc | 2.825 | 357 | ||||||
| 2026-02-12 | 13F | Commonwealth Equity Services, Llc | 29.534 | 9,84 | 3.729 | 124.166,67 | ||||
| 2026-02-17 | 13F | Caption Management, LLC | 0 | -100,00 | 0 | |||||
| 2025-11-06 | 13F | Willis Johnson & Associates, Inc. | 0 | -100,00 | 0 | |||||
| 2026-01-12 | 13F | Fiduciary Financial Group, Llc | 1.816 | -10,50 | 229 | -14,55 | ||||
| 2026-02-13 | 13F | Barclays Plc | 1.540.222 | 350,91 | 194.468 | 330,65 | ||||
| 2026-02-12 | 13F | Waters Parkerson & Co., Llc | 2.500 | 0,00 | 316 | -4,55 | ||||
| 2025-11-14 | 13F | Hrt Financial Lp | 0 | -100,00 | 0 | -100,00 | ||||
| 2026-02-10 | 13F | Private Wealth Asset Management, LLC | 1.582 | 0,00 | 200 | -4,78 | ||||
| 2026-02-11 | 13F | TruNorth Capital Management, LLC | 0 | -100,00 | 0 | |||||
| 2026-02-13 | 13F | Barclays Plc | Put | 58.600 | 0,00 | 7.399 | -4,49 | |||
| 2026-02-13 | 13F | Citigroup Inc | 2.128.640 | -17,90 | 268.762 | -21,59 | ||||
| 2026-01-02 | 13F | Global Wealth Strategies & Associates | 160 | 0,00 | 20 | -4,76 | ||||
| 2026-02-13 | 13F | Citigroup Inc | Call | 321.600 | 11,78 | 40.605 | 6,76 | |||
| 2026-02-09 | 13F | Fisher Asset Management, LLC | 11.187 | -2,13 | 1.413 | -6,55 | ||||
| 2026-02-13 | 13F | Citigroup Inc | Put | 721.400 | 40,62 | 91.084 | 34,31 | |||
| 2026-02-05 | 13F | Cornerstone Wealth Management, LLC | 1.726 | -7,25 | 218 | -11,79 | ||||
| 2026-02-06 | 13F | HighTower Advisors, LLC | 26.820 | 50,58 | 3.386 | 43,84 | ||||
| 2026-02-13 | 13F | Barclays Plc | Call | 478.900 | 29,50 | 60.466 | 23,68 | |||
| 2026-02-11 | 13F | Convergence Financial, LLC | 8.965 | -3,26 | 1.132 | -7,67 | ||||
| 2025-11-14 | 13F | Point72 Asset Management, L.P. | Put | 0 | -100,00 | 0 | -100,00 | |||
| 2026-02-09 | 13F | Wellington Shields Capital Management, LLC | 8.523 | -1,92 | 1.076 | -6,27 | ||||
| 2026-02-12 | 13F | BRYN MAWR TRUST Co | 0 | -100,00 | 0 | -100,00 | ||||
| 2026-02-17 | 13F | Raymond James Financial Inc | 48.399 | 38,09 | 6.111 | 31,88 | ||||
| 2026-02-17 | 13F | Lombard Odier Asset Management (USA) Corp | 18.000 | -10,00 | 2.273 | -14,07 | ||||
| 2026-02-17 | 13F | Lombard Odier Asset Management (USA) Corp | Put | 400.000 | 0,00 | 50.504 | -4,49 | |||
| 2026-01-21 | 13F | Vanderbilt University | 362.028 | 0,72 | 45.710 | -3,80 | ||||
| 2026-02-13 | 13F | SoftVest Advisors, LLC | Put | 83.000 | 0,00 | 10.480 | -4,49 | |||
| 2026-01-02 | 13F | Insight Wealth Strategies, LLC | 0 | -100,00 | 0 | |||||
| 2026-01-28 | 13F | Key Client Fiduciary Advisors, LLC | 2.480 | -8,15 | 313 | -12,08 | ||||
| 2026-02-17 | 13F | Russell Investments Group, Ltd. | 28 | 4 | ||||||
| 2026-01-23 | 13F | E&G Advisors, LP | 7.180 | -0,69 | 907 | -5,13 | ||||
| 2026-02-17 | 13F | Fmr Llc | 1.551 | -1,65 | 196 | -6,25 | ||||
| 2026-02-17 | 13F | Millennium Management Llc | Call | 451.700 | -28,30 | 57.032 | -31,52 | |||
| 2026-02-13 | 13F | Morgan Stanley | 2.033.968 | -7,19 | 256.809 | -11,36 | ||||
| 2026-02-11 | 13F | Modus Advisors, LLC | 39.988 | -3,51 | 5.049 | -7,85 | ||||
| 2026-01-29 | 13F | Comerica Bank | 2.502 | -59,12 | 316 | -61,06 | ||||
| 2026-02-17 | 13F | Millennium Management Llc | 32.091 | 154,89 | 4.052 | 143,45 | ||||
| 2026-02-17 | 13F | EFG International AG | 600 | 76 | ||||||
| 2026-01-29 | 13F | Quest 10 Wealth Builders, Inc. | 14 | 0,00 | 2 | 0,00 | ||||
| 2026-02-05 | 13F | ARS Investment Partners, LLC | 16.992 | -4,41 | 2.145 | -8,68 | ||||
| 2026-02-17 | 13F | Whitebox Advisors Llc | Put | 200.000 | 0,00 | 25.252 | -4,49 | |||
| 2025-11-13 | 13F | Wells Fargo & Company/mn | Put | 0 | -100,00 | 0 | -100,00 | |||
| 2026-01-12 | 13F | Abound Wealth Management | 200 | 25 | ||||||
| 2026-02-10 | 13F | Cherry Tree Wealth Management, LLC | 36 | 0,00 | 5 | 0,00 | ||||
| 2026-02-10 | 13F | Envestnet Asset Management Inc | 7.552 | -57,42 | 953 | -59,34 | ||||
| 2026-02-17 | 13F | Price T Rowe Associates Inc /md/ | 0 | -100,00 | 0 | |||||
| 2026-01-21 | 13F | Crews Bank & Trust | 119 | 0,00 | 15 | 0,00 | ||||
| 2026-01-30 | 13F | Pekin Hardy Strauss, Inc. | 5.312 | 41,84 | 671 | 35,35 | ||||
| 2026-02-18 | 13F | Ctc Llc | Put | 50 | 0,00 | 631 | -4,54 | |||
| 2025-11-14 | 13F | Gts Securities Llc | 0 | -100,00 | 0 | -100,00 | ||||
| 2026-02-17 | 13F | Jain Global LLC | Put | 0 | -100,00 | 0 | ||||
| 2025-11-13 | 13F | Wells Fargo & Company/mn | Call | 0 | -100,00 | 0 | -100,00 | |||
| 2026-02-17 | 13F | Jain Global LLC | Call | 0 | -100,00 | 0 | ||||
| 2026-02-13 | 13F | Colony Group, LLC | 7.491 | -3,97 | 947 | -8,24 | ||||
| 2026-02-17 | 13F | Millennium Management Llc | Put | 825.900 | -23,62 | 104.278 | -27,05 | |||
| 2026-02-28 | 13F | Corecam Pte. Ltd. | 0 | -100,00 | 0 | |||||
| 2026-02-18 | 13F | Caitlin John, LLC | 12 | 0,00 | 2 | 0,00 | ||||
| 2026-02-13 | 13F | Cordoba Advisory Partners LLC | 5.128 | 647 | ||||||
| 2026-02-13 | 13F | Transamerica Financial Advisors, Inc. | 4.965 | 627 | ||||||
| 2026-02-13 | 13F | Itau Unibanco Holding S.A. | 34.800 | 4.394 | ||||||
| 2025-11-14 | 13F | Verition Fund Management LLC | 0 | -100,00 | 0 | |||||
| 2026-01-21 | 13F | Walkner Condon Financial Advisors LLC | 1.960 | 0,00 | 247 | -4,63 | ||||
| 2025-11-14 | 13F | Sig Brokerage, Lp | Call | 0 | -100,00 | 0 | -100,00 | |||
| 2026-02-02 | 13F | CX Institutional | 330 | -7,82 | 0 | |||||
| 2026-02-17 | 13F | Equitable Holdings, Inc. | 2.283 | 19,72 | 288 | 14,29 | ||||
| 2026-01-13 | 13F/A | Sanctuary Advisors, LLC | 3.962 | -4,25 | 524 | 0,58 | ||||
| 2026-01-21 | 13F | Heritage Oak Wealth Advisors Llc | 12.682 | -6,89 | 1.601 | -11,06 | ||||
| 2026-02-13 | 13F | Venture Visionary Partners LLC | 6.021 | -11,49 | 760 | -15,46 | ||||
| 2026-02-05 | 13F | Wakefield Asset Management LLLP | 0 | -100,00 | 0 | |||||
| 2026-02-12 | 13F | Bank Of Montreal /can/ | Put | 10.000 | 1.263 | |||||
| 2026-02-12 | 13F | Bank Of Montreal /can/ | 46.218 | 13,28 | 5.835 | 8,20 | ||||
| 2026-02-13 | 13F | Centiva Capital, LP | Put | 36.800 | 0,00 | 4.646 | -4,48 | |||
| 2026-02-13 | 13F | Global Endowment Management, LP | 2.700 | 0,00 | 341 | -4,21 | ||||
| 2026-01-21 | 13F | Capital Investment Advisory Services, LLC | 287 | -6,51 | 36 | -10,00 | ||||
| 2026-02-10 | 13F | Amica Mutual Insurance Co | 12.964 | 0,00 | 2 | 0,00 | ||||
| 2026-02-12 | 13F | Steward Partners Investment Advisory, Llc | 2.138 | -13,09 | 270 | -17,23 | ||||
| 2026-02-18 | 13F | Ctc Llc | Call | 36 | 0,00 | 455 | -4,42 | |||
| 2026-02-04 | 13F | Pensionmark Financial Group, Llc | 3.797 | 27,63 | 430 | 9,16 | ||||
| 2026-02-13 | 13F | Centaurus Financial, Inc. | 2.653 | -5,39 | 0 | |||||
| 2025-11-12 | 13F | Park Square Financial Group, LLC | 0 | -100,00 | 0 | -100,00 | ||||
| 2026-01-29 | 13F | Calamos Wealth Management LLC | 6.600 | 0,00 | 833 | -4,47 | ||||
| 2026-01-16 | 13F | Trust Co Of Vermont | 9 | -10,00 | 1 | 0,00 | ||||
| 2026-02-17 | 13F | Hilltop Holdings Inc. | 3.817 | 31,12 | 482 | 25,26 | ||||
| 2026-02-17 | 13F | Two Sigma Securities, Llc | 11.325 | -11,13 | 1.430 | -15,14 | ||||
| 2026-02-11 | 13F | Cerity Partners LLC | 11.353 | 3,16 | 1.433 | -1,44 | ||||
| 2025-11-14 | 13F | BlueCrest Capital Management Ltd | Call | 800.000 | 105.760 | |||||
| 2026-02-11 | 13F | Group One Trading, L.p. | 0 | -100,00 | 0 | |||||
| 2026-02-12 | 13F | Proficio Capital Partners LLC | 0 | -100,00 | 0 | |||||
| 2026-01-26 | 13F | SeaBridge Investment Advisors LLC | 2.233 | 0,00 | 282 | -4,75 | ||||
| 2025-11-14 | 13F | BlueCrest Capital Management Ltd | 15.051 | 1.990 | ||||||
| 2026-01-15 | 13F | Acima Private Wealth, Llc | 17.313 | -3,52 | 2.186 | -7,88 | ||||
| 2026-02-06 | 13F | Pnc Financial Services Group, Inc. | 9.195 | -8,29 | 1.161 | -12,45 | ||||
| 2026-01-23 | 13F | Westside Investment Management, Inc. | 200 | 0,00 | 25 | -3,85 | ||||
| 2026-02-13 | 13F | Cladis Investment Advisory, LLC | 2.628 | -1,28 | 332 | -5,70 | ||||
| 2026-02-13 | 13F | Soros Fund Management Llc | Put | 3.290.700 | 415.484 | |||||
| 2026-02-13 | 13F | Wexford Capital Lp | 358 | 45 | ||||||
| 2026-01-20 | 13F | Global Trust Asset Management, LLC | 0 | -100,00 | 0 | -100,00 | ||||
| 2025-11-12 | 13F | Level Four Advisory Services, Llc | 0 | -100,00 | 0 | -100,00 | ||||
| 2026-02-03 | 13F | Credit Industriel Et Commercial | 38.468 | 87,63 | 4.857 | 79,19 | ||||
| 2026-01-26 | 13F | Heritage Wealth Management, Inc. | 6.315 | -54,88 | 797 | -56,92 | ||||
| 2025-10-07 | 13F | EWG Elevate Inc. | 0 | -100,00 | 0 | -100,00 | ||||
| 2026-02-03 | 13F | Credit Industriel Et Commercial | Put | 147.500 | 84,38 | 18.623 | 76,09 | |||
| 2026-02-04 | 13F | Hallmark Capital Management Inc | 98 | 0,00 | 12 | 0,00 | ||||
| 2026-02-10 | 13F | Essex Financial Services, Inc. | 7.466 | -0,31 | 943 | -4,85 | ||||
| 2026-02-13 | 13F | Healthcare Of Ontario Pension Plan Trust Fund | 3.099.500 | 1,66 | 391.343 | -2,91 | ||||
| 2026-02-13 | 13F | Squarepoint Ops LLC | 0 | -100,00 | 0 | -100,00 | ||||
| 2026-02-17 | 13F | Moore Capital Management, Lp | Put | 0 | -100,00 | 0 | ||||
| 2026-02-17 | 13F/A | Kovack Advisors, Inc. | 2.097 | 265 | ||||||
| 2026-01-30 | 13F | Oakworth Capital, Inc. | 229 | -8,76 | 29 | -15,15 | ||||
| 2026-02-17 | 13F | Aristeia Capital Llc | Put | 500.500 | -18,55 | 63.193 | -22,21 | |||
| 2026-02-02 | 13F | Advisors Preferred, LLC | 0 | -100,00 | 0 | |||||
| 2026-02-17 | 13F | Scopus Asset Management, L.p. | Put | 125.000 | 15.782 | |||||
| 2026-02-17 | 13F | Evercore Wealth Management, LLC | 1.786 | -47,49 | 226 | -49,89 | ||||
| 2026-01-20 | 13F | Meridian Investment Counsel Inc. | 5.355 | -8,54 | 676 | -12,66 | ||||
| 2025-11-14 | 13F | Wolverine Trading, Llc | Put | 629.400 | 13,79 | 84.025 | 19,43 | |||
| 2025-11-14 | 13F | Wolverine Trading, Llc | Call | 149.300 | -27,56 | 19.932 | -23,97 | |||
| 2026-02-06 | 13F | Global Retirement Partners, LLC | 95 | 61,02 | 12 | 57,14 | ||||
| 2025-11-14 | 13F | State Of Wisconsin Investment Board | 0 | -100,00 | 0 | |||||
| 2025-11-14 | 13F | State Of Wisconsin Investment Board | Call | 0 | -100,00 | 0 | ||||
| 2026-02-17 | 13F | Royal Bank Of Canada | Put | 104.700 | 0,00 | 13.219 | -4,49 | |||
| 2026-02-17 | 13F | Royal Bank Of Canada | 223.376 | -8,84 | 28.204 | -12,93 | ||||
| 2026-02-13 | 13F | Headlands Technologies LLC | 4.854 | 613 | ||||||
| 2026-02-17 | 13F | Advisor Group Holdings, Inc. | 31.258 | 3,11 | 3.948 | -1,89 | ||||
| 2025-11-14 | 13F | Wolverine Trading, Llc | 9.594 | -21,69 | 1.281 | -17,84 | ||||
| 2026-02-13 | 13F | Marshall Wace, Llp | 222.463 | 28.088 | ||||||
| 2026-02-09 | 13F | Harbour Investments, Inc. | 1.624 | -3,62 | 205 | -7,66 | ||||
| 2026-02-17 | 13F | Turim 21 Investimentos Ltda. | 10.646 | -8,01 | 2.039 | -7,11 | ||||
| 2026-02-03 | 13F | We Are One Seven, LLC | 4.855 | -11,00 | 613 | -15,12 | ||||
| 2026-01-12 | 13F | Roble, Belko & Company, Inc | 0 | -100,00 | 0 | |||||
| 2026-01-30 | 13F | North Star Investment Management Corp. | 600 | 0,33 | 76 | -5,06 | ||||
| 2026-02-17 | 13F | Atom Investors LP | 0 | -100,00 | 0 | |||||
| 2026-02-11 | 13F | Janney Montgomery Scott LLC | 7.189 | -2,75 | 1 | |||||
| 2026-02-13 | 13F | Sunbeam Capital Management, LLC | 1.777 | 0,00 | 224 | -4,27 | ||||
| 2026-02-13 | 13F | Aptus Capital Advisors, LLC | 946 | 2,05 | 119 | -2,46 | ||||
| 2025-11-12 | 13F | SoftVest Advisors, LLC | Call | 0 | -100,00 | 0 | -100,00 | |||
| 2026-02-10 | 13F | Winthrop Capital Management, LLC | 335 | 0,90 | 0 | |||||
| 2026-02-13 | 13F | Squarepoint Ops LLC | Call | 94.700 | 334,40 | 11.957 | 314,99 | |||
| 2026-01-16 | 13F | Mirabaud & Cie SA | 5.000 | 0,00 | 631 | -4,39 | ||||
| 2026-02-13 | 13F | Squarepoint Ops LLC | Put | 9.200 | -39,07 | 1.162 | -41,83 | |||
| 2026-02-13 | 13F | Allianz Se | 63.025 | 12,49 | 7.958 | 7,44 | ||||
| 2026-02-17 | 13F | Quantinno Capital Management LP | 7.192 | 9,37 | 908 | 4,49 | ||||
| 2026-01-14 | 13F | Waldron Private Wealth LLC | 3.247 | 0,00 | 410 | -4,66 | ||||
| 2025-10-21 | 13F | Optimum Investment Advisors | 100 | 0,00 | 13 | 8,33 | ||||
| 2026-02-17 | 13F | Clear Street Markets Llc | 0 | -100,00 | 0 | |||||
| 2025-11-14 | 13F | XTX Topco Ltd | 0 | -100,00 | 0 | -100,00 | ||||
| 2026-02-04 | 13F | Independent Advisor Alliance | 2.095 | 265 | ||||||
| 2026-01-29 | 13F | Ashton Thomas Private Wealth, LLC | 33.175 | 111,98 | 4.189 | 102,51 | ||||
| 2025-10-31 | 13F | National Asset Management, Inc. | 0 | -100,00 | 0 | -100,00 | ||||
| 2026-02-13 | 13F | Toroso Investments, LLC | 0 | -100,00 | 0 | |||||
| 2026-02-17 | 13F | Qube Research & Technologies Ltd | 0 | -100,00 | 0 | |||||
| 2026-02-13 | 13F | Capital Square, LLC | 0 | -100,00 | 0 | |||||
| 2026-02-10 | 13F | Daiwa Securities Group Inc. | 1.825 | 0,00 | 0 | |||||
| 2025-11-12 | 13F | Twin Focus Capital Partners, Llc | 0 | -100,00 | 0 | |||||
| 2026-02-09 | 13F | HBK Sorce Advisory LLC | 12.843 | 7,92 | 1.880 | 25,50 | ||||
| 2026-01-15 | 13F | Jaffetilchin Investment Partners, LLC | 22.430 | 3,98 | 2.832 | -0,70 | ||||
| 2026-01-16 | 13F | FNY Investment Advisers, LLC | 1.054 | 40,53 | 0 | |||||
| 2026-02-11 | 13F | Simplex Trading, Llc | 0 | -100,00 | 0 | |||||
| 2026-01-13 | 13F | Stephens Consulting, LLC | 118 | 0,00 | 15 | -6,67 | ||||
| 2026-02-10 | 13F | Rothschild Investment Llc | 253 | 0,00 | 32 | -6,06 | ||||
| 2026-02-12 | 13F | Founders Financial Alliance, LLC | 2.526 | 0,00 | 319 | -4,50 | ||||
| 2026-01-30 | 13F | Archer Investment Corp | 121 | 0,00 | 15 | 0,00 | ||||
| 2026-01-23 | 13F | Ogorek Anthony Joseph /ny/ /adv | 257 | 0,78 | 0 | |||||
| 2026-02-17 | 13F | MGB Wealth Management, LLC | 750 | -25,45 | 95 | -29,32 | ||||
| 2026-02-13 | 13F | Hudson Bay Capital Management LP | Put | 0 | -100,00 | 0 | ||||
| 2026-01-28 | 13F | EPG Wealth Management LLC | 500 | 0,00 | 63 | -4,55 | ||||
| 2025-11-14 | 13F | Volterra Technologies LP | Put | 0 | -100,00 | 0 | ||||
| 2025-11-14 | 13F | Volterra Technologies LP | Call | 0 | -100,00 | 0 | ||||
| 2026-02-13 | 13F | Hudson Bay Capital Management LP | Call | 0 | -100,00 | 0 | ||||
| 2026-01-15 | 13F | Hara Capital LLC | 5.000 | 0,00 | 631 | -4,54 | ||||
| 2026-02-13 | 13F | Botty Investors LLC | 24.933 | 0,00 | 3.148 | -4,49 | ||||
| 2026-02-13 | 13F | Walleye Capital LLC | Put | 31.600 | 0,00 | 3.990 | -4,50 | |||
| 2026-02-13 | 13F | Walleye Capital LLC | Call | 8.300 | 0,00 | 1.048 | -4,56 | |||
| 2026-02-12 | 13F | Triumph Capital Management | 0 | -100,00 | 0 | -100,00 | ||||
| 2025-11-12 | 13F | Kingsview Wealth Management, LLC | 0 | -100,00 | 0 | -100,00 | ||||
| 2026-02-10 | 13F/A | Northwestern Mutual Wealth Management Co | 6.176 | -84,20 | 780 | -84,92 | ||||
| 2026-02-17 | 13F | VestGen Advisors, LLC | 2.937 | -4,11 | 371 | -8,42 | ||||
| 2026-02-13 | 13F | Banco Santander, S.A. | 10.282 | 0,00 | 1.298 | -4,49 | ||||
| 2026-02-17 | 13F | Parallax Volatility Advisers, L.P. | Put | 76.600 | -36,33 | 9.672 | -39,19 | |||
| 2026-01-29 | 13F | UBS Group AG | Put | 268.000 | 65,64 | 33.838 | 58,20 | |||
| 2026-01-29 | 13F | UBS Group AG | Call | 258.800 | 1.092,63 | 32.676 | 1.039,33 | |||
| 2026-01-29 | 13F | UBS Group AG | 2.431.845 | 61,63 | 307.045 | 54,36 | ||||
| 2026-02-10 | 13F | BW Gestao de Investimentos Ltda. | 17.955 | 2.267 | ||||||
| 2026-02-13 | 13F | Stifel Financial Corp | 27.581 | 0,73 | 3.483 | -3,79 | ||||
| 2026-01-09 | 13F | Appleton Partners Inc/ma | 8.534 | -6,56 | 1 | 0,00 | ||||
| 2026-02-10 | 13F | Quantbot Technologies LP | 131 | -98,49 | 17 | -98,61 | ||||
| 2026-02-06 | 13F | Advisory Alpha, LLC | 0 | -100,00 | 0 | |||||
| 2026-02-18 | 13F | GWM Advisors LLC | 3.142 | 24,34 | 397 | 18,56 | ||||
| 2026-02-17 | 13F | Toronto Dominion Bank | 3.640 | 52,56 | 460 | 45,71 | ||||
| 2025-10-30 | 13F | Twin Peaks Wealth Advisors, LLC | 0 | -100,00 | 0 | -100,00 | ||||
| 2025-11-14 | 13F | Marex Group plc | 0 | -100,00 | 0 | -100,00 | ||||
| 2026-02-03 | 13F | International Assets Investment Management, Llc | 138 | -97,40 | 17 | -97,47 | ||||
| 2025-10-31 | 13F | Capital Investment Counsel, Inc | 0 | -100,00 | 0 | -100,00 | ||||
| 2025-11-13 | 13F | Brown Brothers Harriman & Co | 0 | -100,00 | 0 | -100,00 | ||||
| 2025-11-14 | 13F | Alpine Global Management, LLC | 0 | -100,00 | 0 | |||||
| 2026-02-17 | 13F | Parallax Volatility Advisers, L.P. | Call | 17.100 | -86,74 | 2.159 | -87,34 | |||
| 2026-01-20 | 13F | AdvisorNet Financial, Inc | 1.144 | -1,29 | 144 | -5,88 | ||||
| 2026-02-17 | 13F | Parallax Volatility Advisers, L.P. | 13.376 | 1.337.500,00 | 1.689 | |||||
| 2025-10-23 | 13F | Strategic Blueprint, LLC | 0 | -100,00 | 0 | -100,00 | ||||
| 2026-02-11 | 13F | Twin Tree Management, LP | 0 | -100,00 | 0 | |||||
| 2026-02-11 | 13F | Twin Tree Management, LP | Call | 0 | -100,00 | 0 | ||||
| 2026-01-28 | 13F | Provident Wealth Management, LLC | 455 | 0,00 | 57 | -5,00 | ||||
| 2026-02-11 | 13F | Twin Tree Management, LP | Put | 0 | -100,00 | 0 | ||||
| 2026-02-17 | 13F | Nomura Holdings Inc | Put | 20.000 | 2.525 | |||||
| 2026-02-11 | 13F | Jpmorgan Chase & Co | 97.168 | -96,82 | 12.268 | -96,96 | ||||
| 2026-01-29 | 13F | Anchyra Partners Llc | 2.915 | 368 | ||||||
| 2026-02-03 | 13F | Bokf, Na | 0 | -100,00 | 0 | |||||
| 2026-02-05 | 13F | Cardinal Point Capital Management, ULC | 2.150 | 0,00 | 271 | -4,58 | ||||
| 2026-02-17 | 13F | Ameriprise Financial Inc | 4.557 | -27,42 | 575 | -30,72 | ||||
| 2025-11-17 | 13F | FSA Wealth Management LLC | 704 | 0,14 | 93 | 5,68 | ||||
| 2026-02-17 | 13F | Cetera Investment Advisers | 17.468 | 33,19 | 2.206 | 27,24 | ||||
| 2026-02-12 | 13F | Stamos Capital Partners, L.p. | 21.902 | 23,46 | 2.765 | 17,91 | ||||
| 2026-01-27 | 13F | Zurcher Kantonalbank (Zurich Cantonalbank) | 5.254 | 149,36 | 669 | 138,08 | ||||
| 2026-02-10 | 13F | Godfrey Financial Associates, Inc. | 235 | 30 | ||||||
| 2026-02-11 | 13F | LPL Financial LLC | 157.671 | -7,57 | 19.908 | -11,72 | ||||
| 2026-02-02 | 13F | Your Advocates Ltd., LLP | 222 | 0,00 | 28 | -3,45 | ||||
| 2026-01-23 | 13F | Farther Finance Advisors, LLC | 1.186 | 3,49 | 150 | -1,32 | ||||
| 2026-02-17 | 13F | Condire Management, LP | 41.028 | 5.180 | ||||||
| 2026-01-08 | 13F | Armstrong Advisory Group, Inc | 277 | -1,42 | 35 | -8,11 | ||||
| 2025-11-21 | 13F/A | Royal Bank Of Canada | Call | 0 | -100,00 | 0 | -100,00 | |||
| 2026-01-26 | 13F | Shelton Wealth Management, Llc | 4.389 | 0,87 | 554 | -3,65 | ||||
| 2025-11-07 | 13F | Smithfield Trust Co | 0 | -100,00 | 0 | |||||
| 2026-01-20 | 13F | Toth Financial Advisory Corp | 15 | 0,00 | 2 | 0,00 | ||||
| 2026-02-09 | 13F | Huntington National Bank | 0 | |||||||
| 2026-02-13 | 13F | Kestra Advisory Services, LLC | 0 | -100,00 | 0 | |||||
| 2026-01-27 | 13F | Krilogy Financial LLC | 49.664 | 13,86 | 6.694 | 23,05 | ||||
| 2025-10-22 | 13F | Massmutual Trust Co Fsb/adv | 0 | -100,00 | 0 | -100,00 | ||||
| 2026-02-12 | 13F | SWAN Capital LLC | 21 | 0,00 | 3 | 0,00 | ||||
| 2026-02-26 | 13F | Anchor Investment Management, LLC | 331 | 0,00 | 42 | -4,65 | ||||
| 2026-01-26 | 13F | Whittier Trust Co Of Nevada Inc | 1.670 | 0,00 | 210 | -5,86 | ||||
| 2026-02-06 | 13F | Banque Cantonale Vaudoise | 0 | -100,00 | 0 | |||||
| 2026-02-17 | 13F | Holt Capital Advisors, L.L.C. dba Holt Capital Partners, L.P. | 4.413 | 20,44 | 557 | 15,08 | ||||
| 2025-09-26 | 13F | Capital A Wealth Management, LLC | 0 | -100,00 | 0 | |||||
| 2026-02-04 | 13F | Ameritas Advisory Services, LLC | 3.742 | -21,30 | 472 | -24,84 | ||||
| 2026-02-17 | 13F | Banco Bilbao Vizcaya Argentaria, S.a. | 0 | -100,00 | 0 | |||||
| 2026-02-12 | 13F | Tillman Hartley LLC | 0 | -100,00 | 0 | |||||
| 2026-02-17 | 13F | Signature Equity Partners, LLC | 127 | 16 | ||||||
| 2025-11-03 | 13F | Valeo Financial Advisors, LLC | 0 | -100,00 | 0 | -100,00 | ||||
| 2026-02-17 | 13F | Optiver Holding B.V. | 115.235 | 14.550 | ||||||
| 2026-01-12 | 13F | Salem Investment Counselors Inc | 1.845 | -19,61 | 233 | -23,43 | ||||
| 2026-01-26 | 13F | Abbington Investment Group | 48.649 | 78,76 | 6.143 | 70,75 | ||||
| 2026-02-06 | 13F | EverSource Wealth Advisors, LLC | 1.744 | 0,00 | 220 | -4,35 | ||||
| 2026-02-12 | 13F | Mount Yale Investment Advisors, LLC | 3.510 | -22,81 | 443 | -26,29 | ||||
| 2026-02-10 | 13F | Argent Trust Co | 4.996 | 0,00 | 631 | -4,55 | ||||
| 2026-02-11 | 13F | Mascagni Wealth Management, Inc. | 1.748 | -6,12 | 221 | -10,57 | ||||
| 2025-11-10 | 13F | Kovitz Investment Group Partners, LLC | 0 | -100,00 | 0 | -100,00 | ||||
| 2026-02-12 | 13F | Federation des caisses Desjardins du Quebec | 2.690 | 63,03 | 340 | 55,50 | ||||
| 2025-09-26 | NP | PASIX - PACE Alternative Strategies Investments Class A | Short | -2.040 | 494,75 | -261 | 467,39 | |||
| 2026-02-02 | 13F | Fifth Third Bancorp | 125 | 16 | ||||||
| 2026-01-26 | 13F | Merit Financial Group, LLC | 0 | -100,00 | 0 | |||||
| 2025-11-14 | 13F | Jain Global LLC | 0 | -100,00 | 0 | -100,00 | ||||
| 2026-02-17 | 13F | D L Carlson Investment Group Inc | 2.039 | -2,39 | 257 | -6,88 | ||||
| 2025-09-26 | NP | OWACX - Old Westbury All Cap Core Fund | 54.048 | 0,00 | 6.926 | 15,76 | ||||
| 2026-01-12 | 13F | RoundAngle Advisors LLC | 3.479 | -17,15 | 439 | -20,90 | ||||
| 2026-02-13 | 13F | Baird Financial Group, Inc. | 2.432 | 52,38 | 307 | 46,19 | ||||
| 2026-02-17 | 13F | Warren Averett Asset Management, LLC | 2.661 | -0,93 | 336 | -5,63 | ||||
| 2026-01-15 | 13F | One + One Wealth Management, Llc | 19.325 | -2,71 | 2.440 | -7,09 | ||||
| 2026-02-17 | 13F | CastleKnight Management LP | Put | 0 | -100,00 | 0 | ||||
| 2026-02-13 | 13F | Kayne Anderson Capital Advisors Lp | Put | 0 | -100,00 | 0 | ||||
| 2026-02-17 | 13F | SummitTX Capital, L.P. | 50.520 | 624,92 | 6.379 | 592,51 | ||||
| 2026-02-11 | 13F | Nemes Rush Group LLC | 3 | 0,00 | 0 | |||||
| 2026-01-22 | 13F | Networth Advisors, LLC | 31 | 4 | ||||||
| 2026-02-11 | 13F | Empowered Funds, LLC | 10.173 | -3,43 | 1.284 | -7,76 | ||||
| 2026-02-13 | 13F | Wells Fargo & Company/mn | 383.331 | 241,90 | 48.399 | 226,56 | ||||
| 2025-11-14 | 13F | Sofos Investments, Inc. | 0 | -100,00 | 0 | -100,00 | ||||
| 2026-02-17 | 13F | Quadrature Capital Ltd | 0 | -100,00 | 0 | |||||
| 2026-02-17 | 13F | DV Trading LLC | 745 | 94 | ||||||
| 2026-02-11 | 13F | Mirae Asset Securities (usa) Inc. | 650.000 | 0,00 | 82.069 | -4,49 | ||||
| 2026-02-13 | 13F | Integrated Wealth Concepts LLC | 0 | -100,00 | 0 | |||||
| 2026-02-17 | 13F | IHT Wealth Management, LLC | 2.322 | 2,38 | 293 | -2,01 | ||||
| 2026-01-26 | 13F | Nations Financial Group Inc, /ia/ /adv | 2.644 | -2,40 | 334 | -6,98 | ||||
| 2026-02-13 | 13F | Walleye Trading LLC | 0 | -100,00 | 0 | -100,00 | ||||
| 2026-02-17 | 13F | Captrust Financial Advisors | 4.294 | -0,19 | 542 | -4,58 | ||||
| 2026-02-12 | 13F | Principal Securities, Inc. | 7.783 | -14,11 | 983 | -17,96 | ||||
| 2026-02-17 | 13F | LMR Partners LLP | Call | 160.000 | 0,00 | 20.202 | -4,50 | |||
| 2026-02-17 | 13F | LMR Partners LLP | Put | 26.800 | 0,00 | 3.384 | -4,49 | |||
| 2026-02-13 | 13F | Flow Traders U.s. Llc | 3.584 | 0 | ||||||
| 2026-02-05 | 13F | Cambridge Investment Research Advisors, Inc. | 17.116 | -7,67 | 2 | 0,00 | ||||
| 2026-01-28 | 13F | Geneos Wealth Management Inc. | 226 | 0,00 | 29 | -3,45 | ||||
| 2025-10-28 | 13F | Octavia Wealth Advisors, LLC | 0 | -100,00 | 0 | -100,00 | ||||
| 2026-02-13 | 13F | Maven Securities LTD | 33.886 | 4.281 | ||||||
| 2026-02-17 | 13F | Tudor Investment Corp Et Al | 25.397 | -71,01 | 3.207 | -72,32 | ||||
| 2026-02-13 | 13F | Satovsky Asset Management Llc | 60.980 | 2,30 | 7.699 | -2,30 | ||||
| 2026-02-17 | 13F | Tudor Investment Corp Et Al | Call | 722.800 | 2.309,33 | 91.261 | 2.201,06 | |||
| 2026-02-12 | 13F | Scotia Capital Inc. | 5.526 | -4,18 | 698 | -8,53 | ||||
| 2026-02-17 | 13F | Tudor Investment Corp Et Al | Put | 574.000 | 446,67 | 72.473 | 422,10 | |||
| 2025-11-07 | 13F | Amica Retiree Medical Trust | 1.276 | -29,27 | 0 | |||||
| 2026-02-17 | 13F | Quantitative Investment Management, LLC | 0 | -100,00 | 0 | |||||
| 2026-01-21 | 13F | Y.D. More Investments Ltd | 6.000 | 0,00 | 758 | -4,54 | ||||
| 2025-11-14 | 13F | Hbk Investments L P | Call | 0 | -100,00 | 0 | -100,00 | |||
| 2026-01-09 | 13F | SG Americas Securities, LLC | 37.904 | -85,05 | 5 | -87,88 | ||||
| 2026-02-13 | 13F | National Bank Of Canada /fi/ | 392.197 | 536,60 | 49.518 | 508,03 | ||||
| 2026-02-13 | 13F | Paragon Capital Management LLC | 5.772 | -10,01 | 729 | -14,05 | ||||
| 2025-11-14 | 13F | York Capital Management Global Advisors, LLC | Put | 150.000 | 0,00 | 19.830 | 5,09 | |||
| 2026-01-26 | 13F | Massachusetts Wealth Management | 0 | -100,00 | 0 | |||||
| 2026-02-13 | 13F | Y-Intercept (Hong Kong) Ltd | 0 | -100,00 | 0 | |||||
| 2026-02-10 | 13F | Murphy & Mullick Capital Management Corp | 10 | 0,00 | 1 | 0,00 | ||||
| 2026-01-22 | 13F | Mh & Associates Securities Management Corp /adv | 5.301 | 669 | ||||||
| 2026-02-12 | 13F | Laurel Oak Wealth Management, Llc | 4.805 | 607 | ||||||
| 2026-02-13 | 13F | Ubs Oconnor Llc | Call | 0 | -100,00 | 0 | ||||
| 2026-02-03 | 13F | Grimes & Company, Inc. | 3.093 | 3,10 | 391 | -1,52 | ||||
| 2026-02-13 | 13F | Glen Eagle Advisors, LLC | 1.907 | -14,14 | 241 | -18,09 | ||||
| 2026-01-23 | 13F | Steigerwald, Gordon & Koch Inc. | 1 | 0,00 | 0 | |||||
| 2026-02-17 | 13F | Man Group plc | 0 | -100,00 | 0 | |||||
| 2026-02-17 | 13F | Yaupon Capital Management LP | Call | 0 | -100,00 | 0 | ||||
| 2025-11-14 | 13F | Boothbay Fund Management, Llc | Put | 0 | -100,00 | 0 | -100,00 | |||
| 2026-02-13 | 13F | Ausdal Financial Partners, Inc. | 3.759 | -55,80 | 475 | -57,83 | ||||
| 2026-02-17 | 13F | Mercer Global Advisors Inc /adv | 12.631 | -0,29 | 1.595 | -4,78 | ||||
| 2026-02-13 | 13F | Luminist Capital LLC | 74 | 0,00 | 9 | 0,00 | ||||
| 2026-01-30 | 13F | Carrera Capital Advisors | 18.417 | 16,54 | 2.325 | 11,30 | ||||
| 2025-11-14 | 13F | ExodusPoint Capital Management, LP | 87.609 | 19,30 | 11.582 | 128.577,78 | ||||
| 2026-02-12 | 13F | Renaissance Technologies Llc | 0 | -100,00 | 0 | |||||
| 2026-02-17 | 13F | Mirabella Financial Services Llp | Call | 200.000 | 25.252 | |||||
| 2026-01-14 | 13F | ORG Wealth Partners, LLC | 9.383 | -18,94 | 1.188 | -22,57 | ||||
| 2026-01-20 | 13F | Signaturefd, Llc | 713 | 0,00 | 90 | -4,26 | ||||
| 2026-02-10 | 13F | Bank of New York Mellon Corp | 6.166 | 778 | ||||||
| 2025-10-09 | 13F | Secure Asset Management, LLC | 0 | -100,00 | 0 | |||||
| 2025-11-24 | 13F | CIBC Private Wealth Group, LLC | 0 | -100,00 | 0 | -100,00 | ||||
| 2026-01-30 | 13F | Kiker Wealth Management, LLC | 0 | -100,00 | 0 | |||||
| 2026-01-26 | 13F | BCS Private Wealth Management, Inc. | 2.000 | 253 | ||||||
| 2026-02-20 | 13F | Sunbelt Securities, Inc. | 1.374 | 0,66 | 174 | -3,89 | ||||
| 2026-02-06 | 13F | Kingdom Financial Group LLC. | 1 | 0 | ||||||
| 2026-02-17 | 13F | Advisory Services Network, LLC | 0 | -100,00 | 0 | |||||
| 2026-02-17 | 13F | Citadel Advisors Llc | 414.674 | -45,80 | 52.357 | -48,23 | ||||
| 2026-02-17 | 13F | Citadel Advisors Llc | Call | 722.300 | 63,19 | 91.198 | 55,86 | |||
| 2026-02-18 | 13F | Mackenzie Financial Corp | 5.500 | -5,17 | 699 | -8,75 | ||||
| 2026-02-05 | 13F | Bessemer Group Inc | 491.415 | -2,81 | 62 | -6,06 | ||||
| 2026-02-17 | 13F | Elliott Investment Management L.P. | Put | 2.398.400 | -0,07 | 302.822 | -4,56 | |||
| 2025-11-14 | 13F | Prairie Wealth Advisors, Inc. | 0 | -100,00 | 0 | |||||
| 2026-02-17 | 13F | Discovery Capital Management, Llc / Ct | 3.215 | 406 | ||||||
| 2026-01-28 | 13F | N.E.W. Advisory Services LLC | 28 | 0,00 | 4 | 0,00 | ||||
| 2026-01-21 | 13F | Flagship Harbor Advisors, Llc | 25 | 3 | ||||||
| 2026-02-03 | 13F | Cresta Advisors, Ltd. | 2.100 | 0,00 | 265 | -4,33 | ||||
| 2026-01-30 | 13F | Wealthfront Advisers Llc | 15.716 | 1,36 | 1.984 | -3,17 | ||||
| 2026-02-13 | 13F | SPX Equities Gestao de Recursos Ltda | 15.000 | 7,14 | 1.894 | 2,32 | ||||
| 2026-02-17 | 13F | Bank Of America Corp /de/ | 4.042.864 | -7,52 | 510.452 | -11,67 | ||||
| 2026-02-17 | 13F | Citadel Advisors Llc | Put | 1.525.800 | 14,16 | 192.648 | 9,03 | |||
| 2026-02-14 | 13F | Rockefeller Capital Management L.P. | 7.069 | -1,94 | 893 | -6,40 | ||||
| 2026-02-10 | 13F | Goldman Sachs Group Inc | Put | 2.325.800 | 2.531,00 | 293.656 | 2.412,88 | |||
| 2026-02-11 | 13F | Parallel Advisors, LLC | 2.441 | 0,00 | 308 | -4,35 | ||||
| 2026-01-21 | 13F | Sound Income Strategies, LLC | 74 | 89,74 | 10 | 80,00 | ||||
| 2026-02-10 | 13F | Goldman Sachs Group Inc | Call | 456.700 | 357,16 | 57.663 | 336,63 | |||
| 2026-02-17 | 13F | Brevan Howard Capital Management LP | 18.278 | 2.299 | ||||||
| 2026-02-17 | 13F | Graham Capital Management, L.P. | 31.150 | 35,73 | 3.933 | 29,64 | ||||
| 2026-01-23 | 13F | Rfg Holdings, Inc. | 8.841 | -8,69 | 1.116 | -12,81 | ||||
| 2026-01-27 | 13F | Atlantic Edge Private Wealth Management, LLC | 100 | 0,00 | 13 | -7,69 | ||||
| 2026-02-13 | 13F | Peak6 Llc | Call | 93.400 | -94,87 | 11.793 | -95,10 | |||
| 2026-02-13 | 13F | Missouri Trust & Investment Co | 30 | 0,00 | 4 | 0,00 | ||||
| 2026-02-10 | 13F | Savant Capital, LLC | 0 | -100,00 | 0 | |||||
| 2026-02-13 | 13F | Quarry LP | 11.945 | -41,15 | 1.508 | -43,79 | ||||
| 2026-02-13 | 13F | Quarry LP | Put | 1.500 | 189 | |||||
| 2026-01-23 | 13F | Gainplan LLC | 6.221 | 4,43 | 785 | -0,25 | ||||
| 2026-02-13 | 13F | Peak6 Llc | Put | 34.900 | 11,86 | 4.406 | 6,84 | |||
| 2026-02-10 | 13F | Goldman Sachs Group Inc | 3.760.778 | 5,37 | 474.836 | 0,64 | ||||
| 2026-02-17 | 13F | Sender Co & Partners, Inc. | 12.936 | 1.633 | ||||||
| 2025-11-13 | 13F | Eisler Capital Management Ltd. | Put | 52.800 | 0,00 | 7.036 | 5,87 | |||
| 2025-11-13 | 13F | Eisler Capital Management Ltd. | 9.622 | -36,41 | 1.282 | -32,67 | ||||
| 2026-02-19 | 13F | Mcguire Capital Advisors Inc | 25 | 3 | ||||||
| 2026-01-12 | 13F | Client 1st Advisory Group, Llc | 0 | -100,00 | 0 | |||||
| 2026-02-17 | 13F | Blair William & Co/il | 234 | 0,00 | 30 | -3,33 | ||||
| 2025-11-14 | 13F | Boothbay Fund Management, Llc | 0 | -100,00 | 0 | -100,00 | ||||
| 2026-01-08 | 13F | Wealth Enhancement Advisory Services, Llc | 4.728 | -1,95 | 594 | -7,92 | ||||
| 2025-11-12 | 13F | Creekmur Asset Management LLC | 0 | -100,00 | 0 | |||||
| 2026-01-26 | 13F | Cwm, Llc | 2.407 | 0,50 | 0 | |||||
| 2026-02-09 | 13F | Jefferies Financial Group Inc. | Call | 0 | -100,00 | 0 | -100,00 | |||
| 2025-11-14 | 13F | Toronto Dominion Bank | Put | 0 | -100,00 | 0 | -100,00 | |||
| 2026-02-17 | 13F | Argyle Capital Partners, LLC | 1.644 | -30,40 | 208 | -33,65 | ||||
| 2026-02-13 | 13F | MAI Capital Management | 1.702 | 37,37 | 215 | 31,29 | ||||
| 2026-01-15 | 13F | Brookstone Capital Management | 9.621 | -25,83 | 1.215 | -29,17 | ||||
| 2026-02-13 | 13F | Pathstone Holdings, LLC | 11.323 | -1,72 | 1.430 | -6,17 | ||||
| 2026-02-12 | 13F | BlackRock, Inc. | 17 | 0,00 | 2 | 0,00 | ||||
| 2026-01-27 | 13F | TD Waterhouse Canada Inc. | 49 | 0,00 | 6 | 0,00 | ||||
| 2026-01-29 | 13F | Nbc Securities, Inc. | 346 | -1,70 | 44 | -6,52 | ||||
| 2026-02-02 | 13F | Salzhauer Michael | 0 | -100,00 | 0 | |||||
| 2026-02-02 | 13F | Truist Financial Corp | 8.409 | -60,73 | 1.062 | -62,51 | ||||
| 2026-02-06 | 13F | GPS Wealth Strategies Group, LLC | 0 | -100,00 | 0 | |||||
| 2026-02-12 | 13F | IFC & Insurance Marketing, Inc. | 906 | 0 | ||||||
| 2026-02-04 | 13F | Anson Capital, Inc. | 12.515 | 13,20 | 1.580 | 8,15 | ||||
| 2026-02-12 | 13F | Rossby Financial, LCC | 2.999 | 13,26 | 379 | 6,18 | ||||
| 2025-09-26 | NP | OWTEX - Old Westbury Total Equity Fund | 4.714 | 13,18 | 604 | 31,02 | ||||
| 2025-11-14 | 13F | Earnest Partners Llc | 0 | -100,00 | 0 | -100,00 | ||||
| 2026-02-13 | 13F | Walleye Trading LLC | Call | 189.600 | 10,94 | 23.939 | 5,96 | |||
| 2025-11-14 | 13F | Sourcerock Group LLC | 0 | -100,00 | 0 | -100,00 | ||||
| 2026-02-13 | 13F | Walleye Trading LLC | Put | 290.900 | -4,43 | 36.729 | -8,73 | |||
| 2026-01-26 | 13F | Harbor Asset Planning, Inc. | 4 | 0,00 | 1 |