Grundlæggende statistik
| Institutionelle ejere | 400 total, 398 long only, 0 short only, 2 long/short - change of 1,26% MRQ |
| Gennemsnitlig porteføljeallokering | 0.1193 % - change of -10,49% MRQ |
| Institutionelle aktier (lange) | 6.181.772 (ex 13D/G) - change of -0,62MM shares -9,09% MRQ |
| Institutionel værdi (lang) | $ 1.254.416 USD ($1000) |
Institutionelt ejerskab og aktionærer
Vanguard World Fund - Vanguard Materials ETF (US:VAW) har 400 institutionelle ejere og aktionærer, der har indsendt 13D/G- eller 13F-formularer til Securities Exchange Commission (SEC). Disse institutioner har i alt 6,181,772 aktier. Største aktionærer omfatter Bank Of America Corp /de/, Beacon Capital Management, Inc., Empower Advisory Group, LLC, LPL Financial LLC, Morgan Stanley, Envestnet Asset Management Inc, Wells Fargo & Company/mn, Raymond James Financial Inc, Green Harvest Asset Management LLC, and Cetera Investment Advisers .
Vanguard World Fund - Vanguard Materials ETF (ARCA:VAW) institutionel ejerskabsstruktur viser aktuelle positioner i virksomheden efter institutioner og fonde, samt seneste ændringer i positionsstørrelse. Større aktionærer kan omfatte individuelle investorer, investeringsforeninger, hedgefonde eller institutioner. Skema 13D angiver, at investoren besidder (eller besidder) mere end 5 % af virksomheden og har til hensigt (eller har til hensigt at) aktivt at forfølge en ændring i forretningsstrategi. Skema 13G indikerer en passiv investering på over 5%.
The share price as of April 14, 2026 is 236,58 / share. Previously, on April 15, 2025, the share price was 178,55 / share. This represents an increase of 32,50% over that period.

Fondens stemningsscore
Fund Sentiment Score (fka Ownership Accumulation Score) finder de aktier, der bliver mest købt af fonde. Det er resultatet af en sofistikeret, multi-faktor kvantitativ model, der identificerer virksomheder med de højeste niveauer af institutionel akkumulering. Scoringsmodellen bruger en kombination af den samlede stigning i oplyste ejere, ændringerne i porteføljeallokeringer i disse ejere og andre målinger. Tallet går fra 0 til 100, hvor højere tal indikerer et højere niveau af akkumulering for sine jævnaldrende, og 50 er gennemsnittet.
Opdateringsfrekvens: Dagligt
Se Ownership Explorer, som giver en liste over højest rangerende virksomheder.
AI+ Ask Fintel’s AI assistant about Vanguard World Fund - Vanguard Materials ETF.
Select a question to share a public post with an AI-crafted answer.
Thinking of good questions…
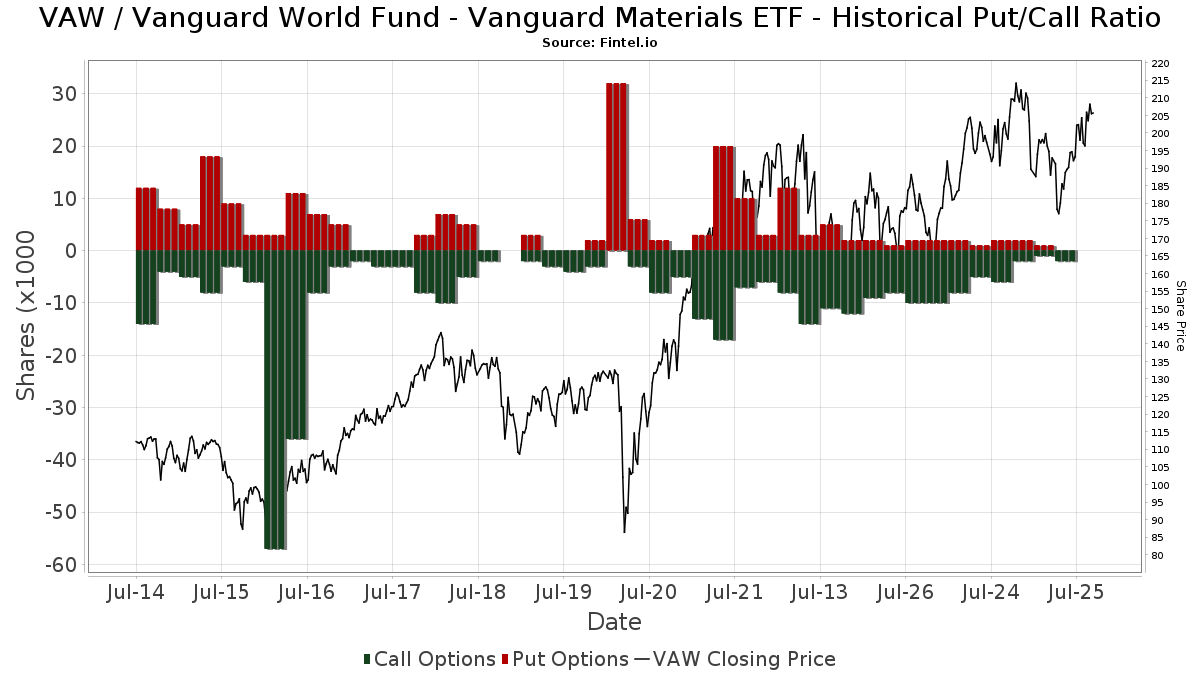
Institutionel Put/Call-forhold
Ud over at indberette standardaktie- og gældsudstedelser skal institutter med mere end 100 mill. aktiver under forvaltning også oplyse deres put- og call-optionsbeholdninger. Da salgsoptioner generelt indikerer negativ stemning, og købsoptioner indikerer positiv stemning, kan vi få en fornemmelse af den overordnede institutionelle stemning ved at plotte forholdet mellem put og kald. Diagrammet til højre viser det historiske put/call-forhold for dette instrument.
Brug af Put/Call Ratio som en indikator for investorernes stemning overvinder en af de vigtigste mangler ved at bruge totalt institutionelt ejerskab, som er, at en betydelig mængde af aktiver under forvaltning investeres passivt for at spore indekser. Passivt forvaltede fonde køber typisk ikke optioner, så indikatoren for put/call-forholdet følger mere nøje følelsen af aktivt forvaltede fonde.
13F og NPORT arkivering
Detaljer om 13F-arkivering er gratis. Detaljer om NP-ansøgninger kræver et premium-medlemskab. Grønne rækker angiver nye positioner. Røde rækker angiver lukkede positioner. Klik på linket ikon for at se den fulde transaktionshistorik.
Opgrader
for at låse premium-data op og eksportere til Excel ![]() .
.
| Fil dato | Kilde | Investor | Type | Gennemsnitlig pris (Øst) |
Aktier | Δ Aktier (%) |
Rapporteret Værdi ($1000) |
Δ Værdi (%) |
Port Alloc (%) |
|
|---|---|---|---|---|---|---|---|---|---|---|
| 2026-01-23 | 13F | Avion Wealth | 52 | 0,00 | 0 | |||||
| 2026-02-23 | 13F | Wealth Preservation Advisors, LLC | 224 | 0,00 | 46 | 2,22 | ||||
| 2026-01-05 | 13F | Park National Corp /oh/ | 25.498 | -30,29 | 5.292 | -29,37 | ||||
| 2026-01-29 | 13F | D.a. Davidson & Co. | 6.292 | 0,32 | 1.306 | 1,56 | ||||
| 2026-02-05 | 13F | AlphaCore Capital LLC | 6.045 | -0,76 | 1.255 | 0,56 | ||||
| 2026-02-09 | 13F | Huntington National Bank | 173 | -9,95 | ||||||
| 2026-02-05 | 13F | Mission Wealth Management, Lp | 1.235 | 0,00 | 256 | 1,19 | ||||
| 2026-04-07 | 13F | Farther Finance Advisors, LLC | 2.788 | -24,01 | 637 | -16,43 | ||||
| 2026-02-10 | 13F/A | Northwestern Mutual Wealth Management Co | 37.207 | -4,31 | 7.722 | -3,05 | ||||
| 2026-02-05 | 13F | Thrivent Financial For Lutherans | 4.258 | 1 | ||||||
| 2026-02-11 | 13F | Parallel Advisors, LLC | 2.536 | 1,04 | 526 | 2,33 | ||||
| 2026-02-18 | 13F | GWM Advisors LLC | 2.968 | -5,36 | 616 | -4,21 | ||||
| 2026-02-03 | 13F | RFG Advisory, LLC | 3.165 | 657 | ||||||
| 2026-01-15 | 13F | Founders Capital Management | 12 | 0,00 | 2 | 0,00 | ||||
| 2026-01-12 | 13F | Certified Advisory Corp | 20.060 | -3,54 | 4.163 | -2,28 | ||||
| 2026-01-23 | 13F | Axiom Financial Strategies, LLC | 5.848 | -1,18 | 1.214 | 0,08 | ||||
| 2026-01-29 | 13F | Kestra Private Wealth Services, Llc | 1.700 | 29,67 | 353 | 31,34 | ||||
| 2026-02-12 | 13F | Mason Investment Advisory Services, Inc. | 2.806 | 0,21 | 582 | 1,57 | ||||
| 2026-02-17 | 13F | Captrust Financial Advisors | 14.775 | 50,80 | 3.067 | 52,77 | ||||
| 2026-02-02 | 13F | KPP Advisory Services LLC | 1.739 | 0,58 | 361 | 1,69 | ||||
| 2026-02-17 | 13F | Citadel Advisors Llc | 0 | -100,00 | 0 | |||||
| 2026-01-20 | 13F | Guardian Wealth Management, LLC | 26.047 | 5.406 | ||||||
| 2026-02-12 | 13F | Conservest Capital Advisors, Inc. | 2.563 | 0,00 | 532 | 1,14 | ||||
| 2026-01-28 | 13F | Barrett & Company, Inc. | 54 | 0,00 | 11 | 0,00 | ||||
| 2026-01-29 | 13F | Advisors Capital Management, LLC | 3.334 | 3,09 | 692 | 4,53 | ||||
| 2026-02-02 | 13F | Truist Financial Corp | 10.659 | 5,32 | 2.212 | 6,71 | ||||
| 2026-02-17 | 13F | Ameriprise Financial Inc | 97.537 | 16,24 | 20.244 | 17,75 | ||||
| 2026-04-08 | 13F | NorthCrest Asset Manangement, LLC | 2.391 | -39,79 | 545 | -35,81 | ||||
| 2026-02-03 | 13F | Brandywine Oak Private Wealth Llc | 1.658 | 1,04 | 344 | 2,38 | ||||
| 2026-02-05 | 13F | TrueWealth Financial Partners | 0 | -100,00 | 0 | |||||
| 2026-01-29 | 13F | Concord Wealth Partners | 185 | 0,00 | 38 | 2,70 | ||||
| 2026-02-17 | 13F | Cetera Investment Advisers | 121.618 | 5,08 | 25.242 | 6,45 | ||||
| 2026-02-03 | 13F | McIlrath & Eck, LLC | 6 | 0,00 | 1 | 0,00 | ||||
| 2026-02-13 | 13F | Manufacturers Life Insurance Company, The | 0 | -100,00 | 0 | |||||
| 2026-01-12 | 13F | Founders Grove Wealth Partners, Llc | 6.477 | 0,57 | 1.344 | 1,90 | ||||
| 2026-02-17 | 13F | Gladstone Institutional Advisory LLC | 1.961 | -2,00 | 407 | -0,49 | ||||
| 2026-01-28 | 13F | CAPROCK Group, Inc. | 1.193 | 0,00 | 248 | -0,40 | ||||
| 2026-02-03 | 13F | Retirement Planning Group | 1.967 | -4,42 | 408 | -3,09 | ||||
| 2026-01-26 | 13F | RBA Wealth Management, LLC | 1.187 | 3,85 | 246 | 5,13 | ||||
| 2026-02-03 | 13F | Winch Advisory Services, LLC | 1.809 | 0,39 | 376 | 1,63 | ||||
| 2026-01-30 | 13F | Bogart Wealth, LLC | 218 | 0,00 | 45 | 2,27 | ||||
| 2026-04-14 | 13F | Joule Financial, LLC | 3.818 | 0,37 | 861 | 9,00 | ||||
| 2026-02-02 | 13F | Breakwater Investment Management | 65 | 0,00 | 13 | 0,00 | ||||
| 2026-04-09 | 13F | Peterson Wealth Advisors, LLC | 1.623 | 0,31 | 366 | 8,96 | ||||
| 2026-02-04 | 13F | Fourth Dimension Wealth, LLC | 204 | 0,00 | 42 | 2,44 | ||||
| 2026-02-18 | 13F | Hershey Financial Advisers, LLC | 8.292 | -3,47 | 1.721 | -2,16 | ||||
| 2025-11-14 | 13F | Full Sail Capital, LLC | 17.107 | -12,02 | 3.505 | -7,50 | ||||
| 2026-01-23 | 13F | First PREMIER Bank | 0 | -100,00 | 0 | |||||
| 2026-02-10 | 13F | Bnp Paribas Arbitrage, Sa | 0 | -100,00 | 0 | |||||
| 2026-02-17 | 13F | Strive Financial Group ,LLC | 254 | 53 | ||||||
| 2026-02-06 | 13F | Evoke Wealth, Llc | 2.010 | 27,78 | 417 | 29,50 | ||||
| 2026-01-21 | 13F | Flagship Harbor Advisors, Llc | 6 | 1 | ||||||
| 2026-01-21 | 13F | Sound Income Strategies, LLC | 369 | 846,15 | 83 | 1.071,43 | ||||
| 2026-02-13 | 13F | Change Path, LLC | 1.006 | 209 | ||||||
| 2026-01-30 | 13F/A | M&t Bank Corp | 14.987 | -7,09 | 3.110 | -5,84 | ||||
| 2026-02-18 | 13F | Caitlin John, LLC | 500 | 0,00 | 104 | 0,98 | ||||
| 2026-01-28 | 13F | Geneos Wealth Management Inc. | 89 | 0,00 | 18 | 0,00 | ||||
| 2026-02-13 | 13F | Pinnacle Wealth Planning Services, Inc. | 5 | 1 | ||||||
| 2026-02-17 | 13F | Centennial Bank/AR/ | 1 | -50,00 | 0 | |||||
| 2026-04-14 | 13F | Nova Wealth Management, Inc. | 35 | 0,00 | 8 | 0,00 | ||||
| 2026-02-17 | 13F | Two Sigma Securities, Llc | 0 | -100,00 | 0 | |||||
| 2025-11-20 | 13F | Asset Dedication, LLC | 0 | -100,00 | 0 | |||||
| 2026-01-22 | 13F | Comprehensive Money Management Services LLC | 5.218 | 0,02 | 1.083 | 1,31 | ||||
| 2026-02-13 | 13F | Financial Freedom, LLC | 2.146 | -6,94 | 445 | -5,72 | ||||
| 2026-04-07 | 13F | First Financial Corp /in/ | 2.949 | -10,64 | 665 | -2,92 | ||||
| 2026-01-28 | 13F | Salomon & Ludwin, LLC | 42 | 0,00 | 9 | 0,00 | ||||
| 2026-02-12 | 13F | Hrt Financial Lp | 1.818 | 0 | ||||||
| 2026-01-27 | 13F | Brighton Jones Llc | 0 | -100,00 | 0 | |||||
| 2026-01-21 | 13F | Paladin Advisory Group, LLC | 113 | -58,61 | 23 | -58,18 | ||||
| 2026-02-10 | 13F | One Capital Management, LLC | 1.100 | 0,00 | 228 | 1,33 | ||||
| 2026-01-21 | 13F | Newbridge Financial Services Group, Inc. | 0 | -100,00 | 0 | |||||
| 2026-02-17 | 13F | Fountainhead AM, LLC | 0 | -100,00 | 0 | |||||
| 2026-04-14 | 13F | Builder Investment Group Inc /adv | 4.853 | 0,00 | 1.094 | 8,54 | ||||
| 2026-01-16 | 13F | Ronald Blue Trust, Inc. | 46 | 155,56 | 10 | 200,00 | ||||
| 2026-04-13 | 13F | Buska Wealth Management, LLC | 9.118 | -27,07 | 2.055 | -20,82 | ||||
| 2025-11-07 | 13F | Beacon Capital Management, LLC | 0 | -100,00 | 0 | |||||
| 2026-01-12 | 13F | Sentinel Pension Advisors Inc | 6.202 | -0,64 | 1.287 | 0,70 | ||||
| 2025-11-04 | 13F | Guerra Advisors Inc | 6 | 1 | ||||||
| 2026-01-26 | 13F | Trinity Legacy Partners, LLC | 2.849 | 1,21 | 591 | 7,65 | ||||
| 2026-02-11 | 13F | Tiaa Trust, National Association | 2.033 | -0,88 | 422 | 0,24 | ||||
| 2026-02-06 | 13F | GPS Wealth Strategies Group, LLC | 0 | -100,00 | 0 | |||||
| 2026-01-21 | 13F | Westfuller Advisors, LLC | 14 | 0,00 | 3 | 0,00 | ||||
| 2026-02-05 | 13F | Avantax Planning Partners, Inc. | 1.019 | 211 | ||||||
| 2026-02-17 | 13F | Blair William & Co/il | 2.319 | -0,13 | 481 | 1,26 | ||||
| 2026-04-08 | 13F | Miracle Mile Advisors, LLC | 1.145 | 0,09 | 258 | 8,86 | ||||
| 2026-02-17 | 13F | Mercer Global Advisors Inc /adv | 19.481 | -19,65 | 4.043 | -18,59 | ||||
| 2026-02-19 | 13F/A | Axxcess Wealth Management, Llc | 3.494 | -5,00 | 725 | -3,72 | ||||
| 2026-01-20 | 13F | Signaturefd, Llc | 0 | -100,00 | 0 | |||||
| 2026-02-17 | 13F | Glenmede Trust Co Na | 437 | -4,59 | 91 | 4,65 | ||||
| 2026-02-17 | 13F | Fmr Llc | 6.685 | 23,02 | 1.388 | 24,62 | ||||
| 2026-01-27 | 13F | TD Waterhouse Canada Inc. | 1.486 | -13,25 | 308 | -11,49 | ||||
| 2026-02-05 | 13F | Idaho Trust Bank | 0 | -100,00 | 0 | |||||
| 2026-02-17 | 13F | Snowden Capital Advisors LLC | 1.193 | 12,65 | 248 | 14,35 | ||||
| 2026-01-05 | 13F | Union Bancaire Privee, UBP SA | 1.000 | 0,00 | 178 | 3,49 | ||||
| 2026-02-06 | 13F | Covestor Ltd | 1 | 0,00 | 0 | |||||
| 2026-02-13 | 13F | National Bank Of Canada /fi/ | 20 | -99,75 | 4 | -99,76 | ||||
| 2026-02-04 | 13F | Dogwood Wealth Management LLC | 29 | 0,00 | 6 | 20,00 | ||||
| 2026-01-27 | 13F | Silver Coast Investments LLC | 16.557 | 0,73 | 3.436 | 2,05 | ||||
| 2026-02-11 | 13F | Jpmorgan Chase & Co | 56.252 | -2,11 | 11.675 | -0,82 | ||||
| 2026-01-28 | 13F | Cranbrook Wealth Management, LLC | 1.874 | -8,45 | 389 | -7,16 | ||||
| 2026-02-12 | 13F | Richmond Brothers, Inc. | 0 | -100,00 | 0 | |||||
| 2026-04-09 | 13F | Praetorian Wealth Management, Inc. | 2.334 | -0,17 | 548 | 12,78 | ||||
| 2026-01-27 | 13F | Northstar Asset Management Llc | 1.185 | 0,00 | 246 | 1,24 | ||||
| 2025-11-14 | 13F | Eqis Capital Management, Inc. | 0 | -100,00 | 0 | |||||
| 2025-11-03 | 13F | Bank of New York Mellon Corp | 0 | -100,00 | 0 | -100,00 | ||||
| 2026-01-21 | 13F | Fulton Breakefield Broenniman Llc | 1.025 | 0,00 | 213 | 1,44 | ||||
| 2026-01-30 | 13F | Kohmann Bosshard Financial Services, LLC | 47 | 10 | ||||||
| 2026-02-13 | 13F | Progressive Investment Management Corp | 700 | 0,00 | 145 | 1,40 | ||||
| 2026-02-11 | 13F | Madden Advisory Services, Inc. | 1.582 | -3,18 | 328 | -1,80 | ||||
| 2026-04-13 | 13F | Creative Financial Designs Inc /adv | 322 | 278,82 | 73 | 323,53 | ||||
| 2026-01-21 | 13F | Capital Investment Advisory Services, LLC | 489 | 0,62 | 101 | 2,02 | ||||
| 2026-04-13 | 13F | Gill Capital Partners, Llc | 17 | 4 | ||||||
| 2026-02-06 | 13F | New Millennium Group LLC | 163 | -5,23 | 34 | -5,71 | ||||
| 2026-01-23 | 13F | Westside Investment Management, Inc. | 520 | 0,19 | 108 | 0,94 | ||||
| 2026-01-22 | 13F | City Holding Co | 863 | 179 | ||||||
| 2026-02-17 | 13F | Hilltop Holdings Inc. | 2.193 | -5,19 | 455 | -3,81 | ||||
| 2026-02-10 | 13F | Foundations Investment Advisors, LLC | 19.300 | 5,61 | 4.006 | 7,00 | ||||
| 2026-02-10 | 13F | Heritage Trust Co | 1.766 | -7,00 | 367 | -5,91 | ||||
| 2026-01-15 | 13F | Polianta Ltd | 44.400 | 9 | ||||||
| 2026-02-17 | 13F | Cape Investment Advisory, Inc. | 341 | 95,98 | 71 | 100,00 | ||||
| 2026-02-13 | 13F | Centaurus Financial, Inc. | 7.177 | 0,22 | 1 | 0,00 | ||||
| 2026-04-13 | 13F | Bnc Wealth Management, Llc | 1.062 | 0,00 | 239 | 8,64 | ||||
| 2026-02-10 | 13F | Essex Financial Services, Inc. | 7.874 | 0,31 | 1.634 | 1,62 | ||||
| 2026-04-14 | 13F | Wealthcare Advisory Partners LLC | 23.816 | 3,76 | 5.367 | 12,64 | ||||
| 2026-02-12 | 13F | Wedbush Securities Inc | 2.344 | 2,99 | 0 | |||||
| 2026-01-02 | 13F | Boltwood Capital Management | 0 | -100,00 | 0 | |||||
| 2026-02-13 | 13F | Aptus Capital Advisors, LLC | 111 | 15,62 | 23 | 21,05 | ||||
| 2026-02-12 | 13F | Commonwealth Equity Services, Llc | 24.667 | -5,77 | 5.120 | 102.280,00 | ||||
| 2026-01-13 | 13F | Parsons Capital Management Inc/ri | 14.190 | -0,13 | 2.945 | 1,20 | ||||
| 2026-01-16 | 13F | Stephen J. Garry & Associates, Llc | 2.686 | -1,10 | 558 | 0,18 | ||||
| 2026-02-18 | 13F | EP Wealth Advisors, Inc. | 0 | -100,00 | 0 | |||||
| 2026-02-06 | 13F | Larson Financial Group LLC | 293 | 2.341,67 | 61 | 2.900,00 | ||||
| 2026-04-13 | 13F | IFP Advisors, Inc | 16 | 0,00 | 4 | 0,00 | ||||
| 2026-02-13 | 13F | Integrated Wealth Concepts LLC | 2.251 | 3,68 | 467 | 5,18 | ||||
| 2026-02-06 | 13F | EverSource Wealth Advisors, LLC | 536 | 0,00 | 111 | 1,83 | ||||
| 2026-01-26 | 13F | Main Street Group, LTD | 0 | -100,00 | 0 | |||||
| 2026-01-23 | 13F | Clear Creek Financial Management, LLC | 29.193 | 26,98 | 6.059 | 28,67 | ||||
| 2026-02-04 | 13F | Shade Tree Advisors LLC | 1.059 | 220 | ||||||
| 2026-02-11 | 13F | O'shaughnessy Asset Management, Llc | 4.063 | 13,65 | 843 | 15,16 | ||||
| 2026-02-12 | 13F | Brinker Capital Investments, LLC | 5.997 | -3,18 | 1.245 | -1,89 | ||||
| 2026-02-13 | 13F | Mml Investors Services, Llc | 19.614 | -8,87 | 4.071 | -7,67 | ||||
| 2026-02-17 | 13F | Aqr Capital Management Llc | 1.785 | 21,10 | 370 | 22,92 | ||||
| 2026-02-11 | 13F | Franklin Resources Inc | 105 | 22 | ||||||
| 2026-01-29 | 13F | Concurrent Investment Advisors, LLC | 4.492 | -2,60 | 932 | -1,27 | ||||
| 2026-01-26 | 13F | Independent Wealth Network Inc. | 1.112 | 1,37 | 231 | 2,68 | ||||
| 2026-04-03 | 13F | Coastline Trust Co | 325 | 0,00 | 73 | 8,96 | ||||
| 2026-02-17 | 13F | Tower Research Capital LLC (TRC) | 149 | -25,50 | 31 | -25,00 | ||||
| 2026-02-06 | 13F | One Charles Private Wealth Services, LLC | 2.324 | -0,21 | 482 | 1,05 | ||||
| 2026-02-12 | 13F | Tripletail Wealth Management, LLC | 393 | 0,00 | 82 | 1,25 | ||||
| 2026-02-05 | 13F | Cambridge Investment Research Advisors, Inc. | 18.302 | -1,71 | 4 | 0,00 | ||||
| 2026-02-03 | 13F | Christine Messmer Pc | 2.103 | 437 | ||||||
| 2026-02-17 | 13F | Creative Planning | 25.616 | -1,58 | 5.317 | -0,28 | ||||
| 2026-02-10 | 13F | Ritter Daniher Financial Advisory LLC / DE | 24 | 5 | ||||||
| 2026-02-17 | 13F | Qube Research & Technologies Ltd | 0 | -100,00 | 0 | |||||
| 2025-11-04 | 13F | Independent Advisor Alliance | 0 | -100,00 | 0 | |||||
| 2026-02-04 | 13F | Nwam Llc | 0 | -100,00 | 0 | -100,00 | ||||
| 2025-11-13 | 13F | Glenmede Investment Management, LP | 437 | 0,00 | 90 | 4,71 | ||||
| 2026-01-20 | 13F | SOA Wealth Advisors, LLC. | 28 | 0,00 | 6 | 0,00 | ||||
| 2026-02-03 | 13F | Koshinski Asset Management, Inc. | 1.447 | -0,28 | 300 | 1,01 | ||||
| 2026-01-29 | 13F | Sanctuary Advisors, LLC | 2.206 | 12,04 | 458 | 13,40 | ||||
| 2026-02-12 | 13F | BlackRock, Inc. | 8.019 | 14,17 | 1.664 | 15,72 | ||||
| 2026-01-22 | 13F | Evermay Wealth Management Llc | 1.315 | 0,00 | 273 | 1,12 | ||||
| 2026-01-21 | 13F | Modera Wealth Management, LLC | 5.233 | -4,72 | 1.086 | -3,47 | ||||
| 2026-01-28 | 13F | HB Wealth Management, LLC | 1.560 | 0,13 | 324 | 1,25 | ||||
| 2026-01-20 | 13F | Stratos Wealth Partners, LTD. | 3.997 | 0,03 | 830 | 1,34 | ||||
| 2026-02-09 | 13F | CBIZ Investment Advisory Services, LLC | 25 | 5 | ||||||
| 2026-02-12 | 13F | Wealthspire Advisors, LLC | 0 | -100,00 | 0 | |||||
| 2026-01-26 | 13F | Whittier Trust Co | 2.744 | 0,07 | 599 | 6,39 | ||||
| 2026-02-02 | 13F | Montag A & Associates Inc | 245 | 0,00 | 51 | 0,00 | ||||
| 2026-04-07 | 13F | Pathway Financial Advisors LLC | 7.240 | 0,00 | 1.651 | 4,36 | ||||
| 2026-02-11 | 13F | SOUTH STATE Corp | 25 | 0,00 | 5 | 0,00 | ||||
| 2026-02-11 | 13F | Flagship Wealth Advisors, Llc | 602 | 0,00 | 125 | 0,81 | ||||
| 2026-04-07 | 13F | Comprehensive Financial Planning, Inc./PA | 5 | 0,00 | 1 | 0,00 | ||||
| 2026-01-14 | 13F | Woodward Diversified Capital, Llc | 5.163 | 1,18 | 1.072 | 2,49 | ||||
| 2026-01-06 | 13F | Unique Wealth, Llc | 986 | 0,00 | 205 | 1,49 | ||||
| 2026-02-17 | 13F | Strategic Investment Advisors / MI | 0 | -100,00 | 0 | |||||
| 2026-02-13 | 13F | Citigroup Inc | 3.210 | 13,27 | 666 | 14,83 | ||||
| 2026-02-12 | 13F | Front Row Advisors LLC | 125 | 0,00 | 26 | 0,00 | ||||
| 2026-02-13 | 13F | Resources Management Corp /ct/ /adv | 23.534 | -3,35 | 5 | 0,00 | ||||
| 2026-03-27 | 13F | Fell Capital Management /adv | 11.695 | 2.427 | ||||||
| 2026-02-17 | 13F | Private Advisor Group, LLC | 12.793 | 0,57 | 2.655 | 1,92 | ||||
| 2026-01-23 | 13F | Assetmark, Inc | 25.702 | 610,20 | 5.335 | 619,84 | ||||
| 2026-02-09 | 13F | Putnam Fl Investment Management Co | 3.372 | 0,00 | 700 | 1,30 | ||||
| 2026-02-13 | 13F | SRS Capital Advisors, Inc. | 2.738 | 568 | ||||||
| 2026-04-07 | 13F | U.S. Capital Wealth Advisors, LLC | 2.507 | 9,67 | 565 | 18,99 | ||||
| 2026-02-13 | 13F | Wells Fargo & Company/mn | 239.852 | -3,13 | 49.781 | -1,86 | ||||
| 2026-01-27 | 13F | First Horizon Corp | 334 | 0,00 | 69 | 1,47 | ||||
| 2026-02-06 | 13F | BOK Financial Private Wealth, Inc. | 146 | 30 | ||||||
| 2026-02-17 | 13F | United Capital Financial Advisers, Llc | 4.945 | 15,89 | 1.026 | 17,39 | ||||
| 2026-02-13 | 13F | Wealth Alliance | 1.905 | 0,90 | 395 | 2,33 | ||||
| 2026-04-08 | 13F | Olistico Wealth, LLC | 25 | -65,75 | 6 | -66,67 | ||||
| 2026-01-22 | 13F | Maseco Llp | 6 | 1 | ||||||
| 2026-04-08 | 13F | Spinnaker Investment Group, LLC | 3.368 | 759 | ||||||
| 2026-01-20 | 13F | Aspiriant, Llc | 2.520 | 8,43 | 523 | 9,66 | ||||
| 2026-01-12 | 13F | Heartwood Wealth Advisors LLC | 0 | -100,00 | 0 | |||||
| 2026-02-06 | 13F | Csenge Advisory Group | 1.162 | 0,96 | 241 | 2,55 | ||||
| 2025-11-14 | 13F | Strategic Wealth Partners, Ltd. | 0 | -100,00 | 0 | |||||
| 2026-02-03 | 13F | Anfield Capital Management, LLC | 13 | 0,00 | 3 | 0,00 | ||||
| 2026-02-13 | 13F | MAI Capital Management | 465 | -16,06 | 96 | -15,04 | ||||
| 2026-02-17 | 13F | Citadel Advisors Llc | Put | 1.100 | 228 | |||||
| 2026-02-26 | 13F | Anchor Investment Management, LLC | 2.606 | 4,57 | 541 | 5,88 | ||||
| 2026-02-17 | 13F | Citadel Advisors Llc | Call | 1.600 | 33,33 | 332 | 35,51 | |||
| 2026-02-09 | 13F | Key FInancial Inc | 361 | 0,00 | 75 | 1,37 | ||||
| 2026-02-17 | 13F | Coppell Advisory Solutions LLC | 1.821 | 11,79 | 382 | 15,45 | ||||
| 2026-01-27 | 13F | Elevate Wealth Advisory, Inc | 24 | 0,00 | 5 | 0,00 | ||||
| 2026-01-30 | 13F | Sage Rhino Capital Llc | 10.225 | -0,21 | 2.122 | 1,10 | ||||
| 2026-01-30 | 13F | Turning Point Benefit Group, Inc. | 13 | 3 | ||||||
| 2026-01-26 | 13F | AE Wealth Management LLC | 400 | 0,00 | 83 | 2,47 | ||||
| 2026-02-10 | 13F | Novak & Powell Financial Services, Inc. | 2.977 | 0,44 | 618 | 1,65 | ||||
| 2025-10-31 | 13F | First Command Advisory Services, Inc. | 0 | -100,00 | 0 | -100,00 | ||||
| 2026-01-26 | 13F | Merit Financial Group, LLC | 9.524 | 0,39 | 1.977 | 1,70 | ||||
| 2026-04-02 | 13F | Noble Wealth Management PBC | 103 | -13,45 | 23 | -4,17 | ||||
| 2026-02-11 | 13F | LPL Financial LLC | 295.587 | 2,48 | 61.349 | 3,82 | ||||
| 2026-01-26 | 13F | Whittier Trust Co Of Nevada Inc | 117 | 0,00 | 26 | 4,17 | ||||
| 2026-02-04 | 13F | Boyd Watterson Asset Management Llc/oh | 42 | 0,00 | 9 | 0,00 | ||||
| 2026-02-11 | 13F | Cerity Partners LLC | 2.133 | 443 | ||||||
| 2026-04-13 | 13F | St Germain D J Co Inc | 40 | 0,00 | 9 | 12,50 | ||||
| 2026-02-06 | 13F | Wolff Financial Management Llc | 4.151 | 0,05 | 862 | 1,41 | ||||
| 2026-01-26 | 13F | Prairiewood Capital, LLC | 9.547 | 0,00 | 1.981 | 1,33 | ||||
| 2026-02-13 | 13F | Neuberger Berman Group LLC | 0 | -100,00 | 0 | |||||
| 2026-01-21 | 13F | Ameliora Wealth Management Ltd. | 51 | 0,00 | 11 | 0,00 | ||||
| 2025-11-14 | 13F | Guardian Wealth Advisors, Llc / Nc | 0 | -100,00 | 0 | |||||
| 2026-02-17 | 13F | Warren Averett Asset Management, LLC | 1.282 | 842,65 | 266 | 1.800,00 | ||||
| 2026-01-28 | 13F | Kanawha Capital Management Llc | 4.968 | -0,40 | 1.031 | 0,98 | ||||
| 2026-04-09 | 13F | Dorato Capital Management | 4.243 | 0,00 | 996 | 4,41 | ||||
| 2026-02-10 | 13F | Elm Partners Management LLC | 1.120 | -29,02 | 232 | -28,17 | ||||
| 2026-02-17 | 13F | Cdkv Holdings Llc | 581 | 121 | ||||||
| 2026-01-28 | 13F | O'ROURKE & COMPANY, Inc | 1.810 | 8,77 | 376 | 10,29 | ||||
| 2026-01-09 | 13F | 180 Wealth Advisors, Llc | 3.846 | 0,00 | 798 | 1,40 | ||||
| 2026-01-26 | 13F | McGuire Investment Group, LLC | 1.048 | -1,23 | 218 | 0,00 | ||||
| 2026-02-04 | 13F | Ground Swell Capital, LLC | 0 | -100,00 | 0 | |||||
| 2026-02-12 | 13F | Federation des caisses Desjardins du Quebec | 2 | 0,00 | 0 | |||||
| 2026-02-12 | 13F | Bank Of Montreal /can/ | 5.494 | 4,71 | 1.140 | 6,15 | ||||
| 2026-02-13 | 13F | Charles Schwab Investment Management Inc | 1.700 | -1,56 | 353 | -0,28 | ||||
| 2026-02-17 | 13F | Jones Financial Companies Lllp | 5.001 | 2,69 | 1.038 | 5,17 | ||||
| 2026-04-13 | 13F | Farrell Financial LLC | 7.354 | 0,99 | 1.657 | 9,66 | ||||
| 2026-01-27 | 13F | Lodestar Private Asset Management Llc | 1.026 | -0,29 | 213 | 0,95 | ||||
| 2026-02-02 | 13F | Benjamin Edwards Inc | 1.031 | 3,10 | 214 | 4,41 | ||||
| 2026-02-05 | 13F | Simmons Bank | 1.228 | 0,00 | 255 | 1,20 | ||||
| 2026-01-30 | 13F | Sigma Planning Corp | 22.404 | 3,34 | 4.650 | 4,71 | ||||
| 2026-02-09 | 13F | Keating Financial Advisory Services, Inc. | 11 | 2 | ||||||
| 2026-02-17 | 13F | Green Harvest Asset Management LLC | 162.844 | 11,02 | 33.798 | 12,48 | ||||
| 2026-02-13 | 13F | Ieq Capital, Llc | 1.098 | 0,27 | 228 | 1,34 | ||||
| 2026-02-13 | 13F | Banco Santander, S.A. | 27.924 | 0,00 | 5.796 | 1,31 | ||||
| 2026-02-17 | 13F | Signature Equity Partners, LLC | 71 | 15 | ||||||
| 2026-01-21 | 13F | SJS Investment Consulting Inc. | 5 | 1 | ||||||
| 2026-02-02 | 13F | Ashton Thomas Securities, Llc | 120 | 0,00 | 25 | 0,00 | ||||
| 2025-11-05 | 13F | Checchi Capital Advisers, LLC | 0 | -100,00 | 0 | |||||
| 2026-04-08 | 13F | Wealth Enhancement Advisory Services, Llc | 13.085 | -8,51 | 2.438 | -22,41 | ||||
| 2026-01-23 | 13F | Nbt Bank N A /ny | 299 | 1,01 | 46 | 2,22 | ||||
| 2025-11-12 | 13F | Simplex Trading, Llc | 0 | -100,00 | 0 | |||||
| 2026-02-13 | 13F | Colony Group, LLC | 2.895 | 33,53 | 601 | 35,97 | ||||
| 2026-03-05 | 13F | Bayban | 102 | 21 | ||||||
| 2026-01-22 | 13F | HHM Wealth Advisors, LLC | 25 | 0,00 | 5 | 0,00 | ||||
| 2026-01-27 | 13F | Smith, Salley & Associates | 1.000 | 0,00 | 208 | 1,47 | ||||
| 2026-04-03 | 13F | Global Wealth Strategies & Associates | 202 | 0,00 | 46 | 9,76 | ||||
| 2026-02-11 | 13F | Nemes Rush Group LLC | 11 | 0,00 | 2 | 0,00 | ||||
| 2026-02-13 | 13F | Morgan Stanley | 240.575 | -18,61 | 49.932 | -17,54 | ||||
| 2026-02-12 | 13F | Hollencrest Capital Management | 125 | 0,00 | 26 | 0,00 | ||||
| 2026-01-30 | 13F | Heritage Investment Group, Inc. | 1.700 | 0,00 | 353 | 1,15 | ||||
| 2026-01-16 | 13F | Birchcreek Wealth Management, LLC | 1.758 | -3,83 | 365 | -2,67 | ||||
| 2026-02-05 | 13F | Cornerstone Wealth Management, LLC | 2.821 | 35,17 | 585 | 37,00 | ||||
| 2025-11-13 | 13F | Brown Brothers Harriman & Co | 0 | -100,00 | 0 | |||||
| 2026-02-17 | 13F | Royal Bank Of Canada | 24.437 | 59,20 | 5.072 | 61,27 | ||||
| 2026-02-13 | 13F | Parkside Financial Bank & Trust | 130 | 333,33 | 27 | 333,33 | ||||
| 2026-04-13 | 13F | Foster Group, Inc. | 967 | 0,00 | 218 | 8,50 | ||||
| 2026-02-13 | 13F | Brown Advisory Inc | 3.831 | -18,16 | 795 | -17,01 | ||||
| 2026-02-10 | 13F | Lido Advisors, LLC | 69.327 | -2,03 | 14.336 | -1,11 | ||||
| 2025-10-30 | 13F | Twin Peaks Wealth Advisors, LLC | 0 | -100,00 | 0 | -100,00 | ||||
| 2026-02-04 | 13F | Ameritas Advisory Services, LLC | 106.700 | 7.904,50 | 22.146 | 8.011,72 | ||||
| 2026-02-17 | 13F | SageView Advisory Group, LLC | 6 | 1 | ||||||
| 2026-02-05 | 13F | Allworth Financial LP | 1.020 | 2,00 | 212 | 3,43 | ||||
| 2026-02-17 | 13F | Northern Trust Corp | 5.360 | 25,06 | 1.112 | 26,65 | ||||
| 2026-02-11 | 13F | Janney Montgomery Scott LLC | 8.843 | 1,94 | 2 | 0,00 | ||||
| 2026-01-27 | 13F | Institute for Wealth Management, LLC. | 3.620 | 11,38 | 751 | 12,93 | ||||
| 2026-02-14 | 13F | POM Investment Strategies, LLC | 11 | 2 | ||||||
| 2026-02-09 | 13F | Leavell Investment Management, Inc. | 1.991 | 0,50 | 413 | 1,98 | ||||
| 2026-02-09 | 13F | North Forty Two & Co. | 2.400 | -5,88 | 498 | -4,60 | ||||
| 2026-01-06 | 13F | Tucker Asset Management Llc | 0 | -100,00 | 0 | |||||
| 2026-04-10 | 13F | Waldron Private Wealth LLC | 1.266 | 0,40 | 285 | 9,20 | ||||
| 2026-02-03 | 13F | Strategic Wealth Advisors LLC | 300 | 0 | ||||||
| 2026-02-17 | 13F | Cresset Asset Management, LLC | 5.614 | 5,92 | 1.165 | 7,37 | ||||
| 2026-04-13 | 13F | Gibraltar Capital Management, Inc. | 16.217 | 0,00 | 3.654 | 8,59 | ||||
| 2026-01-22 | 13F | Yoder Wealth Management, Inc. | 1.935 | -9,07 | 402 | -7,82 | ||||
| 2026-02-12 | 13F | Compass Capital Corp /ma/ /adv | 0 | -100,00 | 0 | |||||
| 2026-01-27 | 13F | Bonfire Financial | 5.415 | 2,67 | 1.124 | 3,98 | ||||
| 2026-02-17 | 13F | Advisory Services Network, LLC | 1.377 | -0,58 | 286 | 0,71 | ||||
| 2026-02-03 | 13F | Strengthening Families & Communities, LLC | 43.884 | 2,97 | 9.108 | 4,16 | ||||
| 2026-02-13 | 13F | Golden State Wealth Management, LLC | 1.255 | -6,97 | 261 | -5,80 | ||||
| 2026-02-04 | 13F | Dynamic Wealth Strategies, LLC | 386 | 0,52 | 80 | 2,56 | ||||
| 2026-01-21 | 13F | BIP Wealth, LLC | 1.077 | 0,00 | 224 | 1,36 | ||||
| 2026-02-17 | 13F | Quantinno Capital Management LP | 12.673 | 4,64 | 2.630 | 6,01 | ||||
| 2026-02-13 | 13F | Kayne Anderson Rudnick Investment Management Llc | 515 | 0,00 | 107 | 0,95 | ||||
| 2026-02-10 | 13F | Swisher Financial Concepts, Inc. | 1.045 | -1,60 | 217 | -0,46 | ||||
| 2026-02-17 | 13F | Bank Of America Corp /de/ | 1.404.868 | -0,87 | 291.580 | 0,43 | ||||
| 2026-04-02 | 13F | Collective Family Office Llc | 1.295 | 0,00 | 292 | 8,58 | ||||
| 2026-01-26 | 13F | Phillips Financial Management, Llc | 4.128 | 0,00 | 857 | 1,30 | ||||
| 2026-04-15 | 13F | Exchange Traded Concepts, Llc | 30.340 | -1,09 | 6.837 | 7,38 | ||||
| 2026-01-29 | 13F | Simon Quick Advisors, Llc | 10.350 | -0,03 | 2.148 | 1,32 | ||||
| 2026-02-12 | 13F | Adviser Investments LLC | 1.605 | -1,23 | 333 | 0,30 | ||||
| 2026-04-07 | 13F | CoreCap Advisors, LLC | 51 | 82,14 | 11 | 120,00 | ||||
| 2026-02-09 | 13F | Choate Investment Advisors | 5.297 | 0,00 | 1.099 | 1,29 | ||||
| 2026-02-13 | 13F | Arkadios Wealth Advisors | 4.244 | 0,95 | 881 | 2,21 | ||||
| 2026-02-13 | 13F | Kestra Advisory Services, LLC | 0 | -100,00 | 0 | |||||
| 2026-02-09 | 13F | Hartland & Co., LLC | 3.214 | 6,64 | 667 | 8,10 | ||||
| 2026-04-06 | 13F | CX Institutional | 1.558 | -9,47 | 0 | |||||
| 2026-01-30 | 13F | Us Bancorp \de\ | 1.811 | 1,74 | 376 | 3,02 | ||||
| 2025-10-28 | 13F | JNBA Financial Advisors | 0 | -100,00 | 0 | |||||
| 2026-02-13 | 13F | Mariner, LLC | 14.860 | 0,50 | 3.084 | 1,85 | ||||
| 2026-01-27 | 13F | MontVue Capital Management, Inc. | 1.557 | 0,00 | 323 | 1,57 | ||||
| 2026-02-13 | 13F | Ubs Asset Management Americas Inc | 853 | 177 | ||||||
| 2026-02-17 | 13F | Vista Investment Management | 6.889 | -3,50 | 1.430 | -2,26 | ||||
| 2026-02-11 | 13F | Strategic Wealth Designers | 7.586 | -39,17 | 1.574 | -38,37 | ||||
| 2026-02-12 | 13F | Summit Financial, LLC | 3.211 | 0,22 | 666 | 1,52 | ||||
| 2026-01-30 | 13F | Narwhal Capital Management | 1.414 | -6,91 | 293 | -5,79 | ||||
| 2026-02-11 | 13F | Greykasell Wealth Strategies, Inc. | 131 | 0,00 | 27 | 3,85 | ||||
| 2025-11-12 | 13F | Tumwater Wealth Management, LLC | 0 | -100,00 | 0 | |||||
| 2026-02-11 | 13F | Monetary Management Group Inc | 45 | 9 | ||||||
| 2026-01-26 | 13F | PFG Investments, LLC | 979 | 0,10 | 203 | 1,50 | ||||
| 2026-02-11 | 13F | M Holdings Securities, Inc. | 25.838 | 5 | ||||||
| 2026-01-07 | 13F | CWA Asset Management Group, LLC | 1.291 | 2,06 | 268 | 3,09 | ||||
| 2026-01-22 | 13F | Curran Financial Partners, LLC | 4.317 | -2,62 | 896 | -1,43 | ||||
| 2026-04-14 | 13F | Prospera Financial Services Inc | 13.700 | 0,29 | 3.098 | 8,97 | ||||
| 2026-02-18 | 13F | Sierra Capital LLC | 10.398 | 0,00 | 2 | 0,00 | ||||
| 2026-04-06 | 13F | Versant Capital Management, Inc | 4.308 | 0,00 | 971 | 8,50 | ||||
| 2026-04-13 | 13F | Mather Group, Llc. | 2.238 | -4,28 | 504 | 3,92 | ||||
| 2026-01-27 | 13F | PFG Advisors | 1.218 | -6,16 | 253 | -4,91 | ||||
| 2026-02-04 | 13F | LRI Investments, LLC | 28.431 | 11,49 | 5.901 | 12,96 | ||||
| 2025-11-14 | 13F | NorthRock Partners, LLC | 0 | -100,00 | 0 | -100,00 | ||||
| 2026-02-17 | 13F | Equitable Holdings, Inc. | 1.852 | 1,48 | 384 | 2,95 | ||||
| 2026-02-17 | 13F | Cardiff Park Advisors, Llc | 511 | 0,00 | 106 | 1,92 | ||||
| 2026-02-13 | 13F | Barclays Plc | 0 | -100,00 | 0 | |||||
| 2026-02-11 | 13F | Hilton Head Capital Partners, LLC | 24 | 5 | ||||||
| 2025-11-07 | 13F | Smithfield Trust Co | 0 | -100,00 | 0 | |||||
| 2026-01-15 | 13F | Sage Capital Management, LLC | 3.767 | -6,36 | 783 | -5,10 | ||||
| 2026-01-27 | 13F | WealthCollab, LLC | 7 | 1 | ||||||
| 2026-01-23 | 13F | Financial Connections Group, Inc. | 25 | 0,00 | 0 | |||||
| 2026-01-26 | 13F | Valmark Advisers, Inc. | 3.930 | -1,50 | 816 | -0,24 | ||||
| 2026-02-02 | 13F | Sagace Wealth Management LLC | 9.918 | 0,23 | 2.058 | 1,53 | ||||
| 2026-02-09 | 13F | Blue Bell Private Wealth Management, Llc | 49 | 0,00 | 10 | 0,00 | ||||
| 2026-02-04 | 13F | ESG Planning | 4.830 | 18,24 | 1.002 | 19,86 | ||||
| 2026-02-06 | 13F | VSM Wealth Advisory, LLC | 1.526 | 1.326,17 | 317 | 1.404,76 | ||||
| 2026-01-05 | 13F | GAMMA Investing LLC | 0 | -100,00 | 0 | |||||
| 2026-01-16 | 13F | Crowley Wealth Management, Inc. | 0 | -100,00 | 0 | |||||
| 2026-02-10 | 13F | Goldman Sachs Group Inc | 12.900 | 1,78 | 2.677 | 3,12 | ||||
| 2026-02-17 | 13F | Modern Wealth Management, LLC | 0 | -100,00 | 0 | |||||
| 2026-02-17 | 13F | Susquehanna International Group, Llp | Call | 1.300 | -58,06 | 270 | -57,64 | |||
| 2026-02-19 | 13F | CI Private Wealth, LLC | 69.246 | 566,28 | 14.372 | 575,06 | ||||
| 2026-02-17 | 13F | Susquehanna International Group, Llp | 4.028 | -21,31 | 836 | -20,23 | ||||
| 2026-01-23 | 13F | Bellevue Asset Management, Llc | 301 | 0,00 | 63 | 1,64 | ||||
| 2026-02-17 | 13F | Susquehanna International Group, Llp | Put | 1.000 | 208 | |||||
| 2026-02-18 | 13F | Beacon Pointe Advisors, LLC | 2.164 | -0,51 | 449 | 0,90 | ||||
| 2026-02-06 | 13F | Pnc Financial Services Group, Inc. | 45.804 | -1,41 | 9.507 | -0,12 | ||||
| 2026-02-17 | 13F | Raymond James Financial Inc | 167.304 | 3,13 | 34.724 | 4,49 | ||||
| 2025-11-04 | 13F | Wsfs Capital Management, Llc | 0 | -100,00 | 0 | |||||
| 2026-02-13 | 13F | Ingalls & Snyder Llc | 1.475 | 0,00 | 0 | |||||
| 2026-02-06 | 13F | Private Wealth Advisors, LLC | 8.275 | 3,64 | 1.717 | 5,02 | ||||
| 2026-02-10 | 13F | CIBC World Markets Inc. | 7.396 | -0,51 | 1.535 | 0,85 | ||||
| 2026-02-13 | 13F | Johnson Investment Counsel Inc | 0 | -100,00 | 0 | |||||
| 2026-03-16 | 13F | John A. Wolfe & Associates, Inc. | 4.014 | 833 | ||||||
| 2026-01-30 | 13F | Wealthfront Advisers Llc | 3.336 | 6,79 | 692 | 8,29 | ||||
| 2026-02-12 | 13F | Colonial Trust Co / SC | 1.000 | 0,00 | 208 | 1,47 | ||||
| 2026-02-10 | 13F | Gw Henssler & Associates Ltd | 63.368 | -1,30 | 13.152 | -0,01 | ||||
| 2026-02-11 | 13F | Curio Wealth, Llc | 40 | 8 | ||||||
| 2026-02-17 | 13F | Wiley Bros.-aintree Capital, Llc | 2.557 | -5,26 | 531 | -3,99 | ||||
| 2026-02-13 | 13F | Chevy Chase Trust Holdings, Inc. | 4.537 | 942 | ||||||
| 2026-01-27 | 13F | Duncker Streett & Co Inc | 49 | 0,00 | 10 | 0,00 | ||||
| 2026-02-03 | 13F | Sequoia Financial Advisors, LLC | 2.802 | 4,32 | 582 | 5,64 | ||||
| 2026-02-12 | 13F | Foster Dykema Cabot & Partners, Llc | 0 | -100,00 | 0 | |||||
| 2026-02-13 | 13F | Stifel Financial Corp | 69.016 | -2,51 | 14.325 | -1,23 | ||||
| 2026-01-26 | 13F | Nations Financial Group Inc, /ia/ /adv | 3.688 | -0,38 | 766 | 0,92 | ||||
| 2026-02-13 | 13F | Pine Valley Investments Ltd Liability Co | 1.081 | 0,00 | 224 | 1,36 | ||||
| 2026-02-12 | 13F | Empower Advisory Group, LLC | 387.117 | 11,23 | 80.346 | 12,69 | ||||
| 2026-02-10 | 13F | Godfrey Financial Associates, Inc. | 127 | 26 | ||||||
| 2026-04-13 | 13F | Massmutual Trust Co Fsb/adv | 9.745 | -3,43 | 2.196 | 4,82 | ||||
| 2026-02-12 | 13F | Steward Partners Investment Advisory, Llc | 14.452 | 2,69 | 3.000 | 4,02 | ||||
| 2026-04-07 | 13F | Calder Financial LLC | 2.053 | 34,36 | 469 | 47,63 | ||||
| 2026-02-09 | 13F | Annis Gardner Whiting Capital Advisors, LLC | 500 | 104 | ||||||
| 2026-02-11 | 13F | J.w. Cole Advisors, Inc. | 24.015 | -13,39 | 4.964 | -12,62 | ||||
| 2026-02-17 | 13F | Russell Investments Group, Ltd. | 312 | -7,69 | 65 | -7,25 | ||||
| 2026-02-10 | 13F | Root Financial Partners, LLC | 212 | 46,21 | 44 | 51,72 | ||||
| 2026-01-28 | 13F | City State Bank | 3.904 | 0,26 | 810 | 1,63 | ||||
| 2026-02-10 | 13F | Envestnet Asset Management Inc | 240.521 | -11,79 | 49.920 | -10,63 | ||||
| 2025-11-12 | 13F | Buckingham Strategic Partners | 0 | -100,00 | 0 | -100,00 | ||||
| 2026-02-02 | 13F | Fifth Third Bancorp | 2.176 | -3,63 | 452 | -2,38 | ||||
| 2026-02-14 | 13F | American Trust | 1.003 | 208 | ||||||
| 2026-02-18 | 13F | NFP Retirement, Inc. | 1.864 | 0,27 | 387 | 1,58 | ||||
| 2026-02-13 | 13F | Bragg Financial Advisors, Inc | 1.373 | -1,44 | 285 | -0,35 | ||||
| 2026-01-14 | 13F | Alliance Wealth Advisors, LLC | 2.533 | 0,00 | 526 | 1,35 | ||||
| 2026-04-14 | 13F | eCIO, Inc. | 0 | -100,00 | 0 | |||||
| 2026-02-13 | 13F | Hurley Capital, LLC | 868 | 24,00 | 180 | 25,87 | ||||
| 2026-02-17 | 13F | Main Street Financial Solutions, LLC | 8.720 | -1,60 | 1.810 | -0,33 | ||||
| 2026-02-12 | 13F | BRYN MAWR TRUST Co | 38 | -86,67 | 8 | -87,93 | ||||
| 2026-02-10 | 13F | DT Investment Partners, LLC | 1 | 0,00 | 0 | |||||
| 2026-01-15 | 13F | Lodestone Wealth Management LLC | 23 | 5 | ||||||
| 2026-02-13 | 13F | Fiduciary Trust Co | 4.985 | -1,09 | 1.035 | 0,19 | ||||
| 2026-02-13 | 13F | Missouri Trust & Investment Co | 56 | 0,00 | 12 | 0,00 | ||||
| 2026-02-17 | 13F | Point72 Asset Management, L.P. | 3.459 | 718 | ||||||
| 2026-02-13 | 13F | Kcm Investment Advisors Llc | 36.913 | -0,89 | 7.661 | 0,42 | ||||
| 2026-02-13 | 13F | Gts Securities Llc | 7.299 | 1.515 | ||||||
| 2026-01-27 | 13F | Atlantic Edge Private Wealth Management, LLC | 85 | 0,00 | 18 | 0,00 | ||||
| 2026-02-03 | 13F | Lighthouse Financial Services Inc /adv | 23.378 | 4.852 | ||||||
| 2026-02-17 | 13F | Running Point Capital Advisors, LLC | 154 | 0,00 | 32 | 0,00 | ||||
| 2026-02-06 | 13F | Envestnet Portfolio Solutions, Inc. | 3.511 | 726 | ||||||
| 2026-01-20 | 13F | Independence Bank of Kentucky | 14 | 0,00 | 3 | 0,00 | ||||
| 2026-04-13 | 13F | Garrett Investment Advisors LLC | 3.249 | -0,31 | 732 | 8,28 | ||||
| 2026-01-23 | 13F | Webster Bank, N. A. | 275 | 0,00 | 57 | 1,79 | ||||
| 2026-02-02 | 13F | Cornerstone Planning Group LLC | 542 | 81,88 | 125 | 0,00 | ||||
| 2026-01-26 | 13F | Cwm, Llc | 372 | 125,45 | 0 | |||||
| 2026-01-29 | 13F | Global Strategic Investment Solutions, LLC | 10.808 | -6,76 | 2.243 | -5,52 | ||||
| 2026-02-12 | 13F | Advocate Investing Services LLC | 571 | 118 | ||||||
| 2026-02-11 | 13F | Capital Analysts, Inc. | 0 | -100,00 | 0 | |||||
| 2026-04-09 | 13F | Wedmont Private Capital | 0 | -100,00 | 0 | |||||
| 2026-02-06 | 13F | Global Retirement Partners, LLC | 643 | 34,80 | 134 | 37,11 | ||||
| 2026-04-14 | 13F | Thurston, Springer, Miller, Herd & Titak, Inc. | 120 | 0,00 | 27 | 12,50 | ||||
| 2026-02-03 | 13F | Farmers & Merchants Investments Inc | 47 | 0,00 | 10 | 0,00 | ||||
| 2026-04-10 | 13F | Armstrong Advisory Group, Inc | 175 | 0,00 | 39 | 8,33 | ||||
| 2026-01-21 | 13F | Prime Capital Investment Advisors, LLC | 2.614 | -1,58 | 543 | -0,37 | ||||
| 2026-02-06 | 13F | HighTower Advisors, LLC | 17.364 | -1,36 | 3.604 | -0,08 | ||||
| 2026-02-05 | 13F | Td Private Client Wealth Llc | 152 | 6,29 | 32 | 6,90 | ||||
| 2026-01-23 | 13F | Optima Capital Llc | 355 | -65,67 | 74 | -65,40 | ||||
| 2026-01-27 | 13F | Tranquilli Financial Advisor LLC | 16.708 | -3,02 | 3.468 | -1,76 | ||||
| 2026-02-17 | 13F | Advisor Group Holdings, Inc. | 39.441 | -8,92 | 8.197 | -8,34 | ||||
| 2026-01-30 | 13F | Simplicity Wealth,LLC | 2.158 | -3,40 | 448 | -2,19 | ||||
| 2026-01-21 | 13F | Apella Capital, LLC | 1.373 | 285 | ||||||
| 2026-02-13 | 13F | Atlas Capital Advisors Llc | 4.302 | -2,89 | 893 | 3,36 | ||||
| 2026-01-26 | 13F | Wbh Advisory Inc | 3.711 | -5,57 | 770 | -4,35 | ||||
| 2026-01-29 | 13F | Comerica Bank | 6.474 | 0,89 | 1.344 | 2,21 | ||||
| 2026-02-03 | 13F | Bokf, Na | 2.989 | 0,00 | 620 | 1,31 | ||||
| 2026-01-28 | 13F | Davis Capital Management | 287 | 0,00 | 60 | 1,72 | ||||
| 2026-01-23 | 13F | Rsm Us Wealth Management Llc | 1.442 | 0,28 | 302 | 2,72 | ||||
| 2026-02-12 | 13F | Founders Financial Alliance, LLC | 32 | -41,82 | 7 | -45,45 | ||||
| 2026-02-14 | 13F | Rockefeller Capital Management L.P. | 39.978 | 0,26 | 8.298 | 1,58 | ||||
| 2026-02-17 | 13F | IHT Wealth Management, LLC | 5.174 | 0,41 | 1.122 | 7,58 | ||||
| 2026-01-30 | 13F | Laurel Wealth Advisors LLC | 339 | 70 | ||||||
| 2026-02-12 | 13F | Principal Securities, Inc. | 0 | -100,00 | 0 | -100,00 | ||||
| 2026-02-13 | 13F | Baird Financial Group, Inc. | 5.088 | 10,08 | 1.056 | 11,63 | ||||
| 2026-02-10 | 13F | Hazlett, Burt & Watson, Inc. | 551 | 8,04 | 0 | |||||
| 2026-01-28 | 13F | Dentgroup LLC | 2.993 | -0,13 | 621 | 1,14 | ||||
| 2026-02-17 | 13F | Keebeck Wealth Management, LLC | 1.706 | -1,10 | 354 | 0,28 | ||||
| 2026-02-03 | 13F | SBI Securities Co., Ltd. | 391 | 2,09 | 81 | 3,85 | ||||
| 2026-04-13 | 13F | Trust Co | 38 | 111,11 | 9 | 166,67 | ||||
| 2026-02-12 | 13F | Triumph Capital Management | 70 | 0,00 | 15 | 0,00 | ||||
| 2026-01-30 | 13F | Caldwell Securities, Inc | 12 | 2 | ||||||
| 2026-02-12 | 13F | CIBC Private Wealth Group, LLC | 91 | 160,00 | 19 | 157,14 | ||||
| 2026-02-05 | 13F | Atria Investments Llc | 15.718 | -5,52 | 3.262 | -4,28 | ||||
| 2026-01-22 | 13F | Brookwood Investment Group LLC | 2.377 | -2,02 | 493 | -0,60 | ||||
| 2026-02-12 | 13F | Vickerman Investment Advisors, Inc. | 23.316 | 1,59 | 4.839 | 2,94 | ||||
| 2026-02-09 | 13F | Harbour Investments, Inc. | 398 | -1,97 | 83 | -1,20 | ||||
| 2026-02-12 | 13F | Great Valley Advisor Group, Inc. | 2.079 | -1,09 | 432 | 0,23 | ||||
| 2026-01-29 | 13F | UBS Group AG | 108.735 | -2,94 | 22.568 | -1,66 | ||||
| 2026-02-04 | 13F | Bailard, Inc. | 3.711 | 22,72 | 770 | 24,39 | ||||
| 2026-02-06 | 13F | Fortis Group Advisors, LLC | 31 | 0,00 | 6 | 0,00 | ||||
| 2026-02-03 | 13F | Costello Asset Management, INC | 49 | 0,00 | 10 | 0,00 | ||||
| 2026-04-08 | 13F | Sharper & Granite LLC | 10.087 | -1,90 | 2.273 | 6,51 | ||||
| 2026-02-12 | 13F | Beacon Capital Management, Inc. | 493.540 | -10,06 | 102.434 | -8,88 | ||||
| 2026-02-13 | 13F | C M Bidwell & Associates Ltd | 185 | 0,00 | 38 | 2,70 | ||||
| 2026-02-02 | 13F | Mutual Advisors, LLC | 1.960 | 0,10 | 407 | 2,01 | ||||
| 2026-01-26 | 13F | Northwest Capital Management Inc | 0 | -100,00 | 0 |