Grundlæggende statistik
| Institutionelle ejere | 223 total, 223 long only, 0 short only, 0 long/short - change of 7,69% MRQ |
| Gennemsnitlig porteføljeallokering | 0.1353 % - change of 1,65% MRQ |
| Institutionelle aktier (lange) | 12.836.415 (ex 13D/G) - change of 1,42MM shares 12,44% MRQ |
| Institutionel værdi (lang) | $ 426.409 USD ($1000) |
Institutionelt ejerskab og aktionærer
Reaves Utility Income Fund (US:UTG) har 223 institutionelle ejere og aktionærer, der har indsendt 13D/G- eller 13F-formularer til Securities Exchange Commission (SEC). Disse institutioner har i alt 12,836,415 aktier. Største aktionærer omfatter Bank Of America Corp /de/, Morgan Stanley, Cornerstone Advisors, LLC, Wells Fargo & Company/mn, LPL Financial LLC, Commonwealth Equity Services, Llc, Royal Bank Of Canada, Cornerstone Strategic Value Fund Inc, Ameriprise Financial Inc, and J.w. Cole Advisors, Inc. .
Reaves Utility Income Fund (NYSEAM:UTG) institutionel ejerskabsstruktur viser aktuelle positioner i virksomheden efter institutioner og fonde, samt seneste ændringer i positionsstørrelse. Større aktionærer kan omfatte individuelle investorer, investeringsforeninger, hedgefonde eller institutioner. Skema 13D angiver, at investoren besidder (eller besidder) mere end 5 % af virksomheden og har til hensigt (eller har til hensigt at) aktivt at forfølge en ændring i forretningsstrategi. Skema 13G indikerer en passiv investering på over 5%.
The share price as of September 5, 2025 is 37,39 / share. Previously, on September 9, 2024, the share price was 30,48 / share. This represents an increase of 22,67% over that period.

Fondens stemningsscore
Fund Sentiment Score (fka Ownership Accumulation Score) finder de aktier, der bliver mest købt af fonde. Det er resultatet af en sofistikeret, multi-faktor kvantitativ model, der identificerer virksomheder med de højeste niveauer af institutionel akkumulering. Scoringsmodellen bruger en kombination af den samlede stigning i oplyste ejere, ændringerne i porteføljeallokeringer i disse ejere og andre målinger. Tallet går fra 0 til 100, hvor højere tal indikerer et højere niveau af akkumulering for sine jævnaldrende, og 50 er gennemsnittet.
Opdateringsfrekvens: Dagligt
Se Ownership Explorer, som giver en liste over højest rangerende virksomheder.
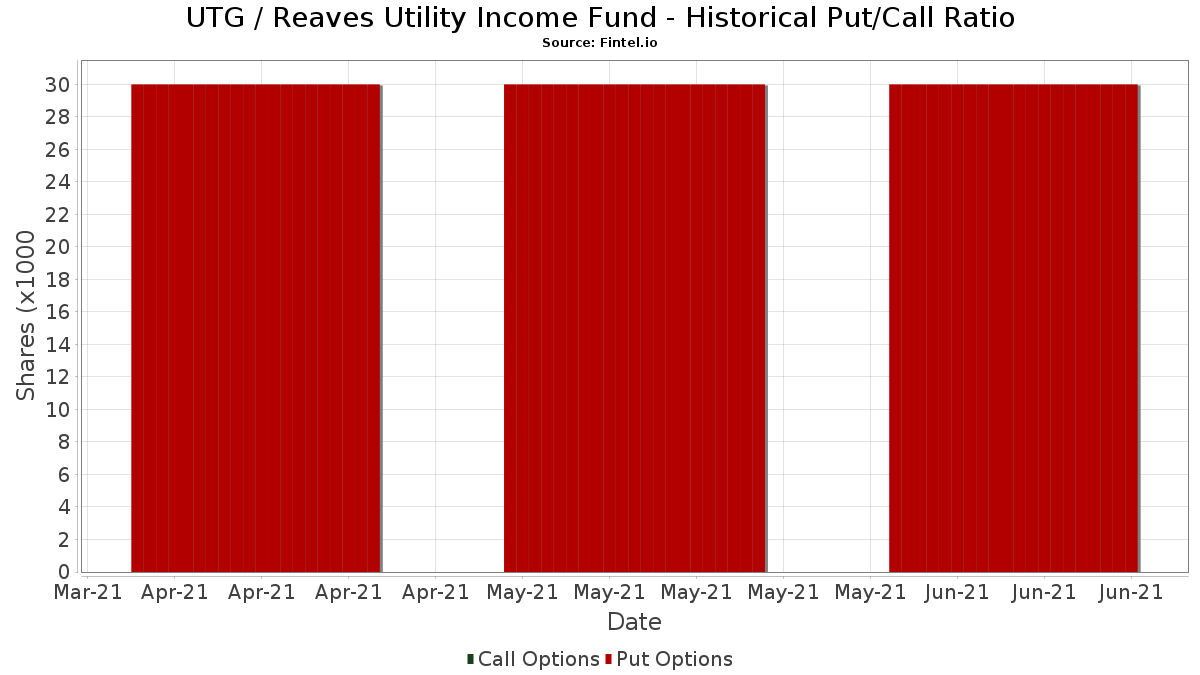
Institutionel Put/Call-forhold
Ud over at indberette standardaktie- og gældsudstedelser skal institutter med mere end 100 mill. aktiver under forvaltning også oplyse deres put- og call-optionsbeholdninger. Da salgsoptioner generelt indikerer negativ stemning, og købsoptioner indikerer positiv stemning, kan vi få en fornemmelse af den overordnede institutionelle stemning ved at plotte forholdet mellem put og kald. Diagrammet til højre viser det historiske put/call-forhold for dette instrument.
Brug af Put/Call Ratio som en indikator for investorernes stemning overvinder en af de vigtigste mangler ved at bruge totalt institutionelt ejerskab, som er, at en betydelig mængde af aktiver under forvaltning investeres passivt for at spore indekser. Passivt forvaltede fonde køber typisk ikke optioner, så indikatoren for put/call-forholdet følger mere nøje følelsen af aktivt forvaltede fonde.
13F og NPORT arkivering
Detaljer om 13F-arkivering er gratis. Detaljer om NP-ansøgninger kræver et premium-medlemskab. Grønne rækker angiver nye positioner. Røde rækker angiver lukkede positioner. Klik på linket ikon for at se den fulde transaktionshistorik.
Opgrader
for at låse premium-data op og eksportere til Excel ![]() .
.
| Fil dato | Kilde | Investor | Type | Gennemsnitlig pris (Øst) |
Aktier | Δ Aktier (%) |
Rapporteret Værdi ($1000) |
Δ Værdi (%) |
Port Alloc (%) |
|
|---|---|---|---|---|---|---|---|---|---|---|
| 2025-08-12 | 13F | J.w. Cole Advisors, Inc. | 362.956 | 366,21 | 13.132 | 418,40 | ||||
| 2025-08-12 | 13F | LPL Financial LLC | 616.607 | 2,90 | 22.309 | 14,41 | ||||
| 2025-08-12 | 13F | CIBC Private Wealth Group, LLC | 300 | -0,33 | 11 | 25,00 | ||||
| 2025-08-11 | 13F | Elequin Capital Lp | 0 | -100,00 | 0 | |||||
| 2025-07-24 | 13F | Edge Financial Advisors LLC | 8.215 | 298 | ||||||
| 2025-07-29 | 13F | Stephens Inc /ar/ | 26.913 | 5,38 | 974 | 17,09 | ||||
| 2025-04-24 | 13F | Wingate Wealth Advisors, Inc. | 0 | -100,00 | 0 | |||||
| 2025-05-06 | 13F | Proficio Capital Partners LLC | 0 | -100,00 | 0 | -100,00 | ||||
| 2025-08-13 | 13F | Northwestern Mutual Wealth Management Co | 58.209 | 7,56 | 2.106 | 19,53 | ||||
| 2025-05-06 | 13F | Kovack Advisors, Inc. | 0 | -100,00 | 0 | |||||
| 2025-08-14 | 13F | Ameriprise Financial Inc | 382.317 | -22,02 | 13.827 | -12,98 | ||||
| 2025-08-14 | 13F | CoreCap Advisors, LLC | 5.604 | -8,19 | 203 | 2,02 | ||||
| 2025-07-17 | 13F | Sterling Investment Advisors, Ltd. | 192.359 | 3,88 | 6.960 | 15,50 | ||||
| 2025-07-25 | 13F | Atria Wealth Solutions, Inc. | 50.949 | -19,13 | 1.843 | -10,10 | ||||
| 2025-08-13 | 13F | Continuum Advisory, LLC | 0 | -100,00 | 0 | |||||
| 2025-08-06 | 13F | Wedbush Securities Inc | 36.009 | 8,18 | 1 | 0,00 | ||||
| 2025-07-22 | 13F | Belpointe Asset Management LLC | 14.011 | -7,00 | 507 | 3,27 | ||||
| 2025-08-11 | 13F | Western Wealth Management, LLC | 7.095 | 257 | ||||||
| 2025-08-14 | 13F | Federation des caisses Desjardins du Quebec | 358 | 0,00 | 13 | 9,09 | ||||
| 2025-08-14 | 13F | Beaird Harris Wealth Management, LLC | 175 | 0,00 | 6 | 20,00 | ||||
| 2025-08-06 | 13F | Commonwealth Equity Services, Llc | 509.049 | 3,98 | 18 | 20,00 | ||||
| 2025-08-11 | 13F | Private Advisor Group, LLC | 140.633 | 6,95 | 5.088 | 18,93 | ||||
| 2025-07-15 | 13F | Wealth Effects Llc | 69.699 | 0,14 | 2.522 | 11,35 | ||||
| 2025-07-10 | 13F | Oliver Lagore Vanvalin Investment Group | 3.795 | 0,00 | 123 | 2,50 | ||||
| 2025-07-18 | 13F | Consolidated Portfolio Review Corp | 132.011 | -13,26 | 4.776 | -3,55 | ||||
| 2025-08-04 | 13F | Pensionmark Financial Group, Llc | 40.221 | -31,59 | 1.455 | -23,94 | ||||
| 2025-07-11 | 13F/A | Umb Bank N A/mo | 574 | 0,00 | 21 | 11,11 | ||||
| 2025-07-24 | 13F | Costello Asset Management, INC | 10.700 | -1,42 | 387 | 9,63 | ||||
| 2025-08-01 | 13F | Gwn Securities Inc. | 8.638 | 313 | ||||||
| 2025-08-13 | 13F | Allie Family Office LLC | 6.490 | 0,00 | 235 | 10,90 | ||||
| 2025-08-19 | 13F | Advisory Services Network, LLC | 19.185 | 0,15 | 734 | 17,82 | ||||
| 2025-07-11 | 13F | Seacrest Wealth Management, Llc | 7.195 | 10,78 | 260 | 23,22 | ||||
| 2025-08-14 | 13F | Mercer Global Advisors Inc /adv | 14.849 | 26,29 | 537 | 40,58 | ||||
| 2025-07-17 | 13F | Oak Family Advisors, Llc | 249.394 | -6,90 | 9.023 | 3,51 | ||||
| 2025-08-11 | 13F | Semus Wealth Partners LLC | 12.809 | -6,45 | 463 | 4,04 | ||||
| 2025-08-12 | 13F | MAI Capital Management | 5.232 | 0,69 | 189 | 11,83 | ||||
| 2025-07-21 | 13F | Hilltop National Bank | 590 | 0,00 | 21 | 16,67 | ||||
| 2025-08-07 | 13F | McClarren Financial Advisors, Inc. | 0 | -100,00 | 0 | |||||
| 2025-07-24 | 13F | Financial Security Advisor, Inc. | 10.000 | 0,00 | 362 | 11,08 | ||||
| 2025-08-01 | 13F | Centerpoint Advisors, LLC | 1.700 | 0,00 | 0 | |||||
| 2025-08-12 | 13F | Tradition Wealth Management, LLC | 98.261 | 1,40 | 3.555 | 12,75 | ||||
| 2025-07-15 | 13F | Fifth Third Bancorp | 950 | 0,00 | 34 | 13,33 | ||||
| 2025-07-22 | 13F | Kercheville Advisors, LLC | 34.770 | -2,16 | 1.258 | 8,74 | ||||
| 2025-08-13 | 13F | StoneX Group Inc. | 12.464 | -8,39 | 451 | 1,81 | ||||
| 2025-08-11 | 13F | HighTower Advisors, LLC | 17.207 | -5,04 | 623 | 5,60 | ||||
| 2025-08-12 | 13F | Jpmorgan Chase & Co | 228 | -70,47 | 8 | -68,00 | ||||
| 2025-05-19 | 13F | Smith Asset Management Co., LLC | 80.660 | -0,28 | 2.625 | 2,38 | ||||
| 2025-07-07 | 13F | Versant Capital Management, Inc | 234 | 0,00 | 8 | 14,29 | ||||
| 2025-08-14 | 13F | UBS Group AG | 188.829 | 7,57 | 6.832 | 19,59 | ||||
| 2025-08-14 | 13F | Integrated Wealth Concepts LLC | 12.104 | 438 | ||||||
| 2025-08-12 | 13F | Jefferies Financial Group Inc. | 9.014 | 326 | ||||||
| 2025-05-02 | 13F | Cullen/frost Bankers, Inc. | 0 | -100,00 | 0 | |||||
| 2025-06-27 | NP | Calamos ETF Trust - Calamos CEF Income & Arbitrage ETF | 9.808 | -11,53 | 322 | -12,05 | ||||
| 2025-07-24 | 13F | Morton Brown Family Wealth, LLC | 153 | 6 | ||||||
| 2025-07-21 | 13F | Future Financial Wealth Managment LLC | 26.170 | 1,83 | 947 | 13,16 | ||||
| 2025-08-14 | 13F | Stifel Financial Corp | 255.169 | 14,06 | 9.232 | 26,82 | ||||
| 2025-08-04 | 13F | Roble, Belko & Company, Inc | 72 | 1,41 | 0 | |||||
| 2025-08-28 | NP | Cohen & Steers Closed-end Opportunity Fund, Inc. | 20.000 | 30,85 | 724 | 73,80 | ||||
| 2025-07-24 | 13F | Us Bancorp \de\ | 13.284 | -9,90 | 481 | 0,21 | ||||
| 2025-07-30 | 13F | Brookstone Capital Management | 22.606 | 7,27 | 818 | 19,27 | ||||
| 2025-08-04 | 13F | Creative Financial Designs Inc /adv | 5.677 | 3,77 | 205 | 15,17 | ||||
| 2025-08-12 | 13F | AlphaCore Capital LLC | 30.825 | 9,25 | 1.115 | 21,46 | ||||
| 2025-08-15 | 13F | Equitable Holdings, Inc. | 11.711 | 7,18 | 424 | 19,15 | ||||
| 2025-05-12 | 13F | Wolverine Asset Management Llc | 0 | -100,00 | 0 | |||||
| 2025-08-11 | 13F | Brown Brothers Harriman & Co | 4.225 | 0,00 | 153 | 10,95 | ||||
| 2025-07-28 | 13F/A | Penbrook Management LLC | 6.075 | -37,53 | 220 | -30,70 | ||||
| 2025-07-10 | 13F | Focus Financial Network, Inc. | 10.882 | 6,01 | 394 | 17,66 | ||||
| 2025-08-22 | NP | Cornerstone Strategic Value Fund Inc | 482.478 | 74,39 | 17.456 | 93,91 | ||||
| 2025-07-14 | 13F | Armstrong Advisory Group, Inc | 254 | 9 | ||||||
| 2025-08-13 | 13F | Keystone Financial Group | 5.640 | 204 | ||||||
| 2025-08-12 | 13F | Walled Lake Planning & Wealth Management, Llc | 14.045 | 29,21 | 508 | 43,91 | ||||
| 2025-08-14 | 13F | Mml Investors Services, Llc | 17.658 | -16,50 | 1 | |||||
| 2025-07-31 | 13F/A | Avion Wealth | 0 | 0 | ||||||
| 2025-08-13 | 13F | Baird Financial Group, Inc. | 7.586 | 7,91 | 274 | 20,18 | ||||
| 2025-08-13 | 13F | Lido Advisors, LLC | 150.194 | 0,55 | 5.434 | 11,81 | ||||
| 2025-08-08 | 13F | Cetera Investment Advisers | 150.407 | 0,73 | 5.442 | 12,00 | ||||
| 2025-08-14 | 13F | Royal Bank Of Canada | 493.887 | -1,45 | 17.868 | 9,57 | ||||
| 2025-08-07 | 13F | Samalin Investment Counsel, LLC | 19.814 | 1,30 | 717 | 12,58 | ||||
| 2025-08-08 | 13F | Good Life Advisors, LLC | 67.552 | 1,45 | 2.444 | 12,83 | ||||
| 2025-07-25 | 13F | Commonwealth Financial Services, LLC | 5.819 | 211 | ||||||
| 2025-08-07 | 13F | Kestra Private Wealth Services, Llc | 0 | -100,00 | 0 | |||||
| 2025-05-15 | 13F | Family Office Research LLC | 0 | -100,00 | 0 | |||||
| 2025-07-25 | NP | FCEF - First Trust CEF Income Opportunity ETF This fund is a listed as child fund of First Trust Advisors Lp and if that institution has disclosed ownership in this security, then these positions will not be double counted when calculating total shares and total value | 24.510 | 7,99 | 848 | 13,83 | ||||
| 2025-07-16 | 13F | ORG Partners LLC | 7.564 | 5,22 | 275 | 16,10 | ||||
| 2025-07-09 | 13F | Triumph Capital Management | 7.982 | -7,85 | 289 | 2,49 | ||||
| 2025-08-04 | 13F | Assetmark, Inc | 645 | 23 | ||||||
| 2025-08-15 | 13F | Kestra Advisory Services, LLC | 36.177 | 2,84 | 1.309 | 14,34 | ||||
| 2025-08-08 | 13F | Cornerstone Advisors, LLC | 732.485 | 80,17 | 26.501 | 100,33 | ||||
| 2025-08-06 | 13F | Moors & Cabot, Inc. | 0 | -100,00 | 0 | |||||
| 2025-08-15 | 13F | Captrust Financial Advisors | 359.116 | -2,20 | 12.993 | 8,74 | ||||
| 2025-08-07 | 13F | Parkside Financial Bank & Trust | 485 | 0,00 | 18 | 13,33 | ||||
| 2025-04-21 | 13F | Beacon Capital Management, LLC | 0 | -100,00 | 0 | |||||
| 2025-07-25 | 13F | Welch Group, LLC | 22.500 | 18,32 | 814 | 31,93 | ||||
| 2025-08-08 | 13F | IMA Wealth, Inc. | 0 | -100,00 | 0 | |||||
| 2025-08-14 | 13F | Certified Advisory Corp | 15.246 | -11,98 | 552 | -2,13 | ||||
| 2025-09-04 | 13F/A | Advisor Group Holdings, Inc. | 237.084 | 1,35 | 8.579 | 12,71 | ||||
| 2025-08-11 | 13F | Principal Securities, Inc. | 6.751 | 1,86 | 244 | 16,19 | ||||
| 2025-08-15 | 13F | Morgan Stanley | 975.172 | 1,53 | 35.282 | 12,89 | ||||
| 2025-08-05 | 13F | Sigma Planning Corp | 28.890 | 0,71 | 1.045 | 12,00 | ||||
| 2025-05-06 | 13F | Readystate Asset Management Lp | 0 | -100,00 | 0 | -100,00 | ||||
| 2025-08-06 | 13F | AE Wealth Management LLC | 16.802 | -2,26 | 608 | 8,59 | ||||
| 2025-08-08 | 13F | Westbourne Investment Advisors, Inc. | 22.900 | 829 | ||||||
| 2025-08-13 | 13F | Custom Index Systems, Llc | 6.679 | 2,39 | 242 | 13,68 | ||||
| 2025-07-08 | 13F | Ballew Advisors, Inc | 5.664 | 204 | ||||||
| 2025-08-12 | 13F | Landscape Capital Management, L.l.c. | 0 | -100,00 | 0 | |||||
| 2025-07-16 | 13F | Maridea Wealth Management LLC | 15.310 | 1,88 | 554 | 13,09 | ||||
| 2025-08-14 | 13F | Jane Street Group, Llc | 14.039 | 508 | ||||||
| 2025-08-13 | 13F | Alerus Financial Na | 267 | 10 | ||||||
| 2025-08-06 | 13F | Atlantic Union Bankshares Corp | 201 | 7 | ||||||
| 2025-08-12 | 13F | Armor Investment Advisors, LLC | 21.050 | 4,54 | 762 | 16,18 | ||||
| 2025-08-07 | 13F | Allworth Financial LP | 4.289 | 38,89 | 155 | 58,16 | ||||
| 2025-08-13 | 13F | Per Stirling Capital Management, LLC. | 13.254 | 8,37 | 480 | 20,65 | ||||
| 2025-08-13 | 13F | Walleye Capital LLC | 20.496 | 742 | ||||||
| 2025-07-31 | 13F | Leavell Investment Management, Inc. | 0 | -100,00 | 0 | |||||
| 2025-08-13 | 13F | Guggenheim Capital Llc | 178.906 | -18,82 | 6.473 | -9,74 | ||||
| 2025-07-28 | 13F | Mission Hills Financial Advisory, LLC | 12.374 | 448 | ||||||
| 2025-08-05 | 13F | Huntington National Bank | 0 | -100,00 | ||||||
| 2025-08-14 | 13F | Wiley Bros.-aintree Capital, Llc | 11.241 | 407 | ||||||
| 2025-08-11 | 13F | Novak & Powell Financial Services, Inc. | 7.941 | 1,33 | 287 | 12,55 | ||||
| 2025-08-12 | 13F | Proequities, Inc. | 0 | 0 | ||||||
| 2025-07-02 | 13F | HBW Advisory Services LLC | 32.143 | 1,05 | 1.163 | 12,27 | ||||
| 2025-07-14 | 13F | AdvisorNet Financial, Inc | 1.461 | 73,93 | 53 | 92,59 | ||||
| 2025-08-14 | 13F | Colony Group, LLC | 8.335 | -5,01 | 302 | 5,61 | ||||
| 2025-07-25 | 13F | We Are One Seven, LLC | 13.726 | 4,21 | 497 | 15,89 | ||||
| 2025-05-05 | 13F | Transce3nd, LLC | 0 | -100,00 | 0 | |||||
| 2025-08-06 | 13F | Carnegie Lake Advisors LLC | 28.609 | -7,59 | 1 | 0,00 | ||||
| 2025-07-29 | 13F | Tradewinds Capital Management, LLC | 320 | 0,00 | 12 | 10,00 | ||||
| 2025-07-16 | 13F | West Branch Capital LLC | 830 | 1,22 | 30 | 15,38 | ||||
| 2025-08-04 | 13F | ELCO Management Co., LLC | 7.550 | -0,66 | 273 | 10,53 | ||||
| 2025-08-11 | 13F | Hexagon Capital Partners LLC | 0 | -100,00 | 0 | |||||
| 2025-07-14 | 13F | Sowell Financial Services LLC | 57.609 | -0,59 | 2.084 | 10,56 | ||||
| 2025-07-25 | 13F | Cwm, Llc | 22.769 | 2,36 | 1 | |||||
| 2025-08-13 | 13F | Cary Street Partners Financial Llc | 5.808 | 210 | ||||||
| 2025-07-08 | 13F | Nbc Securities, Inc. | 51.173 | -7,98 | 2 | 0,00 | ||||
| 2025-08-12 | 13F | Retirement Planning Co of New England, Inc. | 0 | -100,00 | 0 | -100,00 | ||||
| 2025-08-18 | 13F | Hollencrest Capital Management | 395 | 0,00 | 14 | 16,67 | ||||
| 2025-08-13 | 13F | Summit Financial, LLC | 7.744 | 13,67 | 280 | 26,70 | ||||
| 2025-07-07 | 13F | Investors Research Corp | 7.077 | 0,00 | 256 | 11,30 | ||||
| 2025-07-08 | 13F | Webster Bank, N. A. | 995 | 0,00 | 36 | 9,38 | ||||
| 2025-08-13 | 13F | Leslie Global Wealth, LLC | 9.667 | 0,00 | 350 | 11,15 | ||||
| 2025-08-15 | 13F | Tower Research Capital LLC (TRC) | 0 | -100,00 | 0 | |||||
| 2025-08-12 | 13F | XTX Topco Ltd | 14.844 | 537 | ||||||
| 2025-08-14 | 13F | Vivaldi Capital Management, LLC | 24.350 | 0,00 | 881 | 11,11 | ||||
| 2025-07-02 | 13F | Neville Rodie & Shaw Inc | 12.701 | 0,00 | 0 | |||||
| 2025-08-07 | 13F | Nwam Llc | 7.480 | 20,45 | 285 | 41,09 | ||||
| 2025-07-17 | 13F | Janney Montgomery Scott LLC | 93.563 | 36,82 | 3 | 50,00 | ||||
| 2025-08-08 | 13F | Pnc Financial Services Group, Inc. | 34.599 | 86,71 | 1.252 | 107,81 | ||||
| 2025-08-11 | 13F/A | Purus Wealth Management, LLC | 6.406 | 232 | ||||||
| 2025-08-14 | 13F | Cohen & Steers, Inc. | 20.000 | 1 | ||||||
| 2025-05-12 | 13F | Fmr Llc | 0 | -100,00 | 0 | |||||
| 2025-08-14 | 13F | Wells Fargo & Company/mn | 632.944 | 1,33 | 22.900 | 12,66 | ||||
| 2025-07-22 | 13F | Wealthcare Advisory Partners LLC | 8.694 | 6,00 | 315 | 18,05 | ||||
| 2025-07-29 | 13F | Balboa Wealth Partners | 8.761 | -9,74 | 317 | 0,32 | ||||
| 2025-04-25 | 13F | Albion Financial Group /ut | 0 | -100,00 | 0 | |||||
| 2025-08-14 | 13F | Bank Of America Corp /de/ | 1.043.401 | 11,74 | 37.750 | 24,24 | ||||
| 2025-07-22 | 13F | DAVENPORT & Co LLC | 17.087 | 30,03 | 618 | 44,73 | ||||
| 2025-07-15 | 13F | North Star Investment Management Corp. | 1.450 | 0,00 | 52 | 10,64 | ||||
| 2025-05-15 | 13F | Parvin Asset Management, LLC | 0 | -100,00 | 0 | |||||
| 2025-08-06 | 13F | Savant Capital, LLC | 6.142 | 222 | ||||||
| 2025-08-14 | 13F | Matrix Private Capital Group Llc | 11.550 | -4,94 | 418 | 5,57 | ||||
| 2025-08-07 | 13F | Sound View Wealth Advisors Group, LLC | 14.725 | -5,66 | 533 | 4,93 | ||||
| 2025-08-13 | 13F | EverSource Wealth Advisors, LLC | 2.500 | 0,00 | 90 | 11,11 | ||||
| 2025-08-06 | 13F | Aspect Partners, LLC | 100 | 0,00 | 4 | 0,00 | ||||
| 2025-07-08 | 13F | Dover Advisors, Llc | 9.600 | 9,71 | 347 | 22,18 | ||||
| 2025-08-08 | 13F | Hartland & Co., LLC | 550 | 0,00 | 20 | 11,76 | ||||
| 2025-07-16 | 13F | Signaturefd, Llc | 4.000 | -0,77 | 145 | 9,92 | ||||
| 2025-08-01 | 13F | Boyd Watterson Asset Management Llc/oh | 100 | 0,00 | 4 | 0,00 | ||||
| 2025-07-23 | 13F | Abel Hall, LLC | 10.000 | 362 | ||||||
| 2025-08-14 | 13F | Visionary Wealth Advisors | 11.620 | 47,72 | 420 | 64,71 | ||||
| 2025-07-18 | 13F | SOA Wealth Advisors, LLC. | 613 | 0,00 | 22 | 15,79 | ||||
| 2025-08-04 | 13F | Bay Colony Advisory Group, Inc d/b/a Bay Colony Advisors | 8.803 | 13,78 | 318 | 26,69 | ||||
| 2025-07-29 | 13F | Salomon & Ludwin, LLC | 580 | 0,00 | 21 | 11,11 | ||||
| 2025-05-12 | 13F | Sandy Spring Bank | 201 | 0,00 | 7 | 0,00 | ||||
| 2025-08-04 | 13F | Spire Wealth Management | 4.430 | -6,12 | 160 | 4,58 | ||||
| 2025-05-15 | 13F | Talon Private Wealth, LLC | 0 | -100,00 | 0 | -100,00 | ||||
| 2025-08-12 | 13F | Change Path, LLC | 57.193 | -9,29 | 2.069 | 0,88 | ||||
| 2025-07-31 | 13F | Cambridge Investment Research Advisors, Inc. | 91.696 | 3,85 | 3 | 50,00 | ||||
| 2025-07-16 | 13F | Signature Resources Capital Management, LLC | 250 | 0,00 | 9 | 12,50 | ||||
| 2025-08-13 | 13F | Everstar Asset Management, LLC | 5.650 | 204 | ||||||
| 2025-08-15 | 13F | Resources Management Corp /ct/ /adv | 356 | 0,00 | 0 | |||||
| 2025-08-19 | 13F | Newbridge Financial Services Group, Inc. | 22.283 | 806 | ||||||
| 2025-08-29 | 13F | Centaurus Financial, Inc. | 54.102 | -2,54 | 2 | 0,00 | ||||
| 2025-08-13 | 13F | Colonial Trust Advisors | 1.500 | 0,00 | 54 | 12,50 | ||||
| 2025-08-08 | 13F | Calamos Advisors LLC | 9.808 | -7,99 | 355 | 2,31 | ||||
| 2025-07-21 | 13F | Ameritas Advisory Services, LLC | 2.664 | 96 | ||||||
| 2025-08-18 | 13F | Geneos Wealth Management Inc. | 3.216 | 0,25 | 116 | 11,54 | ||||
| 2025-07-25 | 13F | Orca Investment Management, LLC | 9.775 | 0,00 | 354 | 11,01 | ||||
| 2025-07-15 | 13F | Fortitude Family Office, LLC | 340 | 12 | ||||||
| 2025-08-08 | 13F | Larson Financial Group LLC | 1.442 | 0,00 | 52 | 13,04 | ||||
| 2025-07-31 | 13F | Oppenheimer & Co Inc | 58.928 | 17,60 | 2.132 | 30,80 | ||||
| 2025-08-05 | 13F | Key FInancial Inc | 554 | 0,00 | 20 | 11,11 | ||||
| 2025-04-21 | 13F | Nelson, Van Denburg & Campbell Wealth Management Group, LLC | 0 | -100,00 | 0 | |||||
| 2025-08-11 | 13F | Nations Financial Group Inc, /ia/ /adv | 15.575 | 0,00 | 564 | 11,26 | ||||
| 2025-07-08 | 13F/A | Salem Investment Counselors Inc | 1.246 | 0,00 | 45 | 12,50 | ||||
| 2025-08-12 | 13F | NWF Advisory Services Inc. | 25.240 | 821 | ||||||
| 2025-08-12 | 13F | Steward Partners Investment Advisory, Llc | 32.998 | 6,06 | 1.194 | 17,89 | ||||
| 2025-08-01 | 13F | Logan Capital Management Inc | 1.000 | 0,00 | 36 | 12,50 | ||||
| 2025-08-15 | 13F | CI Private Wealth, LLC | 12.841 | 465 | ||||||
| 2025-09-04 | 13F | Beacon Capital Management, Inc. | 34.500 | 43,75 | 1.248 | 50,72 | ||||
| 2025-08-12 | 13F | Laurel Wealth Advisors LLC | 90.450 | 3.518,00 | 2 | -97,53 | ||||
| 2025-08-19 | 13F | Anchor Investment Management, LLC | 1.622 | 1,69 | 59 | 13,73 | ||||
| 2025-08-08 | 13F | Avantax Advisory Services, Inc. | 16.096 | 2,73 | 582 | 14,34 | ||||
| 2025-08-14 | 13F | Comerica Bank | 19.164 | 1,70 | 693 | 13,05 | ||||
| 2025-05-07 | 13F | Ramirez Asset Management, Inc. | 0 | -100,00 | 0 | |||||
| 2025-05-12 | 13F | Virtu Financial LLC | 0 | -100,00 | 0 | |||||
| 2025-08-13 | 13F | JBR Co Financial Management Inc | 131.812 | -3,16 | 4.769 | 7,65 | ||||
| 2025-08-11 | 13F | Delta Asset Management Llc/tn | 200 | 0,00 | 7 | 16,67 | ||||
| 2025-07-08 | 13F | Atlas Brown,Inc. | 19.579 | -5,87 | 708 | 4,73 | ||||
| 2025-08-12 | 13F | Global Retirement Partners, LLC | 1.692 | 61 | ||||||
| 2025-07-09 | 13F | Sunpointe, LLC | 17.774 | -25,10 | 643 | -16,71 | ||||
| 2025-08-08 | 13F | Islay Capital Management, Llc | 0 | 0 | ||||||
| 2025-07-17 | 13F | XML Financial, LLC | 49.655 | 3,62 | 1.797 | 15,20 | ||||
| 2025-07-29 | 13F | Stratos Wealth Partners, LTD. | 40.375 | 21,78 | 1.461 | 35,44 | ||||
| 2025-04-29 | 13F | Raleigh Capital Management Inc. | 0 | -100,00 | 0 | |||||
| 2025-08-05 | 13F | GPS Wealth Strategies Group, LLC | 1.253 | 0,00 | 45 | 12,50 | ||||
| 2025-08-14 | 13F | Peapack Gladstone Financial Corp | 8.150 | -6,25 | 0 | |||||
| 2025-07-08 | 13F | Lowe Wealth Advisors, LLC | 6.250 | 1,63 | 226 | 13,00 | ||||
| 2025-08-12 | 13F | BlackRock, Inc. | 384 | 0,00 | 14 | 8,33 | ||||
| 2025-07-23 | 13F | Stonegate Investment Group, LLC | 7.171 | 0,11 | 259 | 11,16 | ||||
| 2025-07-24 | 13F | IFP Advisors, Inc | 2.307 | -51,88 | 83 | -46,45 | ||||
| 2025-07-17 | 13F | Oakworth Capital, Inc. | 9.000 | 0,00 | 326 | 11,30 | ||||
| 2025-07-16 | 13F | ORG Wealth Partners, LLC | 591 | 1,72 | 21 | 10,53 | ||||
| 2025-08-11 | 13F | Wealthspire Advisors, LLC | 97.683 | 64,07 | 3.534 | 82,45 | ||||
| 2025-07-29 | 13F | Private Trust Co Na | 1.000 | 0,00 | 36 | 12,50 | ||||
| 2025-07-10 | 13F | Wealth Enhancement Advisory Services, Llc | 54.707 | 16,46 | 1.967 | 28,73 | ||||
| 2025-08-04 | 13F | HBK Sorce Advisory LLC | 13.067 | 11,07 | 473 | 23,56 | ||||
| 2025-07-18 | 13F | PFG Investments, LLC | 14.280 | 4,18 | 517 | 15,70 | ||||
| 2025-08-08 | 13F | Atlanta Consulting Group Advisors, LLC | 24.534 | 0,22 | 888 | 11,43 | ||||
| 2025-07-21 | 13F | DHJJ Financial Advisors, Ltd. | 98 | 0,00 | 4 | 0,00 | ||||
| 2025-07-24 | 13F | Ronald Blue Trust, Inc. | 1.067 | -25,85 | 39 | -17,39 | ||||
| 2025-08-08 | 13F | Creative Planning | 23.109 | 3,42 | 836 | 14,99 | ||||
| 2025-08-04 | 13F | Flagship Harbor Advisors, Llc | 10.875 | 0,00 | 393 | 11,33 | ||||
| 2025-07-28 | 13F | Harbour Investments, Inc. | 5.152 | 0,00 | 186 | 11,38 | ||||
| 2025-08-22 | NP | Cornerstone Total Return Fund Inc | 250.007 | 92,49 | 9.045 | 114,03 | ||||
| 2025-07-11 | 13F | LongView Wealth Management | 69.680 | 0,10 | 2.521 | 11,30 | ||||
| 2025-08-07 | 13F | Montag A & Associates Inc | 0 | -100,00 | 0 | |||||
| 2025-08-14 | 13F | Raymond James Financial Inc | 287.238 | 17,78 | 10.392 | 30,96 | ||||
| 2025-07-21 | 13F | Ameriflex Group, Inc. | 4.874 | -74,07 | 173 | -71,69 | ||||
| 2025-08-14 | 13F | GWM Advisors LLC | 111.791 | 42,31 | 4.045 | 58,22 | ||||
| 2025-07-23 | 13F | Castle Rock Wealth Management, LLC | 14.736 | 549 | ||||||
| 2025-08-07 | 13F | Merrion Investment Management Co, LLC | 25.000 | 0,00 | 904 | 11,19 | ||||
| 2025-07-31 | 13F | Graybill Bartz & Assoc Ltd | 12.081 | 12,47 | 437 | 25,21 | ||||
| 2025-08-04 | 13F | Integrity Alliance, Llc. | 33.623 | 9,32 | 1.216 | 21,60 | ||||
| 2025-08-14 | 13F | Monetary Management Group Inc | 16.400 | 134,29 | 593 | 161,23 | ||||
| 2025-08-13 | 13F | Hollow Brook Wealth Management LLC | 7.606 | -11,90 | 275 | -1,79 | ||||
| 2025-07-09 | 13F | Bank of New Hampshire | 1.560 | 0,00 | 56 | 12,00 | ||||
| 2025-08-06 | 13F | Prospera Financial Services Inc | 19.496 | 10,14 | 705 | 22,40 | ||||
| 2025-07-16 | 13F | Magnus Financial Group LLC | 203.951 | 9,02 | 7.379 | 21,21 | ||||
| 2025-08-04 | 13F | Keybank National Association/oh | 12.700 | 0,00 | 459 | 11,14 | ||||
| 2025-08-14 | 13F | Benjamin Edwards Inc | 8.644 | 2,64 | 313 | 13,87 | ||||
| 2025-08-14 | 13F | Mariner, LLC | 128.952 | 2,46 | 4.665 | 13,92 | ||||
| 2025-08-11 | 13F | Reaves W H & Co Inc | 88.623 | 1,64 | 3.206 | 13,01 | ||||
| 2025-08-13 | 13F | Strategic Family Wealth Counselors, L.L.C. | 28.073 | -0,67 | 1.016 | 10,45 | ||||
| 2025-04-14 | 13F | Bruce G. Allen Investments, LLC | 0 | -100,00 | 0 | -100,00 | ||||
| 2025-08-13 | 13F | First Trust Advisors Lp | 41.144 | -0,45 | 1.489 | 10,71 | ||||
| 2025-05-16 | 13F | Jones Financial Companies Lllp | 0 | -100,00 | 0 | |||||
| 2025-07-25 | 13F | LRI Investments, LLC | 1.440 | 0,00 | 52 | 13,04 | ||||
| 2025-08-01 | 13F | Envestnet Asset Management Inc | 15.474 | 0,51 | 560 | 11,80 |