Grundlæggende statistik
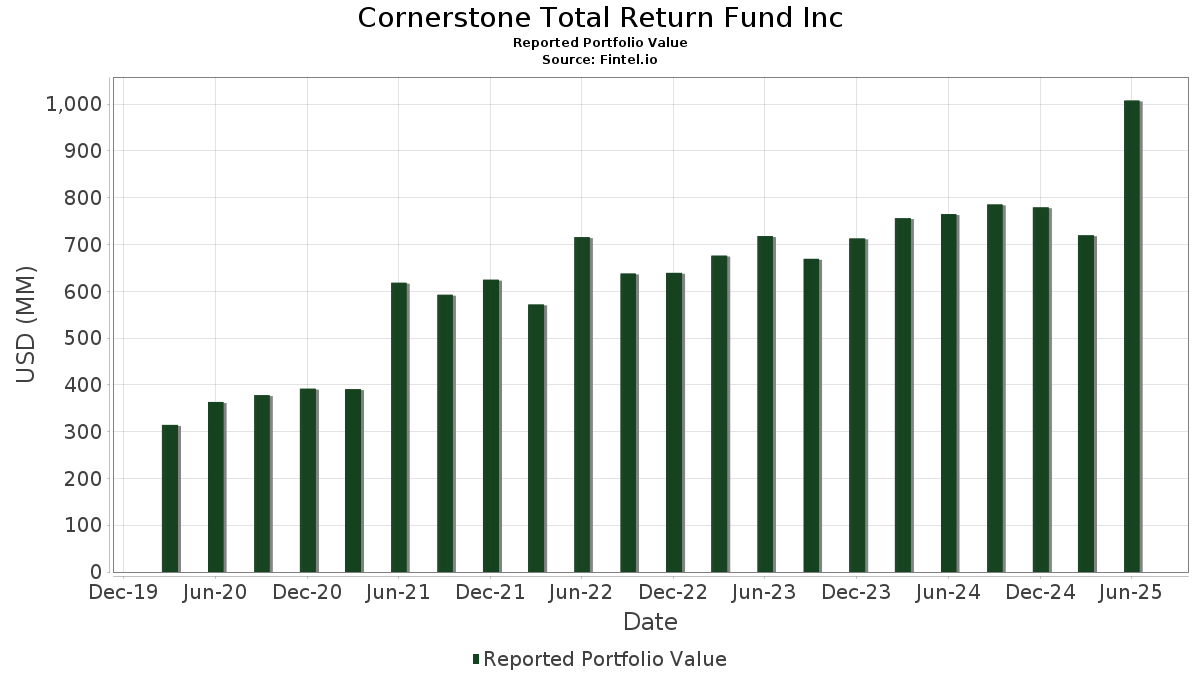
| Porteføljeværdi | $ 1.007.519.800 |
| Nuværende stillinger | 260 |
Seneste beholdninger, ydeevne, AUM (fra 13F, 13D)
Cornerstone Total Return Fund Inc har afsløret 260 samlede besiddelser i deres seneste SEC-arkivering. Den seneste porteføljeværdi er beregnet til at være $ 1.007.519.800 USD. Faktiske aktiver under forvaltning (AUM) er denne værdi plus kontanter (som ikke er oplyst). Cornerstone Total Return Fund Incs største beholdninger er NVIDIA Corporation (US:NVDA) , Apple Inc. (US:AAPL) , Microsoft Corporation (US:MSFT) , Amazon.com, Inc. (US:AMZN) , and Alphabet Inc. (US:GOOG) . Cornerstone Total Return Fund Incs nye stillinger omfatter Fidelity Colchester Street Trust - Fidelity Institutional Money Market Funds Government Portfolio Class I (US:FIGXX) , NXG Cushing Midstream Energy Fund (US:SRV) , The Gabelli Global Utility & Income Trust (US:GLU) , .
Top øger dette kvartal
Vi bruger ændringen i porteføljeallokeringen, fordi dette er den mest meningsfulde metrik. Ændringer kan skyldes handler eller ændringer i aktiekurser.
| Sikkerhed | Aktier (MM) |
Værdi (MM$) |
Portefølje % | ΔPortefølje % |
|---|---|---|---|---|
| 0,45 | 13,10 | 1,3010 | 1,2341 | |
| 0,35 | 55,99 | 5,5592 | 0,9856 | |
| 0,02 | 17,77 | 1,7646 | 0,7780 | |
| 0,05 | 9,01 | 0,8944 | 0,6438 | |
| 0,01 | 8,81 | 0,8751 | 0,6121 | |
| 0,01 | 6,87 | 0,6823 | 0,5529 | |
| 0,18 | 38,90 | 3,8620 | 0,4448 | |
| 0,06 | 7,25 | 0,7203 | 0,4118 | |
| 0,06 | 17,34 | 1,7215 | 0,4005 | |
| 0,24 | 11,45 | 1,1365 | 0,3308 |
Top falder i dette kvartal
Vi bruger ændringen i porteføljeallokeringen, fordi dette er den mest meningsfulde metrik. Ændringer kan skyldes handler eller ændringer i aktiekurser.
| Sikkerhed | Aktier (MM) |
Værdi (MM$) |
Portefølje % | ΔPortefølje % |
|---|---|---|---|---|
| 0,27 | 55,29 | 5,4899 | -1,3971 | |
| 0,13 | 3,34 | 0,3316 | -0,5956 | |
| 0,02 | 2,77 | 0,2745 | -0,5686 | |
| 0,03 | 13,99 | 1,3890 | -0,4383 | |
| 0,09 | 1,21 | 0,1206 | -0,3109 | |
| 0,03 | 8,27 | 0,8209 | -0,2997 | |
| 0,17 | 7,17 | 0,7115 | -0,2942 | |
| 0,08 | 21,04 | 2,0893 | -0,2941 | |
| 0,06 | 17,19 | 1,7069 | -0,2864 | |
| 0,03 | 0,80 | 0,0799 | -0,2670 |
13F og Fondsarkivering
Denne formular blev indsendt den 2025-08-22 for rapporteringsperioden 2025-06-30. Klik på linkikonet for at se den fulde transaktionshistorik.
Opgrader for at låse op for premium-data og eksportere til Excel ![]() .
.
| Sikkerhed | Type | Gennemsnitlig aktiekurs | Aktier (MM) |
Δ Aktier (%) |
Δ Aktier (%) |
Værdi ($MM) |
Portefølje (%) |
ΔPortefølje (%) |
|
|---|---|---|---|---|---|---|---|---|---|
| NVDA / NVIDIA Corporation | 0,35 | 16,66 | 55,99 | 70,06 | 5,5592 | 0,9856 | |||
| AAPL / Apple Inc. | 0,27 | 20,74 | 55,29 | 11,53 | 5,4899 | -1,3971 | |||
| MSFT / Microsoft Corporation | 0,10 | 8,14 | 48,90 | 43,29 | 4,8547 | 0,1147 | |||
| AMZN / Amazon.com, Inc. | 0,18 | 37,12 | 38,90 | 58,12 | 3,8620 | 0,4448 | |||
| GOOG / Alphabet Inc. | 0,21 | 22,27 | 36,81 | 38,84 | 3,6546 | -0,0282 | |||
| META / Meta Platforms, Inc. | 0,03 | 3,37 | 24,87 | 32,38 | 2,4696 | -0,1404 | |||
| XLK / The Select Sector SPDR Trust - The Technology Select Sector SPDR Fund | 0,08 | 0,00 | 21,04 | 22,64 | 2,0893 | -0,2941 | |||
| LLY / Eli Lilly and Company | 0,02 | 165,12 | 17,77 | 150,25 | 1,7646 | 0,7780 | |||
| AVGO / Broadcom Inc. | 0,06 | 10,74 | 17,34 | 82,31 | 1,7215 | 0,4005 | |||
| JPM / JPMorgan Chase & Co. | 0,06 | 1,37 | 17,19 | 19,80 | 1,7069 | -0,2864 | |||
| TSLA / Tesla, Inc. | 0,05 | 13,07 | 15,66 | 38,60 | 1,5549 | -0,0147 | |||
| BRK.B / Berkshire Hathaway Inc. | 0,03 | 16,60 | 13,99 | 6,36 | 1,3890 | -0,4383 | |||
| KMI / Kinder Morgan, Inc. | 0,45 | 2.539,68 | 13,10 | 2.624,12 | 1,3010 | 1,2341 | |||
| HD / The Home Depot, Inc. | 0,03 | 51,58 | 12,28 | 51,65 | 1,2195 | 0,0944 | |||
| NFLX / Netflix, Inc. | 0,01 | 3,41 | 12,19 | 48,50 | 1,2099 | 0,0700 | |||
| BAC / Bank of America Corporation | 0,24 | 74,03 | 11,45 | 97,34 | 1,1365 | 0,3308 | |||
| ETG / Eaton Vance Tax-Advantaged Global Dividend Income Fund | 0,54 | 0,00 | 11,26 | 14,92 | 1,1179 | -0,2430 | |||
| V / Visa Inc. | 0,03 | 11,96 | 10,97 | 13,43 | 1,0893 | -0,2543 | |||
| XOM / Exxon Mobil Corporation | 0,10 | 27,62 | 10,81 | 15,68 | 1,0731 | -0,2248 | |||
| PG / The Procter & Gamble Company | 0,07 | 42,68 | 10,71 | 33,39 | 1,0630 | -0,0520 | |||
| UTG / Reaves Utility Income Fund | 0,25 | 92,49 | 9,05 | 114,03 | 0,8981 | 0,3110 | |||
| DHR / Danaher Corporation | 0,05 | 418,18 | 9,01 | 399,28 | 0,8944 | 0,6438 | |||
| MA / Mastercard Incorporated | 0,02 | 5,37 | 8,82 | 8,03 | 0,8760 | -0,2585 | |||
| BLK / BlackRock, Inc. | 0,01 | 320,00 | 8,81 | 365,80 | 0,8751 | 0,6121 | |||
| CSQ / Calamos Strategic Total Return Fund | 0,48 | 17,37 | 8,75 | 32,31 | 0,8689 | -0,0499 | |||
| BKNG / Booking Holdings Inc. | 0,00 | 0,00 | 8,68 | 25,66 | 0,8622 | -0,0977 | |||
| ABBV / AbbVie Inc. | 0,05 | 75,00 | 8,45 | 55,04 | 0,8385 | 0,0818 | |||
| UNH / UnitedHealth Group Incorporated | 0,03 | 72,06 | 8,27 | 2,49 | 0,8209 | -0,2997 | |||
| COST / Costco Wholesale Corporation | 0,01 | 3,80 | 8,12 | 8,65 | 0,8060 | -0,2319 | |||
| ORCL / Oracle Corporation | 0,04 | 27,18 | 7,98 | 98,88 | 0,7923 | 0,2349 | |||
| KO / The Coca-Cola Company | 0,11 | 64,25 | 7,87 | 62,27 | 0,7811 | 0,1076 | |||
| WMT / Walmart Inc. | 0,08 | 6,02 | 7,75 | 18,08 | 0,7699 | -0,1423 | |||
| XLI / The Select Sector SPDR Trust - The Industrial Select Sector SPDR Fund | 0,05 | 0,00 | 7,67 | 12,56 | 0,7616 | -0,1851 | |||
| DIS / The Walt Disney Company | 0,06 | 160,00 | 7,25 | 226,76 | 0,7203 | 0,4118 | |||
| XLRE / The Select Sector SPDR Trust - The Real Estate Select Sector SPDR Fund | 0,17 | 0,00 | 7,17 | -1,04 | 0,7115 | -0,2942 | |||
| MCO / Moody's Corporation | 0,01 | 585,00 | 6,87 | 638,02 | 0,6823 | 0,5529 | |||
| AMAT / Applied Materials, Inc. | 0,04 | 67,58 | 6,72 | 111,39 | 0,6671 | 0,2256 | |||
| CAT / Caterpillar Inc. | 0,02 | 71,29 | 6,72 | 101,68 | 0,6668 | 0,2041 | |||
| CVX / Chevron Corporation | 0,05 | 91,21 | 6,54 | 63,66 | 0,6497 | 0,0943 | |||
| DE / Deere & Company | 0,01 | 16,83 | 6,00 | 26,58 | 0,5957 | -0,0627 | |||
| GS / The Goldman Sachs Group, Inc. | 0,01 | 36,67 | 5,80 | 77,08 | 0,5762 | 0,1209 | |||
| VZ / Verizon Communications Inc. | 0,13 | 154,48 | 5,78 | 142,76 | 0,5740 | 0,2432 | |||
| NEE / NextEra Energy, Inc. | 0,08 | 52,95 | 5,75 | 49,77 | 0,5714 | 0,0377 | |||
| LOW / Lowe's Companies, Inc. | 0,03 | 72,48 | 5,70 | 64,09 | 0,5661 | 0,0834 | |||
| TMO / Thermo Fisher Scientific Inc. | 0,01 | 150,91 | 5,60 | 104,50 | 0,5555 | 0,1754 | |||
| MCD / McDonald's Corporation | 0,02 | 88,12 | 5,55 | 76,00 | 0,5512 | 0,1129 | |||
| ETN / Eaton Corporation plc | 0,02 | 103,95 | 5,53 | 167,94 | 0,5494 | 0,2624 | |||
| WFC / Wells Fargo & Company | 0,07 | 3,95 | 5,27 | 16,00 | 0,5234 | -0,1078 | |||
| GE / General Electric Company | 0,02 | 0,50 | 5,23 | 29,24 | 0,5188 | -0,0428 | |||
| C / Citigroup Inc. | 0,06 | 58,27 | 5,13 | 89,79 | 0,5096 | 0,1339 | |||
| CRM / Salesforce, Inc. | 0,02 | 40,91 | 5,07 | 43,20 | 0,5036 | 0,0115 | |||
| PM / Philip Morris International Inc. | 0,03 | 20,35 | 5,06 | 38,11 | 0,5027 | -0,0066 | |||
| VRTX / Vertex Pharmaceuticals Incorporated | 0,01 | 239,39 | 4,99 | 211,82 | 0,4951 | 0,2728 | |||
| TJX / The TJX Companies, Inc. | 0,04 | 129,82 | 4,85 | 133,09 | 0,4819 | 0,1925 | |||
| PFE / Pfizer Inc. | 0,20 | 158,99 | 4,85 | 147,80 | 0,4818 | 0,2097 | |||
| SPGI / S&P Global Inc. | 0,01 | 82,00 | 4,80 | 88,90 | 0,4764 | 0,1235 | |||
| MRK / Merck & Co., Inc. | 0,06 | 61,76 | 4,79 | 42,66 | 0,4755 | 0,0092 | |||
| HON / Honeywell International Inc. | 0,02 | 72,03 | 4,73 | 89,23 | 0,4694 | 0,1223 | |||
| LIN / Linde plc | 0,01 | 102,04 | 4,64 | 103,59 | 0,4612 | 0,1442 | |||
| FIGXX / Fidelity Colchester Street Trust - Fidelity Institutional Money Market Funds Government Portfolio Class I | 4,64 | 40,97 | 0,4606 | 0,0035 | |||||
| AMD / Advanced Micro Devices, Inc. | 0,03 | 70,00 | 4,58 | 134,78 | 0,4551 | 0,1839 | |||
| ISRG / Intuitive Surgical, Inc. | 0,01 | 41,38 | 4,46 | 55,12 | 0,4424 | 0,0434 | |||
| UNP / Union Pacific Corporation | 0,02 | 81,90 | 4,39 | 77,18 | 0,4363 | 0,0918 | |||
| ACN / Accenture plc | 0,01 | 59,78 | 4,39 | 53,07 | 0,4362 | 0,0375 | |||
| IBM / International Business Machines Corporation | 0,01 | 0,00 | 4,22 | 18,57 | 0,4185 | -0,0754 | |||
| GILD / Gilead Sciences, Inc. | 0,04 | 113,95 | 4,08 | 111,73 | 0,4051 | 0,1374 | |||
| MMC / Marsh & McLennan Companies, Inc. | 0,02 | 132,50 | 4,07 | 108,30 | 0,4038 | 0,1326 | |||
| RTX / RTX Corporation | 0,03 | 8,17 | 4,06 | 19,24 | 0,4030 | -0,0698 | |||
| ABT / Abbott Laboratories | 0,03 | 25,21 | 4,05 | 28,38 | 0,4024 | -0,0361 | |||
| MS / Morgan Stanley | 0,03 | 19,67 | 4,03 | 44,48 | 0,4000 | 0,0127 | |||
| EMR / Emerson Electric Co. | 0,03 | 204,12 | 3,93 | 269,99 | 0,3905 | 0,2428 | |||
| ADI / Analog Devices, Inc. | 0,02 | 112,99 | 3,90 | 151,48 | 0,3876 | 0,1719 | |||
| AMGN / Amgen Inc. | 0,01 | 73,75 | 3,88 | 55,74 | 0,3853 | 0,0391 | |||
| ELV / Elevance Health, Inc. | 0,01 | 209,38 | 3,85 | 176,78 | 0,3823 | 0,1890 | |||
| SYK / Stryker Corporation | 0,01 | 142,50 | 3,84 | 157,69 | 0,3810 | 0,1742 | |||
| GEV / GE Vernova Inc. | 0,01 | 36,02 | 3,80 | 135,78 | 0,3770 | 0,1533 | |||
| AXP / American Express Company | 0,01 | 43,37 | 3,80 | 69,95 | 0,3769 | 0,0667 | |||
| CB / Chubb Limited | 0,01 | 75,68 | 3,77 | 68,58 | 0,3739 | 0,0635 | |||
| UBER / Uber Technologies, Inc. | 0,04 | 162,75 | 3,75 | 236,62 | 0,3724 | 0,2175 | |||
| MDT / Medtronic plc | 0,04 | 167,31 | 3,63 | 159,39 | 0,3609 | 0,1662 | |||
| ICE / Intercontinental Exchange, Inc. | 0,02 | 112,90 | 3,63 | 126,43 | 0,3607 | 0,1378 | |||
| PEP / PepsiCo, Inc. | 0,03 | 93,57 | 3,58 | 70,46 | 0,3553 | 0,0637 | |||
| ITW / Illinois Tool Works Inc. | 0,01 | 169,81 | 3,54 | 169,03 | 0,3510 | 0,1685 | |||
| CMCSA / Comcast Corporation | 0,09 | 67,32 | 3,34 | 61,86 | 0,3320 | 0,0450 | |||
| QQQX / Nuveen Nasdaq 100 Dynamic Overwrite Fund | 0,13 | -55,10 | 3,34 | -49,96 | 0,3316 | -0,5956 | |||
| BMY / Bristol-Myers Squibb Company | 0,07 | 192,28 | 3,33 | 121,87 | 0,3305 | 0,1220 | |||
| MCK / McKesson Corporation | 0,00 | 66,67 | 3,30 | 81,45 | 0,3274 | 0,0750 | |||
| BSX / Boston Scientific Corporation | 0,03 | 50,16 | 3,28 | 59,87 | 0,3256 | 0,0407 | |||
| GD / General Dynamics Corporation | 0,01 | 114,29 | 3,06 | 129,36 | 0,3041 | 0,1185 | |||
| SHW / The Sherwin-Williams Company | 0,01 | 0,00 | 3,06 | -1,67 | 0,3034 | -0,1283 | |||
| ADP / Automatic Data Processing, Inc. | 0,01 | 39,44 | 3,05 | 40,76 | 0,3031 | 0,0018 | |||
| AON / Aon plc | 0,01 | 179,31 | 2,89 | 149,70 | 0,2869 | 0,1261 | |||
| MNST / Monster Beverage Corporation | 0,05 | 250,38 | 2,88 | 275,33 | 0,2855 | 0,1790 | |||
| CSX / CSX Corporation | 0,09 | 150,29 | 2,86 | 177,48 | 0,2838 | 0,1407 | |||
| SCHW / The Charles Schwab Corporation | 0,03 | 26,72 | 2,86 | 47,70 | 0,2835 | 0,0150 | |||
| WM / Waste Management, Inc. | 0,01 | 77,94 | 2,77 | 75,86 | 0,2749 | 0,0562 | |||
| JNJ / Johnson & Johnson | 0,02 | -50,54 | 2,77 | -54,45 | 0,2745 | -0,5686 | |||
| CI / The Cigna Group | 0,01 | 84,09 | 2,68 | 85,00 | 0,2659 | 0,0648 | |||
| TMUS / T-Mobile US, Inc. | 0,01 | 17,89 | 2,67 | 5,33 | 0,2649 | -0,0870 | |||
| ETJ / Eaton Vance Risk-Managed Diversified Equity Income Fund | 0,29 | 35,14 | 2,66 | 44,41 | 0,2641 | 0,0082 | |||
| BA / The Boeing Company | 0,01 | 21,57 | 2,60 | 49,40 | 0,2580 | 0,0163 | |||
| ORLY / O'Reilly Automotive, Inc. | 0,03 | 2.750,00 | 2,57 | 79,33 | 0,2550 | 0,0560 | |||
| PYPL / PayPal Holdings, Inc. | 0,03 | 100,59 | 2,53 | 128,49 | 0,2516 | 0,0975 | |||
| CEG / Constellation Energy Corporation | 0,01 | 2,69 | 2,46 | 64,42 | 0,2446 | 0,0364 | |||
| COP / ConocoPhillips | 0,03 | 15,02 | 2,41 | -1,68 | 0,2388 | -0,1011 | |||
| PGR / The Progressive Corporation | 0,01 | 15,07 | 2,24 | 8,52 | 0,2226 | -0,0644 | |||
| PSA / Public Storage | 0,01 | 0,00 | 2,23 | -1,98 | 0,2214 | -0,0946 | |||
| NSC / Norfolk Southern Corporation | 0,01 | 123,68 | 2,18 | 141,67 | 0,2160 | 0,0910 | |||
| UPS / United Parcel Service, Inc. | 0,02 | 60,98 | 2,00 | 47,78 | 0,1984 | 0,0105 | |||
| CSCO / Cisco Systems, Inc. | 0,03 | -41,46 | 1,95 | -34,20 | 0,1936 | -0,2179 | |||
| LRCX / Lam Research Corporation | 0,02 | 0,00 | 1,95 | 33,84 | 0,1933 | -0,0087 | |||
| DIAX / Nuveen Dow 30 Dynamic Overwrite Fund | 0,13 | -6,77 | 1,93 | -7,75 | 0,1915 | -0,0989 | |||
| LMT / Lockheed Martin Corporation | 0,00 | 24,24 | 1,90 | 28,77 | 0,1885 | -0,0162 | |||
| ADBE / Adobe Inc. | 0,00 | -16,95 | 1,90 | -16,22 | 0,1882 | -0,1261 | |||
| REGN / Regeneron Pharmaceuticals, Inc. | 0,00 | 0,00 | 1,89 | -17,21 | 0,1877 | -0,1295 | |||
| CTAS / Cintas Corporation | 0,01 | 0,00 | 1,87 | 8,46 | 0,1859 | -0,0539 | |||
| TXN / Texas Instruments Incorporated | 0,01 | 128,95 | 1,81 | 164,81 | 0,1793 | 0,0845 | |||
| CMG / Chipotle Mexican Grill, Inc. | 0,03 | 0,00 | 1,77 | 11,85 | 0,1762 | -0,0442 | |||
| RQI / Cohen & Steers Quality Income Realty Fund, Inc. | 0,14 | 29,54 | 1,71 | 33,52 | 0,1701 | 0,0004 | |||
| TT / Trane Technologies plc | 0,00 | 0,00 | 1,71 | 29,86 | 0,1694 | -0,0131 | |||
| APH / Amphenol Corporation | 0,02 | 0,00 | 1,70 | 50,53 | 0,1686 | 0,0119 | |||
| TDG / TransDigm Group Incorporated | 0,00 | 22,22 | 1,67 | 34,41 | 0,1661 | -0,0069 | |||
| SBUX / Starbucks Corporation | 0,02 | 12,35 | 1,67 | 4,91 | 0,1656 | -0,0552 | |||
| TRV / The Travelers Companies, Inc. | 0,01 | 0,00 | 1,66 | 1,16 | 0,1647 | -0,0631 | |||
| ANET / Arista Networks Inc | 0,02 | 0,00 | 1,64 | 32,04 | 0,1625 | -0,0097 | |||
| FI / Fiserv, Inc. | 0,01 | 0,00 | 1,62 | -21,93 | 0,1609 | -0,1274 | |||
| MU / Micron Technology, Inc. | 0,01 | 0,00 | 1,60 | 41,90 | 0,1591 | 0,0022 | |||
| CME / CME Group Inc. | 0,01 | 0,00 | 1,60 | 3,90 | 0,1587 | -0,0550 | |||
| INTU / Intuit Inc. | 0,00 | -45,95 | 1,58 | -30,65 | 0,1564 | -0,1592 | |||
| MDLZ / Mondelez International, Inc. | 0,02 | -7,57 | 1,56 | -8,16 | 0,1553 | -0,0812 | |||
| MMM / 3M Company | 0,01 | 0,00 | 1,52 | 3,68 | 0,1512 | -0,0528 | |||
| JCI / Johnson Controls International plc | 0,01 | 0,00 | 1,49 | 31,89 | 0,1479 | -0,0090 | |||
| KYN / Kayne Anderson Energy Infrastructure Fund, Inc. | 0,12 | 169,19 | 1,48 | 167,21 | 0,1465 | 0,0697 | |||
| NKE / NIKE, Inc. | 0,02 | 51,09 | 1,47 | 69,16 | 0,1460 | 0,0252 | |||
| PH / Parker-Hannifin Corporation | 0,00 | 0,00 | 1,47 | 14,89 | 0,1456 | -0,0317 | |||
| HCA / HCA Healthcare, Inc. | 0,00 | 0,00 | 1,46 | 10,81 | 0,1445 | -0,0379 | |||
| NOW / ServiceNow, Inc. | 0,00 | 0,00 | 1,44 | 29,17 | 0,1429 | -0,0119 | |||
| USB / U.S. Bancorp | 0,03 | 30,33 | 1,44 | 39,61 | 0,1429 | -0,0002 | |||
| ETO / Eaton Vance Tax-Advantaged Global Dividend Opportunities Fund | 0,05 | -36,35 | 1,42 | -29,59 | 0,1407 | -0,1387 | |||
| PLD / Prologis, Inc. | 0,01 | 0,00 | 1,38 | -5,94 | 0,1367 | -0,0667 | |||
| GM / General Motors Company | 0,03 | 29,86 | 1,35 | 35,89 | 0,1339 | -0,0040 | |||
| COF / Capital One Financial Corporation | 0,01 | 10,71 | 1,32 | 31,37 | 0,1310 | -0,0085 | |||
| FDX / FedEx Corporation | 0,01 | 48,72 | 1,32 | 38,74 | 0,1309 | -0,0012 | |||
| HLT / Hilton Worldwide Holdings Inc. | 0,00 | 0,00 | 1,31 | 17,15 | 0,1296 | -0,0253 | |||
| TGT / Target Corporation | 0,01 | 47,73 | 1,28 | 39,65 | 0,1273 | -0,0002 | |||
| GAM / General American Investors Company, Inc. | 0,02 | -32,34 | 1,28 | -24,73 | 0,1269 | -0,1090 | |||
| MAR / Marriott International, Inc. | 0,00 | 0,00 | 1,26 | 14,70 | 0,1248 | -0,0274 | |||
| NOC / Northrop Grumman Corporation | 0,00 | 0,00 | 1,25 | -2,42 | 0,1241 | -0,0537 | |||
| BK / The Bank of New York Mellon Corporation | 0,01 | 41,67 | 1,24 | 53,91 | 0,1230 | 0,0112 | |||
| BXMX / Nuveen S&P 500 Buy-Write Income Fund | 0,09 | -63,05 | 1,21 | -60,91 | 0,1206 | -0,3109 | |||
| THW / Abrdn World Healthcare Fund | 0,12 | 163,36 | 1,21 | 134,56 | 0,1199 | 0,0483 | |||
| ASG / Liberty All-Star Growth Fund, Inc. | 0,21 | -3,79 | 1,17 | 7,61 | 0,1165 | -0,0350 | |||
| CVS / CVS Health Corporation | 0,02 | 0,00 | 1,14 | 1,88 | 0,1130 | -0,0423 | |||
| PNC / The PNC Financial Services Group, Inc. | 0,01 | 0,00 | 1,14 | 6,06 | 0,1129 | -0,0360 | |||
| VGT / Vanguard World Fund - Vanguard Information Technology ETF | 0,00 | 0,00 | 1,13 | 22,23 | 0,1120 | -0,0161 | |||
| DXCM / DexCom, Inc. | 0,01 | 0,00 | 1,13 | 27,95 | 0,1118 | -0,0106 | |||
| EQIX / Equinix, Inc. | 0,00 | 0,00 | 1,11 | -2,45 | 0,1106 | -0,0480 | |||
| PDT / John Hancock Premium Dividend Fund | 0,08 | 21,10 | 1,09 | 21,92 | 0,1083 | -0,0160 | |||
| GGN / GAMCO Global Gold, Natural Resources & Income Trust | 0,25 | 92,59 | 1,09 | 93,58 | 0,1079 | 0,0299 | |||
| BST / BlackRock Science and Technology Trust | 0,03 | 0,00 | 1,07 | 15,73 | 0,1067 | -0,0223 | |||
| AIG / American International Group, Inc. | 0,01 | 4,20 | 1,06 | 2,61 | 0,1054 | -0,0383 | |||
| EVT / Eaton Vance Tax-Advantaged Dividend Income Fund | 0,04 | 3,29 | 1,06 | 6,98 | 0,1051 | -0,0323 | |||
| CARR / Carrier Global Corporation | 0,01 | 0,00 | 1,05 | 15,46 | 0,1046 | -0,0222 | |||
| QCOM / QUALCOMM Incorporated | 0,01 | 0,00 | 1,05 | 3,75 | 0,1044 | -0,0365 | |||
| WMB / The Williams Companies, Inc. | 0,02 | 0,00 | 1,04 | 5,04 | 0,1035 | -0,0343 | |||
| SNPS / Synopsys, Inc. | 0,00 | 0,00 | 1,03 | 19,60 | 0,1018 | -0,0173 | |||
| VLO / Valero Energy Corporation | 0,01 | 0,00 | 1,01 | 1,82 | 0,1001 | -0,0375 | |||
| AJG / Arthur J. Gallagher & Co. | 0,00 | 0,00 | 0,96 | -7,25 | 0,0954 | -0,0485 | |||
| CMI / Cummins Inc. | 0,00 | 0,00 | 0,95 | 4,52 | 0,0943 | -0,0320 | |||
| ZTS / Zoetis Inc. | 0,01 | 0,00 | 0,94 | -5,27 | 0,0929 | -0,0443 | |||
| NIE / Virtus Equity & Convertible Income Fund | 0,04 | -50,31 | 0,92 | -46,99 | 0,0909 | -0,1373 | |||
| AFL / Aflac Incorporated | 0,01 | 0,00 | 0,91 | -5,23 | 0,0900 | -0,0428 | |||
| EOG / EOG Resources, Inc. | 0,01 | 0,00 | 0,90 | -6,66 | 0,0891 | -0,0445 | |||
| BDX / Becton, Dickinson and Company | 0,01 | 0,00 | 0,90 | -24,85 | 0,0889 | -0,0765 | |||
| MET / MetLife, Inc. | 0,01 | 12,12 | 0,89 | 12,34 | 0,0886 | -0,0218 | |||
| RSG / Republic Services, Inc. | 0,00 | 0,00 | 0,89 | 1,84 | 0,0881 | -0,0330 | |||
| EXC / Exelon Corporation | 0,02 | 0,00 | 0,89 | -5,85 | 0,0879 | -0,0426 | |||
| TFC / Truist Financial Corporation | 0,02 | 0,00 | 0,89 | 4,49 | 0,0879 | -0,0298 | |||
| USA / Liberty All-Star Equity Fund | 0,13 | 6,63 | 0,86 | 10,81 | 0,0856 | -0,0224 | |||
| PSX / Phillips 66 | 0,01 | 0,00 | 0,86 | -3,49 | 0,0853 | -0,0382 | |||
| PAYX / Paychex, Inc. | 0,01 | 0,00 | 0,86 | -5,71 | 0,0852 | -0,0412 | |||
| BTO / John Hancock Financial Opportunities Fund | 0,02 | -41,31 | 0,85 | -39,11 | 0,0842 | -0,1091 | |||
| CII / BlackRock Enhanced Large Cap Core Fund, Inc. | 0,04 | -54,36 | 0,84 | -47,25 | 0,0829 | -0,1370 | |||
| T / AT&T Inc. | 0,03 | -68,52 | 0,80 | -67,80 | 0,0799 | -0,2670 | |||
| HES / Hess Corporation | 0,01 | 0,00 | 0,80 | -13,28 | 0,0798 | -0,0489 | |||
| KMB / Kimberly-Clark Corporation | 0,01 | 0,00 | 0,80 | -9,31 | 0,0794 | -0,0431 | |||
| XLE / The Select Sector SPDR Trust - The Energy Select Sector SPDR Fund | 0,01 | 0,00 | 0,79 | -9,32 | 0,0783 | -0,0424 | |||
| PCAR / PACCAR Inc | 0,01 | 0,00 | 0,78 | -2,38 | 0,0774 | -0,0335 | |||
| INTC / Intel Corporation | 0,03 | -19,86 | 0,76 | -42,06 | 0,0754 | -0,0955 | |||
| PEG / Public Service Enterprise Group Incorporated | 0,01 | 0,00 | 0,76 | 2,30 | 0,0752 | -0,0277 | |||
| F / Ford Motor Company | 0,07 | 0,00 | 0,75 | 8,18 | 0,0749 | -0,0220 | |||
| STK / Columbia Seligman Premium Technology Growth Fund | 0,02 | 0,00 | 0,73 | 8,81 | 0,0724 | -0,0208 | |||
| XEL / Xcel Energy Inc. | 0,01 | 0,00 | 0,67 | -3,71 | 0,0669 | -0,0304 | |||
| RVT / Royce Small-Cap Trust, Inc. | 0,04 | 0,66 | 0,0657 | 0,0657 | |||||
| ROST / Ross Stores, Inc. | 0,01 | 0,00 | 0,65 | -0,15 | 0,0646 | -0,0259 | |||
| SLB / Schlumberger Limited | 0,02 | 0,00 | 0,65 | -19,20 | 0,0644 | -0,0470 | |||
| MSCI / MSCI Inc. | 0,00 | 0,00 | 0,63 | 1,93 | 0,0630 | -0,0234 | |||
| MPC / Marathon Petroleum Corporation | 0,00 | 0,00 | 0,61 | 13,91 | 0,0610 | -0,0139 | |||
| FFA / First Trust Enhanced Equity Income Fund | 0,03 | 185,01 | 0,60 | 202,54 | 0,0592 | 0,0318 | |||
| SRE / Sempra | 0,01 | 0,00 | 0,58 | 6,19 | 0,0579 | -0,0184 | |||
| EBAY / eBay Inc. | 0,01 | 0,00 | 0,58 | 9,85 | 0,0577 | -0,0157 | |||
| DHI / D.R. Horton, Inc. | 0,00 | 0,00 | 0,58 | 1,40 | 0,0576 | -0,0219 | |||
| KDP / Keurig Dr Pepper Inc. | 0,02 | 0,00 | 0,57 | -3,55 | 0,0568 | -0,0254 | |||
| EW / Edwards Lifesciences Corporation | 0,01 | 0,00 | 0,57 | 7,75 | 0,0567 | -0,0168 | |||
| CBRE / CBRE Group, Inc. | 0,00 | 0,00 | 0,56 | 7,07 | 0,0556 | -0,0170 | |||
| ADM / Archer-Daniels-Midland Company | 0,01 | 0,00 | 0,55 | 9,92 | 0,0550 | -0,0150 | |||
| CNC / Centene Corporation | 0,01 | 0,00 | 0,55 | -10,66 | 0,0550 | -0,0310 | |||
| ETV / Eaton Vance Tax-Managed Buy-Write Opportunities Fund | 0,04 | 47,15 | 0,55 | 54,47 | 0,0549 | 0,0052 | |||
| SCD / LMP Capital and Income Fund Inc. | 0,04 | 2.423,43 | 0,55 | 2.404,55 | 0,0547 | 0,0516 | |||
| APD / Air Products and Chemicals, Inc. | 0,00 | 0,00 | 0,54 | -4,46 | 0,0532 | -0,0246 | |||
| ODFL / Old Dominion Freight Line, Inc. | 0,00 | 0,00 | 0,54 | -1,83 | 0,0532 | -0,0227 | |||
| VLTO / Veralto Corporation | 0,01 | 0,00 | 0,53 | 3,73 | 0,0525 | -0,0184 | |||
| O / Realty Income Corporation | 0,01 | 0,00 | 0,51 | -0,78 | 0,0509 | -0,0208 | |||
| HSY / The Hershey Company | 0,00 | 0,00 | 0,48 | -2,83 | 0,0478 | -0,0211 | |||
| NRO / Neuberger Berman Real Estate Securities Income Fund Inc. | 0,15 | 0,00 | 0,48 | -2,44 | 0,0477 | -0,0207 | |||
| XLV / The Select Sector SPDR Trust - The Health Care Select Sector SPDR Fund | 0,00 | 0,00 | 0,46 | -7,66 | 0,0455 | -0,0235 | |||
| NML / Neuberger Berman Energy Infrastructure and Income Fund Inc. | 0,05 | -30,72 | 0,46 | -46,98 | 0,0454 | -0,0686 | |||
| STZ / Constellation Brands, Inc. | 0,00 | 0,00 | 0,46 | -11,31 | 0,0452 | -0,0262 | |||
| AZO / AutoZone, Inc. | 0,00 | 0,00 | 0,45 | -2,63 | 0,0442 | -0,0193 | |||
| AWK / American Water Works Company, Inc. | 0,00 | 0,00 | 0,42 | -5,66 | 0,0414 | -0,0200 | |||
| TY / Tri-Continental Corporation | 0,01 | -33,12 | 0,41 | -33,12 | 0,0411 | -0,0385 | |||
| GDL / The GDL Fund | 0,05 | -3,97 | 0,41 | -2,63 | 0,0405 | -0,0177 | |||
| ACV / Virtus Diversified Income & Convertible Fund | 0,03 | 54,82 | 0,38 | 4,71 | 0,0376 | -0,0131 | |||
| IDXX / IDEXX Laboratories, Inc. | 0,00 | 0,00 | 0,38 | 27,99 | 0,0373 | -0,0036 | |||
| DG / Dollar General Corporation | 0,00 | 0,00 | 0,35 | 30,15 | 0,0352 | -0,0027 | |||
| KHC / The Kraft Heinz Company | 0,01 | 0,00 | 0,35 | -15,01 | 0,0349 | -0,0226 | |||
| EIX / Edison International | 0,01 | 0,00 | 0,35 | -12,50 | 0,0348 | -0,0208 | |||
| DVN / Devon Energy Corporation | 0,01 | 0,00 | 0,35 | -14,99 | 0,0344 | -0,0222 | |||
| OXY / Occidental Petroleum Corporation | 0,01 | 0,00 | 0,34 | -14,72 | 0,0334 | -0,0215 | |||
| SRV / NXG Cushing Midstream Energy Fund | 0,01 | 0,33 | 0,0326 | 0,0326 | |||||
| RGT / Royce Global Trust, Inc. | 0,03 | 45,63 | 0,32 | 67,36 | 0,0321 | 0,0052 | |||
| ECL / Ecolab Inc. | 0,00 | 0,00 | 0,32 | 6,25 | 0,0321 | -0,0102 | |||
| ED / Consolidated Edison, Inc. | 0,00 | 0,00 | 0,31 | -9,06 | 0,0309 | -0,0167 | |||
| PCG / PG&E Corporation | 0,02 | 0,00 | 0,31 | -19,06 | 0,0309 | -0,0224 | |||
| JCE / Nuveen Core Equity Alpha Fund | 0,02 | 483,62 | 0,29 | 528,26 | 0,0287 | 0,0223 | |||
| AMT / American Tower Corporation | 0,00 | -62,86 | 0,29 | -62,29 | 0,0285 | -0,0773 | |||
| ASGI / Abrdn Global Infrastructure Income Fund | 0,01 | -67,76 | 0,28 | -64,30 | 0,0275 | -0,0803 | |||
| NCV / Virtus Convertible & Income Fund | 0,01 | 112,32 | 0,27 | 122,69 | 0,0263 | 0,0097 | |||
| AEP / American Electric Power Company, Inc. | 0,00 | 0,00 | 0,26 | -5,13 | 0,0258 | -0,0122 | |||
| GIS / General Mills, Inc. | 0,00 | 0,00 | 0,25 | -13,36 | 0,0252 | -0,0155 | |||
| NUE / Nucor Corporation | 0,00 | 0,00 | 0,22 | 7,84 | 0,0219 | -0,0066 | |||
| CL / Colgate-Palmolive Company | 0,00 | -76,47 | 0,18 | -77,26 | 0,0181 | -0,0926 | |||
| HTD / John Hancock Tax-Advantaged Dividend Income Fund | 0,01 | -40,61 | 0,15 | -31,25 | 0,0153 | -0,0139 | |||
| CTVA / Corteva, Inc. | 0,00 | 0,00 | 0,12 | 19,00 | 0,0118 | -0,0021 | |||
| ETB / Eaton Vance Tax-Managed Buy-Write Income Fund | 0,01 | -61,22 | 0,11 | -58,97 | 0,0111 | -0,0268 | |||
| CCI / Crown Castle Inc. | 0,00 | 0,00 | 0,10 | -1,92 | 0,0102 | -0,0043 | |||
| FCX / Freeport-McMoRan Inc. | 0,00 | 0,00 | 0,10 | 13,79 | 0,0099 | -0,0022 | |||
| D / Dominion Energy, Inc. | 0,00 | 0,00 | 0,10 | 1,05 | 0,0095 | -0,0037 | |||
| SBAC / SBA Communications Corporation | 0,00 | 0,00 | 0,09 | 5,68 | 0,0093 | -0,0029 | |||
| DUK / Duke Energy Corporation | 0,00 | -86,00 | 0,08 | -86,54 | 0,0082 | -0,0765 | |||
| EXR / Extra Space Storage Inc. | 0,00 | 0,00 | 0,07 | -1,35 | 0,0073 | -0,0030 | |||
| JRS / Nuveen Real Estate Income Fund | 0,01 | -83,81 | 0,07 | -84,20 | 0,0070 | -0,0517 | |||
| MRNA / Moderna, Inc. | 0,00 | 0,00 | 0,05 | -3,92 | 0,0049 | -0,0022 | |||
| RFI / Cohen & Steers Total Return Realty Fund, Inc. | 0,00 | -74,82 | 0,05 | -75,27 | 0,0046 | -0,0212 | |||
| MO / Altria Group, Inc. | 0,00 | -97,52 | 0,03 | -97,61 | 0,0029 | -0,1655 | |||
| GGZ / The Gabelli Global Small and Mid Cap Value Trust | 0,00 | -80,48 | 0,03 | -78,81 | 0,0025 | -0,0139 | |||
| ALB / Albemarle Corporation | 0,00 | 0,00 | 0,03 | -10,71 | 0,0025 | -0,0015 | |||
| GCV / The Gabelli Convertible and Income Securities Fund Inc. | 0,01 | 128,18 | 0,02 | 133,33 | 0,0022 | 0,0009 | |||
| GLU / The Gabelli Global Utility & Income Trust | 0,00 | 0,02 | 0,0021 | 0,0021 | |||||
| DPG / Duff & Phelps Utility and Infrastructure Fund Inc. | 0,00 | 0,01 | 0,0006 | 0,0006 |