Grundlæggende statistik
| Institutionelle ejere | 109 total, 109 long only, 0 short only, 0 long/short - change of 21,11% MRQ |
| Gennemsnitlig porteføljeallokering | 0.2889 % - change of -24,41% MRQ |
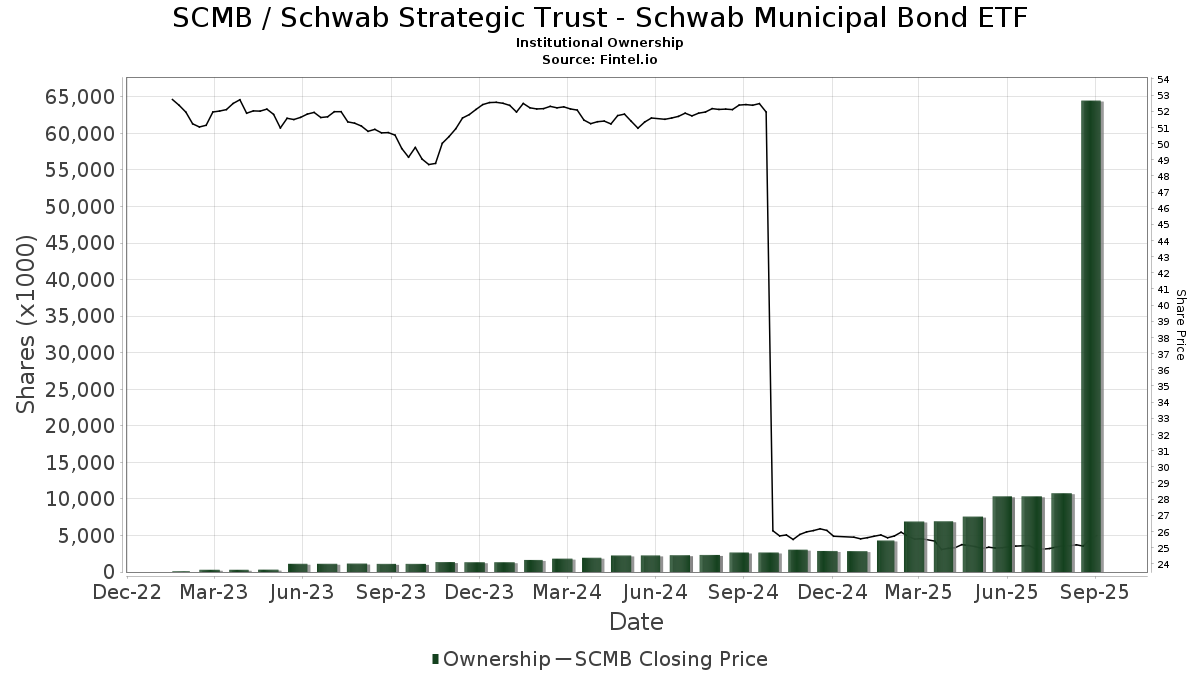
| Institutionelle aktier (lange) | 64.482.964 (ex 13D/G) - change of 54,13MM shares 522,99% MRQ |
| Institutionel værdi (lang) | $ 1.614.862 USD ($1000) |
Institutionelt ejerskab og aktionærer
Schwab Strategic Trust - Schwab Municipal Bond ETF (US:SCMB) har 109 institutionelle ejere og aktionærer, der har indsendt 13D/G- eller 13F-formularer til Securities Exchange Commission (SEC). Disse institutioner har i alt 64,482,964 aktier. Største aktionærer omfatter Charles Schwab Investment Management Inc, Jones Financial Companies Lllp, Fort Point Capital Partners LLC, Pallas Capital Advisors LLC, Charles Schwab Trust Co, Jane Street Group, Llc, Wedmont Private Capital, United Capital Financial Advisers, Llc, Bank Of America Corp /de/, and Envestnet Asset Management Inc .
Schwab Strategic Trust - Schwab Municipal Bond ETF (ARCA:SCMB) institutionel ejerskabsstruktur viser aktuelle positioner i virksomheden efter institutioner og fonde, samt seneste ændringer i positionsstørrelse. Større aktionærer kan omfatte individuelle investorer, investeringsforeninger, hedgefonde eller institutioner. Skema 13D angiver, at investoren besidder (eller besidder) mere end 5 % af virksomheden og har til hensigt (eller har til hensigt at) aktivt at forfølge en ændring i forretningsstrategi. Skema 13G indikerer en passiv investering på over 5%.
The share price as of September 12, 2025 is 25,64 / share. Previously, on September 13, 2024, the share price was 26,18 / share. This represents a decline of 2,07% over that period.
Fondens stemningsscore
Fund Sentiment Score (fka Ownership Accumulation Score) finder de aktier, der bliver mest købt af fonde. Det er resultatet af en sofistikeret, multi-faktor kvantitativ model, der identificerer virksomheder med de højeste niveauer af institutionel akkumulering. Scoringsmodellen bruger en kombination af den samlede stigning i oplyste ejere, ændringerne i porteføljeallokeringer i disse ejere og andre målinger. Tallet går fra 0 til 100, hvor højere tal indikerer et højere niveau af akkumulering for sine jævnaldrende, og 50 er gennemsnittet.
Opdateringsfrekvens: Dagligt
Se Ownership Explorer, som giver en liste over højest rangerende virksomheder.
Institutionel Put/Call-forhold
Ud over at indberette standardaktie- og gældsudstedelser skal institutter med mere end 100 mill. aktiver under forvaltning også oplyse deres put- og call-optionsbeholdninger. Da salgsoptioner generelt indikerer negativ stemning, og købsoptioner indikerer positiv stemning, kan vi få en fornemmelse af den overordnede institutionelle stemning ved at plotte forholdet mellem put og kald. Diagrammet til højre viser det historiske put/call-forhold for dette instrument.
Brug af Put/Call Ratio som en indikator for investorernes stemning overvinder en af de vigtigste mangler ved at bruge totalt institutionelt ejerskab, som er, at en betydelig mængde af aktiver under forvaltning investeres passivt for at spore indekser. Passivt forvaltede fonde køber typisk ikke optioner, så indikatoren for put/call-forholdet følger mere nøje følelsen af aktivt forvaltede fonde.
13F og NPORT arkivering
Detaljer om 13F-arkivering er gratis. Detaljer om NP-ansøgninger kræver et premium-medlemskab. Grønne rækker angiver nye positioner. Røde rækker angiver lukkede positioner. Klik på linket ikon for at se den fulde transaktionshistorik.
Opgrader
for at låse premium-data op og eksportere til Excel ![]() .
.
| Fil dato | Kilde | Investor | Type | Gennemsnitlig pris (Øst) |
Aktier | Δ Aktier (%) |
Rapporteret Værdi ($1000) |
Δ Værdi (%) |
Port Alloc (%) |
|
|---|---|---|---|---|---|---|---|---|---|---|
| 2025-08-11 | 13F | United Capital Financial Advisers, Llc | 462.276 | 164,93 | 11.640 | 162,99 | ||||
| 2025-08-14 | 13F | Goldman Sachs Group Inc | 0 | -100,00 | 0 | |||||
| 2025-08-14 | 13F | Mariner, LLC | 8.200 | 0,00 | 206 | -0,96 | ||||
| 2025-07-30 | 13F | VCI Wealth Management LLC | 15.982 | 3,26 | 402 | 2,55 | ||||
| 2025-07-23 | 13F | West Paces Advisors Inc. | 6.615 | -37,39 | 167 | -38,06 | ||||
| 2025-07-25 | 13F | Ackerman Capital Advisors, LLC | 69.482 | 1.750 | ||||||
| 2025-08-08 | 13F | Larson Financial Group LLC | 3.809 | 277,88 | 96 | 280,00 | ||||
| 2025-08-15 | 13F | Kestra Advisory Services, LLC | 31.904 | 7,41 | 803 | 6,64 | ||||
| 2025-08-19 | 13F | Anchor Investment Management, LLC | 0 | -100,00 | 0 | |||||
| 2025-07-17 | 13F | Halbert Hargrove Global Advisors, Llc | 700 | 18 | ||||||
| 2025-07-22 | 13F | Compass Financial Group, INC/SD | 23.036 | 2,40 | 580 | 1,75 | ||||
| 2025-08-14 | 13F | Quantinno Capital Management LP | 91.765 | 2.311 | ||||||
| 2025-08-12 | 13F | Charles Schwab Investment Management Inc | 52.643.707 | 4.409,67 | 1.325.569 | 4.376,00 | ||||
| 2025-07-24 | 13F | VanderPol Investments L.L.C. | 83.785 | -3,03 | 2.110 | -3,74 | ||||
| 2025-08-14 | 13F | Warren Averett Asset Management, LLC | 18.202 | 458 | ||||||
| 2025-08-15 | 13F | Captrust Financial Advisors | 55.477 | 43,36 | 1.397 | 42,30 | ||||
| 2025-07-18 | 13F | Northeast Financial Group, Inc. | 51.676 | 34,08 | 1.301 | 33,16 | ||||
| 2025-07-30 | 13F | Paul Damon & Associates, Inc. | 24.527 | 5,50 | 618 | 4,75 | ||||
| 2025-08-13 | 13F | Natixis Advisors, L.p. | 119.749 | 333,53 | 3 | |||||
| 2025-07-31 | 13F | Cambridge Investment Research Advisors, Inc. | 33.205 | 1 | ||||||
| 2025-04-23 | 13F | Carl Stuart Investment Advisor, Inc | 0 | -100,00 | 0 | |||||
| 2025-08-14 | 13F | Raymond James Financial Inc | 4.368 | 110 | ||||||
| 2025-07-09 | 13F | Breakwater Investment Management | 9.740 | 245 | ||||||
| 2025-07-31 | 13F | TSA Wealth Managment LLC | 52.747 | 85,70 | 1.328 | 84,44 | ||||
| 2025-08-08 | 13F | Cetera Investment Advisers | 44.660 | -24,20 | 1.125 | -24,77 | ||||
| 2025-08-12 | 13F | Putnam Fl Investment Management Co | 8.329 | -68,68 | 210 | -68,99 | ||||
| 2025-07-16 | 13F | Perigon Wealth Management, LLC | 179.898 | 8,92 | 4.530 | 8,09 | ||||
| 2025-08-14 | 13F | Bank Of America Corp /de/ | 453.989 | -1,14 | 11.431 | -1,88 | ||||
| 2025-08-14 | 13F | Coastal Bridge Advisors, LLC | 47.202 | -2,73 | 1.189 | -3,49 | ||||
| 2025-08-12 | 13F | Bedel Financial Consulting, Inc. | 10.513 | 5,64 | 265 | 6,02 | ||||
| 2025-08-15 | 13F | Morgan Stanley | 1 | 0 | ||||||
| 2025-07-08 | 13F | FF Advisors,LLC | 17.981 | 0,00 | 453 | 0,22 | ||||
| 2025-07-31 | 13F | CVA Family Office, LLC | 700 | -71,83 | 18 | -73,02 | ||||
| 2025-08-19 | 13F | National Asset Management, Inc. | 0 | -100,00 | 0 | |||||
| 2025-07-30 | 13F | Avidian Wealth Solutions, LLC | 77.355 | 1.948 | ||||||
| 2025-08-14 | 13F | Citadel Advisors Llc | 0 | -100,00 | 0 | |||||
| 2025-07-09 | 13F | Pallas Capital Advisors LLC | 755.515 | 12,89 | 19.024 | 12,04 | ||||
| 2025-09-04 | 13F/A | Advisor Group Holdings, Inc. | 34.249 | -11,94 | 862 | -12,58 | ||||
| 2025-07-22 | 13F | Rochester Wealth Strategies, LLC | 0 | -100,00 | 0 | |||||
| 2025-04-29 | 13F | Truist Financial Corp | 0 | -100,00 | 0 | |||||
| 2025-07-08 | 13F | Heartwood Wealth Advisors LLC | 9.243 | 233 | ||||||
| 2025-08-11 | 13F | Elequin Capital Lp | 100.000 | 2.518 | ||||||
| 2025-07-28 | NP | SPMFX - Symmetry Panoramic Municipal Fixed Income Fund Class I Shares | 154.000 | 0,00 | 3.856 | -3,53 | ||||
| 2025-08-14 | 13F | Mml Investors Services, Llc | 78.195 | 97,72 | 2 | 0,00 | ||||
| 2025-08-06 | 13F | Commonwealth Equity Services, Llc | 12.108 | 0 | ||||||
| 2025-08-26 | 13F/A | Thrivent Financial For Lutherans | 0 | -100,00 | 0 | |||||
| 2025-07-09 | 13F | Breakwater Capital Group | 8.194 | 206 | ||||||
| 2025-08-15 | 13F | Asset Allocation Strategies LLC | 10.609 | -4,65 | 267 | -5,32 | ||||
| 2025-08-04 | 13F | Grant Street Asset Management, Inc. | 15.776 | 0,71 | 397 | 0,00 | ||||
| 2025-08-14 | 13F | Jane Street Group, Llc | 522.022 | 143,51 | 13.145 | 141,71 | ||||
| 2025-08-11 | 13F | Aptus Capital Advisors, LLC | 205 | 0,00 | 5 | 0,00 | ||||
| 2025-07-15 | 13F | Garrett Investment Advisors LLC | 207.164 | -11,49 | 5.216 | -12,14 | ||||
| 2025-08-01 | 13F | Envestnet Asset Management Inc | 320.242 | 44,83 | 8.064 | 43,75 | ||||
| 2025-08-14 | 13F | Wells Fargo & Company/mn | 1 | 0 | ||||||
| 2025-08-12 | 13F | Howe & Rusling Inc | 8.174 | 206 | ||||||
| 2025-08-14 | 13F | Mercer Global Advisors Inc /adv | 25.812 | 0,19 | 650 | -0,61 | ||||
| 2025-07-16 | 13F | Vestia Personal Wealth Advisors | 18.728 | 472 | ||||||
| 2025-08-12 | 13F | Jpmorgan Chase & Co | 128.813 | 165,54 | 3.244 | 163,66 | ||||
| 2025-08-14 | 13F | Aqr Capital Management Llc | 58.755 | 1.479 | ||||||
| 2025-07-28 | 13F | Harbour Investments, Inc. | 9.252 | 101,48 | 233 | 100,00 | ||||
| 2025-07-24 | 13F | Galvin, Gaustad & Stein, LLC | 17.628 | 3,76 | 444 | 2,78 | ||||
| 2025-07-03 | 13F | Trinity Financial Advisors LLC | 0 | -100,00 | 0 | |||||
| 2025-08-11 | 13F | Root Financial Partners, LLC | 22.672 | 0,00 | 571 | -0,87 | ||||
| 2025-07-24 | 13F | IFP Advisors, Inc | 3.290 | 0,00 | 83 | -1,20 | ||||
| 2025-07-22 | 13F | Gemmer Asset Management LLC | 13.831 | 33,76 | 348 | 32,82 | ||||
| 2025-08-07 | 13F | Donaldson Capital Management, Llc | 41.887 | 0,00 | 1.055 | -0,75 | ||||
| 2025-07-11 | 13F | Myecfo, Llc | 145.160 | 9,34 | 3.659 | 9,03 | ||||
| 2025-07-17 | 13F | Charles Schwab Trust Co | 733.104 | 38,73 | 18.460 | 37,69 | ||||
| 2025-07-23 | 13F | Columbus Macro, LLC | 43.946 | -26,79 | 1.107 | -27,33 | ||||
| 2025-08-13 | 13F | Northwestern Mutual Wealth Management Co | 1.258 | 0,00 | 32 | 0,00 | ||||
| 2025-08-12 | 13F | Proequities, Inc. | 0 | 0 | ||||||
| 2025-07-21 | 13F | Pflug Koory, LLC | 12 | 0,00 | 0 | |||||
| 2025-07-22 | 13F | Red Tortoise LLC | 377 | -8,50 | 9 | -10,00 | ||||
| 2025-08-19 | 13F | Cape Investment Advisory, Inc. | 510 | 0,59 | 13 | 0,00 | ||||
| 2025-07-17 | 13F | Janney Montgomery Scott LLC | 75.000 | 15,38 | 2 | 0,00 | ||||
| 2025-04-29 | 13F | Element Wealth, LLC | 0 | -100,00 | 0 | |||||
| 2025-05-13 | 13F | EPG Wealth Management LLC | 0 | -100,00 | 0 | -100,00 | ||||
| 2025-08-13 | 13F | Continuum Advisory, LLC | 14.631 | 1.728,88 | 368 | 1.740,00 | ||||
| 2025-08-07 | 13F | Allworth Financial LP | 0 | -100,00 | 0 | |||||
| 2025-05-13 | 13F | UBS Group AG | 0 | -100,00 | 0 | |||||
| 2025-07-18 | 13F | O'ROURKE & COMPANY, Inc | 76.021 | -14,09 | 1.914 | -14,74 | ||||
| 2025-08-12 | 13F | CIBC Private Wealth Group, LLC | 6.000 | 0,00 | 151 | 2,03 | ||||
| 2025-07-17 | 13F | Legacy Wealth Management, Inc | 34.193 | 182,35 | 861 | 180,13 | ||||
| 2025-07-22 | 13F | Berger Financial Group, Inc | 20.644 | -15,94 | 520 | -16,69 | ||||
| 2025-08-08 | 13F | Capital Investment Advisory Services, LLC | 0 | -100,00 | 0 | |||||
| 2025-04-21 | 13F | Nelson, Van Denburg & Campbell Wealth Management Group, LLC | 0 | -100,00 | 0 | |||||
| 2025-08-13 | 13F | Smith, Moore & Co. | 44.860 | 1.130 | ||||||
| 2025-08-13 | 13F | Capital Analysts, Inc. | 3.874 | 38,80 | 0 | |||||
| 2025-08-08 | 13F | Francis Financial, Inc. | 42.671 | 1.074 | ||||||
| 2025-08-12 | 13F | Change Path, LLC | 16.337 | 33,35 | 411 | 32,58 | ||||
| 2025-08-14 | 13F | Susquehanna International Group, Llp | 0 | -100,00 | 0 | |||||
| 2025-08-06 | 13F | Adviser Investments LLC | 98.812 | -27,98 | 2.488 | -28,51 | ||||
| 2025-08-14 | 13F | Peapack Gladstone Financial Corp | 22.598 | 1 | ||||||
| 2025-07-21 | 13F | Investment Planning Advisors, Inc. | 62.039 | 11,85 | 1.562 | 11,02 | ||||
| 2025-08-13 | 13F | Jones Financial Companies Lllp | 2.950.244 | 14,40 | 74.258 | 13,61 | ||||
| 2025-07-23 | 13F | Pure Portfolios Holdings Llc | 87.748 | 481,69 | 2.209 | 478,27 | ||||
| 2025-08-14 | 13F | Fort Point Capital Partners LLC | 1.241.508 | 90,21 | 31.261 | 88,80 | ||||
| 2025-07-31 | 13F | CAP Partners, LLC | 14.554 | 8,18 | 366 | 7,33 | ||||
| 2025-07-14 | 13F | AdvisorNet Financial, Inc | 32.128 | 0,00 | 809 | -0,86 | ||||
| 2025-08-12 | 13F | Blueprint Financial Advisors LLC | 24.245 | 610 | ||||||
| 2025-08-08 | 13F | Emerald Investment Partners, Llc | 5.724 | 0,00 | 144 | -0,69 | ||||
| 2025-08-04 | 13F | Assetmark, Inc | 738 | 19 | ||||||
| 2025-08-12 | 13F | MAI Capital Management | 24.802 | 1,69 | 625 | 0,97 | ||||
| 2025-07-10 | 13F | Wealth Enhancement Advisory Services, Llc | 134.584 | 136,07 | 3.377 | 133,47 | ||||
| 2025-08-15 | 13F | Chapman Financial Group, Llc | 5.800 | 0,00 | 146 | -1,35 | ||||
| 2025-04-18 | 13F | Bell Bank | 0 | -100,00 | 0 | |||||
| 2025-07-21 | 13F | Ameritas Advisory Services, LLC | 5.530 | 139 | ||||||
| 2025-08-08 | 13F | Burling Wealth Partners, Llc | 8.625 | 217 | ||||||
| 2025-08-05 | 13F | Golden Bell Financial Planning LLC | 15.455 | 12,31 | 389 | 11,46 | ||||
| 2025-08-14 | 13F | Beaird Harris Wealth Management, LLC | 209.152 | -1,25 | 5.266 | -1,99 | ||||
| 2025-08-08 | 13F | Meridian Wealth Management, LLC | 57.392 | 0,10 | 1.445 | -0,62 | ||||
| 2025-08-08 | 13F | Altiora Financial Group, LLC | 20.000 | 0,00 | 504 | -0,79 | ||||
| 2025-08-14 | 13F | Royal Bank Of Canada | 130.722 | 3.292 | ||||||
| 2025-08-08 | 13F | Cornerstone Advisors Asset Management, Inc | 85.203 | 5,03 | 2.145 | 4,28 | ||||
| 2025-08-04 | 13F | Creative Financial Designs Inc /adv | 53.969 | -6,13 | 1.359 | -6,86 | ||||
| 2025-08-08 | 13F | Creative Planning | 34.647 | -2,54 | 872 | -3,22 | ||||
| 2025-08-06 | 13F | AE Wealth Management LLC | 672 | -30,72 | 17 | -33,33 | ||||
| 2025-07-10 | 13F | Wedmont Private Capital | 489.484 | -14,78 | 12.296 | -13,15 | ||||
| 2025-07-03 | 13F | Fiduciary Financial Group, Llc | 12.844 | -37,58 | 323 | -36,74 | ||||
| 2025-08-27 | 13F/A | Brinker Capital Investments, LLC | 10.689 | 269 | ||||||
| 2025-08-04 | 13F | Savvy Advisors, Inc. | 0 | -100,00 | 0 | |||||
| 2025-07-25 | 13F | Sequoia Financial Advisors, LLC | 14.791 | -19,88 | 372 | -20,51 | ||||
| 2025-08-14 | 13F | Great Valley Advisor Group, Inc. | 15.285 | 385 | ||||||
| 2025-08-15 | 13F | CI Private Wealth, LLC | 52.852 | 1.331 | ||||||
| 2025-04-28 | 13F | BCO Wealth Management LLC | 0 | -100,00 | 0 | |||||
| 2025-08-12 | 13F | LPL Financial LLC | 12.516 | 315 | ||||||
| 2025-07-31 | 13F | Resonant Capital Advisors, LLC | 41.046 | 13,36 | 1.034 | 12,53 | ||||
| 2025-08-13 | 13F | SageView Advisory Group, LLC | 9.940 | 248 | ||||||
| 2025-08-11 | 13F | HighTower Advisors, LLC | 10.083 | 254 | ||||||
| 2025-04-21 | 13F | LifeGoal Wealth Advisors | 0 | -100,00 | 0 |