Grundlæggende statistik
| Institutionelle aktier (lange) | 46.260.534 - 93,00% (ex 13D/G) - change of -10,05MM shares -17,85% MRQ |
| Institutionel værdi (lang) | $ 6.945.730 USD ($1000) |
Institutionelt ejerskab og aktionærer
Onto Innovation Inc. (US:ONTO) har 507 institutionelle ejere og aktionærer, der har indsendt 13D/G- eller 13F-formularer til Securities Exchange Commission (SEC). Disse institutioner har i alt 46,260,534 aktier. Største aktionærer omfatter Vanguard Group Inc, BlackRock, Inc., William Blair Investment Management, Llc, State Street Corp, Franklin Resources Inc, Wellington Management Group Llp, Geode Capital Management, Llc, Paradigm Capital Management Inc/ny, Voya Investment Management Llc, and Thrivent Financial For Lutherans .
Onto Innovation Inc. (NYSE:ONTO) institutionel ejerskabsstruktur viser aktuelle positioner i virksomheden efter institutioner og fonde, samt seneste ændringer i positionsstørrelse. Større aktionærer kan omfatte individuelle investorer, investeringsforeninger, hedgefonde eller institutioner. Skema 13D angiver, at investoren besidder (eller besidder) mere end 5 % af virksomheden og har til hensigt (eller har til hensigt at) aktivt at forfølge en ændring i forretningsstrategi. Skema 13G indikerer en passiv investering på over 5%.
The share price as of April 30, 2026 is 295,06 / share. Previously, on May 2, 2025, the share price was 127,10 / share. This represents an increase of 132,15% over that period.

Fondens stemningsscore
Fund Sentiment Score (fka Ownership Accumulation Score) finder de aktier, der bliver mest købt af fonde. Det er resultatet af en sofistikeret, multi-faktor kvantitativ model, der identificerer virksomheder med de højeste niveauer af institutionel akkumulering. Scoringsmodellen bruger en kombination af den samlede stigning i oplyste ejere, ændringerne i porteføljeallokeringer i disse ejere og andre målinger. Tallet går fra 0 til 100, hvor højere tal indikerer et højere niveau af akkumulering for sine jævnaldrende, og 50 er gennemsnittet.
Opdateringsfrekvens: Dagligt
Se Ownership Explorer, som giver en liste over højest rangerende virksomheder.
AI+ Ask Fintel’s AI assistant about Onto Innovation Inc..
Select a question to share a public post with an AI-crafted answer.
Thinking of good questions…
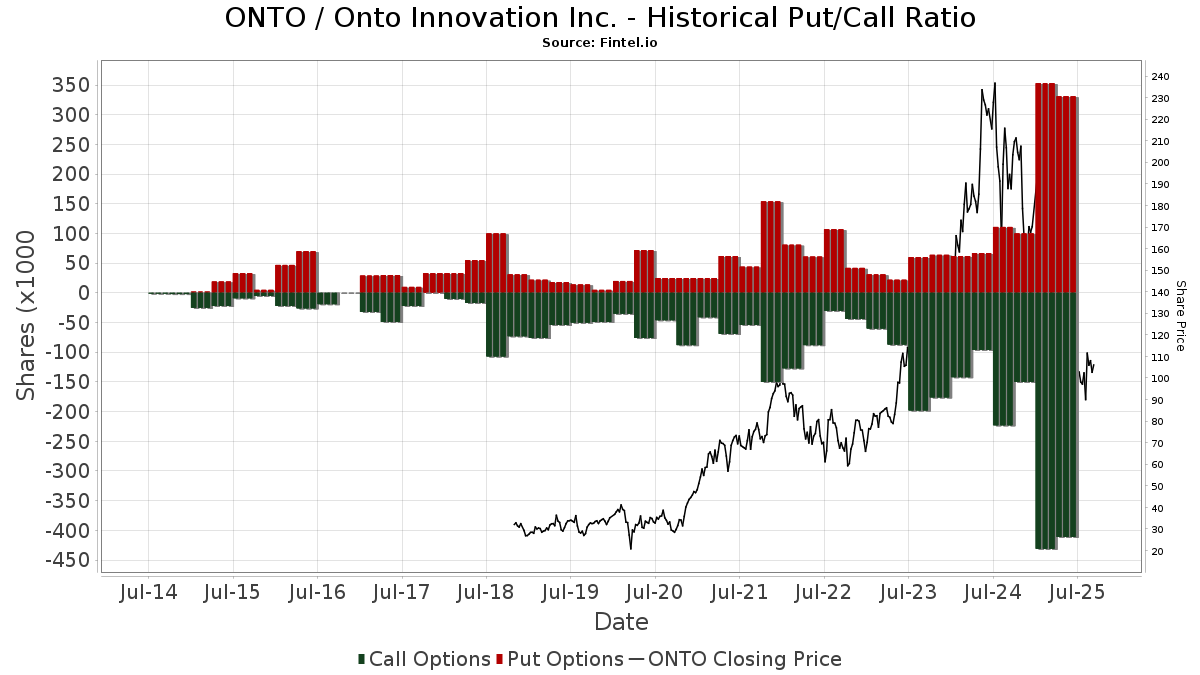
Institutionel Put/Call-forhold
Ud over at indberette standardaktie- og gældsudstedelser skal institutter med mere end 100 mill. aktiver under forvaltning også oplyse deres put- og call-optionsbeholdninger. Da salgsoptioner generelt indikerer negativ stemning, og købsoptioner indikerer positiv stemning, kan vi få en fornemmelse af den overordnede institutionelle stemning ved at plotte forholdet mellem put og kald. Diagrammet til højre viser det historiske put/call-forhold for dette instrument.
Brug af Put/Call Ratio som en indikator for investorernes stemning overvinder en af de vigtigste mangler ved at bruge totalt institutionelt ejerskab, som er, at en betydelig mængde af aktiver under forvaltning investeres passivt for at spore indekser. Passivt forvaltede fonde køber typisk ikke optioner, så indikatoren for put/call-forholdet følger mere nøje følelsen af aktivt forvaltede fonde.
13D/G-arkivering
Vi præsenterer 13D/G ansøgninger separat fra 13F ansøgninger på grund af den forskellige behandling af SEC. 13D/G-ansøgninger kan indgives af grupper af investorer (med én ledende), hvorimod 13F-ansøgninger ikke kan. Dette resulterer i situationer, hvor en investor kan indsende en 13D/G, der rapporterer én værdi for de samlede aktier (der repræsenterer alle de aktier, der ejes af investorgruppen), men derefter indsender en 13F, der rapporterer en anden værdi for de samlede aktier (der udelukkende repræsenterer deres egne) ejendomsret). Det betyder, at aktieejerskab af 13D/G-arkiver og 13F-arkiveringer ofte ikke er direkte sammenlignelige, så vi præsenterer dem separat.
Bemærk: Fra den 16. maj 2021 viser vi ikke længere ejere, der ikke har indsendt en 13D/G inden for det seneste år. Tidligere viste vi den fulde historie af 13D/G-arkiver. Generelt skal enheder, der er forpligtet til at indgive 13D/G-ansøgninger, indgive mindst årligt, før de indsender en afsluttende ansøgning. Dog forlader fonde nogle gange positioner uden at indsende en afsluttende ansøgning (dvs. de afvikler), så visning af den fulde historie resulterede nogle gange i forvirring om det nuværende ejerskab. For at undgå forvirring viser vi nu kun 'aktuelle' ejere - det vil sige - ejere, der har anmeldt inden for det seneste år.
Upgrade to unlock premium data.
| Fil dato | Form | Investor | Forrige Aktier |
Seneste Aktier |
Δ Aktier (Procent) |
Ejendomsret (Procent) |
Δ Ejerskab (Procent) |
|
|---|---|---|---|---|---|---|---|---|
| 2026-04-29 | VANGUARD CAPITAL MANAGEMENT LLC | 2,602,830 | 5.23 | |||||
| 2026-04-29 | VANGUARD PORTFOLIO MANAGEMENT LLC | 2,751,547 | 5.53 | |||||
| 2026-03-27 | VANGUARD GROUP INC | 5,188,815 | 0 | -100.00 | 0.00 | -100.00 | ||
| 2025-10-17 | BlackRock, Inc. | 5,590,269 | 5,039,082 | -9.86 | 10.30 | -8.85 |
13F og NPORT arkivering
Detaljer om 13F-arkivering er gratis. Detaljer om NP-ansøgninger kræver et premium-medlemskab. Grønne rækker angiver nye positioner. Røde rækker angiver lukkede positioner. Klik på linket ikon for at se den fulde transaktionshistorik.
Opgrader
for at låse premium-data op og eksportere til Excel ![]() .
.
| Fil dato | Kilde | Investor | Type | Gennemsnitlig pris (Øst) |
Aktier | Δ Aktier (%) |
Rapporteret Værdi ($1000) |
Δ Værdi (%) |
Port Alloc (%) |
|
|---|---|---|---|---|---|---|---|---|---|---|
| 2026-02-17 | 13F | Tudor Investment Corp Et Al | Put | 0 | -100,00 | 0 | -100,00 | |||
| 2026-02-02 | 13F | Nkcfo Llc | 0 | -100,00 | 0 | |||||
| 2026-02-03 | 13F | International Assets Investment Management, Llc | 6 | 1 | ||||||
| 2026-02-17 | 13F | Tudor Investment Corp Et Al | Call | 0 | -100,00 | 0 | -100,00 | |||
| 2026-02-17 | 13F | Susquehanna International Group, Llp | 4.321 | -95,05 | 682 | -93,95 | ||||
| 2026-02-10 | 13F | Future Fund LLC | 14.727 | 2.325 | ||||||
| 2026-04-30 | 13F | Teacher Retirement System Of Texas | 4.269 | -57,40 | 875 | -44,69 | ||||
| 2026-04-30 | 13F | Nisa Investment Advisors, Llc | 2.730 | 19,68 | 560 | 55,28 | ||||
| 2026-02-17 | 13F | Ameriprise Financial Inc | 112.058 | 4,14 | 17.689 | 27,22 | ||||
| 2026-02-17 | 13F | Susquehanna International Group, Llp | Put | 33.400 | -61,92 | 5.273 | -53,48 | |||
| 2026-04-20 | 13F | Peoples Financial Services Corp. | 1.595 | -0,50 | 327 | 29,25 | ||||
| 2026-04-24 | 13F | UMA Financial Services, Inc. | 4 | 0,00 | 1 | |||||
| 2026-02-12 | 13F | EntryPoint Capital, LLC | 1.323 | 209 | ||||||
| 2026-02-13 | 13F | Nicholas Investment Partners, LP | 24.095 | 3.804 | ||||||
| 2026-02-17 | 13F | Susquehanna International Group, Llp | Call | 69.500 | -22,86 | 10.971 | -5,76 | |||
| 2026-02-04 | 13F | Securian Asset Management, Inc | 3.530 | -2,75 | 557 | 18,76 | ||||
| 2026-02-05 | 13F | North Dakota State Investment Board | 1.729 | 273 | ||||||
| 2026-02-09 | 13F | New Age Alpha Advisors, LLC | 5.974 | 943 | ||||||
| 2026-04-20 | 13F | Ronald Blue Trust, Inc. | 300 | -26,11 | 62 | -4,69 | ||||
| 2026-04-06 | 13F | GAMMA Investing LLC | 1.244 | 26,29 | 255 | 64,52 | ||||
| 2026-04-24 | 13F | Key FInancial Inc | 16 | 0,00 | 3 | 50,00 | ||||
| 2026-02-13 | 13F | Kennedy Capital Management, Inc. | 184.005 | 237,72 | 29.047 | 312,60 | ||||
| 2026-02-12 | 13F | New York State Common Retirement Fund | 219.521 | 87,25 | 34.654 | 128,76 | ||||
| 2026-02-09 | 13F | Keating Financial Advisory Services, Inc. | 17 | 3 | ||||||
| 2026-02-13 | 13F | Brown Advisory Inc | 2.863 | -23,61 | 452 | -6,61 | ||||
| 2026-02-13 | 13F | Dockside LLC | 12.933 | 2.042 | ||||||
| 2026-04-17 | 13F | Krilogy Financial LLC | 2.769 | 0,54 | 740 | 29,88 | ||||
| 2026-04-24 | 13F | Bellevue Asset Management, Llc | 0 | -100,00 | 0 | |||||
| 2026-02-17 | 13F | First Manhattan Co | 0 | -100,00 | 0 | |||||
| 2026-02-03 | 13F | B. Riley Financial, Inc. | 0 | -100,00 | 0 | -100,00 | ||||
| 2026-02-10 | 13F | Bank of New York Mellon Corp | 600.793 | 23,31 | 94.841 | 50,64 | ||||
| 2026-04-17 | 13F | Fifth Third Wealth Advisors LLC | 1.173 | 241 | ||||||
| 2026-04-27 | 13F | Truist Financial Corp | 4.708 | -11,85 | 965 | 14,47 | ||||
| 2026-02-03 | 13F | Pier Capital, LLC | 58.183 | -20,26 | 9.185 | -2,60 | ||||
| 2026-02-05 | 13F | Elyxium Wealth, LLC | 9 | 1 | ||||||
| 2026-04-24 | 13F | Private Advisor Group, LLC | 2.009 | -12,65 | 412 | 13,22 | ||||
| 2026-02-10 | 13F | Td Asset Management Inc | 9.198 | 1.452 | ||||||
| 2026-02-02 | 13F | Fifth Third Bancorp | 2.510 | 15,14 | 396 | 40,93 | ||||
| 2026-04-07 | 13F | Park Avenue Securities Llc | 1.153 | 0 | ||||||
| 2026-02-12 | 13F | AI-Squared Management Ltd | 0 | -100,00 | 0 | |||||
| 2026-04-27 | 13F | Leonteq Securities AG | 1.412 | 11.666,67 | 290 | 28.800,00 | ||||
| 2026-02-06 | 13F | Mitsubishi UFJ Asset Management (UK) Ltd. | 9.500 | 2 | ||||||
| 2026-04-30 | 13F | LRI Investments, LLC | 525 | 0,00 | 108 | 30,49 | ||||
| 2026-04-15 | 13F | Exchange Traded Concepts, Llc | 1.611 | 30,34 | 330 | 69,23 | ||||
| 2026-02-12 | 13F | California Public Employees Retirement System | 84.317 | 2,57 | 13.310 | 25,31 | ||||
| 2026-02-13 | 13F | Johnson Investment Counsel Inc | 0 | -100,00 | 0 | |||||
| 2026-02-13 | 13F | Mariner, LLC | 21.981 | 1.310,85 | 3.472 | 1.626,87 | ||||
| 2025-11-14 | 13F | Algert Global Llc | 0 | -100,00 | 0 | -100,00 | ||||
| 2026-04-30 | 13F | Kestra Advisory Services, LLC | 1.368 | 4,91 | 281 | 36,59 | ||||
| 2026-02-17 | 13F | MIRAE ASSET GLOBAL ETFS HOLDINGS Ltd. | 0 | -100,00 | 0 | |||||
| 2026-04-10 | 13F | Linden Thomas Advisory Services, LLC | 6.625 | -0,26 | 1.359 | 29,58 | ||||
| 2026-02-11 | 13F | Westfield Capital Management Co Lp | 483.082 | 1,80 | 76.259 | 24,37 | ||||
| 2026-02-17 | 13F | Advisory Services Network, LLC | 10.351 | 3,37 | 1.634 | 26,28 | ||||
| 2026-02-17 | 13F | California State Teachers Retirement System | 46.504 | -2,12 | 7.341 | 19,58 | ||||
| 2026-02-13 | 13F | Silvant Capital Management LLC | 5.560 | 0,58 | 878 | 22,83 | ||||
| 2026-02-13 | 13F | Squarepoint Ops LLC | 0 | -100,00 | 0 | -100,00 | ||||
| 2026-02-13 | 13F | Wexford Capital Lp | 9.179 | -45,82 | 1.449 | -33,81 | ||||
| 2025-11-12 | 13F | NewSquare Capital LLC | 0 | -100,00 | 0 | |||||
| 2026-01-29 | 13F | Rakuten Securities, Inc. | 11 | -74,42 | 2 | -80,00 | ||||
| 2026-02-06 | 13F | Tredje AP-fonden | 90.000 | 14.207 | ||||||
| 2026-02-13 | 13F | MAI Capital Management | 69 | 762,50 | 11 | 900,00 | ||||
| 2026-02-13 | 13F | Acumen Wealth Advisors, LLC | 98 | 15 | ||||||
| 2026-04-16 | 13F | Stanley-Laman Group, Ltd. | 29.337 | -3,84 | 6.016 | 24,94 | ||||
| 2026-04-30 | 13F | Mv Capital Management, Inc. | 1 | 0 | ||||||
| 2026-02-10 | 13F | Commonwealth Of Pennsylvania Public School Empls Retrmt Sys | 12.265 | -2,48 | 1.936 | 19,14 | ||||
| 2026-02-17 | 13F | Shelton Capital Management | 1.617 | -7,71 | 255 | 12,83 | ||||
| 2026-04-13 | 13F | St Germain D J Co Inc | 0 | -100,00 | 0 | |||||
| 2026-02-09 | 13F | Quest Partners LLC | 2.440 | -0,37 | 385 | 21,84 | ||||
| 2026-02-17 | 13F | Cresset Asset Management, LLC | 1.764 | 5,44 | 278 | 28,70 | ||||
| 2025-11-26 | 13F/A | Jpmorgan Chase & Co | Call | 0 | -100,00 | 0 | -100,00 | |||
| 2026-04-16 | 13F | Beese Fulmer Investment Management, Inc. | 1.033 | 212 | ||||||
| 2026-02-11 | 13F | CLARET ASSET MANAGEMENT Corp | 2.314 | -0,22 | 0 | |||||
| 2026-02-13 | 13F | Ieq Capital, Llc | 32.272 | 5.094 | ||||||
| 2026-02-11 | 13F | Rise Advisors, LLC | 0 | -100,00 | 0 | |||||
| 2026-02-19 | 13F | Invesco Ltd. | 126.941 | 17,95 | 20.039 | 44,10 | ||||
| 2026-01-29 | 13F | Vanguard Group Inc | 5.576.305 | -1,61 | 880.276 | 20,20 | ||||
| 2026-02-11 | 13F | Twin Tree Management, LP | 1.260 | 232,45 | 199 | 312,50 | ||||
| 2025-11-14 | 13F | WealthTrust Axiom LLC | 0 | -100,00 | 0 | -100,00 | ||||
| 2026-04-23 | 13F | Oppenheimer & Co Inc | 4.395 | -1,79 | 901 | 27,62 | ||||
| 2026-04-24 | 13F | Root Financial Partners, LLC | 277 | 55,62 | 57 | 100,00 | ||||
| 2026-04-24 | 13F | TT International Asset Management LTD | 0 | -100,00 | 0 | |||||
| 2026-04-27 | 13F | New York State Teachers Retirement System | 52.397 | -2,95 | 11 | 25,00 | ||||
| 2026-01-15 | 13F | Allspring Global Investments Holdings, LLC | 271.610 | 148,78 | 45.052 | 200,68 | ||||
| 2026-02-11 | 13F | Twin Tree Management, LP | Put | 6.200 | 979 | |||||
| 2026-02-04 | 13F | Pacer Advisors, Inc. | 0 | -100,00 | 0 | |||||
| 2026-01-13 | 13F | Value Holdings Management Co. Llc | 152.375 | 0,00 | 24 | 26,32 | ||||
| 2026-02-12 | 13F | Andra AP-fonden | 0 | -100,00 | 0 | |||||
| 2026-04-15 | 13F | Bayforest Capital Ltd | 157 | -77,18 | 32 | -70,37 | ||||
| 2026-02-13 | 13F | First National Bank Of Omaha | 15.243 | -0,84 | 2.406 | 21,15 | ||||
| 2026-01-28 | 13F | DekaBank Deutsche Girozentrale | 1.705 | 0,00 | 0 | |||||
| 2026-01-28 | 13F | Chicago Partners Investment Group LLC | 1.377 | 292 | ||||||
| 2026-02-12 | 13F | Castleark Management Llc | 42.970 | 6.783 | ||||||
| 2026-02-17 | 13F | Graham Capital Management, L.P. | 0 | -100,00 | 0 | |||||
| 2026-01-26 | 13F | Cwm, Llc | 20.068 | 361,23 | 3 | |||||
| 2026-04-27 | 13F | Ethic Inc. | 5.033 | -0,04 | 1.032 | 29,97 | ||||
| 2026-02-10 | 13F/A | Northwestern Mutual Wealth Management Co | 773 | 1.446,00 | 122 | 1.933,33 | ||||
| 2025-11-13 | 13F | Quantitative Investment Management, LLC | 0 | -100,00 | 0 | |||||
| 2026-02-17 | 13F | Public Employees Retirement System Of Ohio | 14.937 | -3,55 | 2.358 | 17,79 | ||||
| 2026-02-13 | 13F | Peak6 Llc | Call | 0 | -100,00 | 0 | ||||
| 2026-02-10 | 13F | Acadian Asset Management Llc | 14.701 | 271,80 | 2 | |||||
| 2026-02-12 | 13F | Paradigm Capital Management Inc/ny | 1.125.838 | 1,17 | 177.725 | 23,59 | ||||
| 2026-02-10 | 13F | Sivia Capital Partners, LLC | 1.876 | 296 | ||||||
| 2026-02-13 | 13F | Peak6 Llc | Put | 0 | -100,00 | 0 | ||||
| 2026-02-13 | 13F | Peak6 Llc | 0 | -100,00 | 0 | |||||
| 2026-02-12 | 13F | Voya Investment Management Llc | 971.242 | 11,82 | 153.007 | 36,65 | ||||
| 2026-02-12 | 13F | BRILLIANCE ASSET MANAGEMENT Ltd | 0 | -100,00 | 0 | |||||
| 2026-02-06 | 13F | Cullen/frost Bankers, Inc. | 7 | 0,00 | 1 | |||||
| 2026-04-29 | 13F | Skopos Labs, Inc. | 6.019 | 59,02 | 1.234 | 104,98 | ||||
| 2026-02-13 | 13F | Cornerstone Financial Management LLC | 8 | 1 | ||||||
| 2026-02-17 | 13F | Jump Financial, LLC | 0 | -100,00 | 0 | |||||
| 2026-02-13 | 13F | Victory Capital Management Inc | 89.688 | -21,28 | 14.158 | -3,83 | ||||
| 2026-02-13 | 13F | Walleye Trading LLC | Call | 1.700 | -51,43 | 268 | -40,71 | |||
| 2026-02-13 | 13F | Walleye Trading LLC | 489 | -93,58 | 77 | -92,17 | ||||
| 2026-02-13 | 13F | Walleye Trading LLC | Put | 5.100 | -43,96 | 805 | -31,49 | |||
| 2026-02-03 | 13F | Mitsubishi UFJ Kokusai Asset Management Co., Ltd. | 110 | 0,00 | 18 | 28,57 | ||||
| 2026-04-22 | 13F | Pictet Asset Management Holding SA | 16.336 | 114,95 | 3.350 | 179,40 | ||||
| 2026-02-10 | 13F | Bruce G. Allen Investments, LLC | 34 | 0,00 | 5 | 25,00 | ||||
| 2026-02-13 | 13F | Transamerica Financial Advisors, Inc. | 176 | 188,52 | 28 | 285,71 | ||||
| 2026-02-13 | 13F | Caitong International Asset Management Co., Ltd | 0 | -100,00 | 0 | |||||
| 2026-02-17 | 13F | Boothbay Fund Management, Llc | 2.217 | -95,20 | 350 | -94,15 | ||||
| 2026-02-17 | 13F | RMB Capital Management, LLC | 1.293 | 204 | ||||||
| 2026-04-28 | 13F | K.J. Harrison & Partners Inc | 4.000 | 820 | ||||||
| 2026-04-23 | 13F | SJS Investment Consulting Inc. | 38 | 31,03 | 8 | 75,00 | ||||
| 2026-02-13 | 13F | Manufacturers Life Insurance Company, The | 0 | -100,00 | 0 | |||||
| 2026-04-08 | 13F | Canandaigua National Corp | 1.206 | 247 | ||||||
| 2026-02-13 | 13F | Integrated Wealth Concepts LLC | 27.414 | 1.364,42 | 4.328 | 1.695,44 | ||||
| 2026-04-30 | 13F | Whipplewood Advisors, LLC | 7 | 1 | ||||||
| 2026-02-13 | 13F | General American Investors Co Inc | 80.000 | 12.629 | ||||||
| 2026-04-13 | 13F | Kmg Fiduciary Partners, Llc | 1.000 | 205 | ||||||
| 2026-02-17 | 13F | D. E. Shaw & Co., Inc. | Put | 0 | -100,00 | 0 | ||||
| 2026-04-10 | 13F | RTD Financial Advisors, Inc. | 2.000 | 0,00 | 410 | 30,16 | ||||
| 2026-02-06 | 13F | Larson Financial Group LLC | 2.721 | 9,89 | 430 | 34,48 | ||||
| 2026-02-17 | 13F | Atom Investors LP | 28.349 | -19,52 | 4.475 | -1,67 | ||||
| 2026-04-23 | 13F | Ami Asset Management Corp | 2.542 | 521 | ||||||
| 2026-01-29 | 13F | UBS Group AG | 256.731 | -59,44 | 40.528 | -50,45 | ||||
| 2026-02-06 | 13F | CloudAlpha Capital Management Limited/Hong Kong | Call | 0 | -100,00 | 0 | ||||
| 2026-02-17 | 13F | Magnetar Financial LLC | 0 | -100,00 | 0 | |||||
| 2026-01-30 | 13F | Turning Point Benefit Group, Inc. | 4 | 0,00 | 1 | |||||
| 2026-02-06 | 13F | Gsa Capital Partners Llp | 0 | -100,00 | 0 | |||||
| 2026-02-06 | 13F | CloudAlpha Capital Management Limited/Hong Kong | 0 | -100,00 | 0 | |||||
| 2026-02-11 | 13F | Janney Montgomery Scott LLC | 0 | -100,00 | 0 | |||||
| 2026-01-07 | 13F | Aventura Private Wealth, LLC | 0 | -100,00 | 0 | |||||
| 2026-02-09 | 13F | Huntington National Bank | 198 | 20,00 | 31 | 47,62 | ||||
| 2026-02-17 | 13F | Laird Norton Trust Company, Llc | 2.388 | 377 | ||||||
| 2026-04-30 | 13F | Palisades Investment Partners, LLC | 22.215 | 7,67 | 4.556 | 39,85 | ||||
| 2026-04-13 | 13F | Mather Group, Llc. | 120 | 25 | ||||||
| 2026-02-09 | 13F | Systematic Financial Management Lp | 196.798 | -0,11 | 31.067 | 22,03 | ||||
| 2026-02-17 | 13F | Oddo Bhf Asset Management Sas | 0 | -100,00 | 0 | |||||
| 2026-02-09 | 13F | Emerald Mutual Fund Advisers Trust | 75.385 | 0,00 | 11.900 | 22,16 | ||||
| 2026-04-28 | 13F | Stephens Investment Management Group LLC | 135.369 | 27.760 | ||||||
| 2026-02-17 | 13F | Creative Planning | 35.582 | 32,30 | 5.617 | 61,61 | ||||
| 2025-11-14 | 13F | Texas Permanent School Fund | 0 | -100,00 | 0 | -100,00 | ||||
| 2026-02-17 | 13F | Alta Park Capital, LP | 122.617 | -2,77 | 19.356 | 18,78 | ||||
| 2026-02-11 | 13F | Clearbridge Investments, LLC | 217.336 | 0,14 | 34.309 | 22,34 | ||||
| 2026-02-12 | 13F | Xponance, Inc. | 5.741 | -11,36 | 906 | 8,37 | ||||
| 2026-02-10 | 13F | CIBC Asset Management Inc | 1.560 | 0,00 | 246 | 22,39 | ||||
| 2026-04-15 | 13F | Trust Point Inc. | 3.102 | -9,19 | 636 | 18,00 | ||||
| 2026-04-30 | 13F | Cambridge Investment Research Advisors, Inc. | 12.946 | 7,80 | 3 | 100,00 | ||||
| 2026-02-06 | 13F | TimesSquare Capital Management, LLC | 233.111 | 8,76 | 36.799 | 32,87 | ||||
| 2026-02-13 | 13F | Pinpoint Asset Management (Singapore) Pte. Ltd. | 0 | -100,00 | 0 | |||||
| 2026-02-13 | 13F | Gts Securities Llc | 0 | -100,00 | 0 | |||||
| 2026-02-04 | 13F | Virginia Retirement Systems Et Al | 11.150 | 79,84 | 1.760 | 119,73 | ||||
| 2026-02-11 | 13F | Empowered Funds, LLC | 1.689 | 0,78 | 267 | 23,15 | ||||
| 2026-04-20 | 13F | Banque Cantonale Vaudoise | 471 | -10,29 | 97 | 16,87 | ||||
| 2026-02-17 | 13F | Janus Henderson Group Plc | 94.871 | 340,32 | 14.977 | 438,12 | ||||
| 2026-02-17 | 13F | Dark Forest Capital Management Lp | 0 | -100,00 | 0 | -100,00 | ||||
| 2026-04-15 | 13F | Financial Management Professionals, Inc. | 2 | 0,00 | 0 | |||||
| 2026-02-11 | 13F | Group One Trading, L.p. | 0 | -100,00 | 0 | -100,00 | ||||
| 2026-02-17 | 13F | Pinnacle Financial Partners, Inc. | 5.915 | 934 | ||||||
| 2026-02-17 | 13F | Prelude Capital Management, Llc | 11.286 | -2,26 | 1.782 | 19,37 | ||||
| 2026-02-05 | 13F | Unconventional Investor, LLC | 1.676 | 0,00 | 265 | 22,22 | ||||
| 2026-04-23 | 13F | Forum Financial Management, LP | 0 | -100,00 | 0 | |||||
| 2026-02-17 | 13F | Elequin Capital Lp | 5 | 0,00 | 1 | |||||
| 2026-04-29 | 13F | Hughes Financial Services, LLC | 4 | 1 | ||||||
| 2026-02-03 | 13F | Crossmark Global Holdings, Inc. | 2.868 | 0,21 | 453 | 22,49 | ||||
| 2026-02-13 | 13F | Bridgefront Capital, LLC | 3.268 | 516 | ||||||
| 2026-02-13 | 13F | Stifel Financial Corp | 35.115 | 18,32 | 5.543 | 44,54 | ||||
| 2026-02-17 | 13F | Aqr Capital Management Llc | 615.651 | 315,80 | 97.187 | 407,98 | ||||
| 2026-02-11 | 13F | Meeder Advisory Services, Inc. | 1.421 | 224 | ||||||
| 2026-02-13 | 13F | Greenline Wealth Management LLC | 42 | 7 | ||||||
| 2026-01-05 | 13F | Union Bancaire Privee, UBP SA | 0 | -100,00 | 0 | -100,00 | ||||
| 2026-02-17 | 13F | State Of Wisconsin Investment Board | 66.916 | 9,28 | 10.563 | 33,51 | ||||
| 2026-01-29 | 13F | Teachers Retirement System Of The State Of Kentucky | 13.969 | 0,00 | 2 | 100,00 | ||||
| 2026-04-23 | 13F | Marquette Asset Management, LLC | 4 | 1 | ||||||
| 2026-02-17 | 13F | ExodusPoint Capital Management, LP | 0 | -100,00 | 0 | -100,00 | ||||
| 2025-11-14 | 13F | Weiss Asset Management LP | 42.907 | 5.544 | ||||||
| 2026-02-17 | 13F | ExodusPoint Capital Management, LP | Call | 0 | -100,00 | 0 | -100,00 | |||
| 2026-02-17 | 13F | Defiance ETFs, LLC | 237.212 | 37.956 | ||||||
| 2026-04-22 | 13F | Sterling Capital Management LLC | 5.329 | 129,80 | 1.093 | 198,36 | ||||
| 2026-02-13 | 13F | Nicolet Advisory Services, Llc | 2.213 | -28,41 | 423 | 1,20 | ||||
| 2026-02-12 | 13F | Federated Hermes, Inc. | 32.032 | -63,46 | 5.057 | -55,36 | ||||
| 2026-02-13 | 13F | Pathstone Holdings, LLC | 27.400 | 6,08 | 4.325 | 29,61 | ||||
| 2026-04-24 | 13F | ProShare Advisors LLC | 8.176 | -17,74 | 1.677 | 6,89 | ||||
| 2026-01-23 | 13F | Assetmark, Inc | 46 | 155,56 | 7 | 250,00 | ||||
| 2026-01-29 | 13F | State Of Michigan Retirement System | 11.600 | -0,85 | 1.831 | 21,18 | ||||
| 2026-04-13 | 13F | True Wealth Design, LLC | 116 | 4,50 | 24 | 35,29 | ||||
| 2026-02-13 | 13F | Sei Investments Co | 43.176 | 130,54 | 6.816 | 181,61 | ||||
| 2026-02-17 | 13F | Gotham Asset Management, LLC | 200.494 | -0,45 | 31.650 | 21,61 | ||||
| 2026-02-12 | 13F | Commonwealth Equity Services, Llc | 2.194 | -20,16 | 346 | |||||
| 2026-02-12 | 13F | Wealthspire Advisors, LLC | 0 | -100,00 | 0 | |||||
| 2026-02-17 | 13F | SummitTX Capital, L.P. | 96.633 | 15.254 | ||||||
| 2026-02-17 | 13F | D. E. Shaw & Co., Inc. | 517.189 | -48,43 | 81.643 | -37,00 | ||||
| 2026-02-17 | 13F | Millennium Management Llc | 495.000 | -17,46 | 78.141 | 0,83 | ||||
| 2026-02-03 | 13F | Legacy Wealth Managment, LLC/ID | 25 | 0,00 | 4 | 0,00 | ||||
| 2026-02-12 | 13F | Brown Brothers Harriman & Co | 0 | -100,00 | 0 | |||||
| 2026-04-16 | 13F | Campbell Newman Asset Management Inc | 23.211 | 1,90 | 4.760 | 32,38 | ||||
| 2026-02-17 | 13F | Brevan Howard Capital Management LP | 0 | -100,00 | 0 | |||||
| 2026-04-24 | 13F | Keybank National Association/oh | 3.204 | -19,29 | 657 | 4,95 | ||||
| 2026-02-02 | 13F | Cornerstone Planning Group LLC | 8 | -82,61 | 2 | |||||
| 2026-02-05 | 13F | Amalgamated Bank | 22.374 | -1,28 | 4 | 50,00 | ||||
| 2026-02-17 | 13F | Point72 Asset Management, L.P. | 384.767 | 34,91 | 60.739 | 64,81 | ||||
| 2026-02-04 | 13F | Swiss Life Asset Management Ltd | 2.295 | 0,00 | 362 | 22,30 | ||||
| 2026-04-15 | 13F | FNY Investment Advisers, LLC | 1.353 | 96,37 | 0 | |||||
| 2026-04-22 | 13F | Ticino Wealth | 20.226 | -2,84 | 4.371 | 32,99 | ||||
| 2026-02-06 | 13F | Cedar Wealth Management, LLC | 2.277 | 359 | ||||||
| 2026-02-05 | 13F | Bessemer Group Inc | 175.763 | -7,33 | 28 | 12,50 | ||||
| 2026-01-28 | 13F | Peregrine Capital Management Llc | 0 | -100,00 | 0 | |||||
| 2026-04-30 | 13F | Sequoia Financial Advisors, LLC | 19.176 | -3,39 | 3.932 | 25,50 | ||||
| 2026-02-03 | 13F | Washington Trust Advisors, Inc. | 0 | -100,00 | 0 | |||||
| 2026-04-24 | 13F | Strs Ohio | 1.163 | -0,17 | 238 | 30,05 | ||||
| 2026-02-12 | 13F | Jane Street Group, Llc | Put | 7.600 | -79,57 | 1.200 | -75,05 | |||
| 2026-02-12 | 13F | Jane Street Group, Llc | Call | 35.200 | -33,96 | 5.557 | -19,33 | |||
| 2026-02-12 | 13F | Jane Street Group, Llc | 2.015 | 12,26 | 318 | 37,66 | ||||
| 2026-04-24 | 13F | Raiffeisen Bank International AG | 5.852 | 4,33 | 1.200 | 33,78 | ||||
| 2026-02-06 | 13F | Fortis Group Advisors, LLC | 2.723 | 18,91 | 550 | 77,99 | ||||
| 2025-11-05 | 13F | Azzad Asset Management Inc /adv | 0 | -100,00 | 0 | |||||
| 2026-02-12 | 13F | MetLife Investment Management, LLC | 24.464 | -4,78 | 3.862 | 16,33 | ||||
| 2026-02-17 | 13F | Two Sigma Advisers, Lp | 0 | -100,00 | 0 | |||||
| 2026-02-17 | 13F | Ardmore Road Asset Management LP | 78.101 | 12.329 | ||||||
| 2026-02-06 | 13F | Legato Capital Management LLC | 8.893 | -4,15 | 1.404 | 17,11 | ||||
| 2026-02-13 | 13F | Verition Fund Management LLC | 22.449 | 214,99 | 3.544 | 285,11 | ||||
| 2025-11-14 | 13F | Point72 Asia (Singapore) Pte. Ltd. | 12.155 | 1.571 | ||||||
| 2026-02-17 | 13F | Tudor Investment Corp Et Al | 45.826 | 7.234 | ||||||
| 2026-04-17 | 13F | AdvisorNet Financial, Inc | 716 | 0,42 | 147 | 30,36 | ||||
| 2025-11-14 | 13F | Port Capital LLC | 0 | -100,00 | 0 | |||||
| 2026-02-10 | 13F | Private Wealth Asset Management, LLC | 1 | 0,00 | 0 | |||||
| 2026-02-17 | 13F | Scientech Research LLC | 0 | -100,00 | 0 | |||||
| 2026-02-06 | 13F | FourThought Financial Partners, LLC | 2.177 | -19,61 | 344 | -1,72 | ||||
| 2025-11-14 | 13F | Voloridge Investment Management, Llc | 0 | -100,00 | 0 | |||||
| 2025-12-16 | 13F | Garde Capital, Inc. | 0 | -100,00 | 0 | |||||
| 2026-04-27 | 13F | Proathlete Wealth Management Llc | 93 | 0,00 | 19 | 35,71 | ||||
| 2026-02-12 | 13F | Federation des caisses Desjardins du Quebec | 3 | 0 | ||||||
| 2026-04-30 | 13F | Millstone Evans Group, LLC | 166 | 147,76 | 34 | 240,00 | ||||
| 2026-02-06 | 13F | Berbice Capital Management LLC | 0 | -100,00 | 0 | |||||
| 2025-11-12 | 13F | Globeflex Capital L P | 0 | -100,00 | 0 | -100,00 | ||||
| 2025-11-14 | 13F | Trexquant Investment LP | 0 | -100,00 | 0 | -100,00 | ||||
| 2026-02-12 | 13F | Aviva Plc | 3.363 | -20,04 | 531 | -2,39 | ||||
| 2026-02-17 | 13F | Qube Research & Technologies Ltd | 0 | -100,00 | 0 | |||||
| 2025-11-07 | 13F | Beacon Capital Management, LLC | 0 | -100,00 | 0 | |||||
| 2026-02-17 | 13F | Voleon Capital Management Lp | 21.021 | 143,95 | 3.318 | 198,11 | ||||
| 2026-02-11 | 13F | Simplex Trading, Llc | Put | 300 | -91,43 | 47 | ||||
| 2025-11-14 | 13F | Aigen Investment Management, Lp | 0 | -100,00 | 0 | |||||
| 2026-04-30 | 13F | Torren Management, LLC | 0 | -100,00 | 0 | |||||
| 2026-02-03 | 13F | Bokf, Na | 2.082 | -17,54 | 329 | 0,61 | ||||
| 2026-02-09 | 13F | William Blair Investment Management, Llc | 1.726.587 | -12,88 | 272.559 | 6,43 | ||||
| 2026-02-13 | 13F | Jacobs Levy Equity Management, Inc | 20.205 | 3.190 | ||||||
| 2026-02-11 | 13F | Simplex Trading, Llc | Call | 14.600 | -41,83 | 2.305 | 76.700,00 | |||
| 2026-04-28 | 13F | Harbor Capital Advisors, Inc. | 0 | -100,00 | 0 | |||||
| 2026-02-17 | 13F | Divisar Capital Management LLC | 212.403 | 21,31 | 33.530 | 48,20 | ||||
| 2026-04-27 | 13F | Y-Intercept (Hong Kong) Ltd | 26.876 | 5.511 | ||||||
| 2026-02-17 | 13F | Advisor Group Holdings, Inc. | 5.362 | 117,00 | 846 | 170,29 | ||||
| 2026-02-11 | 13F | Fox Run Management, L.l.c. | 0 | -100,00 | 0 | |||||
| 2026-02-17 | 13F | Schonfeld Strategic Advisors LLC | 5.360 | -87,64 | 846 | -84,90 | ||||
| 2026-02-06 | 13F | Intrust Bank Na | 4.011 | -8,53 | 633 | 11,84 | ||||
| 2026-02-13 | 13F | SRS Capital Advisors, Inc. | 52 | -99,18 | 8 | -99,03 | ||||
| 2026-02-06 | 13F | Tortoise Investment Management, LLC | 0 | -100,00 | 0 | |||||
| 2026-02-10 | 13F | Nomura Asset Management Co Ltd | 130 | 0,00 | 21 | 25,00 | ||||
| 2026-02-05 | 13F | Qsemble Capital Management, LP | 3.407 | -26,11 | 538 | -9,75 | ||||
| 2026-02-12 | 13F | Colonial Trust Co / SC | 55 | 0,00 | 9 | 14,29 | ||||
| 2026-04-13 | 13F | Massmutual Trust Co Fsb/adv | 72 | 14,29 | 15 | 55,56 | ||||
| 2026-04-27 | 13F | Qrg Capital Management, Inc. | 986 | 202 | ||||||
| 2026-02-05 | 13F | Allworth Financial LP | 659 | 440,16 | 104 | 593,33 | ||||
| 2026-02-13 | 13F | Dynamic Technology Lab Private Ltd | 0 | -100,00 | 0 | |||||
| 2025-11-14 | 13F | Teza Capital Management LLC | 0 | -100,00 | 0 | -100,00 | ||||
| 2026-04-14 | 13F | Zrc Wealth Management, Llc | 786 | 0,00 | 161 | 29,84 | ||||
| 2025-11-12 | 13F | Aster Capital Management (DIFC) Ltd | 0 | -100,00 | 0 | -100,00 | ||||
| 2026-01-14 | 13F | Tradewinds Capital Management, LLC | 0 | -100,00 | 0 | |||||
| 2026-04-16 | 13F | Diversified Trust Co | 3.139 | 644 | ||||||
| 2026-02-13 | 13F | Pinnacle Wealth Planning Services, Inc. | 318 | 50 | ||||||
| 2025-11-07 | 13F | Shell Asset Management Co | 1.467 | -56,33 | 0 | |||||
| 2026-02-13 | 13F | Ossiam | 0 | -100,00 | 0 | |||||
| 2026-01-27 | 13F | Zurcher Kantonalbank (Zurich Cantonalbank) | 16.735 | 6,15 | 2.642 | 29,65 | ||||
| 2026-02-13 | 13F | Edgestream Partners, L.P. | 0 | -100,00 | 0 | |||||
| 2026-02-17 | 13F | EFG International AG | 30.448 | 4.807 | ||||||
| 2026-02-13 | 13F | Prudential Financial Inc | 3.075 | -36,95 | 485 | -23,02 | ||||
| 2026-01-27 | 13F | WealthCollab, LLC | 9 | 0,00 | 1 | 0,00 | ||||
| 2026-02-13 | 13F | Baird Financial Group, Inc. | 59.468 | 1.208,71 | 9.388 | 1.499,15 | ||||
| 2026-02-24 | 13F | MidFirst Bank | 844 | 133 | ||||||
| 2026-04-14 | 13F | Congress Asset Management Co /ma | 1.155 | -15,07 | 237 | 10,28 | ||||
| 2025-11-12 | 13F | Intech Investment Management Llc | 0 | -100,00 | 0 | -100,00 | ||||
| 2026-02-17 | 13F | Granahan Investment Management Inc/ma | 196.642 | 165,30 | 31.042 | 224,09 | ||||
| 2026-02-13 | 13F | Sirios Capital Management L P | 115.355 | -29,33 | 18.210 | -13,67 | ||||
| 2025-11-14 | 13F | Sherbrooke Park Advisers Llc | 0 | -100,00 | 0 | |||||
| 2026-02-17 | 13F | Tower Research Capital LLC (TRC) | 2.290 | -65,61 | 361 | -58,02 | ||||
| 2026-04-22 | 13F | Fort Washington Investment Advisors Inc /oh/ | 163.525 | -0,36 | 33.534 | 29,44 | ||||
| 2026-02-10 | 13F | Eurizon Capital SGR S.p.A. | 1.053 | 167 | ||||||
| 2026-04-09 | 13F | Moody National Bank Trust Division | 13.765 | -21,73 | 2.823 | 1,66 | ||||
| 2026-04-28 | 13F | Handelsbanken Fonder AB | 14.600 | 0,00 | 3 | 0,00 | ||||
| 2026-02-09 | 13F | Geode Capital Management, Llc | 1.127.532 | 45,45 | 178.024 | 77,68 | ||||
| 2025-11-13 | 13F | Renaissance Technologies Llc | 0 | -100,00 | 0 | |||||
| 2026-01-14 | 13F | ORG Partners LLC | 5 | 0,00 | 1 | |||||
| 2026-02-17 | 13F | Delaware Management Holdings, Inc. | 61.574 | 9.720 | ||||||
| 2026-02-17 | 13F | Royal Bank Of Canada | 249.410 | -56,02 | 39.372 | -46,27 | ||||
| 2026-04-13 | 13F | Creative Financial Designs Inc /adv | 20 | 0,00 | 4 | 33,33 | ||||
| 2026-02-10 | 13F | Tidemark, LLC | 166 | 0,00 | 26 | 23,81 | ||||
| 2026-04-28 | 13F | Whittier Trust Co | 198 | 0,00 | 44 | 16,22 | ||||
| 2026-02-17 | 13F | Wellington Management Group Llp | 1.218.548 | -12,90 | 192.360 | 6,41 | ||||
| 2026-02-17 | 13F | Price T Rowe Associates Inc /md/ | 680.266 | -12,34 | 107 | 7,00 | ||||
| 2026-02-06 | 13F | Covestor Ltd | 305 | 224,47 | 0 | |||||
| 2026-02-04 | 13F | First Eagle Investment Management, LLC | 6.675 | 167,00 | 1.054 | 226,01 | ||||
| 2026-04-30 | 13F | ARGA Investment Management, LP | 12.291 | 0,00 | 2.521 | 29,90 | ||||
| 2026-04-29 | 13F | CVA Family Office, LLC | 50 | 10 | ||||||
| 2026-04-29 | 13F | Swedbank AB | 44.600 | -46,00 | 9.146 | -29,86 | ||||
| 2026-02-09 | 13F | Fisher Asset Management, LLC | 701.999 | 7,01 | 110.818 | 30,73 | ||||
| 2026-04-16 | 13F | Capital Advisors, Ltd. LLC | 5 | 0,00 | 0 | |||||
| 2026-04-29 | 13F | Klp Kapitalforvaltning As | 10.825 | 2,85 | 2.220 | 33,59 | ||||
| 2026-02-17 | 13F | Massar Capital Management, LP | 0 | -100,00 | 0 | |||||
| 2026-04-13 | 13F | IFP Advisors, Inc | 761 | -7,42 | 156 | 20,93 | ||||
| 2026-02-12 | 13F | Swiss National Bank | 96.641 | 1,90 | 15.256 | 24,48 | ||||
| 2026-01-30 | 13F | Canandaigua National Bank & Trust Co | 1.277 | 202 | ||||||
| 2026-02-11 | 13F | Ing Groep Nv | 21.900 | -77,40 | 3.457 | -72,39 | ||||
| 2026-02-13 | 13F | First Trust Advisors Lp | 174.931 | -15,39 | 27.615 | 3,37 | ||||
| 2026-02-11 | 13F | O'shaughnessy Asset Management, Llc | 1.544 | 244 | ||||||
| 2025-11-14 | 13F | Natixis | 0 | -100,00 | 0 | -100,00 | ||||
| 2026-02-17 | 13F | Raymond James Financial Inc | 282.600 | -10,60 | 45.016 | 10,20 | ||||
| 2026-01-28 | 13F | Migdal Insurance & Financial Holdings Ltd. | 0 | -100,00 | 0 | |||||
| 2026-02-17 | 13F | Ancora Advisors, LLC | 9 | 0,00 | 1 | 0,00 | ||||
| 2026-04-08 | 13F | Wealth Enhancement Advisory Services, Llc | 26.612 | 128,08 | 2.715 | 17,13 | ||||
| 2026-04-21 | 13F | Barlow Wealth Partners, Inc. | 1.230 | 0,00 | 358 | 53,22 | ||||
| 2026-02-12 | 13F | Marex Group plc | 2.189 | 346 | ||||||
| 2026-02-17 | 13F | Canada Pension Plan Investment Board | 94.300 | 292,92 | 14.886 | 380,04 | ||||
| 2025-11-14 | 13F | Point72 (DIFC) Ltd | 0 | -100,00 | 0 | -100,00 | ||||
| 2026-04-15 | 13F | Activest Wealth Management | 56 | 1,82 | 11 | 37,50 | ||||
| 2026-02-17 | 13F | Two Sigma Investments, Lp | 86.455 | -78,35 | 13.648 | -73,55 | ||||
| 2026-01-27 | 13F | Brighton Jones Llc | 0 | -100,00 | 0 | |||||
| 2026-02-02 | 13F | Horizon Investments, LLC | 8.873 | 61,01 | 1.401 | 96,63 | ||||
| 2026-02-17 | 13F | Df Dent & Co Inc | 0 | -100,00 | 0 | |||||
| 2026-02-17 | 13F | Guggenheim Capital Llc | 7.408 | 12,29 | 1.169 | 37,21 | ||||
| 2026-02-17 | 13F | Boothbay Fund Management, Llc | Call | 0 | -100,00 | 0 | ||||
| 2025-11-07 | 13F | Sierra Ocean, Llc | 0 | -100,00 | 0 | |||||
| 2025-11-14 | 13F | Cubist Systematic Strategies, LLC | 0 | -100,00 | 0 | -100,00 | ||||
| 2026-01-30 | 13F | Rachor Investment Advisory Services, LLC | 9 | 1 | ||||||
| 2026-02-17 | 13F | Amundi | 139.940 | 27,19 | 22.091 | 38,18 | ||||
| 2026-04-30 | 13F | Hsbc Holdings Plc | 4.441 | -61,26 | 902 | -50,49 | ||||
| 2026-02-04 | 13F | Nicholas Company, Inc. | 45.821 | 0,00 | 7.233 | 22,18 | ||||
| 2026-02-13 | 13F | Ubs Asset Management Americas Inc | 145.891 | 0,77 | 23.030 | 23,10 | ||||
| 2026-02-12 | 13F | Ensign Peak Advisors, Inc | 2.789 | -64,42 | 440 | -56,52 | ||||
| 2026-02-13 | 13F | Segall Bryant & Hamill, Llc | 399.205 | 30,79 | 63.019 | 59,78 | ||||
| 2026-01-28 | 13F | Universal- Beteiligungs- und Servicegesellschaft mbH | 75.898 | 48,31 | 11.992 | 81,37 | ||||
| 2026-02-17 | 13F | Mercer Global Advisors Inc /adv | 12.183 | 84,03 | 1.923 | 124,91 | ||||
| 2026-02-18 | 13F | Mackenzie Financial Corp | 12.001 | -1,31 | 1.917 | 21,96 | ||||
| 2026-02-17 | 13F | Polymer Capital Management (US) LLC | 26.212 | -32,11 | 4.138 | -17,06 | ||||
| 2026-02-13 | 13F | Healthcare Of Ontario Pension Plan Trust Fund | 0 | -100,00 | 0 | |||||
| 2026-04-16 | 13F | SG Americas Securities, LLC | 68.315 | 1.144,13 | 14 | |||||
| 2026-04-14 | 13F | Bay Harbor Wealth Management, LLC | 7 | 75,00 | 1 | |||||
| 2025-11-14 | 13F | Cubist Systematic Strategies, LLC | Put | 2.200 | -65,62 | 284 | -55,97 | |||
| 2026-01-16 | 13F | FNY Investment Advisers, LLC | Call | 0 | -100,00 | 0 | ||||
| 2026-02-03 | 13F | Robeco Schweiz AG | 140.000 | -7,84 | 22.100 | 12,59 | ||||
| 2025-11-14 | 13F | Cubist Systematic Strategies, LLC | Call | 2.000 | -83,47 | 258 | -78,87 | |||
| 2026-02-12 | 13F | Cloud Capital Management, LLC | 0 | -100,00 | 0 | |||||
| 2026-02-13 | 13F | Arrowstreet Capital, Limited Partnership | 0 | -100,00 | 0 | |||||
| 2025-11-12 | 13F | Quantbot Technologies LP | 0 | -100,00 | 0 | |||||
| 2026-02-06 | 13F | Transce3nd, LLC | 103 | -9,65 | 21 | 61,54 | ||||
| 2026-02-17 | 13F | Lazard Asset Management Llc | 41.567 | -64,51 | 6.562 | -56,65 | ||||
| 2026-02-17 | 13F | Engineers Gate Manager LP | 2.268 | -97,04 | 358 | -96,39 | ||||
| 2026-01-30 | 13F | Us Bancorp \de\ | 4.242 | -36,32 | 670 | -22,21 | ||||
| 2026-02-11 | 13F | Commonwealth Retirement Investments LLC | 100 | 16 | ||||||
| 2026-02-12 | 13F | Advisors Asset Management, Inc. | 2.722 | -46,19 | 430 | -34,30 | ||||
| 2026-01-21 | 13F | Y.D. More Investments Ltd | 0 | -100,00 | 0 | |||||
| 2025-11-12 | 13F | South Dakota Investment Council | 0 | -100,00 | 0 | |||||
| 2026-01-30 | 13F/A | M&t Bank Corp | 6.251 | 107,61 | 987 | 153,47 | ||||
| 2026-02-04 | 13F | First National Advisers, LLC | 3.717 | -4,05 | 587 | 17,20 | ||||
| 2026-01-13 | 13F | Dakota Wealth Management | 3.825 | 604 | ||||||
| 2026-04-30 | 13F | First Horizon Corp | 107 | 0,00 | 22 | 31,25 | ||||
| 2026-02-02 | 13F | Principal Financial Group Inc | 186.809 | 28,36 | 29.490 | 56,81 | ||||
| 2026-02-13 | 13F | JustInvest LLC | 5.310 | 6,76 | 838 | 30,53 | ||||
| 2026-02-13 | 13F | Mml Investors Services, Llc | 4.765 | 41,60 | 752 | 73,27 | ||||
| 2026-04-17 | 13F | Vermillion Wealth Management, Inc. | 4 | 1 | ||||||
| 2026-02-17 | 13F | Signature Equity Partners, LLC | 235 | 37 | ||||||
| 2026-04-30 | 13F | Kornitzer Capital Management Inc /ks | 64.645 | 81,36 | 13.257 | 135,62 | ||||
| 2026-02-10 | 13F | State of Wyoming | 1.155 | -25,29 | 182 | -8,54 | ||||
| 2026-02-10 | 13F | Norges Bank | 664.755 | 104.938 | ||||||
| 2026-04-16 | 13F | EdgeRock Capital LLC | 3.659 | 0,16 | 750 | 30,21 | ||||
| 2026-02-13 | 13F | Diametric Capital, LP | 0 | -100,00 | 0 | |||||
| 2026-02-10 | 13F | Connor, Clark & Lunn Investment Management Ltd. | 0 | -100,00 | 0 | |||||
| 2026-02-17 | 13F | Aquatic Capital Management LLC | 0 | -100,00 | 0 | |||||
| 2026-01-29 | 13F | IMC-Chicago, LLC | Call | 11.700 | -66,09 | 1.847 | -58,59 | |||
| 2026-02-13 | 13F | Barclays Plc | 51.548 | -44,64 | 8.137 | -32,38 | ||||
| 2026-04-15 | 13F | Fortitude Family Office, LLC | 30 | 275,00 | 6 | 500,00 | ||||
| 2026-04-23 | 13F | Farmers & Merchants Investments Inc | 43 | 0,00 | 9 | 33,33 | ||||
| 2026-02-17 | 13F | Fred Alger Management, Llc | 0 | -100,00 | 0 | |||||
| 2026-04-20 | 13F | Assenagon Asset Management S.A. | 228.321 | 11,30 | 46.822 | 44,59 | ||||
| 2026-02-13 | 13F | Entropy Technologies, LP | 0 | -100,00 | 0 | |||||
| 2026-04-21 | 13F | Gagnon Securities Llc | 2.242 | 0,00 | 460 | 30,03 | ||||
| 2026-02-18 | 13F | State of Tennessee, Treasury Department | 17.575 | 76,03 | 3.551 | 175,27 | ||||
| 2026-02-17 | 13F | Glenmede Trust Co Na | 30.535 | -84,09 | 4.820 | -79,30 | ||||
| 2026-02-17 | 13F | 4D Advisors, LLC | 0 | -100,00 | 0 | |||||
| 2026-02-17 | 13F | Junto Capital Management LP | 366.243 | 18,76 | 57.815 | 45,08 | ||||
| 2026-02-13 | 13F | Umb Bank N A/mo | 713 | 48,54 | 113 | 80,65 | ||||
| 2026-02-09 | 13F | Legal & General Group Plc | 74.440 | -21,27 | 11.751 | -3,82 | ||||
| 2026-02-17 | 13F | Banco Bilbao Vizcaya Argentaria, S.a. | 0 | -100,00 | 0 | |||||
| 2026-02-11 | 13F | Harvest Fund Management Co., Ltd | 4.605 | 8.588,68 | 1 | |||||
| 2025-11-14 | 13F | Freestone Grove Partners LP | 0 | -100,00 | 0 | |||||
| 2026-01-29 | 13F | Sanctuary Advisors, LLC | 3.090 | 10,99 | 488 | 35,65 | ||||
| 2026-01-14 | 13F | Hennion & Walsh Asset Management, Inc. | 10.462 | -1,60 | 1.652 | 20,25 | ||||
| 2026-02-12 | 13F | JPL Wealth Management, LLC | 0 | -100,00 | 0 | |||||
| 2026-04-29 | 13F | Taylor Frigon Capital Management LLC | 10.395 | -31,51 | 2.132 | -11,02 | ||||
| 2026-02-12 | 13F | State Board Of Administration Of Florida Retirement System | 42.888 | -3,18 | 6.770 | 18,27 | ||||
| 2026-04-29 | 13F | Oregon Public Employees Retirement Fund | 10.226 | 4,72 | 2.097 | 36,08 | ||||
| 2026-02-17 | 13F | Fmr Llc | 451.355 | -45,63 | 71.251 | -33,59 | ||||
| 2026-02-11 | 13F | SOUTH STATE Corp | 10 | -50,00 | 2 | -50,00 | ||||
| 2026-04-23 | 13F | Private Wealth Management Group, LLC | 30 | 0,00 | 6 | 50,00 | ||||
| 2026-02-17 | 13F | Jones Financial Companies Lllp | 321 | 22,05 | 51 | 51,52 | ||||
| 2026-02-13 | 13F | State Street Corp | 1.459.278 | -1,08 | 230.362 | 20,84 | ||||
| 2026-04-30 | 13F | Granite Investment Partners, LLC | 68.437 | -5,26 | 14.034 | 23,07 | ||||
| 2026-04-24 | 13F | IFM Investors Pty Ltd | 13 | 3 | ||||||
| 2026-02-13 | 13F | Great West Life Assurance Co /can/ | 27.577 | 0,00 | 4 | 33,33 | ||||
| 2026-02-17 | 13F | XTX Topco Ltd | 1.712 | 270 | ||||||
| 2026-02-17 | 13F | Maryland State Retirement & Pension System | 2.289 | 0,00 | 361 | 22,37 | ||||
| 2026-02-13 | 13F | Van Eck Associates Corp | 1.120 | -28,07 | 0 | |||||
| 2026-04-20 | 13F | Louisiana State Employees Retirement System | 14.400 | 5,88 | 2.953 | 37,60 | ||||
| 2026-04-20 | 13F | Jfs Wealth Advisors, Llc | 46 | 12,20 | 9 | 50,00 | ||||
| 2026-04-15 | 13F | Aspen Investment Management Inc | 0 | -100,00 | 0 | |||||
| 2025-11-14 | 13F | Nissay Asset Management Corp /japan/ /adv | 0 | -100,00 | 0 | |||||
| 2026-04-28 | 13F | Stephens Inc /ar/ | 1.067 | 219 | ||||||
| 2026-02-13 | 13F | Squarepoint Ops LLC | Put | 4.200 | 35,48 | 663 | 65,75 | |||
| 2026-02-11 | 13F | Havemeyer Place LP | 4.561 | 720 | ||||||
| 2026-02-20 | 13F | Sunbelt Securities, Inc. | 17 | 0,00 | 3 | 0,00 | ||||
| 2026-01-26 | 13F | Asset Dedication, LLC | 579 | 0,00 | 91 | 22,97 | ||||
| 2026-02-12 | 13F | Principal Securities, Inc. | 0 | -100,00 | 0 | |||||
| 2026-02-11 | 13F | Ameritas Investment Partners, Inc. | 8.982 | 1.418 | ||||||
| 2026-02-12 | 13F | Geneva Capital Management Llc | 0 | -100,00 | 0 | |||||
| 2026-04-30 | 13F | Lecap Asset Management Ltd | 4.872 | -32,94 | 999 | -12,83 | ||||
| 2026-04-29 | 13F | Greenwood Capital Associates Llc | 2.563 | -40,51 | 526 | -22,79 | ||||
| 2026-04-21 | 13F | Robeco Institutional Asset Management B.V. | 16.007 | 5,87 | 3.283 | 37,55 | ||||
| 2026-01-30 | 13F | Jennison Associates Llc | 680.822 | 1.293,50 | 107.475 | 1.602,42 | ||||
| 2026-02-12 | 13F | Ironwood Investment Management Llc | 5.752 | -0,21 | 908 | 22,04 | ||||
| 2026-04-16 | 13F | Toth Financial Advisory Corp | 6 | 1 | ||||||
| 2026-02-13 | 13F | Channing Capital Management, LLC | 518.882 | 299,14 | 81.911 | 387,62 | ||||
| 2026-02-17 | 13F | Balyasny Asset Management Llc | 218.637 | 34.514 | ||||||
| 2026-02-13 | 13F | Panagora Asset Management Inc | 0 | -100,00 | 0 | |||||
| 2026-02-13 | 13F | Bridge City Capital, LLC | 42.405 | -10,43 | 6.694 | 9,43 | ||||
| 2026-02-17 | 13F | LMR Partners LLP | 0 | -100,00 | 0 | |||||
| 2026-02-12 | 13F | EHP Funds Inc. | 0 | -100,00 | 0 | |||||
| 2026-02-17 | 13F | Glenview Capital Management, Llc | 414.812 | 53,29 | 65.482 | 87,27 | ||||
| 2026-02-17 | 13F | Cinctive Capital Management LP | 15.292 | -56,58 | 2.414 | -46,97 | ||||
| 2026-02-13 | 13F | Neo Ivy Capital Management | 0 | -100,00 | 0 | |||||
| 2026-02-17 | 13F | Northern Trust Corp | 445.247 | -3,74 | 70.287 | 17,60 | ||||
| 2026-02-09 | 13F | Summitry Llc | 3.424 | -6,04 | 541 | 14,89 | ||||
| 2026-01-26 | 13F | KBC Group NV | 1.443 | 0,00 | 0 | |||||
| 2025-11-14 | 13F | Quarry LP | 0 | -100,00 | 0 | |||||
| 2026-04-10 | 13F | Oak Thistle LLC | 1.613 | 331 | ||||||
| 2026-04-28 | 13F | Alberta Investment Management Corp | 0 | -100,00 | 0 | |||||
| 2026-04-28 | 13F | SBI Securities Co., Ltd. | 111 | -18,38 | 23 | 4,76 | ||||
| 2026-04-29 | 13F | Police & Firemen's Retirement System of New Jersey | 21.040 | -0,24 | 4.315 | 29,59 | ||||
| 2026-02-05 | 13F | Plante Moran Financial Advisors, LLC | 0 | -100,00 | 0 | |||||
| 2026-02-17 | 13F | Portolan Capital Management, LLC | 0 | -100,00 | 0 | |||||
| 2026-04-30 | 13F | Verdence Capital Advisors LLC | 25.540 | -22,17 | 5.237 | 1,10 | ||||
| 2026-01-22 | 13F | Massachusetts Financial Services Co /ma/ | 0 | -100,00 | 0 | |||||
| 2026-02-13 | 13F | Polymer Capital Management (HK) LTD | 0 | -100,00 | 0 | |||||
| 2026-02-09 | 13F | Coldstream Capital Management Inc | 1.480 | -34,60 | 234 | -20,21 | ||||
| 2026-01-27 | 13F | Evergreen Capital Management Llc | 6.029 | 108,54 | 952 | 154,96 | ||||
| 2026-04-28 | 13F | Everence Capital Management Inc | 1.667 | 6,86 | 0 | |||||
| 2026-02-05 | 13F | Northwestern Mutual Investment Management Company, Llc | 10.966 | 0,38 | 1.731 | 22,68 | ||||
| 2026-04-06 | 13F | Versant Capital Management, Inc | 391 | 73,01 | 80 | 128,57 | ||||
| 2026-02-13 | 13F | Wells Fargo & Company/mn | 50.405 | 22,40 | 7.957 | 49,52 | ||||
| 2026-04-28 | 13F | Quent Capital, LLC | 155 | 31,36 | 32 | 72,22 | ||||
| 2026-01-28 | 13F | Arizona State Retirement System | 13.662 | -5,65 | 2.157 | 15,23 | ||||
| 2026-04-23 | 13F | Harbor Investment Advisory, Llc | 0 | -100,00 | 0 | |||||
| 2026-01-20 | 13F | Whalen Wealth Management Inc. | 0 | -100,00 | 0 | |||||
| 2026-02-18 | 13F | GWM Advisors LLC | 0 | -100,00 | 0 | |||||
| 2026-02-17 | 13F | Farringdon Capital, Ltd. | 0 | -100,00 | 0 | |||||
| 2026-02-11 | 13F | Jpmorgan Chase & Co | 381.631 | 11,87 | 60.244 | 36,67 | ||||
| 2026-02-05 | 13F | Thrivent Financial For Lutherans | 960.911 | 88,48 | 152 | 132,31 | ||||
| 2026-02-11 | 13F | Franklin Resources Inc | 1.353.001 | 21,40 | 213.585 | 48,31 | ||||
| 2026-02-17 | 13F | Guardian Point Capital, Lp | 160.000 | 25.258 | ||||||
| 2026-04-08 | 13F | Cambridge Financial Group, LLC | 1.129 | -31,74 | 232 | -13,81 | ||||
| 2025-11-10 | 13F | Axq Capital, Lp | 0 | -100,00 | 0 | |||||
| 2026-02-11 | 13F | IMA Wealth, Inc. | 22.613 | -0,81 | 3.570 | 21,19 | ||||
| 2025-11-12 | 13F | Rafferty Asset Management, LLC | 0 | -100,00 | 0 | -100,00 | ||||
| 2026-01-29 | 13F | IMC-Chicago, LLC | Put | 0 | -100,00 | 0 | -100,00 | |||
| 2026-02-12 | 13F | DRW Securities, LLC | 0 | -100,00 | 0 | |||||
| 2026-02-17 | 13F | Captrust Financial Advisors | 8.298 | 146,09 | 1.310 | 200,92 | ||||
| 2026-02-12 | 13F | Hrt Financial Lp | 41.813 | -82,54 | 7 | -80,00 | ||||
| 2026-02-17 | 13F | Benchstone Capital Management LP | 148.963 | 23.515 | ||||||
| 2026-03-23 | 13F | Galaxy Digital Capital Management GP LLC | 0 | -100,00 | 0 | |||||
| 2026-02-17 | 13F | Summit Trail Advisors, Llc | 2.535 | -26,03 | 400 | -9,50 | ||||
| 2026-02-13 | 13F | Vontobel Holding Ltd. | 3.997 | -37,49 | 631 | -23,73 | ||||
| 2026-02-12 | 13F | Quadrant Capital Group Llc | 5.605 | 85,78 | 885 | 127,25 | ||||
| 2026-02-10 | 13F | Mutual Of America Capital Management Llc | 56.978 | -4,14 | 8.995 | 17,11 | ||||
| 2026-02-10 | 13F | Rothschild Investment Llc | 742 | 14.740,00 | 117 | |||||
| 2026-02-13 | 13F | Colony Group, LLC | 6.077 | 959 | ||||||
| 2026-02-13 | 13F | Centerpoint Advisors, LLC | 7 | 0,00 | 0 | |||||
| 2026-02-17 | 13F | Utah Retirement Systems | 2.600 | 0,00 | 410 | 22,39 | ||||
| 2026-02-13 | 13F | Kilter Group LLC | 6 | 200,00 | 1 | |||||
| 2026-01-29 | 13F | Dunhill Financial, LLC | 1 | 0 | ||||||
| 2026-01-08 | 13F | Nordea Investment Management Ab | 82.599 | -11,95 | 13.143 | 7,67 | ||||
| 2025-11-12 | 13F | 111 Capital | 0 | -100,00 | 0 | -100,00 | ||||
| 2026-04-15 | 13F | Valley National Advisers Inc | 489 | 0 | ||||||
| 2026-02-06 | 13F | HighTower Advisors, LLC | 4.760 | 37,33 | 751 | 68,01 | ||||
| 2026-01-12 | 13F | Rialto Wealth Management, LLC | 8 | 33,33 | 1 | |||||
| 2026-02-13 | 13F | Rhumbline Advisers | 130.141 | -2,55 | 20.544 | 19,06 | ||||
| 2026-02-13 | 13F | Treasurer of the State of North Carolina | 20.376 | -75,81 | 3 | -70,00 | ||||
| 2026-02-17 | 13F | Cetera Investment Advisers | 11.473 | -14,67 | 1.811 | 4,26 | ||||
| 2026-04-28 | 13F | Bogart Wealth, LLC | 3 | 1 | ||||||
| 2026-02-10 | 13F | Measured Wealth Private Client Group, LLC | 103 | 16 | ||||||
| 2026-02-05 | 13F | HFM Investment Advisors, LLC | 3 | 200,00 | 0 | |||||
| 2026-02-11 | 13F | Cerity Partners LLC | 19.194 | 3.030 | ||||||
| 2026-01-26 | 13F | Mirae Asset Global Investments Co., Ltd. | 700 | -22,99 | 111 | -5,98 | ||||
| 2026-04-07 | 13F | Central Pacific Bank - Trust Division | 1.080 | -6,09 | 221 | 22,10 | ||||
| 2026-01-14 | 13F | Spire Wealth Management | 0 | -100,00 | 0 | |||||
| 2026-01-29 | 13F | Concurrent Investment Advisors, LLC | 4.860 | 131,10 | 767 | 183,03 | ||||
| 2025-11-14 | 13F | Virtu Financial LLC | 0 | -100,00 | 0 | |||||
| 2025-11-14 | 13F | Bares Capital Management, Inc. | 75.450 | 9.750 | ||||||
| 2026-04-17 | 13F | Bell Investment Advisors, Inc | 52 | 6,12 | 11 | 42,86 | ||||
| 2026-02-06 | 13F | Global Retirement Partners, LLC | 1.679 | 274,78 | 265 | 364,91 | ||||
| 2026-02-17 | 13F | ISAM Funds (UK) Ltd | 0 | -100,00 | 0 | |||||
| 2026-02-13 | 13F | Walleye Capital LLC | Put | 600 | 95 | |||||
| 2026-02-13 | 13F | Walleye Capital LLC | 69.372 | -39,62 | 10.951 | -26,23 | ||||
| 2026-04-08 | 13F | NorthCrest Asset Manangement, LLC | 14.017 | -3,60 | 3.021 | 16,64 | ||||
| 2026-02-13 | 13F | Walleye Capital LLC | Call | 900 | 142 | |||||
| 2026-02-11 | 13F | Parallel Advisors, LLC | 339 | 20,64 | 54 | 47,22 | ||||
| 2026-02-09 | 13F | Royce & Associates Lp | 365.735 | 18,95 | 57.735 | 45,31 | ||||
| 2026-04-15 | 13F | Journey Strategic Wealth Llc | 1.353 | 277 | ||||||
| 2026-02-17 | 13F | Jain Global LLC | 126.840 | -16,89 | 20.023 | 1,53 | ||||
| 2026-02-13 | 13F | Headlands Technologies LLC | 0 | -100,00 | 0 | |||||
| 2026-04-23 | 13F | Oppenheimer Asset Management Inc. | 1.504 | -29,82 | 308 | -8,88 | ||||
| 2026-02-14 | 13F | Rockefeller Capital Management L.P. | 108.202 | -24,31 | 17.081 | -7,54 | ||||
| 2026-02-17 | 13F | Capital Fund Management S.a. | 92.663 | -33,13 | 14.628 | -18,31 | ||||
| 2026-02-17 | 13F | SageView Advisory Group, LLC | 222 | 35 | ||||||
| 2026-02-17 | 13F | Hancock Whitney Corp | 2.714 | 0,00 | 428 | 22,29 | ||||
| 2026-02-02 | 13F | Breakwater Investment Management | 5 | 0,00 | 1 | |||||
| 2026-02-10 | 13F | South Street Advisors LLC | 85.365 | -6,26 | 13.476 | 14,52 | ||||
| 2025-11-14 | 13F | Militia Capital Partners, LP | Put | 0 | -100,00 | 0 | -100,00 | |||
| 2025-11-14 | 13F | Point72 Europe (London) LLP | 65 | 8 | ||||||
| 2026-02-13 | 13F | PCM Encore, LLC | 2.646 | 418 | ||||||
| 2026-01-29 | 13F | Impax Asset Management Group plc | 74.057 | 0,00 | 11.691 | 22,17 | ||||
| 2026-04-08 | 13F | Eagle Rock Investment Company, Llc | 10.037 | 0,00 | 2.058 | 29,92 | ||||
| 2026-02-09 | 13F | Harbour Investments, Inc. | 1.736 | 274 | ||||||
| 2026-02-09 | 13F | Hartland & Co., LLC | 885 | 158,77 | 140 | 215,91 | ||||
| 2025-11-21 | 13F | Nebula Research & Development LLC | 0 | -100,00 | 0 | -100,00 | ||||
| 2026-04-15 | 13F | Merit Financial Group, LLC | 3.463 | 24,79 | 710 | 62,10 | ||||
| 2026-02-03 | 13F | Morse Asset Management, Inc | 35 | 0,00 | 6 | 25,00 | ||||
| 2026-02-17 | 13F | Capital Fund Management S.a. | Call | 0 | -100,00 | 0 | ||||
| 2026-04-30 | 13F | Cromwell Holdings LLC | 9 | 50,00 | 2 | |||||
| 2025-11-06 | 13F | New York Life Investment Management Llc | 0 | -100,00 | 0 | -100,00 | ||||
| 2025-11-13 | 13F | FORA Capital, LLC | 0 | -100,00 | 0 | |||||
| 2026-02-13 | 13F | Neuberger Berman Group LLC | 1.684 | 266 | ||||||
| 2026-02-13 | 13F | Charles Schwab Investment Management Inc | 504.307 | 0,37 | 79.610 | 22,62 | ||||
| 2026-02-06 | 13F | Forefront Wealth Partners, LLC | 0 | -100,00 | 0 | |||||
| 2026-02-17 | 13F | Ardsley Advisory Partners Lp | Call | 15.000 | 2.368 | |||||
| 2026-02-11 | 13F | Pacific Wealth Management | 1.637 | -5,76 | 258 | 15,18 | ||||
| 2026-02-12 | 13F | Steward Partners Investment Advisory, Llc | 5 | -16,67 | 1 | |||||
| 2026-02-06 | 13F | AMF Pensionsforsakring AB | 24.738 | 0,00 | 3.905 | 22,18 | ||||
| 2026-02-17 | 13F | Worldquant Millennium Advisors Llc | 0 | -100,00 | 0 | |||||
| 2026-04-29 | 13F | Montag A & Associates Inc | 5 | 0,00 | 1 | |||||
| 2026-02-10 | 13F | One Capital Management, LLC | 14.779 | 2.333 | ||||||
| 2026-02-13 | 13F | Boston Partners | 254.349 | 40.166 | ||||||
| 2026-02-17 | 13F | Credit Agricole S A | 160.099 | 21,05 | 25.273 | 47,88 | ||||
| 2026-02-12 | 13F | CIBC Private Wealth Group, LLC | 245 | 109,40 | 39 | 153,33 | ||||
| 2026-01-16 | 13F | Crewe Advisors LLC | 25 | 0,00 | 4 | 0,00 | ||||
| 2026-02-10 | 13F | Fideuram Asset Management (Ireland) dac | 10.328 | 1.583 | ||||||
| 2026-02-17 | 13F | Capital Fund Management S.a. | Put | 0 | -100,00 | 0 | ||||
| 2026-02-17 | 13F | Ardsley Advisory Partners Lp | 43.500 | 7,41 | 6.867 | 31,21 | ||||
| 2025-11-10 | 13F | Prestige Wealth Management Group LLC | 0 | -100,00 | 0 | |||||
| 2025-11-13 | 13F | Blueshift Asset Management, LLC | 0 | -100,00 | 0 | -100,00 | ||||
| 2025-11-13 | 13F | Glenmede Investment Management, LP | 31.829 | -50,68 | 4.113 | -36,87 | ||||
| 2026-02-12 | 13F | Brinker Capital Investments, LLC | 10.145 | -13,25 | 1.602 | 5,96 | ||||
| 2026-02-17 | 13F | Monolith Management Ltd | 0 | -100,00 | 0 | |||||
| 2026-02-17 | 13F | Driehaus Capital Management Llc | 349.014 | 247,38 | 55.095 | 324,40 | ||||
| 2026-02-18 | 13F | Vident Advisory, LLC | 37.074 | 22,05 | 5.853 | 49,10 | ||||
| 2026-01-29 | 13F | Cornerstone Investment Partners, LLC | 4.183 | -1,62 | 660 | 20,22 | ||||
| 2026-02-13 | 13F | Toroso Investments, LLC | 96.135 | -23,54 | 15.176 | -6,59 | ||||
| 2026-01-13 | 13F | Stonehage Fleming Financial Services Holdings Ltd | 1.077 | 170 | ||||||
| 2026-02-13 | 13F | Tairen Capital Ltd | 0 | -100,00 | 0 | |||||
| 2026-04-29 | 13F | Standard Life Aberdeen plc | 5.289 | -8,00 | 1.085 | 19,51 | ||||
| 2026-01-30 | 13F | State of New Jersey Common Pension Fund D | 17.381 | -13,82 | 2.744 | 5,26 | ||||
| 2026-02-06 | 13F | Vestmark Advisory Solutions, Inc. | 5.679 | 896 | ||||||
| 2026-02-06 | 13F | Bare Financial Services, Inc | 2 | -50,00 | 0 | |||||
| 2026-02-13 | 13F | Morgan Stanley | 467.189 | -40,90 | 73.751 | -27,80 | ||||
| 2026-02-13 | 13F | SG Capital Management LLC | 116.149 | -57,12 | 18.335 | -47,61 | ||||
| 2026-02-17 | 13F | Man Group plc | 24.173 | 23,12 | 3.816 | 50,37 | ||||
| 2026-02-17 | 13F | Octahedron Capital Management L.P. | 0 | -100,00 | 0 | |||||
| 2026-02-12 | 13F | Ci Investments Inc. | 35.435 | 42,94 | 5.594 | 186.333,33 | ||||
| 2026-03-11 | 13F | DUTCH ASSET Corp | 7.330 | 1 | ||||||
| 2026-02-11 | 13F | Deutsche Bank Ag\ | 19.150 | -37,72 | 3.023 | -23,91 | ||||
| 2026-02-04 | 13F | TradeLink Capital LLC | 0 | -100,00 | 0 | |||||
| 2026-04-28 | 13F | Flagship Harbor Advisors, Llc | 0 | -100,00 | 0 | |||||
| 2026-02-11 | 13F | Zions Bancorporation, National Association /ut/ | 17.171 | -6,86 | 2.711 | 13,77 | ||||
| 2026-01-23 | 13F | Westside Investment Management, Inc. | 198 | 0,00 | 33 | 18,52 | ||||
| 2026-02-10 | 13F | Andar Capital Management HK Ltd | 86.640 | -21,24 | 13.677 | -3,79 | ||||
| 2026-02-17 | 13F | Tanaka Capital Management Inc | 12.833 | 0,00 | 2 | 100,00 | ||||
| 2026-03-19 | 13F | Painted Porch Advisors LLC | 0 | -100,00 | 0 | |||||
| 2025-11-14 | 13F | Sora Investors Llc | 0 | -100,00 | 0 | |||||
| 2026-02-10 | 13F | Goldman Sachs Group Inc | 455.481 | 203,47 | 71.902 | 270,72 | ||||
| 2026-02-11 | 13F | LPL Financial LLC | 41.214 | -7,56 | 6.506 | 12,93 | ||||
| 2026-02-09 | 13F | Emerald Advisers, Llc | 122.613 | -3,88 | 19.356 | 17,42 | ||||
| 2025-11-14 | 13F | Wolverine Trading, Llc | Put | 31.600 | 21,07 | 4.121 | 59,69 | |||
| 2026-02-11 | 13F | Los Angeles Capital Management Llc | 245 | 34 | ||||||
| 2026-02-17 | 13F | Caisse De Depot Et Placement Du Quebec | 3.805 | 601 | ||||||
| 2026-02-17 | 13F | T. Rowe Price Investment Management, Inc. | 31.857 | 5 | ||||||
| 2026-02-13 | 13F | Macquarie Group Ltd | 96 | -99,60 | 15 | -99,51 | ||||
| 2026-02-17 | 13F | Citadel Advisors Llc | 138.766 | -64,54 | 21.906 | -56,68 | ||||
| 2026-02-17 | 13F | Citadel Advisors Llc | Call | 23.600 | -63,69 | 3.725 | -55,65 | |||
| 2026-01-29 | 13F | DecisionPoint Financial, LLC | 3 | 0,00 | 0 | |||||
| 2026-02-17 | 13F | Citadel Advisors Llc | Put | 25.700 | -67,63 | 4.057 | -60,46 | |||
| 2026-04-07 | 13F | Signaturefd, Llc | 828 | 2,86 | 170 | 33,07 | ||||
| 2025-11-04 | 13F | Gibbs Wealth Management | 0 | -100,00 | 0 | -100,00 | ||||
| 2026-02-13 | 13F | Smartleaf Asset Management LLC | 1.165 | 8,57 | 186 | 33,81 | ||||
| 2026-02-06 | 13F | EverSource Wealth Advisors, LLC | 1.006 | 98,42 | 159 | 143,08 | ||||
| 2025-11-14 | 13F | Wolverine Trading, Llc | 16.285 | 107,77 | 2.124 | 173,94 | ||||
| 2026-02-06 | 13F | Pnc Financial Services Group, Inc. | 5.811 | -11,75 | 917 | 7,88 | ||||
| 2026-02-12 | 13F | BlackRock, Inc. | 4.931.826 | -5,40 | 778.538 | 15,57 | ||||
| 2026-02-13 | 13F | Liberty One Investment Management, Llc | 0 | -100,00 | 0 | |||||
| 2025-11-14 | 13F | Wolverine Trading, Llc | Call | 11.500 | 22,34 | 1.500 | 61,36 | |||
| 2025-11-03 | 13F | Annis Gardner Whiting Capital Advisors, LLC | 0 | -100,00 | 0 | |||||
| 2026-04-24 | 13F | Profund Advisors Llc | 3.245 | -10,83 | 665 | 15,85 | ||||
| 2026-02-09 | 13F | AIA Group Ltd | 5.556 | -42,36 | 877 | -29,56 | ||||
| 2026-02-11 | 13F | Group One Trading, L.p. | Call | 11.700 | 116,67 | 1.847 | 164,85 | |||
| 2026-02-11 | 13F | Group One Trading, L.p. | Put | 2.000 | 17,65 | 316 | 43,84 | |||
| 2026-01-27 | 13F | Tributary Capital Management, LLC | 7.000 | -1,85 | 1.105 | 19,98 | ||||
| 2026-02-10 | 13F | New Mexico Educational Retirement Board | 10.100 | 0,00 | 2 | 0,00 | ||||
| 2026-04-29 | 13F | Sunrise Financial Services, LLC | 10 | 0,00 | 2 | 100,00 | ||||
| 2026-01-29 | 13F | Comerica Bank | 12.513 | -69,08 | 1.975 | -62,23 | ||||
| 2026-02-09 | 13F | Hantz Financial Services, Inc. | 16.713 | 192,24 | 3 | |||||
| 2025-11-10 | 13F | Counterpoint Mutual Funds LLC | 0 | -100,00 | 0 | -100,00 | ||||
| 2026-02-13 | 13F | Citigroup Inc | 32.165 | 45,18 | 5.078 | 77,39 | ||||
| 2026-02-17 | 13F/A | Uniplan Investment Counsel, Inc. | 101 | 16 | ||||||
| 2026-02-13 | 13F | Bridgewater Associates, LP | 93.136 | 45,48 | 14.702 | 77,73 | ||||
| 2026-02-13 | 13F | American Century Companies Inc | 248.094 | 47,13 | 39.164 | 79,74 | ||||
| 2026-02-13 | 13F | Parkside Financial Bank & Trust | 217 | 10,71 | 34 | 36,00 | ||||
| 2026-02-13 | 13F | Marshall Wace, Llp | 429.693 | 67.831 | ||||||
| 2025-11-14 | 13F | Point72 Hong Kong Ltd | 181.055 | 81,94 | 23.396 | 132,93 | ||||
| 2026-04-21 | 13F | Pallas Capital Advisors LLC | 1.486 | -10,75 | 305 | 16,03 | ||||
| 2026-04-27 | 13F | HB Wealth Management, LLC | 2.576 | 0,39 | 528 | 30,37 | ||||
| 2026-04-22 | 13F | Stone House Investment Management, LLC | 20 | 4 | ||||||
| 2026-04-07 | 13F | Farther Finance Advisors, LLC | 1.801 | 105,13 | 381 | 176,09 | ||||
| 2025-11-14 | 13F | Occudo Quantitative Strategies Lp | 0 | -100,00 | 0 | -100,00 | ||||
| 2026-02-12 | 13F | Bank Of Montreal /can/ | 6.717 | 5,20 | 1.060 | 28,48 | ||||
| 2026-02-17 | 13F | Sender Co & Partners, Inc. | 4.311 | -52,46 | 681 | -41,93 | ||||
| 2025-11-03 | 13F | EFG Asset Management (North America) Corp. | 11.990 | 1.549 | ||||||
| 2026-04-20 | 13F | State of Alaska, Department of Revenue | 6.752 | 0,90 | 1 | 0,00 | ||||
| 2026-04-24 | 13F | Retirement Systems of Alabama | 77.858 | 2,70 | 15.966 | 33,42 | ||||
| 2026-04-30 | 13F | Peterson Wealth Services | 17 | 0,00 | 3 | 50,00 | ||||
| 2026-02-09 | 13F | Smithfield Trust Co | 201 | 0,00 | 0 | |||||
| 2026-04-30 | 13F | Nuveen, LLC | 147.328 | 33,35 | 30.213 | 73,22 | ||||
| 2025-11-17 | 13F | Kestra Investment Management, LLC | 0 | -100,00 | 0 | -100,00 | ||||
| 2026-02-03 | 13F | Pilgrim Partners Asia Pte Ltd | 0 | -100,00 | 0 | |||||
| 2026-02-13 | 13F | Caxton Associates Llp | 12.563 | 1.983 | ||||||
| 2026-02-19 | 13F | CI Private Wealth, LLC | 2.820 | 45,29 | 448 | 79,20 | ||||
| 2026-02-12 | 13F | Empower Advisory Group, LLC | 5.439 | 0,00 | 859 | 22,22 | ||||
| 2025-11-14 | 13F | Oxford Asset Management Llp | 0 | -100,00 | 0 | -100,00 | ||||
| 2026-04-24 | 13F | Yousif Capital Management, Llc | 14.618 | -3,03 | 2.998 | -8,01 | ||||
| 2026-02-17 | 13F | Russell Investments Group, Ltd. | 59.251 | 476,71 | 9.353 | 604,82 | ||||
| 2026-02-11 | 13F | Tiaa Trust, National Association | 3.500 | 0,00 | 553 | 22,12 | ||||
| 2026-02-11 | 13F | Twin Tree Management, LP | Call | 0 | -100,00 | 0 | -100,00 | |||
| 2026-02-12 | 13F | Dimensional Fund Advisors Lp | 649.365 | -7,05 | 102.513 | 13,56 | ||||
| 2026-02-17 | 13F | Numerai GP LLC | 0 | -100,00 | 0 | |||||
| 2025-11-14 | 13F | Coppell Advisory Solutions LLC | 0 | -100,00 | 0 | -100,00 | ||||
| 2026-04-28 | 13F | Golden State Equity Partners | 5 | 1 | ||||||
| 2026-02-13 | 13F | Public Employees Retirement Association Of Colorado | 5.210 | 0,00 | 1 | |||||
| 2026-04-08 | 13F | DiNuzzo Private Wealth, Inc. | 8 | 0,00 | 2 | 0,00 | ||||
| 2026-02-17 | 13F | Alliancebernstein L.p. | 64.306 | 0,56 | 10.151 | 22,85 | ||||
| 2026-02-12 | 13F | Stonebridge Capital Advisors LLC | 4.741 | 0,00 | 748 | 22,22 | ||||
| 2025-11-14 | 13F | Mount Yale Investment Advisors, LLC | 0 | -100,00 | 0 | -100,00 | ||||
| 2026-02-10 | 13F | Envestnet Asset Management Inc | 46.136 | -24,13 | 7.283 | -7,33 | ||||
| 2026-02-12 | 13F | Caerus Investment Advisors, LLC | 1.555 | 245 | ||||||
| 2026-02-10 | 13F | Bnp Paribas Arbitrage, Sa | 224.523 | 4,61 | 35.443 | 27,79 | ||||
| 2026-02-13 | 13F | BNP Paribas Asset Management Holding S.A. | 740 | 40,15 | 0 | |||||
| 2026-02-17 | 13F | Palisade Capital Management Llc/nj | 161.503 | 37,43 | 25.495 | 67,89 | ||||
| 2026-02-13 | 13F | Bank Of Nova Scotia | 0 | -100,00 | 0 | |||||
| 2026-01-29 | 13F | D.a. Davidson & Co. | 1.590 | 0,00 | 251 | 21,95 | ||||
| 2026-02-17 | 13F | Mirabella Financial Services Llp | 2.916 | 460 | ||||||
| 2026-02-17 | 13F | Bank Of America Corp /de/ | 232.874 | 71,24 | 36.761 | 109,19 | ||||
| 2026-04-20 | 13F/A | OP Asset Management Ltd | 0 | -100,00 | 0 | -100,00 | ||||
| 2026-02-11 | 13F | Buckingham Strategic Partners | 2.588 | 409 | ||||||
| 2026-02-02 | 13F | Danske Bank A/s | 300 | 0,00 | 47 | 23,68 | ||||
| 2026-02-11 | 13F | Atlantic Private Wealth, LLC | 5 | 1 | ||||||
| 2026-02-12 | 13F | Penserra Capital Management LLC | 237.212 | -14,49 | 37 | 5,71 | ||||
| 2026-02-17 | 13F | Quantinno Capital Management LP | 15.525 | 158,58 | 2.451 | 216,13 | ||||
| 2026-02-17 | 13F | Holocene Advisors, LP | 9.929 | -43,24 | 1.567 | -30,66 |
Other Listings
| DE:NNM | 241,90 € |