Grundlæggende statistik
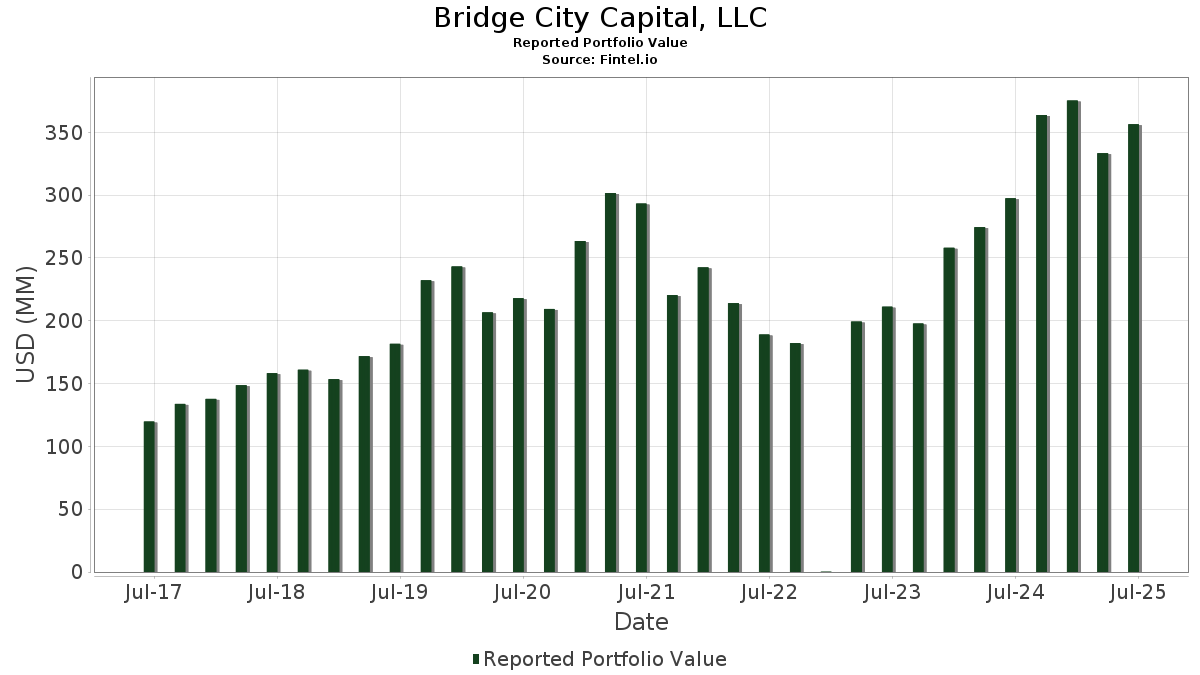
| Porteføljeværdi | $ 374.494.762 |
| Nuværende stillinger | 108 |
Seneste beholdninger, ydeevne, AUM (fra 13F, 13D)
Bridge City Capital, LLC har afsløret 108 samlede besiddelser i deres seneste SEC-arkivering. Den seneste porteføljeværdi er beregnet til at være $ 374.494.762 USD. Faktiske aktiver under forvaltning (AUM) er denne værdi plus kontanter (som ikke er oplyst). Bridge City Capital, LLCs største beholdninger er The Ensign Group, Inc. (US:ENSG) , Sterling Infrastructure, Inc. (US:STRL) , Glacier Bancorp, Inc. (US:GBCI) , Pacira BioSciences, Inc. (US:PCRX) , and Dorman Products, Inc. (US:DORM) . Bridge City Capital, LLCs nye stillinger omfatter Krystal Biotech, Inc. (US:KRYS) , BlackLine, Inc. (US:BL) , Eton Pharmaceuticals, Inc. (US:ETON) , Electromed, Inc. (US:ELMD) , and .
Top øger dette kvartal
Vi bruger ændringen i porteføljeallokeringen, fordi dette er den mest meningsfulde metrik. Ændringer kan skyldes handler eller ændringer i aktiekurser.
| Sikkerhed | Aktier (MM) |
Værdi (MM$) |
Portefølje % | ΔPortefølje % |
|---|---|---|---|---|
| ONTO / Onto Innovation Inc. | 0,05 | 6,12 | 1,6335 | 1,1736 |
| PCRX / Pacira BioSciences, Inc. | 0,31 | 8,03 | 2,1431 | 1,0056 |
| CRAI / CRA International, Inc. | 0,02 | 3,81 | 1,0165 | 0,8006 |
| KRYS / Krystal Biotech, Inc. | 0,01 | 2,50 | 0,6672 | 0,6672 |
| BL / BlackLine, Inc. | 0,04 | 1,91 | 0,5103 | 0,5103 |
| HRMY / Harmony Biosciences Holdings, Inc. | 0,26 | 7,16 | 1,9130 | 0,4711 |
| MD / Pediatrix Medical Group, Inc. | 0,24 | 3,97 | 1,0597 | 0,4618 |
| CRDO / Credo Technology Group Holding Ltd | 0,03 | 4,97 | 1,3259 | 0,4252 |
| DORM / Dorman Products, Inc. | 0,05 | 7,64 | 2,0400 | 0,3612 |
| ACIW / ACI Worldwide, Inc. | 0,12 | 6,54 | 1,7467 | 0,3584 |
Top falder i dette kvartal
Vi bruger ændringen i porteføljeallokeringen, fordi dette er den mest meningsfulde metrik. Ændringer kan skyldes handler eller ændringer i aktiekurser.
| Sikkerhed | Aktier (MM) |
Værdi (MM$) |
Portefølje % | ΔPortefølje % |
|---|---|---|---|---|
| UFPI / UFP Industries, Inc. | 0,04 | 3,84 | 1,0266 | -0,4820 |
| SHAK / Shake Shack Inc. | 0,02 | 1,59 | 0,4257 | -0,4325 |
| UFPT / UFP Technologies, Inc. | 0,03 | 5,29 | 1,4130 | -0,3955 |
| MTSI / MACOM Technology Solutions Holdings, Inc. | 0,05 | 6,35 | 1,6952 | -0,3473 |
| OSIS / OSI Systems, Inc. | 0,03 | 6,90 | 1,8425 | -0,2946 |
| CBZ / CBIZ, Inc. | 0,10 | 5,37 | 1,4338 | -0,2499 |
| ATEN / A10 Networks, Inc. | 0,42 | 7,62 | 2,0343 | -0,2341 |
| LAD / Lithia Motors, Inc. | 0,02 | 6,66 | 1,7788 | -0,2092 |
| STRL / Sterling Infrastructure, Inc. | 0,03 | 11,50 | 3,0719 | -0,2079 |
| NSSC / Napco Security Technologies, Inc. | 0,07 | 2,91 | 0,7778 | -0,2067 |
13F og Fondsarkivering
Denne formular blev indsendt den 2025-11-12 for rapporteringsperioden 2025-09-30. Klik på linkikonet for at se den fulde transaktionshistorik.
Opgrader for at låse op for premium-data og eksportere til Excel ![]() .
.
| Sikkerhed | Type | Gennemsnitlig aktiekurs | Aktier (MM) |
Δ Aktier (%) |
Værdi ($MM) |
Δ Aktier (%) |
Portefølje (%) |
ΔPortefølje (%) |
|
|---|---|---|---|---|---|---|---|---|---|
| ENSG / The Ensign Group, Inc. | 0,07 | -2,60 | 12,25 | 9,08 | 3,2706 | 0,1210 | |||
| STRL / Sterling Infrastructure, Inc. | 0,03 | -33,17 | 11,50 | -1,62 | 3,0719 | -0,2079 | |||
| GBCI / Glacier Bancorp, Inc. | 0,17 | 2,04 | 8,42 | 15,28 | 2,2492 | 0,1997 | |||
| PCRX / Pacira BioSciences, Inc. | 0,31 | 83,56 | 8,03 | 97,90 | 2,1431 | 1,0056 | |||
| DORM / Dorman Products, Inc. | 0,05 | 0,46 | 7,64 | 27,66 | 2,0400 | 0,3612 | |||
| ATEN / A10 Networks, Inc. | 0,42 | 0,43 | 7,62 | -5,79 | 2,0343 | -0,2341 | |||
| RBC / RBC Bearings Incorporated | 0,02 | 0,36 | 7,43 | 1,80 | 1,9827 | -0,0634 | |||
| HRMY / Harmony Biosciences Holdings, Inc. | 0,26 | 59,80 | 7,16 | 39,38 | 1,9130 | 0,4711 | |||
| FN / Fabrinet | 0,02 | -18,84 | 7,05 | 0,43 | 1,8816 | -0,0867 | |||
| OSIS / OSI Systems, Inc. | 0,03 | -18,29 | 6,90 | -9,44 | 1,8425 | -0,2946 | |||
| MOD / Modine Manufacturing Company | 0,05 | -17,70 | 6,75 | 18,79 | 1,8012 | 0,2082 | |||
| LAD / Lithia Motors, Inc. | 0,02 | 0,49 | 6,66 | -6,01 | 1,7788 | -0,2092 | |||
| GMED / Globus Medical, Inc. | 0,12 | 0,42 | 6,64 | -2,57 | 1,7736 | -0,1385 | |||
| ACIW / ACI Worldwide, Inc. | 0,12 | 14,99 | 6,54 | 32,17 | 1,7467 | 0,3584 | |||
| LMAT / LeMaitre Vascular, Inc. | 0,07 | 0,42 | 6,46 | 5,81 | 1,7259 | 0,0125 | |||
| MTSI / MACOM Technology Solutions Holdings, Inc. | 0,05 | 0,35 | 6,35 | -12,81 | 1,6952 | -0,3473 | |||
| BMI / Badger Meter, Inc. | 0,04 | 45,42 | 6,28 | 6,01 | 1,6761 | 0,0154 | |||
| ONTO / Onto Innovation Inc. | 0,05 | 191,41 | 6,12 | 273,22 | 1,6335 | 1,1736 | |||
| EXLS / ExlService Holdings, Inc. | 0,14 | 14,08 | 6,11 | 14,71 | 1,6322 | 0,1374 | |||
| DIOD / Diodes Incorporated | 0,11 | 0,37 | 5,81 | 0,99 | 1,5520 | -0,0625 | |||
| CCS / Century Communities, Inc. | 0,09 | 20,55 | 5,60 | 35,66 | 1,4944 | 0,3371 | |||
| AIN / Albany International Corp. | 0,10 | 25,47 | 5,47 | -4,63 | 1,4618 | -0,1486 | |||
| CBZ / CBIZ, Inc. | 0,10 | 21,13 | 5,37 | -10,55 | 1,4338 | -0,2499 | |||
| UFPT / UFP Technologies, Inc. | 0,03 | 0,40 | 5,29 | -17,93 | 1,4130 | -0,3955 | |||
| FFIN / First Financial Bankshares, Inc. | 0,16 | 32,84 | 5,24 | 24,24 | 1,4002 | 0,2163 | |||
| ARIS / Aris Water Solutions, Inc. | 0,20 | 15,93 | 4,98 | 20,87 | 1,3302 | 0,1742 | |||
| CRDO / Credo Technology Group Holding Ltd | 0,03 | -1,66 | 4,97 | 54,67 | 1,3259 | 0,4252 | |||
| OLLI / Ollie's Bargain Outlet Holdings, Inc. | 0,04 | -1,60 | 4,57 | -4,13 | 1,2205 | -0,1168 | |||
| EVR / Evercore Inc. | 0,01 | -1,60 | 4,24 | 22,92 | 1,1316 | 0,1646 | |||
| IRMD / IRADIMED CORPORATION | 0,06 | -1,38 | 4,22 | 17,34 | 1,1276 | 0,1184 | |||
| ADUS / Addus HomeCare Corporation | 0,04 | 0,28 | 4,21 | 2,71 | 1,1238 | -0,0255 | |||
| USPH / U.S. Physical Therapy, Inc. | 0,05 | -1,58 | 4,18 | 6,91 | 1,1160 | 0,0195 | |||
| IIIN / Insteel Industries Inc. | 0,11 | -13,60 | 4,07 | -10,98 | 1,0870 | -0,1957 | |||
| WTTR / Select Water Solutions, Inc. | 0,37 | -1,46 | 3,99 | 21,94 | 1,0658 | 0,1475 | |||
| MD / Pediatrix Medical Group, Inc. | 0,24 | 59,50 | 3,97 | 86,20 | 1,0597 | 0,4618 | |||
| KLIC / Kulicke and Soffa Industries, Inc. | 0,10 | -1,73 | 3,92 | 15,45 | 1,0479 | 0,0942 | |||
| UFPI / UFP Industries, Inc. | 0,04 | -24,02 | 3,84 | -28,51 | 1,0266 | -0,4820 | |||
| CRAI / CRA International, Inc. | 0,02 | 344,40 | 3,81 | 394,93 | 1,0165 | 0,8006 | |||
| PLUS / ePlus inc. | 0,05 | -1,72 | 3,74 | -3,21 | 0,9991 | -0,0852 | |||
| AMPH / Amphastar Pharmaceuticals, Inc. | 0,14 | -1,72 | 3,63 | 14,07 | 0,9696 | 0,0767 | |||
| CPRX / Catalyst Pharmaceuticals, Inc. | 0,18 | 57,31 | 3,59 | 42,84 | 0,9590 | 0,2536 | |||
| INVX / Innovex International, Inc. | 0,19 | -1,48 | 3,58 | 16,94 | 0,9570 | 0,0973 | |||
| BBSI / Barrett Business Services, Inc. | 0,08 | -1,48 | 3,54 | 4,74 | 0,9440 | -0,0028 | |||
| SUPN / Supernus Pharmaceuticals, Inc. | 0,07 | -21,48 | 3,48 | 19,06 | 0,9292 | 0,1093 | |||
| THRM / Gentherm Incorporated | 0,10 | -1,53 | 3,38 | 18,59 | 0,9012 | 0,1027 | |||
| SITE / SiteOne Landscape Supply, Inc. | 0,03 | -1,62 | 3,32 | 4,76 | 0,8872 | -0,0023 | |||
| DFIN / Donnelley Financial Solutions, Inc. | 0,06 | 35,04 | 3,31 | 12,63 | 0,8838 | 0,0596 | |||
| LZB / La-Z-Boy Incorporated | 0,09 | -1,71 | 3,22 | -9,26 | 0,8590 | -0,1353 | |||
| WHD / Cactus, Inc. | 0,08 | -1,60 | 3,13 | -11,16 | 0,8354 | -0,1525 | |||
| PLAB / Photronics, Inc. | 0,14 | -1,50 | 3,11 | 20,06 | 0,8295 | 0,1036 | |||
| NVEC / NVE Corporation | 0,05 | 32,06 | 3,10 | 17,08 | 0,8278 | 0,0852 | |||
| AEO / American Eagle Outfitters, Inc. | 0,18 | -22,77 | 3,10 | 37,37 | 0,8266 | 0,1944 | |||
| WSBC / WesBanco, Inc. | 0,10 | -1,64 | 3,06 | -0,71 | 0,8184 | -0,0475 | |||
| LSTR / Landstar System, Inc. | 0,02 | -1,71 | 3,04 | -13,33 | 0,8123 | -0,1725 | |||
| PDFS / PDF Solutions, Inc. | 0,12 | 39,51 | 3,02 | 68,49 | 0,8055 | 0,3033 | |||
| FELE / Franklin Electric Co., Inc. | 0,03 | -1,73 | 2,96 | 4,26 | 0,7907 | -0,0061 | |||
| SPSC / SPS Commerce, Inc. | 0,03 | 37,32 | 2,94 | 5,08 | 0,7849 | 0,0002 | |||
| NSSC / Napco Security Technologies, Inc. | 0,07 | -42,63 | 2,91 | -17,01 | 0,7778 | -0,2067 | |||
| VPG / Vishay Precision Group, Inc. | 0,09 | -1,24 | 2,86 | 12,68 | 0,7643 | 0,0516 | |||
| EVTC / EVERTEC, Inc. | 0,08 | 24,56 | 2,84 | 16,73 | 0,7585 | 0,0758 | |||
| HCSG / Healthcare Services Group, Inc. | 0,17 | -1,59 | 2,80 | 10,20 | 0,7473 | 0,0349 | |||
| EXPO / Exponent, Inc. | 0,04 | -1,72 | 2,77 | -8,61 | 0,7403 | -0,1106 | |||
| YETI / YETI Holdings, Inc. | 0,08 | -1,76 | 2,72 | 3,38 | 0,7274 | -0,0115 | |||
| QLYS / Qualys, Inc. | 0,02 | -1,71 | 2,72 | -8,97 | 0,7267 | -0,1118 | |||
| CGNX / Cognex Corporation | 0,06 | -30,39 | 2,71 | -0,59 | 0,7228 | -0,0409 | |||
| JJSF / J&J Snack Foods Corp. | 0,03 | 22,12 | 2,64 | 3,44 | 0,7062 | -0,0108 | |||
| PLXS / Plexus Corp. | 0,02 | -1,68 | 2,57 | 5,12 | 0,6854 | 0,0005 | |||
| UCTT / Ultra Clean Holdings, Inc. | 0,09 | 14,39 | 2,56 | 38,10 | 0,6835 | 0,1636 | |||
| KRYS / Krystal Biotech, Inc. | 0,01 | 2,50 | 0,6672 | 0,6672 | |||||
| MMS / Maximus, Inc. | 0,03 | -8,24 | 2,34 | 19,41 | 0,6245 | 0,0752 | |||
| SYNA / Synaptics Incorporated | 0,03 | -1,60 | 2,31 | 3,77 | 0,6174 | -0,0078 | |||
| ROG / Rogers Corporation | 0,03 | -1,71 | 2,30 | 15,50 | 0,6150 | 0,0556 | |||
| LKFN / Lakeland Financial Corporation | 0,04 | -1,62 | 2,29 | 2,78 | 0,6116 | -0,0135 | |||
| GTY / Getty Realty Corp. | 0,08 | -1,61 | 2,20 | -4,48 | 0,5867 | -0,0586 | |||
| JACK / Jack in the Box Inc. | 0,11 | 126,49 | 2,19 | 156,61 | 0,5860 | 0,3459 | |||
| CCSI / Consensus Cloud Solutions, Inc. | 0,07 | -1,37 | 2,07 | 25,59 | 0,5532 | 0,0906 | |||
| CWT / California Water Service Group | 0,04 | -1,69 | 2,06 | -0,82 | 0,5499 | -0,0325 | |||
| HOPE / Hope Bancorp, Inc. | 0,19 | -1,59 | 2,05 | -1,25 | 0,5486 | -0,0349 | |||
| KWR / Quaker Chemical Corporation | 0,02 | -1,65 | 2,05 | 15,79 | 0,5464 | 0,0506 | |||
| CNMD / CONMED Corporation | 0,04 | -1,69 | 1,99 | -11,24 | 0,5313 | -0,0974 | |||
| BL / BlackLine, Inc. | 0,04 | 1,91 | 0,5103 | 0,5103 | |||||
| ZD / Ziff Davis, Inc. | 0,05 | -1,74 | 1,89 | 23,71 | 0,5045 | 0,0760 | |||
| WDFC / WD-40 Company | 0,01 | -1,74 | 1,84 | -14,85 | 0,4914 | -0,1150 | |||
| PJT / PJT Partners Inc. | 0,01 | -1,72 | 1,80 | 5,87 | 0,4816 | 0,0037 | |||
| HSTM / HealthStream, Inc. | 0,06 | 1,59 | 1,69 | 3,68 | 0,4518 | -0,0060 | |||
| BCC / Boise Cascade Company | 0,02 | -1,65 | 1,60 | -12,42 | 0,4277 | -0,0853 | |||
| CORT / Corcept Therapeutics Incorporated | 0,02 | -1,69 | 1,60 | 11,30 | 0,4263 | 0,0240 | |||
| SHAK / Shake Shack Inc. | 0,02 | -21,74 | 1,59 | -47,89 | 0,4257 | -0,4325 | |||
| LTC / LTC Properties, Inc. | 0,04 | -1,60 | 1,58 | 4,77 | 0,4224 | -0,0010 | |||
| TXRH / Texas Roadhouse, Inc. | 0,01 | -1,79 | 1,49 | -12,92 | 0,3977 | -0,0821 | |||
| CMCO / Columbus McKinnon Corporation | 0,10 | -1,49 | 1,38 | -7,50 | 0,3692 | -0,0500 | |||
| RES / RPC, Inc. | 0,27 | -1,61 | 1,30 | -0,91 | 0,3471 | -0,0211 | |||
| OMCL / Omnicell, Inc. | 0,04 | -1,61 | 1,19 | 1,89 | 0,3166 | -0,0098 | |||
| PKE / Park Aerospace Corp. | 0,04 | 8,92 | 0,75 | 50,10 | 0,1994 | 0,0598 | |||
| BWFG / Bankwell Financial Group, Inc. | 0,01 | 0,00 | 0,57 | 22,78 | 0,1514 | 0,0219 | |||
| ITIC / Investors Title Company | 0,00 | 0,00 | 0,48 | 26,67 | 0,1270 | 0,0217 | |||
| ETON / Eton Pharmaceuticals, Inc. | 0,02 | 0,36 | 0,0967 | 0,0967 | |||||
| UTMD / Utah Medical Products, Inc. | 0,01 | 12,96 | 0,35 | 25,09 | 0,0947 | 0,0151 | |||
| OSPN / OneSpan Inc. | 0,02 | 25,21 | 0,35 | 19,31 | 0,0926 | 0,0110 | |||
| INTT / inTEST Corporation | 0,04 | 0,00 | 0,34 | 7,35 | 0,0898 | 0,0019 | |||
| IWO / iShares Trust - iShares Russell 2000 Growth ETF | 0,00 | 31,17 | 0,32 | 46,98 | 0,0845 | 0,0241 | |||
| BMRC / Bank of Marin Bancorp | 0,01 | 0,00 | 0,31 | 6,27 | 0,0815 | 0,0010 | |||
| ELMD / Electromed, Inc. | 0,01 | 0,30 | 0,0789 | 0,0789 | |||||
| FC / Franklin Covey Co. | 0,02 | 0,29 | 0,0782 | 0,0782 | |||||
| PNTG / The Pennant Group, Inc. | 0,01 | 0,25 | 0,0665 | 0,0665 | |||||
| JYNT / The Joint Corp. | 0,03 | 0,00 | 0,25 | -17,39 | 0,0662 | -0,0179 | |||
| ARAY / Accuray Incorporated | 0,13 | 0,00 | 0,22 | 21,98 | 0,0594 | 0,0082 | |||
| QIPT / Quipt Home Medical Corp. | 0,05 | 0,00 | 0,14 | 46,24 | 0,0364 | 0,0102 | |||
| MYRG / MYR Group Inc. | 0,00 | -100,00 | 0,00 | 0,0000 | |||||
| MTZ / MasTec, Inc. | 0,00 | -100,00 | 0,00 | 0,0000 | |||||
| BGSF / BGSF, Inc. | 0,00 | -100,00 | 0,00 | 0,0000 | |||||
| PFGC / Performance Food Group Company | 0,00 | -100,00 | 0,00 | 0,0000 | |||||
| AMED / Amedisys, Inc. | 0,00 | -100,00 | 0,00 | 0,0000 |