Grundlæggende statistik
| Institutionelle aktier (lange) | 148.420.383 - 99,96% (ex 13D/G) - change of -22,54MM shares -13,18% MRQ |
| Institutionel værdi (lang) | $ 12.383.357 USD ($1000) |
Institutionelt ejerskab og aktionærer
Nextpower Inc. (US:NXT) har 649 institutionelle ejere og aktionærer, der har indsendt 13D/G- eller 13F-formularer til Securities Exchange Commission (SEC). Disse institutioner har i alt 148,420,383 aktier. Største aktionærer omfatter BlackRock, Inc., Fmr Llc, Vanguard Group Inc, Primecap Management Co/ca/, State Street Corp, Wellington Management Group Llp, Geode Capital Management, Llc, Invesco Ltd., Pictet Asset Management Holding SA, and Price T Rowe Associates Inc /md/ .
Nextpower Inc. (NasdaqGS:NXT) institutionel ejerskabsstruktur viser aktuelle positioner i virksomheden efter institutioner og fonde, samt seneste ændringer i positionsstørrelse. Større aktionærer kan omfatte individuelle investorer, investeringsforeninger, hedgefonde eller institutioner. Skema 13D angiver, at investoren besidder (eller besidder) mere end 5 % af virksomheden og har til hensigt (eller har til hensigt at) aktivt at forfølge en ændring i forretningsstrategi. Skema 13G indikerer en passiv investering på over 5%.
The share price as of April 28, 2026 is 116,54 / share. Previously, on April 29, 2025, the share price was 43,07 / share. This represents an increase of 170,58% over that period.

Fondens stemningsscore
Fund Sentiment Score (fka Ownership Accumulation Score) finder de aktier, der bliver mest købt af fonde. Det er resultatet af en sofistikeret, multi-faktor kvantitativ model, der identificerer virksomheder med de højeste niveauer af institutionel akkumulering. Scoringsmodellen bruger en kombination af den samlede stigning i oplyste ejere, ændringerne i porteføljeallokeringer i disse ejere og andre målinger. Tallet går fra 0 til 100, hvor højere tal indikerer et højere niveau af akkumulering for sine jævnaldrende, og 50 er gennemsnittet.
Opdateringsfrekvens: Dagligt
Se Ownership Explorer, som giver en liste over højest rangerende virksomheder.
AI+ Ask Fintel’s AI assistant about Nextpower Inc..
Select a question to share a public post with an AI-crafted answer.
Thinking of good questions…
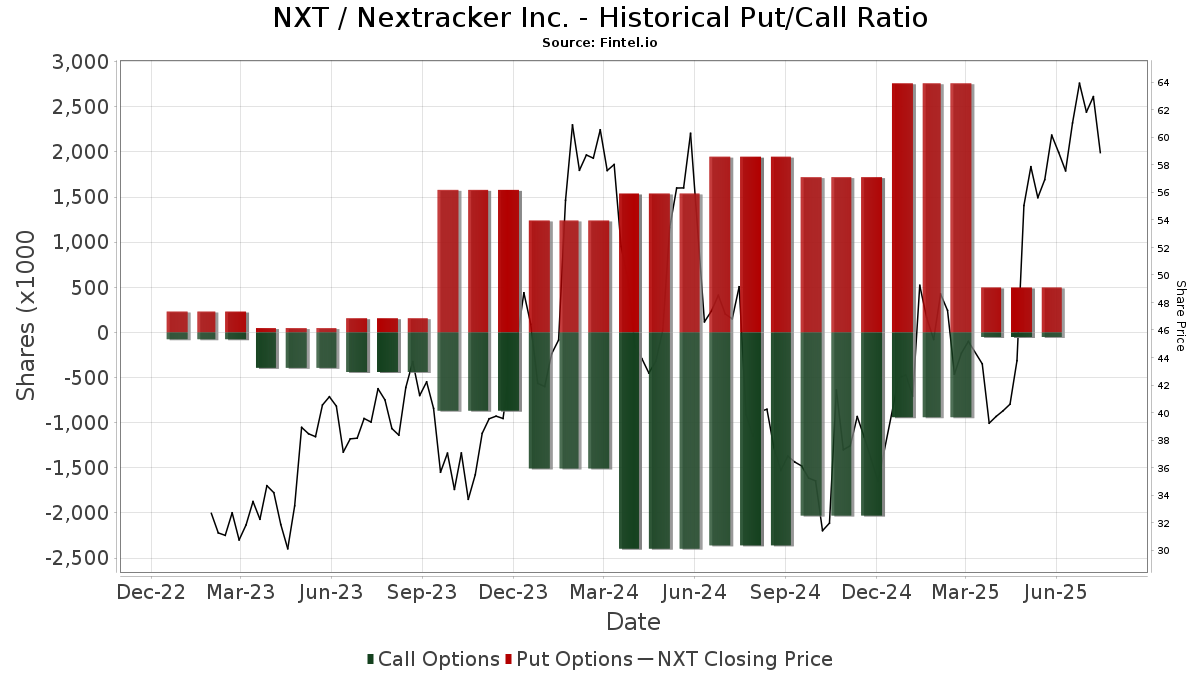
Institutionel Put/Call-forhold
Ud over at indberette standardaktie- og gældsudstedelser skal institutter med mere end 100 mill. aktiver under forvaltning også oplyse deres put- og call-optionsbeholdninger. Da salgsoptioner generelt indikerer negativ stemning, og købsoptioner indikerer positiv stemning, kan vi få en fornemmelse af den overordnede institutionelle stemning ved at plotte forholdet mellem put og kald. Diagrammet til højre viser det historiske put/call-forhold for dette instrument.
Brug af Put/Call Ratio som en indikator for investorernes stemning overvinder en af de vigtigste mangler ved at bruge totalt institutionelt ejerskab, som er, at en betydelig mængde af aktiver under forvaltning investeres passivt for at spore indekser. Passivt forvaltede fonde køber typisk ikke optioner, så indikatoren for put/call-forholdet følger mere nøje følelsen af aktivt forvaltede fonde.
13D/G-arkivering
Vi præsenterer 13D/G ansøgninger separat fra 13F ansøgninger på grund af den forskellige behandling af SEC. 13D/G-ansøgninger kan indgives af grupper af investorer (med én ledende), hvorimod 13F-ansøgninger ikke kan. Dette resulterer i situationer, hvor en investor kan indsende en 13D/G, der rapporterer én værdi for de samlede aktier (der repræsenterer alle de aktier, der ejes af investorgruppen), men derefter indsender en 13F, der rapporterer en anden værdi for de samlede aktier (der udelukkende repræsenterer deres egne) ejendomsret). Det betyder, at aktieejerskab af 13D/G-arkiver og 13F-arkiveringer ofte ikke er direkte sammenlignelige, så vi præsenterer dem separat.
Bemærk: Fra den 16. maj 2021 viser vi ikke længere ejere, der ikke har indsendt en 13D/G inden for det seneste år. Tidligere viste vi den fulde historie af 13D/G-arkiver. Generelt skal enheder, der er forpligtet til at indgive 13D/G-ansøgninger, indgive mindst årligt, før de indsender en afsluttende ansøgning. Dog forlader fonde nogle gange positioner uden at indsende en afsluttende ansøgning (dvs. de afvikler), så visning af den fulde historie resulterede nogle gange i forvirring om det nuværende ejerskab. For at undgå forvirring viser vi nu kun 'aktuelle' ejere - det vil sige - ejere, der har anmeldt inden for det seneste år.
Upgrade to unlock premium data.
| Fil dato | Form | Investor | Forrige Aktier |
Seneste Aktier |
Δ Aktier (Procent) |
Ejendomsret (Procent) |
Δ Ejerskab (Procent) |
|
|---|---|---|---|---|---|---|---|---|
| 2026-03-27 | VANGUARD GROUP INC | 13,600,362 | 0 | -100.00 | 0.00 | -100.00 | ||
| 2026-02-11 | PRIMECAP MANAGEMENT CO/CA/ | 7,844,407 | 6,951,597 | -11.38 | 4.68 | -14.44 | ||
| 2026-01-08 | FMR LLC | 5,143,252 | 17,203,278 | 234.48 | 11.60 | 222.22 | ||
| 2025-04-25 | BlackRock, Inc. | 25,229,536 | 20,403,744 | -19.13 | 14.20 | -19.32 |
13F og NPORT arkivering
Detaljer om 13F-arkivering er gratis. Detaljer om NP-ansøgninger kræver et premium-medlemskab. Grønne rækker angiver nye positioner. Røde rækker angiver lukkede positioner. Klik på linket ikon for at se den fulde transaktionshistorik.
Opgrader
for at låse premium-data op og eksportere til Excel ![]() .
.
| Fil dato | Kilde | Investor | Type | Gennemsnitlig pris (Øst) |
Aktier | Δ Aktier (%) |
Rapporteret Værdi ($1000) |
Δ Værdi (%) |
Port Alloc (%) |
|
|---|---|---|---|---|---|---|---|---|---|---|
| 2026-04-10 | 13F | Atala Financial Inc | 24.737 | -11,51 | 3.047 | 25,13 | ||||
| 2026-02-17 | 13F | Millennium Management Llc | Put | 305.500 | 43,43 | 26.612 | 68,87 | |||
| 2026-02-17 | 13F | Millennium Management Llc | 118.383 | -46,50 | 10.312 | -37,01 | ||||
| 2026-02-10 | 13F | Triglav Skladi, D.o.o. | 6.100 | 531 | ||||||
| 2026-02-17 | 13F | Millennium Management Llc | Call | 77.100 | 24,76 | 6.716 | 46,89 | |||
| 2026-04-16 | 13F | Capital Advisors, Ltd. LLC | 815 | 0,00 | 0 | |||||
| 2026-02-13 | 13F | Prudential Financial Inc | 194.777 | -13,16 | 16.967 | 2,24 | ||||
| 2026-03-03 | 13F/A | Caitong International Asset Management Co., Ltd | 33 | 3 | ||||||
| 2026-02-09 | 13F | MTM Investment Management, LLC | 90 | 0,00 | 8 | 16,67 | ||||
| 2026-02-17 | 13F | Wellington Management Group Llp | 4.168.528 | -13,98 | 363.120 | 1,27 | ||||
| 2026-02-13 | 13F | BNP Paribas Asset Management Holding S.A. | 736.677 | 19,37 | 64 | 42,22 | ||||
| 2026-02-06 | 13F | Global Retirement Partners, LLC | 0 | -100,00 | 0 | |||||
| 2026-02-11 | 13F | Vestcor Inc | 21.947 | 480,76 | 2 | |||||
| 2026-02-17 | 13F | Royal Bank Of Canada | Call | 0 | -100,00 | 0 | ||||
| 2026-02-12 | 13F | California Public Employees Retirement System | 252.051 | -0,01 | 21.956 | 17,73 | ||||
| 2026-02-13 | 13F | Verition Fund Management LLC | 9.600 | -76,92 | 836 | -72,83 | ||||
| 2026-02-12 | 13F | South Dakota Investment Council | 24.117 | -8,36 | 2 | 100,00 | ||||
| 2026-02-13 | 13F | Itau Unibanco Holding S.A. | 10.044 | 875 | ||||||
| 2026-04-28 | 13F | Abel Hall, LLC | 8.548 | 23,53 | 1.030 | 71,10 | ||||
| 2026-02-17 | 13F | CWM Advisors, LLC | 0 | -100,00 | 0 | |||||
| 2026-02-13 | 13F | Occam Crest Management LP | 50.000 | 11,11 | 4.356 | 30,82 | ||||
| 2026-02-06 | 13F | Tredje AP-fonden | 0 | -100,00 | 0 | |||||
| 2026-02-09 | 13F | Hartline Investment Corp/ | 2.400 | 209 | ||||||
| 2026-02-10 | 13F | Eurizon Capital SGR S.p.A. | 2.682 | 233 | ||||||
| 2026-02-09 | 13F | Nia Impact Advisors, Llc | 74.117 | -13,83 | 6.456 | 1,45 | ||||
| 2026-02-17 | 13F | One Fin Capital Management LP | 300.000 | -28,57 | 26.133 | -15,90 | ||||
| 2026-04-24 | 13F | UMA Financial Services, Inc. | 21 | 0,00 | 3 | 100,00 | ||||
| 2026-02-13 | 13F | FORA Capital, LLC | 12.794 | 282,60 | 1.114 | 351,01 | ||||
| 2026-04-24 | 13F | Root Financial Partners, LLC | 446 | 30,03 | 54 | 82,76 | ||||
| 2026-01-23 | 13F | Optima Capital Llc | 14 | 1 | ||||||
| 2026-02-09 | 13F | Putnam Fl Investment Management Co | 7.065 | 615 | ||||||
| 2026-02-11 | 13F | Twin Tree Management, LP | Call | 196.400 | 50,73 | 17.108 | 77,47 | |||
| 2026-02-17 | 13F | Lombard Odier Asset Management (Europe) Ltd | 77.916 | -81,44 | 6.787 | -79,48 | ||||
| 2026-02-11 | 13F | Twin Tree Management, LP | Put | 36.800 | -84,07 | 3.206 | -81,25 | |||
| 2026-04-06 | 13F | Highline Wealth Partners Llc | 4 | 0,00 | 0 | |||||
| 2026-02-13 | 13F | De Lisle Partners LLP | 73.000 | 37,74 | 6.358 | 62,17 | ||||
| 2026-04-20 | 13F | Hilton Head Capital Partners, LLC | 11 | 0,00 | 1 | |||||
| 2026-04-22 | 13F | Retirement Guys Formula Llc | 2.077 | -20,76 | 250 | 9,65 | ||||
| 2026-04-27 | 13F | Leonteq Securities AG | 6.684 | -26,89 | 806 | 1,13 | ||||
| 2026-03-04 | 13F | Rehmann Capital Advisory Group | 2.680 | 233 | ||||||
| 2025-11-14 | 13F | Wetherby Asset Management Inc | 7.490 | 554 | ||||||
| 2026-02-11 | 13F | Westfield Capital Management Co Lp | 1.090.300 | -22,01 | 94.976 | -8,18 | ||||
| 2026-02-17 | 13F | Shelton Capital Management | 15.213 | -0,47 | 1.325 | 17,26 | ||||
| 2026-04-28 | 13F | Cushing Asset Management, Lp | 143.000 | -12,27 | 17.239 | 21,41 | ||||
| 2026-04-28 | 13F | Corbyn Investment Management Inc/md | 68.608 | -15,96 | 8.271 | 16,30 | ||||
| 2026-02-09 | 13F | Keating Financial Advisory Services, Inc. | 171 | 15 | ||||||
| 2026-02-17 | 13F | Tower Research Capital LLC (TRC) | 6.456 | -29,75 | 562 | -17,23 | ||||
| 2026-03-16 | 13F | Osbon Capital Management Llc | 4.526 | 394 | ||||||
| 2026-02-13 | 13F | Ieq Capital, Llc | 5.175 | -44,17 | 451 | -34,31 | ||||
| 2026-02-12 | 13F | Empirical Finance, LLC | 22.390 | 0,00 | 1.950 | 17,75 | ||||
| 2026-01-28 | 13F | WPG Advisers, LLC | 81 | 7 | ||||||
| 2026-04-15 | 13F | Trust Co Of Toledo Na /oh/ | 198 | 0,00 | 24 | 35,29 | ||||
| 2026-04-15 | 13F | Exchange Traded Concepts, Llc | 1.666 | -42,23 | 201 | -20,32 | ||||
| 2026-04-27 | 13F | Truist Financial Corp | 4.941 | -5,85 | 596 | 30,20 | ||||
| 2026-04-13 | 13F | IFP Advisors, Inc | 4.960 | -2,69 | 598 | 34,46 | ||||
| 2026-01-27 | 13F | Zurcher Kantonalbank (Zurich Cantonalbank) | 813.637 | -14,60 | 70.876 | 0,54 | ||||
| 2026-04-15 | 13F | Atwood & Palmer Inc | 0 | -100,00 | 0 | |||||
| 2026-01-30 | 13F | Richardson Capital Management LLC | 230 | 0,00 | 20 | 17,65 | ||||
| 2026-02-12 | 13F | Principal Securities, Inc. | 0 | -100,00 | 0 | -100,00 | ||||
| 2026-02-11 | 13F | Axiom International Investors Llc /de | 145.640 | 12.687 | ||||||
| 2026-02-12 | 13F | New York State Common Retirement Fund | 395.548 | -15,64 | 34.456 | -0,68 | ||||
| 2026-02-17 | 13F | Advisory Services Network, LLC | 6.346 | 0,49 | 553 | 18,20 | ||||
| 2026-04-27 | 13F | New York State Teachers Retirement System | 136.835 | -4,66 | 16 | 33,33 | ||||
| 2026-02-09 | 13F | Quest Partners LLC | 6.529 | 24,41 | 569 | 46,39 | ||||
| 2026-02-10 | 13F | Bank of New York Mellon Corp | 983.661 | -7,23 | 85.687 | 9,22 | ||||
| 2026-02-11 | 13F | Meeder Asset Management Inc | 11.838 | -1,06 | 1.031 | 16,50 | ||||
| 2026-02-17 | 13F | Osterweis Capital Management Inc | 48.250 | 4.203 | ||||||
| 2025-11-14 | 13F | Militia Capital Partners, LP | 11.600 | 90,16 | 858 | 159,21 | ||||
| 2026-02-09 | 13F | Geode Capital Management, Llc | 4.021.741 | 6,25 | 350.385 | 25,09 | ||||
| 2026-02-17 | 13F | ISAM Funds (UK) Ltd | 0 | -100,00 | 0 | |||||
| 2026-02-10 | 13F | Fideuram Asset Management (Ireland) dac | 7.000 | 622 | ||||||
| 2026-02-18 | 13F | GWM Advisors LLC | 630 | -96,82 | 55 | -84,48 | ||||
| 2025-11-13 | 13F | Empowered Funds, LLC | 0 | -100,00 | 0 | |||||
| 2026-01-30 | 13F | American Capital Advisory, LLC | 262 | 0,00 | 23 | 15,79 | ||||
| 2026-02-10 | 13F | Acadian Asset Management Llc | 13.563 | 2.667,96 | 1 | |||||
| 2026-02-17 | 13F | Ameriprise Financial Inc | 463.856 | -34,36 | 40.407 | -22,72 | ||||
| 2025-11-14 | 13F | Schonfeld Strategic Advisors LLC | 0 | -100,00 | 0 | -100,00 | ||||
| 2026-04-21 | 13F | GHP Investment Advisors, Inc. | 2 | 0 | ||||||
| 2026-02-19 | 13F | Atomi Financial Group, Inc. | 2.926 | 255 | ||||||
| 2026-04-27 | 13F | Mount Yale Investment Advisors, LLC | 2.129 | 257 | ||||||
| 2026-02-13 | 13F | Sei Investments Co | 280.891 | -9,16 | 24.469 | 6,95 | ||||
| 2026-01-09 | 13F | Capital CS Group, LLC | Put | 47.600 | 155 | |||||
| 2026-02-13 | 13F | Landscape Capital Management, L.l.c. | 0 | -100,00 | 0 | |||||
| 2026-02-17 | 13F | Oddo Bhf Asset Management Sas | 0 | -100,00 | 0 | -100,00 | ||||
| 2026-02-17 | 13F | DZ BANK AG Deutsche Zentral Genossenschafts Bank, Frankfurt am Main | 0 | -100,00 | 0 | |||||
| 2026-02-12 | 13F | Fuller & Thaler Asset Management, Inc. | 1.293.747 | 10,50 | 112.698 | 30,10 | ||||
| 2026-04-16 | 13F | BI Asset Management Fondsmaeglerselskab A/S | 68.294 | 8 | ||||||
| 2026-01-23 | 13F | Burney Co/ | 12.577 | -1,23 | 1.096 | 16,24 | ||||
| 2026-04-21 | 13F | Maseco Llp | 25 | 3 | ||||||
| 2026-02-12 | 13F | Federation des caisses Desjardins du Quebec | 37.408 | 6,53 | 3.259 | 25,40 | ||||
| 2026-04-17 | 13F | CENTRAL TRUST Co | 183 | 0,00 | 22 | 46,67 | ||||
| 2026-04-22 | 13F | Pictet Asset Management Holding SA | 2.760.792 | -0,75 | 332.532 | 37,23 | ||||
| 2025-10-31 | 13F | Nicola Wealth Management Ltd. | 0 | -100,00 | 0 | |||||
| 2026-04-13 | 13F | Wedge Capital Management L L P/nc | 500.485 | -21,76 | 60.333 | 8,28 | ||||
| 2026-04-28 | 13F | Fortis Capital Advisors, LLC | 8.215 | -14,95 | 990 | 17,72 | ||||
| 2026-02-11 | 13F | Ameritas Investment Partners, Inc. | 39.250 | -2,03 | 3.419 | 15,35 | ||||
| 2026-02-12 | 13F | Cloud Capital Management, LLC | 0 | -100,00 | 0 | |||||
| 2026-04-22 | 13F | Figure 8 Investment Strategies Llc | 25.321 | -2,65 | 3.052 | 34,75 | ||||
| 2026-02-13 | 13F | Barclays Plc | 368.718 | 7,92 | 32.119 | 27,06 | ||||
| 2026-02-13 | 13F | Barclays Plc | Put | 840.000 | 73.172 | |||||
| 2026-04-23 | 13F | Game Plan Financial Advisors, LLC | 20 | 0,00 | 2 | 100,00 | ||||
| 2026-02-05 | 13F | Thrivent Financial For Lutherans | 59.312 | -7,71 | 5 | 25,00 | ||||
| 2026-02-09 | 13F | Coldstream Capital Management Inc | 2.630 | 229 | ||||||
| 2026-02-06 | 13F | Cullen/frost Bankers, Inc. | 620 | 11,11 | 54 | 29,27 | ||||
| 2026-02-11 | 13F | Franklin Resources Inc | 219.501 | 110,03 | 19.121 | 147,28 | ||||
| 2026-02-04 | 13F | Virginia Retirement Systems Et Al | 12.038 | -46,94 | 1.049 | -37,54 | ||||
| 2026-01-29 | 13F | Teachers Retirement System Of The State Of Kentucky | 71.755 | 7,49 | 6 | 50,00 | ||||
| 2026-01-27 | 13F | TD Waterhouse Canada Inc. | 244 | 65,99 | 21 | 90,91 | ||||
| 2026-02-03 | 13F | Crossmark Global Holdings, Inc. | 8.193 | 12,82 | 714 | 32,77 | ||||
| 2026-02-11 | 13F | Illinois Municipal Retirement Fund | 8.373 | 729 | ||||||
| 2026-02-17 | 13F | Shay Capital LLC | 4.100 | -18,00 | 357 | -3,25 | ||||
| 2026-02-17 | 13F | American Trust Investment Advisors, LLC | 2.675 | -27,21 | 233 | -14,02 | ||||
| 2026-02-17 | 13F | Fred Alger Management, Llc | 6.018 | 0,00 | 524 | 17,75 | ||||
| 2026-02-17 | 13F | Hotchkis & Wiley Capital Management Llc | 45.974 | -1,71 | 4.005 | 15,72 | ||||
| 2026-02-17 | 13F | Portolan Capital Management, LLC | 79.789 | 6.950 | ||||||
| 2026-02-06 | 13F | Lazard Freres Gestion S.A.S. | 10.850 | 0,00 | 1 | |||||
| 2026-04-20 | 13F | Banque Cantonale Vaudoise | 29.828 | -1,15 | 3.596 | 36,83 | ||||
| 2025-11-13 | 13F | Capital World Investors | 0 | -100,00 | 0 | -100,00 | ||||
| 2026-04-23 | 13F | Marquette Asset Management, LLC | 12 | 71,43 | 1 | |||||
| 2026-02-13 | 13F | Macquarie Group Ltd | 0 | -100,00 | 0 | |||||
| 2026-02-17 | 13F | Cambria Investment Management, L.P. | 7.608 | -23,42 | 663 | -9,93 | ||||
| 2026-04-21 | 13F | Venturi Wealth Management, LLC | 3.101 | 0,00 | 374 | 38,15 | ||||
| 2026-02-13 | 13F | Natixis | 0 | -100,00 | 0 | |||||
| 2025-11-14 | 13F | Point72 Hong Kong Ltd | 0 | -100,00 | 0 | -100,00 | ||||
| 2026-02-10 | 13F | Principia Wealth Advisory, LLC | 3 | 0 | ||||||
| 2026-03-26 | 13F/A | Peak6 Llc | 0 | -100,00 | 0 | -100,00 | ||||
| 2026-04-15 | 13F | Financial Management Professionals, Inc. | 5 | 66,67 | 1 | |||||
| 2026-02-13 | 13F | Morgan Stanley | 973.500 | -0,26 | 84.802 | 17,43 | ||||
| 2026-02-13 | 13F | Rafferty Asset Management, LLC | 2.494 | 217 | ||||||
| 2026-02-17 | 13F | Public Employees Retirement System Of Ohio | 318 | 17,34 | 28 | 35,00 | ||||
| 2026-02-17 | 13F | Captrust Financial Advisors | 12.017 | -13,22 | 1.047 | 2,15 | ||||
| 2026-04-21 | 13F | Vise Technologies, Inc. | 10.923 | 0,00 | 952 | 0,00 | ||||
| 2026-04-21 | 13F | Financial Consulate, Inc | 187 | -6,50 | 23 | 29,41 | ||||
| 2026-02-03 | 13F | Maxi Investments CY Ltd | 26.500 | 2 | ||||||
| 2026-02-03 | 13F | Sequoia Financial Advisors, LLC | 4.027 | 351 | ||||||
| 2026-02-13 | 13F | Fieldview Capital Management, LLC | 0 | -100,00 | 0 | |||||
| 2026-02-05 | 13F | Cambridge Investment Research Advisors, Inc. | 22.580 | -4,22 | 2 | 0,00 | ||||
| 2026-02-13 | 13F | Citigroup Inc | Call | 0 | -100,00 | 0 | -100,00 | |||
| 2026-02-17 | 13F | T. Rowe Price Investment Management, Inc. | 388.055 | -63,73 | 34 | -58,23 | ||||
| 2026-02-12 | 13F | Federated Hermes, Inc. | 440.646 | 24,51 | 38.385 | 46,59 | ||||
| 2025-11-14 | 13F | Slate Path Capital LP | 0 | -100,00 | 0 | -100,00 | ||||
| 2026-01-30 | 13F | Turning Point Benefit Group, Inc. | 0 | -100,00 | 0 | |||||
| 2025-11-13 | 13F | Twin Tree Management, LP | 0 | -100,00 | 0 | -100,00 | ||||
| 2026-02-13 | 13F | Charles Schwab Investment Management Inc | 1.815.130 | 0,72 | 158.116 | 18,57 | ||||
| 2026-01-23 | 13F | Legacy Bridge, LLC | 13.470 | 1,51 | 1.173 | 19,57 | ||||
| 2025-11-14 | 13F | Trexquant Investment LP | 0 | -100,00 | 0 | |||||
| 2026-02-20 | 13F | Sunbelt Securities, Inc. | 9 | 0,00 | 1 | |||||
| 2026-02-17 | 13F | Tenzing Global Management, LLC | 162.500 | 225,00 | 14.155 | 282,67 | ||||
| 2026-02-11 | 13F | Jpmorgan Chase & Co | 1.360.803 | -17,58 | 118.540 | -2,96 | ||||
| 2026-02-12 | 13F | Ci Investments Inc. | 0 | -100,00 | 0 | |||||
| 2026-02-10 | 13F | Clear Harbor Asset Management, LLC | 147.668 | -0,60 | 12.863 | 17,03 | ||||
| 2026-02-04 | 13F | Pacer Advisors, Inc. | 0 | -100,00 | 0 | -100,00 | ||||
| 2026-04-13 | 13F | True Wealth Design, LLC | 52 | 0,00 | 6 | 50,00 | ||||
| 2026-02-17 | 13F | Gotham Asset Management, LLC | 15.958 | -36,99 | 1.390 | -25,79 | ||||
| 2026-04-20 | 13F | Moody Aldrich Partners Llc | 43.700 | 1,54 | 5.268 | 40,55 | ||||
| 2026-01-30 | 13F | Wealth High Governance Capital Ltda | 244.105 | 21.264 | ||||||
| 2026-02-12 | 13F | M&G Plc | 1.557 | 135 | ||||||
| 2026-04-27 | 13F | Greenleaf Trust | 2.532 | 4,98 | 305 | 45,24 | ||||
| 2026-02-09 | 13F | Williamson Legacy Group, LLC | 15.256 | 1.329 | ||||||
| 2026-02-06 | 13F | Envestnet Portfolio Solutions, Inc. | 10.093 | -1,75 | 879 | 15,66 | ||||
| 2026-02-12 | 13F | Logan Capital Management Inc | 0 | -100,00 | 0 | -100,00 | ||||
| 2026-02-06 | 13F | Larson Financial Group LLC | 94 | 8,05 | 8 | 33,33 | ||||
| 2026-02-17 | 13F | LMR Partners LLP | Call | 0 | -100,00 | 0 | ||||
| 2026-02-17 | 13F | LMR Partners LLP | 0 | -100,00 | 0 | |||||
| 2026-02-09 | 13F | William Blair Investment Management, Llc | 1.362.794 | -7,27 | 118.713 | 9,17 | ||||
| 2026-02-13 | 13F | Nfj Investment Group, Llc | 31.484 | -40,87 | 2.743 | -30,39 | ||||
| 2026-02-04 | 13F | Swiss Life Asset Management Ltd | 10.319 | 52,96 | 899 | 79,96 | ||||
| 2026-01-28 | 13F | Klp Kapitalforvaltning As | 32.695 | 5,83 | 2.848 | 24,64 | ||||
| 2026-04-08 | 13F | TrimTabs Asset Management, LLC | 84.281 | -41,78 | 10.160 | -19,43 | ||||
| 2026-02-12 | 13F | Rossby Financial, LCC | 26 | 2 | ||||||
| 2025-10-30 | 13F | Flagship Wealth Advisors, Llc | 0 | -100,00 | 0 | -100,00 | ||||
| 2026-01-29 | 13F | State Of Michigan Retirement System | 35.100 | -0,28 | 3.058 | 17,40 | ||||
| 2026-04-17 | 13F | Brown, Lisle/cummings, Inc. | 7 | 1 | ||||||
| 2026-04-24 | 13F | Strs Ohio | 150.900 | 4,14 | 18.191 | 44,11 | ||||
| 2026-02-13 | 13F | Sumitomo Life Insurance Co | 8.932 | 778 | ||||||
| 2026-02-17 | 13F | Point72 Asset Management, L.P. | Put | 62.300 | 641,67 | 5.427 | 773,75 | |||
| 2026-02-17 | 13F | Point72 Asset Management, L.P. | Call | 83.400 | 327,69 | 7.265 | 403,74 | |||
| 2025-11-14 | 13F | Brevan Howard Capital Management LP | 0 | -100,00 | 0 | |||||
| 2026-02-17 | 13F | Granahan Investment Management Inc/ma | 384.710 | -7,34 | 33.512 | 9,10 | ||||
| 2026-02-12 | 13F | Skandinaviska Enskilda Banken AB (publ) | 447.076 | -37,42 | 38.945 | -26,30 | ||||
| 2026-02-13 | 13F | Neo Ivy Capital Management | 2.453 | -89,89 | 214 | -88,13 | ||||
| 2026-02-17 | 13F | Altshuler Shaham Ltd | 13.424 | 6,17 | 1.169 | 25,03 | ||||
| 2026-02-17 | 13F | Nomura Holdings Inc | Put | 100.000 | 8.711 | |||||
| 2026-04-17 | 13F | Hanson & Doremus Investment Management | 704 | 0 | ||||||
| 2026-01-29 | 13F | Renaissance Capital LLC | 80.407 | -35,99 | 7.004 | -24,64 | ||||
| 2026-02-13 | 13F | Candriam Luxembourg S.C.A. | 95.834 | -29,95 | 8.348 | -17,52 | ||||
| 2026-04-27 | 13F | Qrg Capital Management, Inc. | 4.492 | 35,22 | 542 | 87,20 | ||||
| 2026-02-13 | 13F | Edgestream Partners, L.P. | 0 | -100,00 | 0 | |||||
| 2026-02-02 | 13F | Nkcfo Llc | 1.680 | 0,90 | 0 | |||||
| 2026-02-17 | 13F | Delaware Management Holdings, Inc. | 810.092 | 70.571 | ||||||
| 2025-11-12 | 13F | Park Square Financial Group, LLC | 0 | -100,00 | 0 | |||||
| 2026-04-22 | 13F | Fort Washington Investment Advisors Inc /oh/ | 198.949 | -12,35 | 23.983 | 21,30 | ||||
| 2026-02-13 | 13F | Quarry LP | 0 | -100,00 | 0 | |||||
| 2026-02-18 | 13F | First Citizens Bank & Trust Co | 8.992 | 2,09 | 783 | 20,28 | ||||
| 2026-04-09 | 13F | Moody National Bank Trust Division | 24.847 | 26,48 | 2.995 | 75,04 | ||||
| 2026-02-11 | 13F | Prudential Plc | 47.609 | 13,11 | 4.147 | 33,17 | ||||
| 2026-02-10 | 13F | Nomura Asset Management Co Ltd | 480 | 0,00 | 42 | 17,14 | ||||
| 2026-02-12 | 13F | Renaissance Technologies Llc | 48.300 | -94,98 | 4.207 | -94,09 | ||||
| 2026-02-17 | 13F | Clayton Partners LLC | 40.100 | -1,00 | 3.493 | 16,59 | ||||
| 2026-02-17 | 13F | Nomura Holdings Inc | 126.427 | 178,73 | 11.013 | 228,16 | ||||
| 2026-02-17 | 13F | Nomura Holdings Inc | Call | 188.300 | -77,08 | 16.403 | -73,02 | |||
| 2026-02-17 | 13F | Wiley Bros.-aintree Capital, Llc | 261.823 | 4.406,42 | 22.806 | 5.215,85 | ||||
| 2026-04-24 | 13F | Triasima Portfolio Management inc. | 34.442 | 0,13 | 4.152 | 38,55 | ||||
| 2026-04-28 | 13F | Handelsbanken Fonder AB | 2.020.536 | 25,67 | 244 | 73,57 | ||||
| 2026-04-28 | 13F | Golden State Wealth Management, LLC | 30 | 0,00 | 4 | 50,00 | ||||
| 2026-04-24 | 13F | Yousif Capital Management, Llc | 44.246 | -4,75 | 5.334 | 19,25 | ||||
| 2026-02-12 | 13F | DRW Securities, LLC | 0 | -100,00 | 0 | -100,00 | ||||
| 2026-02-05 | 13F | High Note Wealth, LLC | 51 | -3,77 | 4 | 33,33 | ||||
| 2026-02-13 | 13F | Smartleaf Asset Management LLC | 299 | 107,64 | 26 | 160,00 | ||||
| 2026-02-17 | 13F | Balyasny Asset Management Llc | Call | 0 | -100,00 | 0 | ||||
| 2026-02-17 | 13F | Balyasny Asset Management Llc | Put | 0 | -100,00 | 0 | ||||
| 2026-02-12 | 13F | Marex Group plc | 2.390 | 208 | ||||||
| 2026-02-02 | 13F | Hussman Strategic Advisors, Inc. | 29.400 | 40,00 | 2.561 | 64,91 | ||||
| 2026-02-06 | 13F | EverSource Wealth Advisors, LLC | 1.314 | 12,21 | 114 | 32,56 | ||||
| 2026-02-13 | 13F | Martingale Asset Management L P | 15.665 | -30,19 | 1.365 | -17,83 | ||||
| 2026-02-13 | 13F | Graybill Bartz & Assoc Ltd | 0 | -100,00 | 0 | |||||
| 2026-04-20 | 13F | State of Alaska, Department of Revenue | 15.649 | 1,76 | 2 | 0,00 | ||||
| 2026-02-06 | 13F | Pnc Financial Services Group, Inc. | 13.723 | -7,05 | 1.195 | 9,43 | ||||
| 2026-01-29 | 13F | Comerica Bank | 111.539 | -48,14 | 9.716 | -38,94 | ||||
| 2026-02-17 | 13F | Snowden Capital Advisors LLC | 2.383 | 208 | ||||||
| 2026-02-19 | 13F | Mcguire Capital Advisors Inc | 2.646 | 230 | ||||||
| 2026-02-13 | 13F | Public Employees Retirement Association Of Colorado | 12.276 | 0,00 | 1 | |||||
| 2026-04-06 | 13F | Rosenberg Matthew Hamilton | 36 | 0,00 | 4 | 33,33 | ||||
| 2026-04-17 | 13F | AdvisorNet Financial, Inc | 1 | 0 | ||||||
| 2026-02-13 | 13F | Cetera Trust Company, N.A | 1.741 | 0,00 | 152 | 17,97 | ||||
| 2026-02-11 | 13F | Deutsche Bank Ag\ | 1.109.239 | -40,74 | 96.626 | -30,23 | ||||
| 2026-02-05 | 13F | Arbejdsmarkedets Tillaegspension | 262.576 | 22.873 | ||||||
| 2026-02-17 | 13F | Polymer Capital Management (US) LLC | 5.051 | 440 | ||||||
| 2026-02-17 | 13F | Limestone Investment Advisors LP | 55.314 | -2,05 | 4.818 | 15,32 | ||||
| 2026-02-17 | 13F | Limestone Investment Advisors LP | Call | 2.600 | 226 | |||||
| 2026-02-17 | 13F | Persistent Asset Partners Ltd | 0 | -100,00 | 0 | |||||
| 2026-02-17 | 13F | Guggenheim Capital Llc | 9.544 | 12,73 | 831 | 32,75 | ||||
| 2026-02-11 | 13F | O'shaughnessy Asset Management, Llc | 13.096 | 19,07 | 1.141 | 40,22 | ||||
| 2026-02-13 | 13F | Virtus ETF Advisers LLC | 22.405 | 0,00 | 1.952 | 17,74 | ||||
| 2026-02-18 | 13F | Mackenzie Financial Corp | 11.015 | 19,09 | 957 | 39,77 | ||||
| 2026-02-11 | 13F | Fox Run Management, L.l.c. | 4.661 | -13,33 | 406 | 2,27 | ||||
| 2026-02-09 | 13F | Roubaix Capital, LLC | 54.513 | 4.749 | ||||||
| 2026-02-10 | 13F | Goldman Sachs Group Inc | 1.288.280 | 32,07 | 112.222 | 55,49 | ||||
| 2026-02-17 | 13F | Russell Investments Group, Ltd. | 191.238 | -0,21 | 16.659 | 17,49 | ||||
| 2026-02-13 | 13F | Arkadios Wealth Advisors | 20.661 | -13,02 | 1.800 | 2,39 | ||||
| 2026-02-17 | 13F | Engineers Gate Manager LP | 0 | -100,00 | 0 | |||||
| 2025-11-14 | 13F | Royal Bank Of Canada | Put | 0 | -100,00 | 0 | -100,00 | |||
| 2026-04-06 | 13F | GAMMA Investing LLC | 5.149 | 9,60 | 621 | 51,59 | ||||
| 2026-02-17 | 13F | Banco Bilbao Vizcaya Argentaria, S.a. | 2.342 | 205 | ||||||
| 2026-02-12 | 13F | Ensign Peak Advisors, Inc | 24.293 | -2,69 | 2.116 | 14,56 | ||||
| 2026-02-17 | 13F | Mercer Global Advisors Inc /adv | 14.601 | 7,92 | 1.272 | 26,97 | ||||
| 2026-04-28 | 13F | Westfuller Advisors, LLC | 550 | 66 | ||||||
| 2026-02-10 | 13F | Envestnet Asset Management Inc | 108.673 | 3,71 | 9.466 | 22,09 | ||||
| 2026-01-28 | 13F | Universal- Beteiligungs- und Servicegesellschaft mbH | 220.506 | 24,05 | 19.200 | 45,99 | ||||
| 2026-02-17 | 13F | Keebeck Wealth Management, LLC | 4.995 | 435 | ||||||
| 2026-02-18 | 13F | State of Tennessee, Treasury Department | 61.904 | -4,11 | 7.248 | 51,76 | ||||
| 2026-04-23 | 13F | First Pacific Financial | 155 | 19 | ||||||
| 2026-04-16 | 13F | Center For Asset Management LLC | 3.666 | 442 | ||||||
| 2026-02-17 | 13F | Canada Pension Plan Investment Board | 3.400 | -97,57 | 296 | -97,14 | ||||
| 2026-02-10 | 13F | Norges Bank | 1.962.097 | 170.918 | ||||||
| 2026-04-20 | 13F | Assenagon Asset Management S.A. | 42.707 | -4,15 | 5.148 | 32,65 | ||||
| 2026-01-30 | 13F | Jennison Associates Llc | 79.777 | 24,92 | 6.949 | 47,07 | ||||
| 2026-02-13 | 13F | JustInvest LLC | 16.462 | 4,53 | 1.434 | 22,88 | ||||
| 2026-04-23 | 13F | Farmers & Merchants Investments Inc | 1.438 | 0,35 | 173 | 39,52 | ||||
| 2025-11-04 | 13F | Penserra Capital Management LLC | 0 | -100,00 | 0 | |||||
| 2026-02-17 | 13F | Glenmede Trust Co Na | 8.288 | 722 | ||||||
| 2026-02-17 | 13F | Lazard Asset Management Llc | 28.081 | 133,81 | 2.446 | 175,45 | ||||
| 2026-02-10 | 13F | CIBC World Markets Inc. | 0 | -100,00 | 0 | |||||
| 2026-01-21 | 13F | Azzad Asset Management Inc /adv | 11.345 | 988 | ||||||
| 2026-01-29 | 13F | Rakuten Securities, Inc. | 514 | 324,79 | 45 | 450,00 | ||||
| 2026-01-30 | 13F | NJ State Employees Deferred Compensation Plan | 0 | -100,00 | 0 | -100,00 | ||||
| 2026-04-20 | 13F | Kestra Private Wealth Services, Llc | 22.973 | 13,73 | 2.769 | 57,42 | ||||
| 2026-02-18 | 13F | Cim, Llc | 16.555 | 1.442 | ||||||
| 2026-02-05 | 13F | Allworth Financial LP | 0 | -100,00 | 0 | |||||
| 2026-02-10 | 13F | Globeflex Capital L P | 62.343 | -6,98 | 5.431 | 9,52 | ||||
| 2026-01-23 | 13F | Sumitomo Mitsui Trust Holdings, Inc. | 3.353 | 14,16 | 292 | 34,56 | ||||
| 2026-04-20 | 13F | Louisiana State Employees Retirement System | 43.100 | 4,87 | 5.196 | 45,11 | ||||
| 2026-04-28 | 13F | Sage Rhino Capital Llc | 4.991 | -4,88 | 602 | 31,51 | ||||
| 2025-11-14 | 13F | Colony Group, LLC | 0 | -100,00 | 0 | -100,00 | ||||
| 2026-02-12 | 13F | EHP Funds Inc. | 0 | -100,00 | 0 | |||||
| 2026-02-13 | 13F | Ubs Asset Management Americas Inc | 272.195 | -3,32 | 23.711 | 13,83 | ||||
| 2026-02-13 | 13F | K2 Principal Fund, L.p. | 0 | -100,00 | 0 | |||||
| 2026-02-17 | 13F | Clear Street Markets Llc | 47.000 | 64,49 | 4.094 | 93,66 | ||||
| 2026-02-05 | 13F | Northwestern Mutual Investment Management Company, Llc | 33.200 | 0,66 | 2.892 | 18,52 | ||||
| 2026-02-13 | 13F | SRS Capital Advisors, Inc. | 424 | -97,46 | 37 | -97,08 | ||||
| 2026-02-13 | 13F | Essex Investment Management Co Llc | 8.326 | 0,00 | 725 | 17,69 | ||||
| 2026-02-11 | 13F | Commonwealth Retirement Investments LLC | 100 | 9 | ||||||
| 2026-04-10 | 13F | Armstrong Advisory Group, Inc | 81 | 0,00 | 10 | 28,57 | ||||
| 2026-02-12 | 13F | State Board Of Administration Of Florida Retirement System | 29.450 | 0,00 | 2.565 | 17,71 | ||||
| 2025-11-10 | 13F | Clark Estates Inc/ny | 0 | -100,00 | 0 | -100,00 | ||||
| 2026-02-06 | 13F | Bare Financial Services, Inc | 19 | 2 | ||||||
| 2026-04-20 | 13F | Jfs Wealth Advisors, Llc | 98 | 6,52 | 12 | 37,50 | ||||
| 2026-01-27 | 13F | Graphene Investments SAS | 32.800 | -15,25 | 2.857 | -0,21 | ||||
| 2026-01-28 | 13F | Teacher Retirement System Of Texas | 127.609 | -68,91 | 11.116 | -63,40 | ||||
| 2026-02-17 | 13F | Citadel Advisors Llc | Put | 545.838 | -18,66 | 47.548 | -4,24 | |||
| 2026-02-17 | 13F | Citadel Advisors Llc | Call | 695.008 | -4,99 | 60.542 | 11,85 | |||
| 2026-02-13 | 13F | Kayne Anderson Capital Advisors Lp | 0 | -100,00 | 0 | |||||
| 2026-02-17 | 13F | Jones Financial Companies Lllp | 2.977 | -40,70 | 259 | -29,23 | ||||
| 2026-01-28 | 13F | Geneos Wealth Management Inc. | 43 | 0,00 | 4 | 0,00 | ||||
| 2026-02-17 | 13F | PDT Partners, LLC | 0 | -100,00 | 0 | |||||
| 2026-02-17 | 13F | Optiver Holding B.V. | 0 | -100,00 | 0 | |||||
| 2026-02-10 | 13F/A | Northwestern Mutual Wealth Management Co | 242 | -51,11 | 21 | -41,67 | ||||
| 2026-02-13 | 13F | Advyzon Investment Management, LLC | 2.663 | -14,95 | 232 | 0,00 | ||||
| 2026-02-17 | 13F | Laird Norton Trust Company, Llc | 7.480 | 652 | ||||||
| 2026-02-17 | 13F | Capital Fund Management S.a. | Put | 78.200 | 67,81 | 6.812 | 97,62 | |||
| 2026-02-17 | 13F | Capital Fund Management S.a. | Call | 52.500 | 28,36 | 4.573 | 51,12 | |||
| 2026-02-10 | 13F | SCP Investment, LP | 3.888 | -71,60 | 339 | -66,60 | ||||
| 2026-02-09 | 13F/A | Swedbank AB | 159.500 | 16,85 | 13.894 | 37,58 | ||||
| 2026-04-13 | 13F | Mather Group, Llc. | 30 | 4 | ||||||
| 2025-11-14 | 13F | WealthTrak Capital Management LLC | 0 | -100,00 | 0 | |||||
| 2026-04-28 | 13F | Flagship Harbor Advisors, Llc | 0 | -100,00 | 0 | |||||
| 2026-04-22 | 13F | Tred Avon Family Wealth, Llc | 2.728 | 0,04 | 329 | 38,40 | ||||
| 2026-04-13 | 13F | Wolff Wiese Magana Llc | 133 | 0,00 | 16 | 45,45 | ||||
| 2026-04-07 | 13F | Central Pacific Bank - Trust Division | 1.227 | -15,79 | 148 | 16,67 | ||||
| 2026-02-13 | 13F | Walleye Trading LLC | Put | 662.400 | -3,89 | 57.702 | 13,15 | |||
| 2026-02-10 | 13F | Rothschild Investment Llc | 1.061 | 0,95 | 92 | 19,48 | ||||
| 2026-02-13 | 13F | Walleye Trading LLC | Call | 515.000 | -4,28 | 44.862 | 12,70 | |||
| 2026-02-02 | 13F | Millstone Evans Group, LLC | 1.327 | 0,00 | 116 | 17,35 | ||||
| 2026-02-11 | 13F | Allianz Asset Management GmbH | 604.333 | -23,94 | 52.643 | -10,45 | ||||
| 2026-04-17 | 13F | Cidel Asset Management Inc | 4.523 | 545 | ||||||
| 2026-02-12 | 13F | Xponance, Inc. | 19.601 | -11,19 | 1.707 | 4,53 | ||||
| 2026-02-17 | 13F | Algert Global Llc | 443.454 | -19,61 | 39 | -5,00 | ||||
| 2026-04-07 | 13F | Retirement Wealth Solutions LLC | 21 | 320,00 | 3 | |||||
| 2026-04-28 | 13F | Cypress Capital, LLC | 20.944 | -1,79 | 2.525 | 35,92 | ||||
| 2026-02-12 | 13F | Cibc World Markets Corp | 9.659 | -44,77 | 841 | -11,47 | ||||
| 2026-02-17 | 13F | Palo Duro Investment Partners, Lp | 48.912 | -49,70 | 4.261 | -40,79 | ||||
| 2026-04-13 | 13F | Loring Wolcott & Coolidge Fiduciary Advisors Llp/ma | 500 | 0,00 | 59 | 11,54 | ||||
| 2026-02-02 | 13F | Core Alternative Capital | 52 | 0,00 | 5 | 33,33 | ||||
| 2025-10-30 | 13F | CNB Bank | 0 | -100,00 | 0 | -100,00 | ||||
| 2026-04-27 | 13F | La Banque Postale Asset Management SA | 29.773 | 3.589 | ||||||
| 2026-02-17 | 13F | Susquehanna International Group, Llp | Call | 1.035.500 | -30,26 | 90.202 | -17,90 | |||
| 2026-02-17 | 13F | Susquehanna International Group, Llp | 375.484 | 801,05 | 32.708 | 960,91 | ||||
| 2026-02-17 | 13F | Susquehanna International Group, Llp | Put | 1.670.800 | -17,67 | 145.543 | -3,07 | |||
| 2026-02-17 | 13F | Kemnay Advisory Services Inc. | 442 | 39 | ||||||
| 2026-04-28 | 13F | Bogart Wealth, LLC | 8 | 0,00 | 1 | |||||
| 2026-02-11 | 13F | Rise Advisors, LLC | 0 | -100,00 | 0 | |||||
| 2026-02-06 | 13F | Vestmark Advisory Solutions, Inc. | 8.638 | 752 | ||||||
| 2026-04-27 | 13F | Fideuram - Intesa Sanpaolo Private Banking S.p.a. | 116.149 | -3,21 | 14.002 | 33,94 | ||||
| 2026-04-15 | 13F | Journey Strategic Wealth Llc | 1.796 | 217 | ||||||
| 2026-02-05 | 13F | Amalgamated Bank | 62.408 | -3,78 | 5 | 25,00 | ||||
| 2026-02-17 | 13F | FIL Ltd | 320.337 | 12,41 | 27.905 | 32,34 | ||||
| 2026-04-23 | 13F | Oppenheimer Asset Management Inc. | 50.138 | 6.044 | ||||||
| 2026-02-05 | 13F | Baader Bank INC | 0 | -100,00 | 0 | |||||
| 2026-02-09 | 13F | Huntington National Bank | 383 | 480,30 | 33 | 725,00 | ||||
| 2026-04-22 | 13F | Union Bancaire Privee, UBP SA | 93.758 | 186,98 | 9.916 | 270,52 | ||||
| 2026-01-12 | 13F | Rialto Wealth Management, LLC | 10 | 25,00 | 1 | |||||
| 2026-02-23 | 13F | Mv Capital Management, Inc. | 4 | 0,00 | 0 | |||||
| 2026-04-17 | 13F | Webster Bank, N. A. | 69 | 8 | ||||||
| 2026-02-17 | 13F | Credit Agricole S A | 146.655 | 76,78 | 12.775 | 108,16 | ||||
| 2026-04-22 | 13F | Clear Creek Financial Management, LLC | 22.797 | -26,07 | 2.748 | 2,31 | ||||
| 2026-01-26 | 13F | Mirae Asset Global Investments Co., Ltd. | 72.862 | 0,50 | 6.347 | 18,33 | ||||
| 2026-02-12 | 13F | Chilton Capital Management Llc | 21 | 2 | ||||||
| 2026-02-13 | 13F | Kilter Group LLC | 14 | 1 | ||||||
| 2026-02-17 | 13F | Driehaus Capital Management Llc | 799.738 | 74,38 | 69.665 | 105,30 | ||||
| 2026-02-17 | 13F | California State Teachers Retirement System | 139.480 | 0,04 | 12.150 | 17,78 | ||||
| 2026-02-04 | 13F | Oregon Public Employees Retirement Fund | 29.630 | -0,50 | 2.581 | 17,16 | ||||
| 2026-02-13 | 13F | Rhumbline Advisers | 445.410 | -11,56 | 38.800 | 4,12 | ||||
| 2026-02-09 | 13F | Lisanti Capital Growth, LLC | 66.175 | 18,98 | 5.765 | 40,07 | ||||
| 2026-04-14 | 13F | Pinnacle Wealth Management Group, Inc. | 6.368 | 0,00 | 768 | 38,45 | ||||
| 2026-04-20 | 13F | Sowell Financial Services LLC | 3.343 | 403 | ||||||
| 2026-04-16 | 13F | Polianta Ltd | 0 | -100,00 | 0 | |||||
| 2026-02-05 | 13F | Avantax Planning Partners, Inc. | 2.539 | 221 | ||||||
| 2026-02-13 | 13F | Neuberger Berman Group LLC | 448.201 | 47,55 | 39.043 | 73,71 | ||||
| 2026-02-17 | 13F | Aventail Capital Group, LP | 72.590 | 6.323 | ||||||
| 2026-04-22 | 13F | Barnes Dennig Private Wealth Management LLC | 1.164 | 140 | ||||||
| 2026-02-17 | 13F | Citadel Advisors Llc | 0 | -100,00 | 0 | |||||
| 2026-04-13 | 13F | Leibman Financial Services, Inc. | 15.034 | -16,80 | 1.812 | 15,19 | ||||
| 2026-02-06 | 13F | AMF Pensionsforsakring AB | 46.535 | 0,00 | 4.054 | 17,72 | ||||
| 2026-01-30 | 13F | State of New Jersey Common Pension Fund D | 52.226 | -2,31 | 4.549 | 15,02 | ||||
| 2026-02-13 | 13F | Walleye Capital LLC | Call | 52.600 | -20,66 | 4.582 | -6,61 | |||
| 2026-02-13 | 13F | Walleye Capital LLC | Put | 116.000 | 192,19 | 10.105 | 244,02 | |||
| 2025-11-12 | 13F | NewSquare Capital LLC | 0 | -100,00 | 0 | |||||
| 2026-04-28 | 13F | Duff & Phelps Investment Management Co | 38.196 | 15,56 | 4.605 | 59,92 | ||||
| 2026-02-13 | 13F | Seneschal Advisors, LLC | 2 | 0,00 | 0 | |||||
| 2026-04-13 | 13F | Trust Co | 6 | 0,00 | 1 | |||||
| 2025-11-14 | 13F | Sofos Investments, Inc. | 0 | -100,00 | 0 | |||||
| 2025-10-31 | 13F | Mitsubishi UFJ Trust & Banking Corp | 0 | -100,00 | 0 | -100,00 | ||||
| 2025-11-07 | 13F | Shell Asset Management Co | 2.283 | -95,64 | 0 | -100,00 | ||||
| 2025-11-21 | 13F/A | CIBC Bancorp USA Inc. | 15.563 | 1.152 | ||||||
| 2026-02-17 | 13F | Man Group plc | 52.837 | 15,82 | 4.603 | 36,36 | ||||
| 2026-04-17 | 13F | HHM Wealth Advisors, LLC | 12 | 1 | ||||||
| 2026-02-13 | 13F | Toroso Investments, LLC | 81.019 | 93,11 | 7.058 | 127,35 | ||||
| 2026-02-11 | 13F | Cerity Partners LLC | 49.046 | -23,97 | 4.272 | -10,50 | ||||
| 2026-02-17 | 13F | Css Llc/il | 3.289 | -22,59 | 287 | -8,92 | ||||
| 2026-02-05 | 13F | Left Brain Wealth Management, LLC | 4.695 | 409 | ||||||
| 2026-02-09 | 13F | Jackson Creek Investment Advisors LLC | 19.255 | -38,28 | 2 | -50,00 | ||||
| 2026-04-24 | 13F | North Point Portfolio Managers Corp/oh | 147.211 | -12,79 | 17.746 | 20,70 | ||||
| 2026-02-09 | 13F | Atlantic Trust, LLC | 58 | 0,00 | 5 | 25,00 | ||||
| 2025-11-13 | 13F | Jump Financial, LLC | 0 | -100,00 | 0 | |||||
| 2026-02-10 | 13F | DT Investment Partners, LLC | 107 | 0,00 | 9 | 28,57 | ||||
| 2026-02-12 | 13F | Quadrant Capital Group Llc | 15.037 | 2,20 | 1.310 | 20,31 | ||||
| 2026-04-15 | 13F | Merit Financial Group, LLC | 2.627 | -4,61 | 317 | 32,22 | ||||
| 2026-02-09 | 13F | Harbour Investments, Inc. | 46 | 9,52 | 4 | 33,33 | ||||
| 2026-02-10 | 13F | Hillsdale Investment Management Inc. | 80 | 7 | ||||||
| 2026-02-13 | 13F | Bridgewater Associates, LP | 254.733 | 184,66 | 22.190 | 235,13 | ||||
| 2026-04-24 | 13F | Profund Advisors Llc | 5.970 | -1,19 | 720 | 36,69 | ||||
| 2026-02-13 | 13F | Walleye Capital LLC | 85.937 | 7.486 | ||||||
| 2026-02-02 | 13F | Danske Bank A/s | 229.354 | -49,04 | 19.979 | -40,00 | ||||
| 2026-02-13 | 13F | Marshall Wace, Llp | 31.554 | 2.749 | ||||||
| 2026-02-13 | 13F | Parkside Financial Bank & Trust | 238 | 23,96 | 21 | 42,86 | ||||
| 2026-04-20 | 13F | Ronald Blue Trust, Inc. | 1.167 | 64,37 | 141 | 129,51 | ||||
| 2026-02-10 | 13F | State of Wyoming | 4.213 | -46,75 | 367 | -37,44 | ||||
| 2026-04-27 | 13F | HB Wealth Management, LLC | 3.039 | 11,03 | 366 | 53,78 | ||||
| 2026-02-10 | 13F | Greenwich Wealth Management LLC | 8.445 | 0,00 | 1 | |||||
| 2026-02-13 | 13F | Formula Growth Ltd | 18.640 | -25,44 | 1.624 | -12,22 | ||||
| 2026-02-11 | 13F | Zions Bancorporation, National Association /ut/ | 107 | 9 | ||||||
| 2025-11-14 | 13F | Bayesian Capital Management, LP | 0 | -100,00 | 0 | -100,00 | ||||
| 2025-11-14 | 13F | Virtu Financial LLC | 0 | -100,00 | 0 | |||||
| 2026-04-06 | 13F | Versant Capital Management, Inc | 442 | 262,30 | 53 | 430,00 | ||||
| 2026-02-11 | 13F | SOUTH STATE Corp | 51 | 82,14 | 4 | 100,00 | ||||
| 2025-11-14 | 13F | Mubadala Investment Co PJSC | 0 | -100,00 | 0 | -100,00 | ||||
| 2026-02-17 | 13F | Electron Capital Partners, LLC | 631.726 | 11,53 | 55.030 | 31,31 | ||||
| 2026-04-28 | 13F | Whittier Trust Co | 218 | -24,04 | 24 | -11,54 | ||||
| 2025-11-14 | 13F | Sachem Head Capital Management LP | 0 | -100,00 | 0 | -100,00 | ||||
| 2026-02-17 | 13F | Interval Partners, LP | 9.627 | -39,07 | 839 | -28,31 | ||||
| 2026-02-12 | 13F | Bradley Foster & Sargent Inc/ct | 7.331 | -20,60 | 639 | -6,59 | ||||
| 2026-04-13 | 13F | Massmutual Trust Co Fsb/adv | 148 | 29,82 | 18 | 88,89 | ||||
| 2026-02-06 | 13F | Covestor Ltd | 749 | -6,84 | 0 | |||||
| 2026-02-10 | 13F | Meitav Dash Investments Ltd | 7.300 | -12,05 | 636 | 3,42 | ||||
| 2026-02-17 | 13F | Tudor Investment Corp Et Al | Put | 209.600 | 1.045,36 | 18.258 | 1.248,45 | |||
| 2026-02-02 | 13F | Fifth Third Bancorp | 1.297 | 2,61 | 113 | 20,43 | ||||
| 2026-04-22 | 13F | Spire Wealth Management | 38.272 | 4.614 | ||||||
| 2026-02-17 | 13F | Tudor Investment Corp Et Al | 403.073 | 134,16 | 35.112 | 175,68 | ||||
| 2026-02-17 | 13F | Tudor Investment Corp Et Al | Call | 90.900 | 145,01 | 7.918 | 188,45 | |||
| 2026-01-27 | 13F | Asset Management One Co., Ltd. | 46.973 | -18,96 | 4.237 | -1,19 | ||||
| 2026-02-03 | 13F | Virtus Family Office LLC | 21.453 | -3,04 | 1.869 | 14,11 | ||||
| 2026-02-10 | 13F | Ritter Daniher Financial Advisory LLC / DE | 150 | 13 | ||||||
| 2026-02-10 | 13F | Daiwa Securities Group Inc. | 27.000 | -12,05 | 2 | 0,00 | ||||
| 2026-02-05 | 13F | Atria Investments Llc | 15.187 | -24,04 | 1.323 | -10,62 | ||||
| 2026-01-16 | 13F | Trust Co Of Vermont | 525 | 0,00 | 46 | 18,42 | ||||
| 2026-02-10 | 13F | Tidemark, LLC | 69 | 0,00 | 6 | 20,00 | ||||
| 2026-02-10 | 13F | Marshall & Sterling Wealth Advisors Inc. | 156 | 0,00 | 14 | 18,18 | ||||
| 2026-02-13 | 13F | Police & Firemen's Retirement System of New Jersey | 39.226 | -3,24 | 3.417 | 13,90 | ||||
| 2026-02-12 | 13F | Castleark Management Llc | 105.484 | -9,88 | 9.189 | 6,10 | ||||
| 2026-02-14 | 13F | Rockefeller Capital Management L.P. | 9.274 | 451,04 | 808 | 550,81 | ||||
| 2026-02-13 | 13F | SPX Equities Gestao de Recursos Ltda | 0 | -100,00 | 0 | |||||
| 2026-04-14 | 13F | Andrew Hill Investment Advisors, Inc. | 50.758 | -27,51 | 6.119 | 0,31 | ||||
| 2025-11-13 | 13F | Qsemble Capital Management, LP | 0 | -100,00 | 0 | |||||
| 2026-02-12 | 13F | Swiss National Bank | 291.620 | 1,78 | 25.403 | 19,83 | ||||
| 2026-02-13 | 13F | Allianz Se | 180 | 16 | ||||||
| 2026-02-11 | 13F | Picton Mahoney Asset Management | 0 | -100,00 | 0 | |||||
| 2026-02-17 | 13F | IHT Wealth Management, LLC | 6.486 | 0,00 | 565 | 17,75 | ||||
| 2026-02-17 | 13F | Equitable Holdings, Inc. | 2.344 | -23,55 | 204 | -9,73 | ||||
| 2026-02-11 | 13F | Prestige Wealth Management Group LLC | 6 | 0,00 | 1 | |||||
| 2025-11-12 | 13F | JT Stratford LLC | 0 | -100,00 | 0 | |||||
| 2026-02-13 | 13F | University Of Texas/texas Am Investment Managment Co | 625 | 60,26 | 54 | 92,86 | ||||
| 2025-11-14 | 13F | Twinbeech Capital Lp | 0 | -100,00 | 0 | |||||
| 2026-02-13 | 13F | Horizon Investment Services, LLC | 11.569 | 124,82 | 1.008 | 165,00 | ||||
| 2026-04-16 | 13F | E. Ohman J:or Asset Management AB | 39.598 | -22,51 | 4.774 | 7,23 | ||||
| 2025-11-13 | 13F | Blueshift Asset Management, LLC | 0 | -100,00 | 0 | |||||
| 2026-01-28 | 13F | DekaBank Deutsche Girozentrale | 320.263 | 0,00 | 15 | 0,00 | ||||
| 2026-04-15 | 13F | Fortitude Family Office, LLC | 91 | 116,67 | 11 | 233,33 | ||||
| 2026-02-09 | 13F | New Age Alpha Advisors, LLC | 72.696 | -32,92 | 6.333 | -21,04 | ||||
| 2026-02-12 | 13F | Great Lakes Advisors, Llc | 5.189 | -6,47 | 452 | 10,24 | ||||
| 2026-01-29 | 13F | Vanguard Group Inc | 14.106.121 | -0,44 | 1.228.784 | 17,22 | ||||
| 2025-11-07 | 13F | Gsa Capital Partners Llp | 0 | -100,00 | 0 | |||||
| 2026-04-20 | 13F | TFB Advisors LLC | 3.589 | 9,12 | 433 | 51,05 | ||||
| 2025-11-14 | 13F | Beaconlight Capital, Llc | 0 | -100,00 | 0 | -100,00 | ||||
| 2026-02-04 | 13F | Securian Asset Management, Inc | 10.793 | -2,60 | 940 | 14,77 | ||||
| 2026-04-24 | 13F | Private Advisor Group, LLC | 2.842 | 343 | ||||||
| 2026-02-13 | 13F | Wealth Alliance | 3.150 | 274 | ||||||
| 2026-02-13 | 13F | Centiva Capital, LP | Call | 75.000 | 6.533 | |||||
| 2026-02-05 | 13F | New York Life Investment Management Llc | 11.911 | -12,57 | 1.038 | 2,98 | ||||
| 2026-02-10 | 13F | Commonwealth Of Pennsylvania Public School Empls Retrmt Sys | 37.133 | -2,22 | 3.235 | 15,13 | ||||
| 2026-04-24 | 13F | Sumitomo Mitsui DS Asset Management Company, Ltd | 90.082 | 54,45 | 10.859 | 113,76 | ||||
| 2026-02-13 | 13F | Centiva Capital, LP | 369.253 | 32.166 | ||||||
| 2026-02-13 | 13F | Centiva Capital, LP | Put | 300 | 26 | |||||
| 2026-04-15 | 13F | Bayforest Capital Ltd | 1.142 | 138 | ||||||
| 2026-04-28 | 13F | Ntv Asset Management Llc | 14.850 | 1.790 | ||||||
| 2026-04-23 | 13F | Oppenheimer & Co Inc | 3.930 | 474 | ||||||
| 2026-04-27 | 13F | Hunter Associates Investment Management Llc | 1.971 | 0 | ||||||
| 2026-04-27 | 13F | Ethic Inc. | 10.411 | 2,40 | 1.255 | 41,81 | ||||
| 2026-02-04 | 13F | Ameritas Advisory Services, LLC | 4.175 | 364 | ||||||
| 2026-02-17 | 13F | Numerai GP LLC | 0 | -100,00 | 0 | |||||
| 2026-04-28 | 13F | Stratos Wealth Advisors, LLC | 0 | -100,00 | 0 | |||||
| 2026-01-15 | 13F | Allspring Global Investments Holdings, LLC | 20.108 | -4,04 | 1.866 | 17,74 | ||||
| 2026-02-12 | 13F | Jane Street Group, Llc | Call | 1.353.000 | 3,76 | 117.860 | 22,16 | |||
| 2026-02-12 | 13F | Jane Street Group, Llc | 6.131 | 2,49 | 534 | 20,81 | ||||
| 2026-02-12 | 13F | Jane Street Group, Llc | Put | 607.900 | 56,55 | 52.954 | 84,32 | |||
| 2025-11-14 | 13F | Aigen Investment Management, Lp | 0 | -100,00 | 0 | |||||
| 2026-02-11 | 13F | Stirlingshire Investments, Inc. | 3.034 | 264 | ||||||
| 2026-02-13 | 13F | Cohen & Steers, Inc. | 49.376 | -10,26 | 4 | 0,00 | ||||
| 2026-02-10 | 13F | Lido Advisors, LLC | 14.447 | -4,63 | 1.148 | 2,50 | ||||
| 2026-01-22 | 13F | Massachusetts Financial Services Co /ma/ | 5.718 | 498 | ||||||
| 2026-02-12 | 13F | EAM Investors, LLC | 77.814 | 6.778 | ||||||
| 2026-02-03 | 13F | Mitsubishi UFJ Kokusai Asset Management Co., Ltd. | 60.594 | -38,67 | 5.622 | -23,11 | ||||
| 2026-02-13 | 13F | Transamerica Financial Advisors, Inc. | 10 | 1 | ||||||
| 2026-02-17 | 13F | Encompass Capital Advisors LLC | 499.837 | -58,05 | 43.541 | -50,62 | ||||
| 2026-02-13 | 13F | MAI Capital Management | 649 | -4,98 | 57 | 12,00 | ||||
| 2026-04-22 | 13F | Janney Montgomery Scott LLC | 5.963 | 2,04 | 1 | |||||
| 2026-01-16 | 13F | Standard Life Aberdeen plc | 48.135 | -27,00 | 4.193 | -14,04 | ||||
| 2026-02-17 | 13F | Merewether Investment Management, LP | 88.975 | -68,32 | 7.751 | -62,71 | ||||
| 2025-11-14 | 13F | Peconic Partners Llc | 0 | -100,00 | 0 | |||||
| 2026-02-17 | 13F | Freestone Grove Partners LP | 0 | -100,00 | 0 | |||||
| 2025-11-04 | 13F | Convergence Investment Partners, LLC | 0 | -100,00 | 0 | -100,00 | ||||
| 2025-11-04 | 13F | Raleigh Capital Management Inc. | 0 | -100,00 | 0 | |||||
| 2026-02-19 | 13F | Invesco Ltd. | 2.864.660 | 5,11 | 249.541 | 23,75 | ||||
| 2026-04-20 | 13F/A | OP Asset Management Ltd | 31.550 | 247,35 | 3.803 | 380,78 | ||||
| 2026-01-27 | 13F | PFG Advisors | 8.828 | 4,07 | 769 | 22,65 | ||||
| 2026-04-27 | 13F | Counterpoint Mutual Funds LLC | 0 | -100,00 | 0 | |||||
| 2026-02-11 | 13F | Erste Asset Management GmbH | 719.647 | 64.945 | ||||||
| 2026-04-28 | 13F | BW Gestao de Investimentos Ltda. | 87.706 | -43,74 | 10.573 | -22,15 | ||||
| 2026-02-17 | 13F | Weiss Asset Management LP | 35.886 | 3.126 | ||||||
| 2026-02-11 | 13F | Global Alpha Capital Management Ltd. | 37.019 | 1,93 | 3.225 | 19,99 | ||||
| 2026-01-22 | 13F | Harwood Advisory Group, LLC | 60 | 5 | ||||||
| 2026-02-17 | 13F | Boothbay Fund Management, Llc | 5.837 | -10,42 | 508 | 5,39 | ||||
| 2026-02-13 | 13F | Integrated Wealth Concepts LLC | 5.510 | 0,62 | 480 | 18,52 | ||||
| 2026-02-17 | 13F | Clark Capital Management Group, Inc. | 9.281 | 808 | ||||||
| 2026-02-17 | 13F | Two Sigma Investments, Lp | Call | 6.900 | 601 | |||||
| 2026-02-13 | 13F | State Street Corp | 5.331.335 | -1,12 | 464.413 | 16,41 | ||||
| 2026-02-17 | 13F | Balyasny Asset Management Llc | 5.014 | 437 | ||||||
| 2025-10-30 | 13F | Twin Peaks Wealth Advisors, LLC | 0 | -100,00 | 0 | -100,00 | ||||
| 2026-01-27 | 13F | Evergreen Capital Management Llc | 9.528 | 8,52 | 830 | 27,73 | ||||
| 2026-01-26 | 13F | KBC Group NV | 94.725 | 0,46 | 8 | 33,33 | ||||
| 2026-02-17 | 13F | Rithm Capital Corp. | 11.500 | 0,00 | 1.002 | 17,76 | ||||
| 2026-02-17 | 13F | Two Sigma Investments, Lp | Put | 6.000 | 523 | |||||
| 2026-04-02 | 13F | Hilltop National Bank | 1.855 | 7,47 | 224 | 48,67 | ||||
| 2026-01-28 | 13F | Salomon & Ludwin, LLC | 53 | 165,00 | 5 | 300,00 | ||||
| 2026-04-02 | 13F | MJT & Associates Financial Advisory Group, Inc. | 0 | -100,00 | 0 | |||||
| 2026-01-28 | 13F | Arizona State Retirement System | 41.299 | -5,58 | 3.598 | 11,16 | ||||
| 2026-02-13 | 13F | Kestra Advisory Services, LLC | 0 | -100,00 | 0 | |||||
| 2026-04-16 | 13F | Trium Capital LLP | 12 | 1 | ||||||
| 2026-02-17 | 13F | Blair William & Co/il | 2.548 | -42,99 | 222 | -33,03 | ||||
| 2026-02-04 | 13F | Versor Investments LP | 13.113 | -11,16 | 1.142 | 4,58 | ||||
| 2026-04-16 | 13F | Brookstone Capital Management | 19.705 | 2.375 | ||||||
| 2026-04-28 | 13F | SBI Securities Co., Ltd. | 295 | -29,26 | 36 | -2,78 | ||||
| 2026-04-16 | 13F | SG Americas Securities, LLC | 200.669 | 335,41 | 24 | 500,00 | ||||
| 2026-02-13 | 13F | Towarzystwo Funduszy Inwestycyjnych Pzu Sa | 2.200 | 10,00 | 192 | 29,93 | ||||
| 2026-02-17 | 13F | Fmr Llc | 17.211.078 | 162,25 | 1.499.257 | 208,76 | ||||
| 2026-02-13 | 13F | Victory Capital Management Inc | 298.696 | -32,53 | 26.019 | -20,56 | ||||
| 2026-02-17 | 13F | Northern Trust Corp | 1.776.210 | -5,78 | 154.726 | 10,93 | ||||
| 2026-01-23 | 13F | Assetmark, Inc | 427.824 | 342.159,20 | 37.268 | 413.977,78 | ||||
| 2026-02-17 | 13F | Janus Henderson Group Plc | 581.508 | -36,48 | 50.646 | -25,21 | ||||
| 2025-11-14 | 13F | Hrt Financial Lp | 0 | -100,00 | 0 | -100,00 | ||||
| 2026-04-14 | 13F | Cohen Capital Management, Inc. | 2.070 | 250 | ||||||
| 2026-01-15 | 13F | Nisa Investment Advisors, Llc | 7.030 | 10,12 | 612 | 29,66 | ||||
| 2026-02-11 | 13F | Winton Capital Group Ltd | 2.600 | 226 | ||||||
| 2026-02-17 | 13F | Lombard Odier Asset Management (USA) Corp | 7.022 | -64,38 | 612 | -58,09 | ||||
| 2025-11-07 | 13F | Beacon Capital Management, LLC | 0 | -100,00 | 0 | |||||
| 2026-02-13 | 13F | Squarepoint Ops LLC | Call | 81.700 | 153,73 | 7.117 | 198,74 | |||
| 2026-02-12 | 13F | Alps Advisors Inc | 80.084 | -8,96 | 6.976 | 7,19 | ||||
| 2026-02-13 | 13F | Squarepoint Ops LLC | Put | 5.300 | -20,90 | 462 | -6,87 | |||
| 2026-02-06 | 13F | New Millennium Group LLC | 19 | 0,00 | 2 | 0,00 | ||||
| 2025-11-14 | 13F | Soros Fund Management Llc | 0 | -100,00 | 0 | -100,00 | ||||
| 2026-01-29 | 13F | Dunhill Financial, LLC | 2 | 0 | ||||||
| 2025-11-14 | 13F | Redwood Investment Management, Llc | 0 | -100,00 | 0 | |||||
| 2026-02-13 | 13F | Pathstone Holdings, LLC | 23.073 | -15,95 | 2.010 | -1,08 | ||||
| 2026-02-17 | 13F | Scopus Asset Management, L.p. | Put | 0 | -100,00 | 0 | ||||
| 2026-02-02 | 13F | Estate Counselors, LLC | 62.622 | 0,00 | 5.455 | 17,74 | ||||
| 2025-11-10 | 13F | Telemark Asset Management, LLC | 0 | -100,00 | 0 | -100,00 | ||||
| 2026-02-10 | 13F | CIBC Asset Management Inc | 5.491 | 19,86 | 478 | 41,42 | ||||
| 2026-02-13 | 13F | Brookfield Asset Management Inc. | 26.212 | -11,96 | 2.283 | 3,68 | ||||
| 2026-04-24 | 13F | ProShare Advisors LLC | 29.229 | -15,10 | 3.524 | 17,51 | ||||
| 2026-02-10 | 13F | Jupiter Asset Management Ltd | 26.706 | 0,32 | 2.326 | 18,13 | ||||
| 2025-11-13 | 13F | VSM Wealth Advisory, LLC | 0 | -100,00 | 0 | -100,00 | ||||
| 2026-02-17 | 13F | Frontier Capital Management Co Llc | 114.115 | -16,17 | 9.941 | -1,30 | ||||
| 2026-01-30 | 13F | Valued Wealth Advisors LLC | 7 | 40,00 | 1 | |||||
| 2026-04-13 | 13F | Highland Capital Management, Llc | 3.598 | 43,46 | 434 | 98,62 | ||||
| 2026-02-17 | 13F | State Of Wisconsin Investment Board | 163.173 | 2,11 | 14.214 | 20,22 | ||||
| 2026-02-13 | 13F | Squarepoint Ops LLC | 0 | -100,00 | 0 | -100,00 | ||||
| 2026-04-20 | 13F | Contravisory Investment Management, Inc. | 191 | -25,39 | 23 | 4,55 | ||||
| 2026-04-22 | 13F | Sterling Capital Management LLC | 1.735 | -29,07 | 209 | -1,88 | ||||
| 2026-01-21 | 13F | Crews Bank & Trust | 21 | 0,00 | 2 | 0,00 | ||||
| 2026-02-10 | 13F | Godfrey Financial Associates, Inc. | 6 | 1 | ||||||
| 2026-04-16 | 13F | Evexia Wealth Llc | 6.620 | 2,21 | 738 | 20,39 | ||||
| 2026-02-17 | 13F | Aqr Capital Management Llc | 222.653 | -41,82 | 19.395 | -31,50 | ||||
| 2026-02-12 | 13F | Elo Mutual Pension Insurance Co | 51.277 | -2,78 | 4.467 | 14,45 | ||||
| 2026-02-12 | 13F | Sycomore Asset Management | 700 | 0,00 | 0 | |||||
| 2026-02-13 | 13F | Becker Capital Management Inc | 35.222 | -1,27 | 3.068 | 16,26 | ||||
| 2026-02-03 | 13F | Legacy Wealth Managment, LLC/ID | 3 | 0,00 | 0 | |||||
| 2026-02-11 | 13F | J.Safra Asset Management Corp | 18 | 2 | ||||||
| 2026-04-07 | 13F | Green Alpha Advisors, LLC | 24.197 | -0,27 | 2.917 | 38,00 | ||||
| 2025-11-06 | 13F | Abich Financial Wealth Management LLC | 1.348 | 100 | ||||||
| 2026-02-05 | 13F | Bessemer Group Inc | 123.785 | 1,65 | 11 | 11,11 | ||||
| 2026-02-09 | 13F | Unified Investment Management | 11.765 | -11,35 | 1.025 | 4,38 | ||||
| 2026-02-12 | 13F | Aviva Plc | 5.571 | -19,49 | 485 | -5,27 | ||||
| 2026-04-17 | 13F | Fifth Third Wealth Advisors LLC | 3.810 | 4,76 | 459 | 45,25 | ||||
| 2026-02-10 | 13F | Connor, Clark & Lunn Investment Management Ltd. | 2.979 | -0,03 | 260 | 17,73 | ||||
| 2026-01-22 | 13F | Bartlett & Co. Wealth Management Llc | 69 | 6 | ||||||
| 2026-02-12 | 13F | Commonwealth Equity Services, Llc | 5.309 | -5,65 | 462 | |||||
| 2026-02-17 | 13F | Sig Brokerage, Lp | Put | 35.000 | 0,00 | 3.049 | 17,73 | |||
| 2026-02-17 | 13F | Sig Brokerage, Lp | Call | 100.400 | 0,00 | 8.746 | 17,73 | |||
| 2026-02-17 | 13F | PharVision Advisers, LLC | 0 | -100,00 | 0 | |||||
| 2026-02-17 | 13F | Advisor Group Holdings, Inc. | 20.285 | 19,55 | 1.767 | 50,30 | ||||
| 2026-02-13 | 13F | Jacobs Levy Equity Management, Inc | 97.206 | 8.468 | ||||||
| 2026-04-16 | 13F | Diversified Trust Co | 6.995 | 843 | ||||||
| 2026-02-12 | 13F | MetLife Investment Management, LLC | 150.482 | -5,07 | 13.108 | 11,77 | ||||
| 2026-02-06 | 13F | Legato Capital Management LLC | 18.275 | 76,66 | 1.592 | 107,97 | ||||
| 2026-02-17 | 13F | D. E. Shaw & Co., Inc. | Put | 161.600 | 162,34 | 14.077 | 208,89 | |||
| 2026-01-26 | 13F | Cwm, Llc | 5.978 | 3,16 | 1 | |||||
| 2026-02-17 | 13F | D. E. Shaw & Co., Inc. | 24.522 | -92,55 | 2.136 | -91,23 | ||||
| 2026-02-17 | 13F | D. E. Shaw & Co., Inc. | Call | 90.300 | 80,96 | 7.866 | 113,06 | |||
| 2025-11-14 | 13F | Cubist Systematic Strategies, LLC | 0 | -100,00 | 0 | -100,00 | ||||
| 2026-02-13 | 13F | Pinnacle Wealth Planning Services, Inc. | 546 | 48 | ||||||
| 2026-02-10 | 13F | Private Wealth Asset Management, LLC | 391 | 16,37 | 34 | 41,67 | ||||
| 2026-04-27 | 13F | Td Private Client Wealth Llc | 2 | 0,00 | 0 | |||||
| 2026-02-17 | 13F | Scopus Asset Management, L.p. | 344.813 | -27,17 | 30.037 | -14,26 | ||||
| 2026-02-12 | 13F | BRYN MAWR TRUST Co | 0 | -100,00 | 0 | -100,00 | ||||
| 2026-02-17 | 13F | Scopus Asset Management, L.p. | Call | 150.000 | 500,00 | 13.066 | 606,65 | |||
| 2025-11-21 | 13F | Nebula Research & Development LLC | 0 | -100,00 | 0 | |||||
| 2026-04-28 | 13F | Argonautica Private Wealth Management, Inc | 1.839 | 222 | ||||||
| 2026-01-23 | 13F | Natural Investments, Llc | 0 | -100,00 | 0 | |||||
| 2026-02-03 | 13F | Ballentine Partners, LLC | 4.868 | -1,76 | 424 | 15,85 | ||||
| 2026-02-13 | 13F | Manufacturers Life Insurance Company, The | 0 | -100,00 | 0 | |||||
| 2026-04-14 | 13F | Perpetual Ltd | 220.865 | -24,28 | 26.625 | 4,79 | ||||
| 2026-04-21 | 13F | Capital Investment Counsel, Inc | 1.757 | 212 | ||||||
| 2026-02-13 | 13F | Wells Fargo & Company/mn | 597.425 | -25,77 | 52.042 | -12,61 | ||||
| 2026-02-10 | 13F | Natixis Advisors, L.p. | 15.511 | -71,00 | 1 | -66,67 | ||||
| 2026-02-13 | 13F | WealthTrust Axiom LLC | 3.124 | -1,58 | 272 | 16,24 | ||||
| 2026-04-07 | 13F | Signaturefd, Llc | 3.337 | 3,76 | 402 | 43,57 | ||||
| 2026-01-29 | 13F | UBS Group AG | Put | 1.576.900 | 137.364 | |||||
| 2026-01-29 | 13F | UBS Group AG | Call | 3.740 | 326 | |||||
| 2026-01-29 | 13F | UBS Group AG | 1.365.092 | 23,22 | 118.913 | 45,07 | ||||
| 2026-02-17 | 13F | Nishkama Capital, LLC | 68.404 | 5.959 | ||||||
| 2025-11-14 | 13F | Shay Capital LLC | Call | 0 | -100,00 | 0 | -100,00 | |||
| 2026-02-19 | 13F | CI Private Wealth, LLC | 14.692 | 35,54 | 1.280 | 59,48 | ||||
| 2026-02-12 | 13F | Groupe la Francaise | 58.604 | 5,39 | 5.104 | 23,98 | ||||
| 2026-04-08 | 13F | DiNuzzo Private Wealth, Inc. | 23 | 0,00 | 3 | 0,00 | ||||
| 2026-04-14 | 13F | Sanchez Gaunt Capital Management, LLC | 3.643 | 439 | ||||||
| 2026-02-17 | 13F | Holocene Advisors, LP | 24.207 | 2.109 | ||||||
| 2026-01-23 | 13F | Avion Wealth | 32 | 0,00 | 0 | |||||
| 2026-02-13 | 13F | American Century Companies Inc | 717.856 | 6,21 | 62.532 | 25,04 | ||||
| 2026-04-20 | 13F | Ritholtz Wealth Management | 3.180 | 383 | ||||||
| 2026-02-06 | 13F | Prescott Group Capital Management, L.l.c. | 10.451 | 0,00 | 910 | 17,72 | ||||
| 2026-01-23 | 13F | Rsm Us Wealth Management Llc | 0 | -100,00 | 0 | |||||
| 2026-02-03 | 13F | Robeco Schweiz AG | 905.310 | -0,90 | 78.862 | 16,67 | ||||
| 2026-01-28 | 13F | Financial Perspectives, Inc | 84 | 0,00 | 7 | 16,67 | ||||
| 2026-02-13 | 13F | Hel Ved Capital Management Ltd | 71.195 | -5,18 | 6.202 | 11,63 | ||||
| 2026-04-23 | 13F | TFC Financial Management | 703 | 85 | ||||||
| 2025-11-12 | 13F | Royce & Associates Lp | 0 | -100,00 | 0 | -100,00 | ||||
| 2026-02-06 | 13F | Lsv Asset Management | 4.400 | 0,00 | 0 | |||||
| 2026-02-17 | 13F | Zacks Investment Management | 52.521 | -7,90 | 4.575 | 8,44 | ||||
| 2026-02-12 | 13F | BlackRock, Inc. | 24.312.686 | 0,83 | 2.117.878 | 18,71 | ||||
| 2026-02-12 | 13F | denkapparat Operations GmbH | 3.002 | 0,00 | 262 | 17,57 | ||||
| 2026-02-12 | 13F | Brown Brothers Harriman & Co | 200 | 0,00 | 17 | 21,43 | ||||
| 2026-02-13 | 13F | C M Bidwell & Associates Ltd | 1.652 | 1,23 | 144 | 19,17 | ||||
| 2026-02-13 | 13F | Citigroup Inc | 101.695 | 49,67 | 8.859 | 76,21 | ||||
| 2026-02-17 | 13F | BlackBarn Capital Partners LP | 0 | -100,00 | 0 | -100,00 | ||||
| 2026-02-10 | 13F | Bnp Paribas Arbitrage, Sa | 97.047 | -18,84 | 8.454 | -4,44 | ||||
| 2026-02-13 | 13F | OMERS ADMINISTRATION Corp | 22.617 | -35,23 | 1.970 | -23,73 | ||||
| 2026-02-17 | 13F | Price T Rowe Associates Inc /md/ | 2.429.410 | 4,82 | 212 | 23,39 | ||||
| 2026-04-28 | 13F | Harbor Capital Advisors, Inc. | 26.173 | -45,37 | 3 | -25,00 | ||||
| 2026-02-10 | 13F | Bnp Paribas Arbitrage, Sa | Call | 225 | 0,00 | 1.960 | 17,73 | |||
| 2025-11-14 | 13F | Graham Capital Management, L.P. | 0 | -100,00 | 0 | -100,00 | ||||
| 2026-01-26 | 13F | AE Wealth Management LLC | 4.163 | -0,62 | 363 | 17,15 | ||||
| 2026-04-22 | 13F | Pinnacle Bancorp, Inc. | 76 | 0,00 | 9 | 50,00 | ||||
| 2025-11-12 | 13F | 111 Capital | 0 | -100,00 | 0 | -100,00 | ||||
| 2026-02-11 | 13F | LPL Financial LLC | 63.962 | -6,65 | 5.572 | 9,90 | ||||
| 2026-02-13 | 13F | Mariner, LLC | 23.761 | 49,37 | 2.070 | 75,94 | ||||
| 2026-02-17 | 13F | Man Group plc | Call | 0 | -100,00 | 0 | ||||
| 2026-04-14 | 13F | Bay Harbor Wealth Management, LLC | 22 | 69,23 | 3 | 100,00 | ||||
| 2026-04-07 | 13F | Farther Finance Advisors, LLC | 5.596 | 50,23 | 674 | 107,72 | ||||
| 2026-02-17 | 13F | Amundi | 1.716.848 | -18,70 | 149.544 | -7,46 | ||||
| 2026-02-13 | 13F | Segall Bryant & Hamill, Llc | 118.338 | 10.308 | ||||||
| 2026-02-12 | 13F | Nuveen, LLC | 1.030.779 | -7,33 | 89.791 | 9,11 | ||||
| 2026-02-17 | 13F | VARCOV Co. | 3.540 | 308 | ||||||
| 2025-10-31 | 13F | Y-Intercept (Hong Kong) Ltd | 0 | -100,00 | 0 | -100,00 | ||||
| 2026-02-17 | 13F | Alliancebernstein L.p. | 1.816.857 | 366,98 | 158.266 | 449,78 | ||||
| 2026-02-17 | 13F | Quantinno Capital Management LP | 15.249 | 99,39 | 1.328 | 135,04 | ||||
| 2026-04-08 | 13F | Wealth Enhancement Advisory Services, Llc | 6.363 | -57,35 | 720 | -47,33 | ||||
| 2026-01-16 | 13F | Empirical Financial Services, LLC d.b.a. Empirical Wealth Management | 12.859 | 10,21 | 1.120 | 29,78 | ||||
| 2026-02-17 | 13F | Odyssean, LLC | 8.330 | 726 | ||||||
| 2026-04-23 | 13F | North Star Investment Management Corp. | 6.500 | 0,00 | 784 | 38,34 | ||||
| 2025-11-14 | 13F | Bridgefront Capital, LLC | 0 | -100,00 | 0 | |||||
| 2025-11-14 | 13F | Sandler Capital Management | 0 | -100,00 | 0 | |||||
| 2026-02-13 | 13F | First Trust Advisors Lp | 525.654 | 0,86 | 45.790 | 18,74 | ||||
| 2026-04-13 | 13F | Gateway Investment Advisers Llc | 18.740 | -21,94 | 2.259 | 8,03 | ||||
| 2026-02-02 | 13F | Horizon Investments, LLC | 33.243 | -53,89 | 2.896 | -45,73 | ||||
| 2026-04-27 | 13F | Reynders McVeigh Capital Management, LLC | 137.350 | 5,76 | 17 | 45,45 | ||||
| 2026-02-11 | 13F | Syon Capital Llc | 2.487 | 217 | ||||||
| 2026-02-12 | 13F | Bank Of Montreal /can/ | 60.307 | 4,16 | 5.249 | 22,55 | ||||
| 2026-02-17 | 13F | Man Group plc | Put | 0 | -100,00 | 0 | ||||
| 2025-11-13 | 13F | Entropy Technologies, LP | 0 | -100,00 | 0 | |||||
| 2026-04-17 | 13F | Vermillion Wealth Management, Inc. | 13 | 2 | ||||||
| 2026-04-15 | 13F | Horizon Financial Services, Llc | 24 | 3 | ||||||
| 2026-02-12 | 13F | Dimensional Fund Advisors Lp | 2.358.805 | 0,05 | 205.475 | 17,78 | ||||
| 2026-02-13 | 13F | Mml Investors Services, Llc | 10.189 | -46,10 | 888 | -36,55 | ||||
| 2026-02-17 | 13F | Hilltop Holdings Inc. | 0 | -100,00 | 0 | |||||
| 2026-04-27 | 13F | Moran Wealth Management, LLC | 0 | -100,00 | 0 | |||||
| 2026-01-30 | 13F/A | M&t Bank Corp | 6.511 | 52,16 | 567 | 78,86 | ||||
| 2026-04-27 | 13F | Pensionmark Financial Group, Llc | 2.048 | 247 | ||||||
| 2026-04-28 | 13F | Belpointe Asset Management LLC | 8.215 | -14,95 | 990 | 17,72 | ||||
| 2025-11-14 | 13F | Capstone Investment Advisors, Llc | 7.671 | 568 | ||||||
| 2026-02-02 | 13F | Principal Financial Group Inc | 504.444 | -37,01 | 43.942 | -25,84 | ||||
| 2026-02-05 | 13F | DnB Asset Management AS | 60.793 | -0,94 | 5.296 | 16,63 | ||||
| 2026-02-11 | 13F | Los Angeles Capital Management Llc | 45.456 | -14,08 | 4.506 | 15,10 | ||||
| 2026-04-24 | 13F | Abacus Wealth Partners, LLC | 15.017 | 7,49 | 1.810 | 48,85 | ||||
| 2026-02-11 | 13F | Primecap Management Co/ca/ | 6.951.597 | -6,82 | 605.554 | 9,70 | ||||
| 2025-11-14 | 13F | Cubist Systematic Strategies, LLC | Put | 5.200 | 385 | |||||
| 2025-11-14 | 13F | Cubist Systematic Strategies, LLC | Call | 32.800 | 206,54 | 2.427 | 317,56 | |||
| 2025-11-12 | 13F | Quantbot Technologies LP | 0 | -100,00 | 0 | |||||
| 2026-01-23 | 13F | Ogorek Anthony Joseph /ny/ /adv | 155 | 0,00 | 0 | |||||
| 2026-02-13 | 13F | Umb Bank N A/mo | 1.783 | 16,23 | 155 | 37,17 | ||||
| 2026-02-17 | 13F | Raymond James Financial Inc | 140.299 | -1,51 | 12.221 | 15,96 | ||||
| 2026-02-17 | 13F | MIRAE ASSET GLOBAL ETFS HOLDINGS Ltd. | 98.519 | 3,19 | 8.582 | 21,48 | ||||
| 2026-02-05 | 13F | Gabelli Funds Llc | 4.375 | 43,87 | 381 | 69,33 | ||||
| 2026-04-24 | 13F | Bayban | 17 | 0,00 | 2 | 100,00 | ||||
| 2026-04-24 | 13F | Trust Investment Advisors | 10.290 | -4,00 | 1.240 | 32,90 | ||||
| 2026-02-17 | 13F | Dark Forest Capital Management Lp | 0 | -100,00 | 0 | -100,00 | ||||
| 2026-02-03 | 13F | Chesapeake Capital Corp /il/ | 5.756 | 0,00 | 501 | 17,88 | ||||
| 2026-02-17 | 13F | Blue Door Asset Management, LLC | 151.000 | -45,46 | 13.154 | -35,79 | ||||
| 2026-02-17 | 13F | Bank Of America Corp /de/ | 1.165.465 | 12,41 | 101.524 | 32,34 | ||||
| 2026-02-13 | 13F | Stifel Financial Corp | 18.662 | 8,49 | 1.626 | 27,75 | ||||
| 2026-02-11 | 13F | Livforsakringsbolaget Skandia, Omsesidigt | 59.534 | 0,00 | 5.184 | 17,74 | ||||
| 2026-02-10 | 13F | Intech Investment Management Llc | 87.652 | -29,79 | 7.635 | -17,33 | ||||
| 2026-02-12 | 13F | Earnest Partners Llc | 1.066.748 | -16,55 | 92.924 | -1,75 | ||||
| 2026-04-28 | 13F | Whittier Trust Co Of Nevada Inc | 279 | -8,82 | 30 | 7,14 | ||||
| 2026-02-12 | 13F | Tocqueville Asset Management L.p. | 78.970 | -28,07 | 6.879 | -15,30 | ||||
| 2026-02-11 | 13F | IMA Wealth, Inc. | 29 | 625,00 | 3 | |||||
| 2026-02-10 | 13F | Goldman Sachs Group Inc | Put | 0 | -100,00 | 0 | ||||
| 2026-02-13 | 13F | Trillium Asset Management, Llc | 109.570 | -12,61 | 9.737 | 4,97 | ||||
| 2026-04-21 | 13F | Robeco Institutional Asset Management B.V. | 136.777 | -1,57 | 16.488 | 36,21 | ||||
| 2026-02-11 | 13F | Greykasell Wealth Strategies, Inc. | 127 | 0,00 | 11 | 22,22 | ||||
| 2026-02-13 | 13F | Atlas Capital Advisors Llc | 1.080 | 0,00 | 199 | 8,15 | ||||
| 2026-01-29 | 13F | Ashton Thomas Private Wealth, LLC | 5.242 | 0,96 | 457 | 18,75 | ||||
| 2026-02-17 | 13F | Edmond De Rothschild Holding S.a. | 1.500 | 131 | ||||||
| 2026-02-12 | 13F | Johnson Financial Group, Inc. | 231 | 0,00 | 20 | 17,65 | ||||
| 2026-02-03 | 13F | Costello Asset Management, INC | 300 | 0,00 | 26 | 18,18 | ||||
| 2026-02-17 | 13F | Creative Planning | 113.824 | 11,59 | 9.915 | 31,38 | ||||
| 2026-02-17 | 13F | Caption Management, LLC | Call | 169.700 | 0,00 | 14.783 | 17,73 | |||
| 2026-02-09 | 13F | Legal & General Group Plc | 414.304 | 4,64 | 36.090 | 23,20 | ||||
| 2026-02-17 | 13F | Caption Management, LLC | Put | 72.500 | 91,80 | 6.315 | 125,86 | |||
| 2026-02-17 | 13F | XTX Topco Ltd | 11.358 | 162,43 | 989 | 209,06 | ||||
| 2026-04-10 | 13F | Viking Fund Management Llc | 19.000 | 0,00 | 2.290 | 38,37 | ||||
| 2025-11-14 | 13F | Wolverine Trading, Llc | 15.460 | 1.177 | ||||||
| 2025-11-14 | 13F | Wolverine Trading, Llc | Call | 448.500 | 34.144 | |||||
| 2026-01-30 | 13F | Us Bancorp \de\ | 9.965 | 109,88 | 868 | 147,29 | ||||
| 2026-02-13 | 13F | Gts Securities Llc | 3.087 | -16,41 | 269 | -1,83 | ||||
| 2026-02-17 | 13F | Arosa Capital Management LP | Call | 140.000 | 12.195 | |||||
| 2025-11-14 | 13F | Wolverine Trading, Llc | Put | 238.500 | 18.157 | |||||
| 2026-02-17 | 13F | Arosa Capital Management LP | 21.608 | 1.882 | ||||||
| 2026-02-17 | 13F | Cinctive Capital Management LP | 52.867 | 4.605 | ||||||
| 2026-04-28 | 13F | Everence Capital Management Inc | 5.428 | -40,02 | 1 | |||||
| 2026-01-15 | 13F | Alhambra Investment Partners LLC | 0 | -100,00 | 0 | |||||
| 2026-02-05 | 13F | 1620 Investment Advisors, Inc. | 1.975 | 0,00 | 172 | 17,81 | ||||
| 2026-02-13 | 13F | Lord, Abbett & Co. Llc | 848.110 | 142,32 | 74 | 192,00 | ||||
| 2026-02-12 | 13F | Wealthspire Advisors, LLC | 0 | -100,00 | 0 | |||||
| 2026-02-12 | 13F | Foster Dykema Cabot & Partners, Llc | 0 | -100,00 | 0 | |||||
| 2026-04-23 | 13F | SJS Investment Consulting Inc. | 23 | 109,09 | 3 | |||||
| 2026-02-13 | 13F | Mirova | 0 | -100,00 | 0 | |||||
| 2025-11-14 | 13F | Texas Permanent School Fund | 0 | -100,00 | 0 | |||||
| 2026-02-13 | 13F | Van Eck Associates Corp | 53.811 | -3,42 | 5 | 0,00 | ||||
| 2025-11-07 | 13F | Atticus Wealth Management, Llc | 0 | -100,00 | 0 | |||||
| 2026-04-24 | 13F | Oakworth Capital, Inc. | 5 | 0,00 | 1 | |||||
| 2026-02-10 | 13F | Mutual Of America Capital Management Llc | 61.755 | -9,63 | 5.379 | 6,41 | ||||
| 2026-04-20 | 13F | City State Bank | 100 | 0,00 | 12 | 50,00 | ||||
| 2025-11-14 | 13F | Manatuck Hill Partners, LLC | 0 | -100,00 | 0 | -100,00 | ||||
| 2026-04-23 | 13F | Impact Partnership Wealth, LLC | 2.464 | 1,99 | 297 | 41,43 | ||||
| 2026-02-17 | 13F | Scientech Research LLC | 0 | -100,00 | 0 | |||||
| 2025-11-12 | 13F | HAP Trading, LLC | Call | 65.500 | 1.166 | |||||
| 2026-02-17 | 13F | Yaupon Capital Management LP | 0 | -100,00 | 0 | |||||
| 2026-03-12 | 13F/A | Peak6 Llc | Call | 202.500 | 29,39 | 17.640 | 52,34 | |||
| 2026-01-08 | 13F | Goodman Financial Corp | 330.023 | -0,07 | 28.748 | 17,65 | ||||
| 2026-02-17 | 13F | Signature Equity Partners, LLC | 148 | 13 | ||||||
| 2026-03-12 | 13F/A | Peak6 Llc | Put | 91.300 | -2,35 | 7.953 | 14,96 | |||
| 2025-11-14 | 13F | Point72 (DIFC) Ltd | 0 | -100,00 | 0 | |||||
| 2026-02-17 | 13F | United Capital Financial Advisers, Llc | 4.734 | -24,57 | 412 | -11,21 | ||||
| 2025-11-10 | 13F | O'Neil Global Advisors, Inc. | 0 | -100,00 | 0 | |||||
| 2026-04-07 | 13F | Park Avenue Securities Llc | 5.659 | -0,35 | 1 | |||||
| 2026-04-06 | 13F | Private Client Services, Llc | 23.397 | -5,74 | 2.821 | 30,43 | ||||
| 2026-02-13 | 13F | Vontobel Holding Ltd. | 5.819 | 507 | ||||||
| 2026-02-10 | 13F | Fielder Capital Group LLC | 2.637 | 230 | ||||||
| 2026-04-17 | 13F | Bell Investment Advisors, Inc | 102 | 5,15 | 12 | 50,00 | ||||
| 2026-01-23 | 13F | Diversify Advisory Services, LLC | 0 | -100,00 | 0 | |||||
| 2026-02-17 | 13F | New Vernon Capital Holdings II LLC | 2.557 | -56,72 | 223 | -49,20 | ||||
| 2026-02-17 | 13F | Royal Bank Of Canada | 103.714 | -36,65 | 9.034 | -25,43 | ||||
| 2025-11-06 | 13F | Bryce Point Capital, LLC | 7.217 | -60,69 | 534 | -46,59 | ||||
| 2025-11-13 | 13F | Dynamic Technology Lab Private Ltd | 0 | -100,00 | 0 | |||||
| 2025-11-14 | 13F | Otter Creek Advisors, LLC | 56.000 | 4 | ||||||
| 2026-02-18 | 13F | Vermillion & White Wealth Management Group, LLC | 72 | 0,00 | 6 | 20,00 | ||||
| 2026-02-13 | 13F | Commerce Bank | 3.650 | -0,46 | 318 | 16,97 | ||||
| 2026-02-17 | 13F | Qube Research & Technologies Ltd | 139.272 | -75,34 | 12.132 | -70,96 | ||||
| 2026-04-23 | 13F | Forum Financial Management, LP | 0 | -100,00 | 0 | |||||
| 2026-02-05 | 13F | HFM Investment Advisors, LLC | 9 | 0,00 | 1 | |||||
| 2026-01-08 | 13F | Nordea Investment Management Ab | 162.756 | -12,67 | 14.301 | 1,56 | ||||
| 2026-01-23 | 13F | Baillie Gifford & Co | 420 | 76,47 | 37 | 111,76 | ||||
| 2026-02-10 | 13F/A | Evolution Wealth Management Inc. | 0 | -100,00 | 0 | |||||
| 2025-11-10 | 13F | Sigma Planning Corp | 0 | -100,00 | 0 | -100,00 | ||||
| 2025-11-10 | 13F | Villanova Investment Management Co LLC | 0 | -100,00 | 0 | |||||
| 2026-02-13 | 13F | Boston Partners | 11.745 | -1,85 | 1.023 | 15,59 | ||||
| 2026-02-17 | 13F | SageView Advisory Group, LLC | 338 | 29 | ||||||
| 2026-01-26 | 13F | Private Trust Co Na | 98 | 9 | ||||||
| 2026-02-17 | 13F | Cetera Investment Advisers | 22.800 | 11,82 | 1.986 | 31,70 | ||||
| 2026-02-13 | 13F | Silicon Valley Capital Partners | 385 | 0,00 | 34 | 17,86 | ||||
| 2026-02-17 | 13F | ExodusPoint Capital Management, LP | 0 | -100,00 | 0 | -100,00 | ||||
| 2026-03-31 | 13F | Sankala Group LLC | 95 | 0,00 | 12 | 22,22 | ||||
| 2026-02-10 | 13F | New Mexico Educational Retirement Board | 30.000 | 0,00 | 3 | 0,00 | ||||
| 2026-02-09 | 13F | Mediolanum International Funds Ltd | 0 | -100,00 | 0 | |||||
| 2026-02-13 | 13F | SIR Capital Management, L.P. | 0 | -100,00 | 0 | |||||
| 2026-02-17 | 13F | Grantham, Mayo, Van Otterloo & Co. LLC | 248.612 | -43,33 | 21.657 | -33,28 | ||||
| 2026-02-12 | 13F | Advisors Asset Management, Inc. | 8.226 | 14,01 | 717 | 34,33 | ||||
| 2026-02-09 | 13F | Hartland & Co., LLC | 3.277 | 119,34 | 285 | 159,09 | ||||
| 2026-02-13 | 13F | Boston Family Office Llc | 4.969 | 0,00 | 0 | |||||
| 2026-02-06 | 13F | Meiji Yasuda Asset Management Co Ltd. | 3.408 | 0,00 | 297 | 17,46 | ||||
| 2026-04-17 | 13F | Murphy & Mullick Capital Management Corp | 875 | -22,22 | 105 | 8,25 | ||||
| 2025-11-14 | 13F | Point72 Asset Management, L.P. | 0 | -100,00 | 0 | -100,00 | ||||
| 2026-02-10 | 13F | Gw Henssler & Associates Ltd | 3.049 | -24,94 | 266 | -11,67 | ||||
| 2026-02-12 | 13F | Skopos Labs, Inc. | 5.329 | 84,59 | 481 | 125,35 | ||||
| 2026-02-11 | 13F | Parallel Advisors, LLC | 7.385 | 3,06 | 643 | 21,32 | ||||
| 2026-04-10 | 13F | Perigon Wealth Management, LLC | 2.064 | 249 | ||||||
| 2026-02-10 | 13F | Savant Capital, LLC | 0 | -100,00 | 0 | |||||
| 2026-02-13 | 13F | Arrowstreet Capital, Limited Partnership | 53.710 | 4.679 | ||||||
| 2026-02-05 | 13F | Elyxium Wealth, LLC | 27 | 2 | ||||||
| 2026-02-11 | 13F | Renaissance Group Llc | 73.688 | 6.419 | ||||||
| 2026-02-12 | 13F | Voya Investment Management Llc | 583.078 | -4,98 | 50.792 | 11,87 | ||||
| 2026-03-06 | 13F | Hsbc Holdings Plc | 42.662 | -4,81 | 3.723 | 12,35 | ||||
| 2026-04-10 | 13F | Matrix Trust Co | 146 | 0,00 | 0 | |||||
| 2026-02-18 | 13F | Vident Advisory, LLC | 5.926 | -10,79 | 516 | 5,09 | ||||
| 2026-02-17 | 13F | Foresight Group Ltd Liability Partnership | 184.857 | -32,95 | 16.174 | -20,72 | ||||
| 2026-01-22 | 13F | Richardson Financial Services Inc. | 7 | 1 | ||||||
| 2026-02-06 | 13F | HighTower Advisors, LLC | 17.132 | -34,12 | 1.492 | -22,45 | ||||
| 2026-02-13 | 13F | Centaurus Financial, Inc. | 1.615 | 0 | ||||||
| 2026-02-09 | 13F | AIA Group Ltd | 4.423 | -36,88 | 385 | -25,68 | ||||
| 2026-02-13 | 13F | Wexford Capital Lp | 0 | -100,00 | 0 | |||||
| 2025-11-14 | 13F | Caption Management, LLC | 0 | -100,00 | 0 | -100,00 | ||||
| 2026-04-13 | 13F | St Germain D J Co Inc | 18 | -48,57 | 2 | -33,33 | ||||
| 2026-04-07 | 13F | CoreCap Advisors, LLC | 2.395 | -44,37 | 289 | -23,20 | ||||
| 2026-02-13 | 13F | Caxton Associates Llp | 14.399 | 78,58 | 1.254 | 110,40 | ||||
| 2026-02-03 | 13F | Bokf, Na | 0 | -100,00 | 0 | |||||
| 2026-01-15 | 13F | Vaughan Nelson Investment Management, L.p. | 0 | -100,00 | 0 | |||||
| 2026-02-12 | 13F | Steward Partners Investment Advisory, Llc | 6.882 | 27,82 | 599 | 50,50 | ||||
| 2026-04-24 | 13F | Raiffeisen Bank International AG | 1.761 | -28,44 | 198 | -10,81 | ||||
| 2026-04-28 | 13F | Stratos Wealth Partners, LTD. | 3.000 | -11,82 | 362 | 21,96 | ||||
| 2026-02-18 | 13F | Caitlin John, LLC | 4.039 | 352 | ||||||
| 2026-02-06 | 13F | Entrust Financial Llc | 209 | 18 | ||||||
| 2026-04-14 | 13F | Tradewinds Capital Management, LLC | 130 | 0,00 | 16 | 36,36 | ||||
| 2026-02-10 | 13F | Bruce G. Allen Investments, LLC | 615 | -6,96 | 54 | 10,42 | ||||
| 2026-02-17 | 13F | Magnetar Financial LLC | 0 | -100,00 | 0 | |||||
| 2026-02-09 | 13F | Hantz Financial Services, Inc. | 4.104 | 101,47 | 0 | |||||
| 2026-02-12 | 13F | CIBC Private Wealth Group, LLC | 925 | 39,52 | 81 | 63,27 | ||||
| 2026-02-11 | 13F | Manchester Capital Management LLC | 84 | 7 | ||||||
| 2026-04-24 | 13F | Retirement Systems of Alabama | 182.023 | 2,21 | 21.943 | 41,44 | ||||
| 2026-01-28 | 13F | CAPROCK Group, Inc. | 3.679 | 5,51 | 320 | 36,75 | ||||
| 2026-02-09 | 13F | Jefferies Financial Group Inc. | Put | 304.900 | -2,56 | 26.560 | 14,72 | |||
| 2026-02-09 | 13F | Jefferies Financial Group Inc. | Call | 334.500 | 9,14 | 29.138 | 28,49 | |||
| 2026-01-26 | 13F | Covenant Partners, LLC | 2.379 | 207 | ||||||
| 2026-02-09 | 13F | Jefferies Financial Group Inc. | 111.250 | 1.091,24 | 9.691 | 1.304,35 |