Grundlæggende statistik
| Institutionelle aktier (lange) | 39.289.527 - 89,42% (ex 13D/G) - change of -14,32MM shares -26,71% MRQ |
| Institutionel værdi (lang) | $ 4.868.180 USD ($1000) |
Institutionelt ejerskab og aktionærer
Hamilton Lane Incorporated (US:HLNE) har 393 institutionelle ejere og aktionærer, der har indsendt 13D/G- eller 13F-formularer til Securities Exchange Commission (SEC). Disse institutioner har i alt 39,289,527 aktier. Største aktionærer omfatter BlackRock, Inc., Vanguard Group Inc, Kayne Anderson Rudnick Investment Management Llc, Wasatch Advisors Inc, State Street Corp, Principal Financial Group Inc, Geode Capital Management, Llc, Janus Henderson Group Plc, Van Berkom & Associates Inc., and Balyasny Asset Management Llc .
Hamilton Lane Incorporated (NasdaqGS:HLNE) institutionel ejerskabsstruktur viser aktuelle positioner i virksomheden efter institutioner og fonde, samt seneste ændringer i positionsstørrelse. Større aktionærer kan omfatte individuelle investorer, investeringsforeninger, hedgefonde eller institutioner. Skema 13D angiver, at investoren besidder (eller besidder) mere end 5 % af virksomheden og har til hensigt (eller har til hensigt at) aktivt at forfølge en ændring i forretningsstrategi. Skema 13G indikerer en passiv investering på over 5%.
The share price as of April 24, 2026 is 94,84 / share. Previously, on April 28, 2025, the share price was 150,59 / share. This represents a decline of 37,02% over that period.

Fondens stemningsscore
Fund Sentiment Score (fka Ownership Accumulation Score) finder de aktier, der bliver mest købt af fonde. Det er resultatet af en sofistikeret, multi-faktor kvantitativ model, der identificerer virksomheder med de højeste niveauer af institutionel akkumulering. Scoringsmodellen bruger en kombination af den samlede stigning i oplyste ejere, ændringerne i porteføljeallokeringer i disse ejere og andre målinger. Tallet går fra 0 til 100, hvor højere tal indikerer et højere niveau af akkumulering for sine jævnaldrende, og 50 er gennemsnittet.
Opdateringsfrekvens: Dagligt
Se Ownership Explorer, som giver en liste over højest rangerende virksomheder.
AI+ Ask Fintel’s AI assistant about Hamilton Lane Incorporated.
Select a question to share a public post with an AI-crafted answer.
Thinking of good questions…
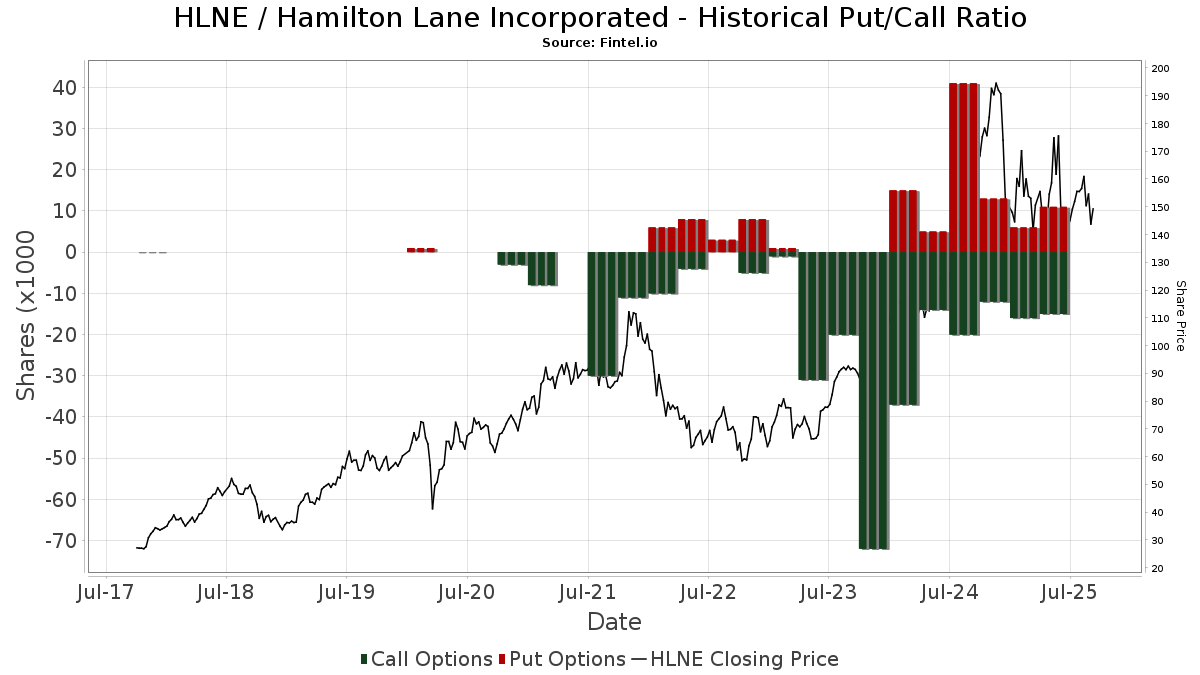
Institutionel Put/Call-forhold
Ud over at indberette standardaktie- og gældsudstedelser skal institutter med mere end 100 mill. aktiver under forvaltning også oplyse deres put- og call-optionsbeholdninger. Da salgsoptioner generelt indikerer negativ stemning, og købsoptioner indikerer positiv stemning, kan vi få en fornemmelse af den overordnede institutionelle stemning ved at plotte forholdet mellem put og kald. Diagrammet til højre viser det historiske put/call-forhold for dette instrument.
Brug af Put/Call Ratio som en indikator for investorernes stemning overvinder en af de vigtigste mangler ved at bruge totalt institutionelt ejerskab, som er, at en betydelig mængde af aktiver under forvaltning investeres passivt for at spore indekser. Passivt forvaltede fonde køber typisk ikke optioner, så indikatoren for put/call-forholdet følger mere nøje følelsen af aktivt forvaltede fonde.
13D/G-arkivering
Vi præsenterer 13D/G ansøgninger separat fra 13F ansøgninger på grund af den forskellige behandling af SEC. 13D/G-ansøgninger kan indgives af grupper af investorer (med én ledende), hvorimod 13F-ansøgninger ikke kan. Dette resulterer i situationer, hvor en investor kan indsende en 13D/G, der rapporterer én værdi for de samlede aktier (der repræsenterer alle de aktier, der ejes af investorgruppen), men derefter indsender en 13F, der rapporterer en anden værdi for de samlede aktier (der udelukkende repræsenterer deres egne) ejendomsret). Det betyder, at aktieejerskab af 13D/G-arkiver og 13F-arkiveringer ofte ikke er direkte sammenlignelige, så vi præsenterer dem separat.
Bemærk: Fra den 16. maj 2021 viser vi ikke længere ejere, der ikke har indsendt en 13D/G inden for det seneste år. Tidligere viste vi den fulde historie af 13D/G-arkiver. Generelt skal enheder, der er forpligtet til at indgive 13D/G-ansøgninger, indgive mindst årligt, før de indsender en afsluttende ansøgning. Dog forlader fonde nogle gange positioner uden at indsende en afsluttende ansøgning (dvs. de afvikler), så visning af den fulde historie resulterede nogle gange i forvirring om det nuværende ejerskab. For at undgå forvirring viser vi nu kun 'aktuelle' ejere - det vil sige - ejere, der har anmeldt inden for det seneste år.
Upgrade to unlock premium data.
| Fil dato | Form | Investor | Forrige Aktier |
Seneste Aktier |
Δ Aktier (Procent) |
Ejendomsret (Procent) |
Δ Ejerskab (Procent) |
|
|---|---|---|---|---|---|---|---|---|
| 2026-03-27 | VANGUARD GROUP INC | 3,901,933 | 0 | -100.00 | 0.00 | -100.00 | ||
| 2025-10-17 | BlackRock, Inc. | 4,189,474 | 3,980,037 | -5.00 | 9.10 | -9.90 | ||
| 2025-08-13 | KAYNE ANDERSON RUDNICK INVESTMENT MANAGEMENT LLC | 2,674,001 | 6.50 | |||||
| 2025-04-02 | HLA INVESTMENTS LLC | 15,657,470 | 15,729,416 | 0.46 | 28.20 | 0.36 |
13F og NPORT arkivering
Detaljer om 13F-arkivering er gratis. Detaljer om NP-ansøgninger kræver et premium-medlemskab. Grønne rækker angiver nye positioner. Røde rækker angiver lukkede positioner. Klik på linket ikon for at se den fulde transaktionshistorik.
Opgrader
for at låse premium-data op og eksportere til Excel ![]() .
.
| Fil dato | Kilde | Investor | Type | Gennemsnitlig pris (Øst) |
Aktier | Δ Aktier (%) |
Rapporteret Værdi ($1000) |
Δ Værdi (%) |
Port Alloc (%) |
|
|---|---|---|---|---|---|---|---|---|---|---|
| 2026-02-02 | 13F | Kornitzer Capital Management Inc /ks | 25.566 | -37,85 | 3.434 | -38,08 | ||||
| 2026-02-10 | 13F | Bridges Investment Management Inc | 8.513 | -41,49 | 1.143 | -41,71 | ||||
| 2026-02-13 | 13F | SRS Capital Advisors, Inc. | 526 | 71 | ||||||
| 2026-02-11 | 13F | Fox Run Management, L.l.c. | 0 | -100,00 | 0 | |||||
| 2026-02-17 | 13F | Raymond James Financial Inc | 577.591 | 10,11 | 77.787 | 10,02 | ||||
| 2026-04-21 | 13F | Merkkuri Wealth Advisors LLC | 17 | 2 | ||||||
| 2026-02-04 | 13F | HighPoint Advisor Group LLC | 2.382 | 320 | ||||||
| 2026-02-09 | 13F | Geode Capital Management, Llc | 1.068.729 | 0,00 | 143.562 | -0,35 | ||||
| 2026-02-11 | 13F | Empowered Funds, LLC | 20.992 | 2,80 | 2.819 | 2,43 | ||||
| 2026-02-18 | 13F | State of Tennessee, Treasury Department | 15.479 | -4,11 | 2.186 | 0,51 | ||||
| 2026-02-03 | 13F | Crossmark Global Holdings, Inc. | 2.526 | -4,14 | 339 | -4,51 | ||||
| 2026-02-17 | 13F | Tower Research Capital LLC (TRC) | 3.846 | 114,50 | 517 | 114,11 | ||||
| 2026-02-09 | 13F | Hantz Financial Services, Inc. | 510 | 139,44 | 0 | |||||
| 2026-04-16 | 13F | SG Americas Securities, LLC | 45.319 | -36,81 | 5 | -55,56 | ||||
| 2026-02-17 | 13F | Glenmede Trust Co Na | 3.096 | 416 | ||||||
| 2025-11-06 | 13F | Ameritas Advisory Services, LLC | 0 | -100,00 | 0 | -100,00 | ||||
| 2025-11-12 | 13F | Simplex Trading, Llc | Call | 0 | -100,00 | 0 | ||||
| 2026-02-05 | 13F | Qsemble Capital Management, LP | 2.367 | 318 | ||||||
| 2025-11-12 | 13F | Simplex Trading, Llc | 0 | -100,00 | 0 | |||||
| 2026-02-13 | 13F | JustInvest LLC | 3.089 | 22,29 | 415 | 21,76 | ||||
| 2026-02-17 | 13F | Royal Bank Of Canada | 111.739 | -48,46 | 15.008 | -48,64 | ||||
| 2026-04-23 | 13F | Farmers & Merchants Investments Inc | 35 | 0,00 | 3 | -25,00 | ||||
| 2026-02-11 | 13F | Ameritas Investment Partners, Inc. | 7.494 | 1.007 | ||||||
| 2025-11-14 | 13F | Mariner, LLC | 0 | -100,00 | 0 | |||||
| 2026-02-13 | 13F | Edgestream Partners, L.P. | 0 | -100,00 | 0 | |||||
| 2026-02-11 | 13F | Group One Trading, L.p. | 0 | -100,00 | 0 | -100,00 | ||||
| 2025-11-21 | 13F | Nebula Research & Development LLC | 0 | -100,00 | 0 | |||||
| 2026-01-12 | 13F | CVA Family Office, LLC | 4 | 0,00 | 1 | |||||
| 2026-02-11 | 13F | Winton Capital Group Ltd | 6.550 | 36,37 | 880 | 35,86 | ||||
| 2026-02-17 | 13F | SageView Advisory Group, LLC | 106 | 14 | ||||||
| 2026-02-06 | 13F | ProShare Advisors LLC | 1.641 | -4,65 | 220 | -4,76 | ||||
| 2026-01-28 | 13F | Universal- Beteiligungs- und Servicegesellschaft mbH | 38.721 | 112,58 | 5.206 | 112,02 | ||||
| 2026-02-13 | 13F | Macquarie Group Ltd | 0 | -100,00 | 0 | -100,00 | ||||
| 2026-02-10 | 13F | Core Wealth Advisors, Llc | 130 | 17 | ||||||
| 2025-11-14 | 13F | Bayesian Capital Management, LP | 0 | -100,00 | 0 | |||||
| 2026-04-07 | 13F | Farther Finance Advisors, LLC | 1.481 | 21,89 | 144 | -12,27 | ||||
| 2026-04-14 | 13F | Congress Asset Management Co /ma | 126.810 | 28,89 | 12.605 | -4,62 | ||||
| 2026-04-13 | 13F | Hm Payson & Co | 378 | 10,53 | 38 | -17,78 | ||||
| 2026-01-28 | 13F | Salomon & Ludwin, LLC | 0 | -100,00 | 0 | |||||
| 2026-01-29 | 13F | Kestra Private Wealth Services, Llc | 0 | -100,00 | 0 | |||||
| 2026-02-11 | 13F | Inceptionr Llc | 0 | -100,00 | 0 | |||||
| 2026-02-17 | 13F | Fmr Llc | 3.242 | -36,22 | 435 | -36,50 | ||||
| 2026-02-13 | 13F | Quarry LP | 140 | -24,73 | 19 | -28,00 | ||||
| 2026-04-21 | 13F | Grey Fox Wealth Advisors, LLC | 2.199 | 0,00 | 220 | -26,01 | ||||
| 2026-02-13 | 13F | Great West Life Assurance Co /can/ | 82.015 | 7,79 | 11 | 10,00 | ||||
| 2026-02-17 | 13F | Susquehanna International Group, Llp | Put | 2.900 | 389 | |||||
| 2026-01-23 | 13F | Beacon Harbor Wealth Advisors, Inc. | 49.933 | 6.707 | ||||||
| 2026-02-06 | 13F | Leonteq Securities AG | 1.309 | -37,07 | 176 | -37,50 | ||||
| 2026-02-17 | 13F | Toronto Dominion Bank | 1 | 0 | ||||||
| 2026-02-17 | 13F | Engineers Gate Manager LP | 18.746 | -57,86 | 2.518 | -58,02 | ||||
| 2026-02-06 | 13F | Legato Capital Management LLC | 2.411 | 324 | ||||||
| 2026-02-10 | 13F | Bank of New York Mellon Corp | 298.059 | -11,66 | 40.032 | -11,97 | ||||
| 2026-01-26 | 13F | KBC Group NV | 1.179 | 0,00 | 0 | |||||
| 2026-02-11 | 13F | LPL Financial LLC | 53.220 | -1,98 | 7.148 | -2,34 | ||||
| 2026-01-23 | 13F | Avion Wealth | 0 | -100,00 | 0 | |||||
| 2026-02-10 | 13F | Goldman Sachs Group Inc | 53.469 | -78,64 | 7.181 | -78,72 | ||||
| 2026-02-13 | 13F | Marshall Wace, Llp | 156.722 | 21.049 | ||||||
| 2026-01-30 | 13F/A | M&t Bank Corp | 13.474 | 87,32 | 1.809 | 86,69 | ||||
| 2026-02-13 | 13F | Parkside Financial Bank & Trust | 66 | 9 | ||||||
| 2026-02-12 | 13F | State Board Of Administration Of Florida Retirement System | 18.549 | 16,45 | 2.491 | 16,02 | ||||
| 2026-02-17 | 13F | Magnetar Financial LLC | 0 | -100,00 | 0 | |||||
| 2026-02-11 | 13F | Hughes Financial Services, LLC | 2 | 0 | ||||||
| 2026-04-06 | 13F | GAMMA Investing LLC | 616 | -18,41 | 61 | -39,60 | ||||
| 2026-02-12 | 13F | Aviva Plc | 3.848 | 19,32 | 517 | 18,89 | ||||
| 2026-02-13 | 13F | American Century Companies Inc | 493.245 | -2,48 | 66.248 | -2,83 | ||||
| 2026-01-29 | 13F | State Of Michigan Retirement System | 9.700 | 1,04 | 1.303 | 0,70 | ||||
| 2026-02-06 | 13F | FourThought Financial Partners, LLC | 8.256 | 43,66 | 1.109 | 43,15 | ||||
| 2026-02-17 | 13F | Voleon Capital Management Lp | 4.573 | 614 | ||||||
| 2026-01-26 | 13F | Private Trust Co Na | 188 | 24,50 | 25 | 25,00 | ||||
| 2026-04-24 | 13F | Strs Ohio | 968 | -0,10 | 96 | -26,15 | ||||
| 2026-02-04 | 13F | Swiss Life Asset Management Ltd | 3.589 | 92,23 | 482 | 92,03 | ||||
| 2026-02-17 | 13F | Crawford Investment Counsel Inc | 56.099 | 20,65 | 7.535 | 20,22 | ||||
| 2026-02-17 | 13F | Mercer Global Advisors Inc /adv | 2.075 | 279 | ||||||
| 2025-11-14 | 13F | Integrated Wealth Concepts LLC | 0 | -100,00 | 0 | |||||
| 2026-02-06 | 13F | Gsa Capital Partners Llp | 0 | -100,00 | 0 | |||||
| 2026-01-29 | 13F | Copeland Capital Management, LLC | 524.166 | 5,85 | 70.401 | 5,47 | ||||
| 2026-01-27 | 13F | Regions Financial Corp | 1.672 | 225 | ||||||
| 2026-02-02 | 13F | Principal Financial Group Inc | 1.085.850 | 148,33 | 145.844 | 147,45 | ||||
| 2025-10-28 | 13F | BRYN MAWR TRUST Co | 71 | 0,00 | 10 | -10,00 | ||||
| 2026-02-13 | 13F | First Trust Advisors Lp | 3.401 | -75,43 | 457 | -75,55 | ||||
| 2026-04-23 | 13F | Northstar Asset Management Llc | 3.150 | 8,62 | 313 | -19,54 | ||||
| 2026-02-13 | 13F | Financial Network Wealth Advisors LLC | 35 | 25,00 | 5 | 33,33 | ||||
| 2026-02-05 | 13F | Amalgamated Bank | 19.135 | -4,96 | 3 | 0,00 | ||||
| 2026-04-20 | 13F | Jfs Wealth Advisors, Llc | 18 | -14,29 | 2 | -50,00 | ||||
| 2026-02-17 | 13F | Two Sigma Securities, Llc | 4.329 | 581 | ||||||
| 2026-02-24 | 13F | MidFirst Bank | 9 | 1 | ||||||
| 2026-02-09 | 13F | Hartland & Co., LLC | 867 | 733,65 | 116 | 728,57 | ||||
| 2026-02-12 | 13F | Conservest Capital Advisors, Inc. | 2.150 | 0,00 | 289 | -0,35 | ||||
| 2026-02-09 | 13F | Coldstream Capital Management Inc | 2.619 | 352 | ||||||
| 2026-02-11 | 13F | Cerity Partners LLC | 26.839 | 3.605 | ||||||
| 2026-02-17 | 13F | ExodusPoint Capital Management, LP | 0 | -100,00 | 0 | -100,00 | ||||
| 2026-02-17 | 13F | Capstone Investment Advisors, Llc | 0 | -100,00 | 0 | -100,00 | ||||
| 2025-11-06 | 13F | Financial Advocates Investment Management | 0 | -100,00 | 0 | |||||
| 2026-02-17 | 13F | Longaeva Partners L.P. | 63.619 | 8.545 | ||||||
| 2026-02-12 | 13F | EntryPoint Capital, LLC | 4.067 | 7,42 | 546 | 7,06 | ||||
| 2026-02-12 | 13F | Principal Securities, Inc. | 0 | -100,00 | 0 | |||||
| 2026-02-13 | 13F | FJ Capital Management LLC | 0 | -100,00 | 0 | |||||
| 2026-02-13 | 13F | Resources Investment Advisors, LLC. | 1.687 | 227 | ||||||
| 2026-02-17 | 13F | ISAM Funds (UK) Ltd | 0 | -100,00 | 0 | -100,00 | ||||
| 2026-02-13 | 13F | Bank Of Nova Scotia | 32.522 | 4.368 | ||||||
| 2026-04-22 | 13F | JNBA Financial Advisors | 45 | 4 | ||||||
| 2026-02-19 | 13F | CI Private Wealth, LLC | 2.115 | -30,77 | 284 | -30,90 | ||||
| 2026-02-09 | 13F | New Age Alpha Advisors, LLC | 4.961 | -51,27 | 666 | -51,46 | ||||
| 2026-04-14 | 13F | Zrc Wealth Management, Llc | 51 | 5 | ||||||
| 2025-11-14 | 13F | Binnacle Investments Inc | 237 | 30,94 | 32 | 24,00 | ||||
| 2026-04-20 | 13F | Concurrent Investment Advisors, LLC | 0 | -100,00 | 0 | -100,00 | ||||
| 2026-02-17 | 13F | Advisory Services Network, LLC | 0 | -100,00 | 0 | |||||
| 2025-11-05 | 13F | Optimize Financial Inc | 0 | -100,00 | 0 | -100,00 | ||||
| 2025-11-14 | 13F | Credit Agricole S A | 0 | -100,00 | 0 | -100,00 | ||||
| 2026-04-16 | 13F | Diversified Trust Co | 16.830 | 22,36 | 1.673 | -9,47 | ||||
| 2026-02-17 | 13F | Prana Capital Management, LP | 46.532 | 6.250 | ||||||
| 2026-02-17 | 13F | Oddo Bhf Asset Management Sas | 0 | -100,00 | 0 | |||||
| 2026-04-07 | 13F | Park Avenue Securities Llc | 3.688 | -7,31 | 0 | |||||
| 2026-02-11 | 13F | Los Angeles Capital Management Llc | 4.284 | -1,38 | 489 | -16,58 | ||||
| 2026-02-17 | 13F | D. E. Shaw & Co., Inc. | 0 | -100,00 | 0 | |||||
| 2026-02-17 | 13F | Caisse De Depot Et Placement Du Quebec | 0 | -100,00 | 0 | -100,00 | ||||
| 2026-02-12 | 13F | Wealthspire Advisors, LLC | 0 | -100,00 | 0 | |||||
| 2025-11-14 | 13F | Weiss Asset Management LP | 0 | -100,00 | 0 | -100,00 | ||||
| 2026-04-07 | 13F | Mb, Levis & Associates, Llc | 722 | 0,00 | 72 | -26,04 | ||||
| 2026-01-30 | 13F | R Squared Ltd | 1.755 | 15,38 | 236 | 14,63 | ||||
| 2026-02-06 | 13F | Envestnet Portfolio Solutions, Inc. | 5.130 | 41,63 | 689 | 40,98 | ||||
| 2026-02-17 | 13F | Millennium Management Llc | 26.680 | -97,48 | 3.583 | -97,49 | ||||
| 2025-11-14 | 13F | Axa S.a. | 0 | -100,00 | 0 | |||||
| 2026-04-07 | 13F | CoreCap Advisors, LLC | 101 | 288,46 | 10 | 233,33 | ||||
| 2026-02-17 | 13F | Ancora Advisors, LLC | 151 | 20 | ||||||
| 2025-11-14 | 13F | Point72 Asia (Singapore) Pte. Ltd. | 5.603 | 755 | ||||||
| 2026-01-28 | 13F | Arizona State Retirement System | 11.564 | -0,46 | 1.553 | -0,77 | ||||
| 2026-04-17 | 13F | Brown, Lisle/cummings, Inc. | 156 | 16 | ||||||
| 2026-02-13 | 13F | Umb Bank N A/mo | 468 | 10,38 | 63 | 8,77 | ||||
| 2026-02-12 | 13F | Brown Brothers Harriman & Co | 2.758 | 0,04 | 370 | -0,27 | ||||
| 2026-01-26 | 13F | Moran Wealth Management, LLC | 46.818 | 6.288 | ||||||
| 2026-02-11 | 13F | Manchester Capital Management LLC | 6 | 1 | ||||||
| 2026-04-24 | 13F | Root Financial Partners, LLC | 25 | -51,92 | 2 | -66,67 | ||||
| 2026-02-17 | 13F | Point72 Asset Management, L.P. | 42.645 | 102,07 | 5.728 | 101,37 | ||||
| 2026-01-23 | 13F | Steigerwald, Gordon & Koch Inc. | 17 | 2 | ||||||
| 2026-04-13 | 13F | Mather Group, Llc. | 25 | 2 | ||||||
| 2026-02-13 | 13F | Blueshift Asset Management, LLC | 0 | -100,00 | 0 | |||||
| 2026-02-04 | 13F | Clark Wealth Partners | 130 | 0,00 | 17 | 0,00 | ||||
| 2026-02-17 | 13F | Northern Trust Corp | 401.137 | -1,89 | 53.877 | -2,24 | ||||
| 2026-04-15 | 13F | Hutchens & Kramer Investment Management Group, LLC | 0 | -100,00 | 0 | |||||
| 2026-04-15 | 13F | DAVENPORT & Co LLC | 3.034 | 302 | ||||||
| 2026-04-23 | 13F | TFC Financial Management | 1 | 0,00 | 0 | |||||
| 2026-02-11 | 13F | Sunrise Financial Services, LLC | 21 | 3 | ||||||
| 2026-02-12 | 13F | Campbell & CO Investment Adviser LLC | 0 | -100,00 | 0 | |||||
| 2026-04-08 | 13F | DiNuzzo Private Wealth, Inc. | 6 | -14,29 | 1 | |||||
| 2026-02-17 | 13F | T. Rowe Price Investment Management, Inc. | 216.049 | -83,28 | 29 | -83,33 | ||||
| 2026-02-17 | 13F | Cinctive Capital Management LP | 25.628 | 3.442 | ||||||
| 2025-11-17 | 13F | Caxton Associates Llp | 0 | -100,00 | 0 | -100,00 | ||||
| 2026-02-13 | 13F | Quattro Advisors LLC | 35 | 5 | ||||||
| 2026-02-17 | 13F | Liontrust Investment Partners LLP | 2.610 | -9,66 | 351 | -10,03 | ||||
| 2026-04-23 | 13F | SJS Investment Consulting Inc. | 3 | -83,33 | 0 | -100,00 | ||||
| 2026-02-13 | 13F | Aigen Investment Management, Lp | 1.711 | 230 | ||||||
| 2026-02-02 | 13F | Danske Bank A/s | 19.124 | 19.024,00 | 2.569 | 19.653,85 | ||||
| 2026-04-24 | 13F | Yousif Capital Management, Llc | 11.909 | -5,48 | 1.184 | -37,11 | ||||
| 2026-02-17 | 13F | Aqr Capital Management Llc | 40.947 | 810,54 | 5.500 | 807,43 | ||||
| 2026-01-20 | 13F | Cromwell Holdings LLC | 4 | 1 | ||||||
| 2025-11-12 | 13F | NewSquare Capital LLC | 0 | -100,00 | 0 | |||||
| 2026-02-02 | 13F | Van Berkom & Associates Inc. | 759.628 | 10,70 | 102 | 10,87 | ||||
| 2026-02-17 | 13F | Jain Global LLC | 0 | -100,00 | 0 | |||||
| 2026-02-17 | 13F | Shelton Capital Management | 0 | -100,00 | 0 | |||||
| 2026-02-17 | 13F | Worldquant Millennium Advisors Llc | 7.588 | 1.019 | ||||||
| 2026-04-06 | 13F | Versant Capital Management, Inc | 240 | 293,44 | 24 | 187,50 | ||||
| 2026-02-17 | 13F | Two Sigma Investments, Lp | 97.081 | 753,38 | 13.039 | 750,49 | ||||
| 2026-01-27 | 13F | Vista Finance, Llc | 2.406 | -6,27 | 323 | -6,65 | ||||
| 2026-02-06 | 13F | Global Retirement Partners, LLC | 2.255 | 611,36 | 303 | 619,05 | ||||
| 2026-01-29 | 13F | Teachers Retirement System Of The State Of Kentucky | 23.777 | 0,00 | 3 | 0,00 | ||||
| 2026-02-13 | 13F | Entropy Technologies, LP | 0 | -100,00 | 0 | |||||
| 2026-01-27 | 13F | First Horizon Corp | 168 | -27,27 | 23 | -29,03 | ||||
| 2025-11-14 | 13F | Scientech Research LLC | 0 | -100,00 | 0 | |||||
| 2026-02-10 | 13F | Rothschild Investment Llc | 34 | 5 | ||||||
| 2026-02-11 | 13F | BI Asset Management Fondsmaeglerselskab A/S | 0 | -100,00 | 0 | |||||
| 2026-02-06 | 13F | Van Hulzen Asset Management, LLC | 16.883 | -9,54 | 2.268 | -9,86 | ||||
| 2026-02-12 | 13F | BlackRock, Inc. | 4.078.002 | 1,17 | 547.716 | 0,81 | ||||
| 2026-02-10 | 13F | Phillips Wealth Planners LLC | 1.839 | 281 | ||||||
| 2026-02-17 | 13F | Trexquant Investment LP | 29.416 | -48,11 | 3.951 | -48,31 | ||||
| 2026-02-13 | 13F | Citigroup Inc | 125.150 | 0,90 | 16.809 | 0,53 | ||||
| 2026-02-03 | 13F | International Assets Investment Management, Llc | 1.161 | 156 | ||||||
| 2026-02-17 | 13F | Adage Capital Partners Gp, L.l.c. | 116.740 | 15.679 | ||||||
| 2026-02-13 | 13F | Toroso Investments, LLC | 5.451 | -14,28 | 732 | -14,59 | ||||
| 2026-02-13 | 13F | Headlands Technologies LLC | 4.644 | 624 | ||||||
| 2026-02-12 | 13F | New York State Common Retirement Fund | 125.299 | 25,61 | 16.829 | 25,16 | ||||
| 2026-02-17 | 13F | Jones Financial Companies Lllp | 99 | 7,61 | 13 | 8,33 | ||||
| 2026-04-20 | 13F | Ronald Blue Trust, Inc. | 751 | 773,26 | 75 | 428,57 | ||||
| 2026-02-13 | 13F | Neuberger Berman Group LLC | 604.306 | -5,34 | 81.164 | -5,67 | ||||
| 2026-01-21 | 13F | Clayton Financial Group LLC | 0 | -100,00 | 0 | |||||
| 2026-02-06 | 13F | TimesSquare Capital Management, LLC | 328.286 | 4,83 | 44.092 | 4,46 | ||||
| 2026-01-22 | 13F | Personal Cfo Solutions, Llc | 2.300 | 2,72 | 309 | 2,33 | ||||
| 2025-11-07 | 13F | Florida Financial Advisors, Llc | 0 | -100,00 | 0 | -100,00 | ||||
| 2026-04-20 | 13F | Yorktown Management & Research Co Inc | 3.300 | 0,00 | 328 | -25,96 | ||||
| 2026-02-13 | 13F/A | Alberta Investment Management Corp | 0 | -100,00 | 0 | |||||
| 2026-04-14 | 13F | Bay Harbor Wealth Management, LLC | 0 | -100,00 | 0 | |||||
| 2026-02-17 | 13F | Fred Alger Management, Llc | 261.525 | 29,76 | 35.245 | 29,46 | ||||
| 2026-02-10 | 13F | Argent Trust Co | 1.751 | 0,00 | 235 | -0,42 | ||||
| 2026-02-05 | 13F | Northwestern Mutual Investment Management Company, Llc | 9.148 | 1,45 | 1.229 | 1,07 | ||||
| 2025-11-12 | 13F | Polen Capital Management Llc | 0 | -100,00 | 0 | |||||
| 2026-02-13 | 13F | Morgan Stanley | 579.226 | -11,07 | 77.796 | -11,39 | ||||
| 2025-11-12 | 13F | Bellwether Advisors, LLC | 0 | -100,00 | 0 | -100,00 | ||||
| 2026-02-17 | 13F | Optiver Holding B.V. | 0 | -100,00 | 0 | |||||
| 2026-02-09 | 13F | Morningstar Investment Management LLC | 0 | -100,00 | 0 | -100,00 | ||||
| 2026-04-22 | 13F | Janney Montgomery Scott LLC | 37.238 | 65,06 | 4 | 0,00 | ||||
| 2026-01-29 | 13F | UBS Group AG | 590.201 | 32,96 | 79.270 | 32,48 | ||||
| 2026-02-17 | 13F | Man Group plc | 89.812 | 154,22 | 12.063 | 153,35 | ||||
| 2026-04-24 | 13F | Deprince Race & Zollo Inc | 325.465 | 7,99 | 32.351 | -20,08 | ||||
| 2025-11-03 | 13F | Townsquare Capital Llc | 0 | -100,00 | 0 | -100,00 | ||||
| 2026-01-30 | 13F | Laurel Wealth Advisors LLC | 10 | 1 | ||||||
| 2026-04-15 | 13F | Activest Wealth Management | 26 | 3 | ||||||
| 2026-02-17 | 13F | Guggenheim Capital Llc | 0 | -100,00 | 0 | |||||
| 2026-02-17 | 13F | Advisor Group Holdings, Inc. | 4.951 | -59,97 | 665 | -63,50 | ||||
| 2026-02-09 | 13F | Jefferies Financial Group Inc. | 98.241 | 145,91 | 13.195 | 145,06 | ||||
| 2026-02-03 | 13F | Mitsubishi UFJ Kokusai Asset Management Co., Ltd. | 110 | 0,00 | 15 | 7,14 | ||||
| 2025-10-28 | 13F | Arlington Trust Co LLC | 0 | -100,00 | 0 | |||||
| 2026-01-27 | 13F | Novem Group | 0 | -100,00 | 0 | |||||
| 2026-02-13 | 13F | Barclays Plc | 35.048 | -45,89 | 4.707 | -46,08 | ||||
| 2026-02-17 | 13F | Snowden Capital Advisors LLC | 3.710 | -26,42 | 500 | -26,69 | ||||
| 2026-02-13 | 13F | Bridgefront Capital, LLC | 4.542 | 610 | ||||||
| 2026-02-17 | 13F | Brevan Howard Capital Management LP | 0 | -100,00 | 0 | |||||
| 2026-01-28 | 13F | B. Metzler seel. Sohn & Co. AG | 22.103 | 27,66 | 2.969 | 27,22 | ||||
| 2026-01-21 | 13F | Albion Financial Group /ut | 12 | 0,00 | 2 | 0,00 | ||||
| 2026-01-26 | 13F | Cwm, Llc | 1.083 | 684,78 | 0 | |||||
| 2026-02-06 | 13F | Handelsbanken Fonder AB | 14.300 | 48,96 | 2 | 0,00 | ||||
| 2026-02-17 | 13F | Maryland State Retirement & Pension System | 1.942 | 0,00 | 261 | -0,38 | ||||
| 2026-02-12 | 13F | Ensign Peak Advisors, Inc | 10.915 | 54,84 | 1.466 | 54,21 | ||||
| 2026-04-17 | 13F | Vermillion Wealth Management, Inc. | 1 | 0 | ||||||
| 2026-02-10 | 13F | Norges Bank | 511.184 | 68.657 | ||||||
| 2026-02-17 | 13F | Amundi | 20.334 | 750,08 | 2.731 | 813,38 | ||||
| 2025-11-12 | 13F | Group One Trading, L.p. | Call | 0 | -100,00 | 0 | -100,00 | |||
| 2025-11-07 | 13F | Readystate Asset Management Lp | 0 | -100,00 | 0 | |||||
| 2026-02-13 | 13F | Public Employees Retirement Association Of Colorado | 111.905 | 0,00 | 15 | 0,00 | ||||
| 2025-11-14 | 13F | Nbc Securities, Inc. | 0 | -100,00 | 0 | |||||
| 2026-02-11 | 13F | Picton Mahoney Asset Management | 7.234 | 972 | ||||||
| 2026-03-06 | 13F | Hsbc Holdings Plc | 6.757 | -22,45 | 916 | -21,86 | ||||
| 2026-01-30 | 13F | New York State Teachers Retirement System | 6.600 | -17,29 | 1 | -100,00 | ||||
| 2026-02-19 | 13F | Invesco Ltd. | 532.268 | -65,32 | 71.489 | -65,44 | ||||
| 2026-04-20 | 13F | State of Alaska, Department of Revenue | 4.067 | 0,00 | 0 | |||||
| 2026-02-13 | 13F | Champlain Investment Partners, LLC | 0 | -100,00 | 0 | |||||
| 2026-02-12 | 13F | Brinker Capital Investments, LLC | 11.202 | 147,39 | 1.505 | 146,56 | ||||
| 2026-04-23 | 13F | Marquette Asset Management, LLC | 5 | 0 | ||||||
| 2026-02-12 | 13F | Elo Mutual Pension Insurance Co | 10.844 | -4,32 | 1.456 | -4,65 | ||||
| 2026-04-10 | 13F | Impact Capital Partners LLC | 3.864 | 98,66 | 384 | 47,13 | ||||
| 2026-02-13 | 13F | Peak6 Llc | Call | 0 | -100,00 | 0 | ||||
| 2026-04-06 | 13F | CX Institutional | 119 | 395,83 | 0 | |||||
| 2026-04-15 | 13F | Fortitude Family Office, LLC | 6 | 1 | ||||||
| 2026-02-11 | 13F | Meketa Investment Group Inc /adv | 6.235 | 837 | ||||||
| 2026-02-13 | 13F | Cynosure Management, Llc | 0 | -100,00 | 0 | -100,00 | ||||
| 2026-02-13 | 13F | Islay Capital Management, Llc | 1.200 | 0,00 | 161 | 0,00 | ||||
| 2026-02-12 | 13F | MetLife Investment Management, LLC | 21.245 | -3,51 | 2.853 | -3,84 | ||||
| 2026-02-13 | 13F | Healthcare Of Ontario Pension Plan Trust Fund | 48.504 | 6.515 | ||||||
| 2026-04-17 | 13F | Outlook Wealth Advisors, LLC | 0 | -100,00 | 0 | |||||
| 2026-02-17 | 13F | Citadel Advisors Llc | 755.373 | -38,75 | 101.454 | -38,97 | ||||
| 2026-01-29 | 13F | Quest 10 Wealth Builders, Inc. | 0 | -100,00 | 0 | |||||
| 2026-02-17 | 13F | Wiley Bros.-aintree Capital, Llc | 20.572 | 6,80 | 2.763 | 6,48 | ||||
| 2026-02-13 | 13F | Manufacturers Life Insurance Company, The | 0 | -100,00 | 0 | |||||
| 2026-04-08 | 13F | Wealth Enhancement Advisory Services, Llc | 2.293 | -38,36 | 216 | -60,62 | ||||
| 2026-02-13 | 13F | Sei Investments Co | 295.808 | 21,33 | 39.729 | 20,90 | ||||
| 2025-11-14 | 13F | Wolverine Trading, Llc | Call | 0 | -100,00 | 0 | ||||
| 2026-04-21 | 13F | Wasatch Advisors Inc | 1.751.596 | 15,83 | 174.109 | -14,28 | ||||
| 2026-02-17 | 13F | Utah Retirement Systems | 2.112 | 0,00 | 284 | -0,35 | ||||
| 2026-02-17 | 13F | Algert Global Llc | 30.550 | 4 | ||||||
| 2026-02-13 | 13F | Y-Intercept (Hong Kong) Ltd | 0 | -100,00 | 0 | |||||
| 2026-02-17 | 13F | Russell Investments Group, Ltd. | 85.173 | 89,17 | 11.440 | 88,48 | ||||
| 2025-11-06 | 13F | Versor Investments LP | 0 | -100,00 | 0 | -100,00 | ||||
| 2026-02-13 | 13F | Treasurer of the State of North Carolina | 16.955 | -5,60 | 2 | 0,00 | ||||
| 2026-02-12 | 13F | Ci Investments Inc. | 0 | -100,00 | 0 | |||||
| 2026-02-17 | 13F | Silvercrest Asset Management Group Llc | 118.147 | -7,43 | 15.868 | -7,76 | ||||
| 2026-02-06 | 13F | Pnc Financial Services Group, Inc. | 3.942 | 90,25 | 529 | 89,61 | ||||
| 2026-02-09 | 13F | CBIZ Investment Advisory Services, LLC | 331 | 16,14 | 45 | 15,79 | ||||
| 2026-02-17 | 13F | Captrust Financial Advisors | 1.848 | 248 | ||||||
| 2026-04-13 | 13F | Wolff Wiese Magana Llc | 33 | 73,68 | 3 | 50,00 | ||||
| 2025-11-14 | 13F | Sherbrooke Park Advisers Llc | 0 | -100,00 | 0 | |||||
| 2026-02-05 | 13F | Atria Investments Llc | 10.669 | -12,54 | 1.433 | -12,90 | ||||
| 2026-02-12 | 13F | Jane Street Group, Llc | 58.318 | -72,15 | 7.833 | -72,26 | ||||
| 2026-02-02 | 13F | Millstone Evans Group, LLC | 0 | -100,00 | 0 | -100,00 | ||||
| 2026-02-17 | 13F | California State Teachers Retirement System | 39.451 | 5,63 | 5.299 | 5,24 | ||||
| 2026-02-10 | 13F | Commonwealth Of Pennsylvania Public School Empls Retrmt Sys | 10.232 | -1,45 | 1.374 | -1,79 | ||||
| 2026-02-17 | 13F | Citadel Advisors Llc | Call | 0 | -100,00 | 0 | ||||
| 2026-02-02 | 13F | Truist Financial Corp | 26.741 | 4,74 | 3.592 | 4,36 | ||||
| 2026-02-12 | 13F | Mount Yale Investment Advisors, LLC | 1.987 | 268 | ||||||
| 2026-02-17 | 13F | Citadel Advisors Llc | Put | 0 | -100,00 | 0 | ||||
| 2026-02-05 | 13F | Stephens Inc /ar/ | 1.690 | 227 | ||||||
| 2026-02-12 | 13F | Integrated Quantitative Investments LLC | 11.141 | 1.496 | ||||||
| 2026-04-21 | 13F | GHP Investment Advisors, Inc. | 1 | 0 | ||||||
| 2026-02-17 | 13F | FIL Ltd | 170.610 | 37,47 | 22.915 | 36,98 | ||||
| 2026-02-11 | 13F | Westfield Capital Management Co Lp | 363.487 | 48.820 | ||||||
| 2025-11-13 | 13F | Clear Street Markets Llc | 0 | -100,00 | 0 | -100,00 | ||||
| 2026-02-10 | 13F | New Mexico Educational Retirement Board | 8.200 | 0,00 | 1 | 0,00 | ||||
| 2026-04-23 | 13F | Oppenheimer & Co Inc | 21.877 | 26,22 | 2.175 | -6,57 | ||||
| 2026-04-17 | 13F | Presilium Private Wealth, Llc | 4.058 | 0,00 | 403 | -26,06 | ||||
| 2026-02-09 | 13F | Catalyst Funds Management Pty Ltd | 0 | -100,00 | 0 | |||||
| 2025-11-12 | 13F | Bare Financial Services, Inc | 0 | -100,00 | 0 | |||||
| 2026-04-13 | 13F | Massmutual Trust Co Fsb/adv | 129 | -6,52 | 13 | -33,33 | ||||
| 2026-02-10 | 13F | State of Wyoming | 2.807 | 107,77 | 377 | 107,14 | ||||
| 2026-04-22 | 13F | Sterling Capital Management LLC | 9.086 | -21,41 | 903 | -41,82 | ||||
| 2025-10-30 | 13F | Twin Peaks Wealth Advisors, LLC | 0 | -100,00 | 0 | |||||
| 2025-11-14 | 13F | AXA Investment Managers S.A. | 3.250 | 438 | ||||||
| 2026-02-17 | 13F | Bank Of America Corp /de/ | 380.835 | -24,95 | 51.150 | -25,22 | ||||
| 2026-01-27 | 13F | Zurcher Kantonalbank (Zurich Cantonalbank) | 8.821 | -34,99 | 1.185 | -35,23 | ||||
| 2026-02-17 | 13F | Aquatic Capital Management LLC | 10.595 | -73,09 | 1.423 | -73,19 | ||||
| 2026-01-23 | 13F | Gibbs Wealth Management | 4.677 | 21,23 | 693 | 33,27 | ||||
| 2026-02-12 | 13F | Steward Partners Investment Advisory, Llc | 899 | 12,94 | 121 | 12,15 | ||||
| 2026-02-17 | 13F | Summit Trail Advisors, Llc | 3.431 | 39,70 | 462 | 39,58 | ||||
| 2026-02-03 | 13F | F/M Investments LLC | 5.357 | 35,52 | 719 | 35,15 | ||||
| 2026-02-13 | 13F | Fieldview Capital Management, LLC | 2.832 | 380 | ||||||
| 2026-02-12 | 13F | Xponance, Inc. | 6.478 | -7,59 | 870 | -7,84 | ||||
| 2026-04-23 | 13F | Oppenheimer Asset Management Inc. | 33.547 | 14,40 | 3.335 | -15,34 | ||||
| 2026-02-06 | 13F | Entrust Financial Llc | 72 | 10 | ||||||
| 2026-04-17 | 13F | AdvisorNet Financial, Inc | 38 | 72,73 | 4 | 50,00 | ||||
| 2026-02-05 | 13F | HFM Investment Advisors, LLC | 2 | 0,00 | 0 | |||||
| 2026-02-12 | 13F | JPL Wealth Management, LLC | 0 | -100,00 | 0 | |||||
| 2026-02-09 | 13F | Quest Partners LLC | 192 | -71,89 | 26 | -72,83 | ||||
| 2026-02-12 | 13F | Cloud Capital Management, LLC | 0 | -100,00 | 0 | |||||
| 2026-02-12 | 13F | Loomis Sayles & Co L P | 0 | -100,00 | 0 | |||||
| 2026-02-13 | 13F | State Street Corp | 1.293.854 | 1,43 | 174.458 | 1,05 | ||||
| 2026-02-13 | 13F | Wells Fargo & Company/mn | 442.621 | -3,17 | 59.448 | -3,52 | ||||
| 2026-01-29 | 13F | Rakuten Securities, Inc. | 1 | -95,65 | 0 | -100,00 | ||||
| 2026-02-10 | 13F | Axq Capital, Lp | 0 | -100,00 | 0 | -100,00 | ||||
| 2026-02-06 | 13F | Vestmark Advisory Solutions, Inc. | 17.767 | -4,78 | 2.386 | -5,13 | ||||
| 2026-01-23 | 13F | Assetmark, Inc | 1.378 | 102,65 | 185 | 103,30 | ||||
| 2026-02-17 | 13F | Holocene Advisors, LP | 27.564 | 66,53 | 3.702 | 65,93 | ||||
| 2026-02-17 | 13F | Cetera Investment Advisers | 19.635 | 11,70 | 2.637 | 11,31 | ||||
| 2026-04-15 | 13F | Tema Etfs Llc | 960 | 0,00 | 95 | -25,78 | ||||
| 2026-01-30 | 13F | Us Bancorp \de\ | 1.878 | 24,54 | 252 | 24,14 | ||||
| 2026-02-10 | 13F | BW Gestao de Investimentos Ltda. | 45.500 | 6.111 | ||||||
| 2025-11-13 | 13F | Glenmede Investment Management, LP | 3.160 | 1,84 | 426 | -3,41 | ||||
| 2026-04-24 | 13F | Bayban | 46 | 0,00 | 5 | -33,33 | ||||
| 2026-04-17 | 13F | CENTRAL TRUST Co | 32 | 10,34 | 3 | 0,00 | ||||
| 2026-02-02 | 13F | Fifth Third Bancorp | 332 | -11,94 | 45 | -12,00 | ||||
| 2026-01-26 | 13F | Whittier Trust Co | 105 | 0,00 | 15 | 15,38 | ||||
| 2025-11-14 | 13F | Point72 Hong Kong Ltd | 9.769 | -29,69 | 1.317 | -33,33 | ||||
| 2026-03-04 | 13F | SHP Wealth Management | 2 | 0 | ||||||
| 2026-04-22 | 13F | Richard Bernstein Advisors LLC | 9.900 | 0,00 | 984 | -25,96 | ||||
| 2026-02-17 | 13F | Quantessence Capital LLC | 0 | -100,00 | 0 | |||||
| 2026-02-05 | 13F | High Note Wealth, LLC | 0 | -100,00 | 0 | |||||
| 2026-02-10 | 13F | Acadian Asset Management Llc | 200 | 0 | ||||||
| 2025-11-14 | 13F | Sofos Investments, Inc. | 0 | -100,00 | 0 | |||||
| 2026-02-12 | 13F | Dundas Partners LLP | 2.574 | 0,00 | 346 | -0,29 | ||||
| 2026-04-22 | 13F | Pictet Asset Management Holding SA | 6.557 | 5,91 | 652 | -21,66 | ||||
| 2026-02-06 | 13F | Covestor Ltd | 747 | -15,88 | 0 | |||||
| 2026-02-06 | 13F | EverSource Wealth Advisors, LLC | 610 | -15,86 | 82 | -16,49 | ||||
| 2026-04-24 | 13F | Retirement Systems of Alabama | 50.096 | 2,08 | 4.980 | -24,46 | ||||
| 2026-02-11 | 13F | Jpmorgan Chase & Co | 267.355 | -37,82 | 35.909 | -38,04 | ||||
| 2026-04-08 | 13F | Heritage Family Offices, LLP | 0 | -100,00 | 0 | |||||
| 2026-02-13 | 13F | Police & Firemen's Retirement System of New Jersey | 17.435 | -1,85 | 2.342 | -2,21 | ||||
| 2026-02-12 | 13F | Renaissance Technologies Llc | 159.231 | -9,29 | 21.386 | -9,61 | ||||
| 2026-02-12 | 13F | Connecticut Wealth Management, LLC | 0 | -100,00 | 0 | |||||
| 2026-02-17 | 13F | Qube Research & Technologies Ltd | 0 | -100,00 | 0 | |||||
| 2026-02-17 | 13F | Creative Planning | 21.937 | 65,81 | 2.946 | 65,23 | ||||
| 2025-11-14 | 13F | Old Mission Capital Llc | 0 | -100,00 | 0 | |||||
| 2026-02-13 | 13F | Segall Bryant & Hamill, Llc | 112.248 | 4,71 | 15.076 | 4,35 | ||||
| 2026-04-23 | 13F | Harbor Investment Advisory, Llc | 0 | -100,00 | 0 | |||||
| 2026-01-26 | 13F | Mirae Asset Global Investments Co., Ltd. | 7.551 | -8,80 | 1.014 | -9,14 | ||||
| 2026-02-13 | 13F | Bridgewater Associates, LP | 5.179 | -57,68 | 696 | -57,85 | ||||
| 2026-02-13 | 13F | Squarepoint Ops LLC | 123.001 | 129,52 | 16.520 | 128,71 | ||||
| 2026-02-17 | 13F | Jump Financial, LLC | 1.700 | 13,86 | 228 | 13,43 | ||||
| 2025-11-14 | 13F | Centiva Capital, LP | 0 | -100,00 | 0 | |||||
| 2026-01-12 | 13F | Rialto Wealth Management, LLC | 2 | 0,00 | 0 | |||||
| 2026-02-10 | 13F | Envestnet Asset Management Inc | 278.146 | 3,19 | 37.358 | 2,82 | ||||
| 2025-11-13 | 13F | Bokf, Na | 0 | -100,00 | 0 | |||||
| 2026-01-27 | 13F | Tokio Marine Asset Management Co Ltd | 2.220 | 0,00 | 298 | -0,33 | ||||
| 2026-02-13 | 13F | Transamerica Financial Advisors, Inc. | 59 | 8 | ||||||
| 2026-02-17 | 13F | Susquehanna International Group, Llp | 0 | -100,00 | 0 | |||||
| 2026-02-17 | 13F | Susquehanna International Group, Llp | Call | 0 | -100,00 | 0 | ||||
| 2025-11-13 | 13F | C M Bidwell & Associates Ltd | 0 | -100,00 | 0 | |||||
| 2026-02-17 | 13F | Private Advisor Group, LLC | 0 | -100,00 | 0 | |||||
| 2026-02-11 | 13F | Parallel Advisors, LLC | 241 | 81,20 | 32 | 88,24 | ||||
| 2025-11-13 | 13F | Mackenzie Financial Corp | 0 | -100,00 | 0 | |||||
| 2026-02-11 | 13F | SOUTH STATE Corp | 0 | -100,00 | 0 | |||||
| 2026-02-10 | 13F | Bnp Paribas Arbitrage, Sa | 134.323 | 170,41 | 18.041 | 169,45 | ||||
| 2026-02-12 | 13F | Geneva Capital Management Llc | 0 | -100,00 | 0 | |||||
| 2026-04-15 | 13F | Merit Financial Group, LLC | 0 | -100,00 | 0 | |||||
| 2026-01-15 | 13F | Nisa Investment Advisors, Llc | 558 | -3,63 | 75 | -3,85 | ||||
| 2026-02-09 | 13F | Keating Financial Advisory Services, Inc. | 95 | 13 | ||||||
| 2026-01-30 | 13F | State of New Jersey Common Pension Fund D | 17.223 | 21,34 | 2.313 | 20,91 | ||||
| 2026-02-11 | 13F | Zions Bancorporation, National Association /ut/ | 16 | 2 | ||||||
| 2026-02-17 | 13F | Susquehanna Fundamental Investments, Llc | 54.541 | 7.325 | ||||||
| 2026-01-05 | 13F | Argent Capital Management Llc | 35.891 | -2,93 | 4.821 | -3,27 | ||||
| 2026-02-12 | 13F | Colonial Trust Co / SC | 20 | 0,00 | 3 | 0,00 | ||||
| 2025-11-14 | 13F | Point72 (DIFC) Ltd | 1.055 | -9,05 | 142 | -13,41 | ||||
| 2026-01-21 | 13F | Portside Wealth Group, LLC | 2.398 | -4,80 | 322 | -5,01 | ||||
| 2026-02-10 | 13F | Quantbot Technologies LP | 0 | -100,00 | 0 | |||||
| 2026-02-17 | 13F | Tudor Investment Corp Et Al | 247.137 | 33.193 | ||||||
| 2026-02-17 | 13F | Keebeck Wealth Management, LLC | 10.020 | -17,97 | 1.351 | -18,27 | ||||
| 2026-02-18 | 13F | Sierra Capital LLC | 12.917 | 0,00 | 2 | 0,00 | ||||
| 2026-04-20 | 13F | Louisiana State Employees Retirement System | 11.800 | 4,42 | 1.173 | -22,74 | ||||
| 2026-01-15 | 13F | Allspring Global Investments Holdings, LLC | 44.501 | 1,98 | 6.082 | 8,20 | ||||
| 2026-02-12 | 13F | Federated Hermes, Inc. | 737.904 | -12,76 | 99.108 | -13,07 | ||||
| 2026-02-14 | 13F | Rockefeller Capital Management L.P. | 2.368 | 152,18 | 318 | 152,38 | ||||
| 2026-02-12 | 13F | California Public Employees Retirement System | 66.315 | 16,89 | 8.907 | 16,46 | ||||
| 2026-01-29 | 13F | Sanctuary Advisors, LLC | 19.091 | 10,50 | 2.564 | 10,14 | ||||
| 2026-02-12 | 13F | CIBC Private Wealth Group, LLC | 147 | 79,27 | 20 | 72,73 | ||||
| 2026-02-12 | 13F | Alps Advisors Inc | 15.208 | 11,71 | 2.043 | 11,28 | ||||
| 2026-01-09 | 13F | Marshall Financial Group LLC | 0 | -100,00 | 0 | -100,00 | ||||
| 2026-02-03 | 13F | NewEdge Wealth, LLC | 16.539 | -9,41 | 2.221 | -1,86 | ||||
| 2026-02-06 | 13F | Larson Financial Group LLC | 29 | 0,00 | 4 | 0,00 | ||||
| 2026-02-13 | 13F | Kayne Anderson Rudnick Investment Management Llc | 2.727.874 | -4,13 | 366.381 | -4,47 | ||||
| 2026-02-11 | 13F | O'shaughnessy Asset Management, Llc | 1.941 | -42,84 | 261 | -43,11 | ||||
| 2026-02-12 | 13F | Dimensional Fund Advisors Lp | 666.464 | 0,21 | 89.515 | -0,15 | ||||
| 2026-02-17 | 13F | Alliancebernstein L.p. | 44.829 | -6,22 | 6.021 | -6,57 | ||||
| 2026-02-06 | 13F | Tortoise Investment Management, LLC | 0 | -100,00 | 0 | |||||
| 2026-02-17 | 13F | Delaware Management Holdings, Inc. | 460.346 | 61.829 | ||||||
| 2026-02-17 | 13F | Quantinno Capital Management LP | 16.758 | 126,55 | 2.251 | 125,68 | ||||
| 2026-02-05 | 13F | Allworth Financial LP | 171 | 51,33 | 23 | 46,67 | ||||
| 2026-02-10 | 13F | Mutual Of America Capital Management Llc | 17.016 | -8,93 | 2.285 | -9,25 | ||||
| 2026-04-16 | 13F | Vaughan Nelson Investment Management, L.p. | 0 | -100,00 | 0 | |||||
| 2026-02-10 | 13F | Connor, Clark & Lunn Investment Management Ltd. | 7.759 | 1.042 | ||||||
| 2026-02-04 | 13F | Securian Asset Management, Inc | 2.930 | -3,30 | 394 | -3,68 | ||||
| 2026-01-26 | 13F | Whittier Trust Co Of Nevada Inc | 415 | 27,69 | 61 | 46,34 | ||||
| 2026-02-17 | 13F | Susquehanna Portfolio Strategies, LLC | 0 | -100,00 | 0 | |||||
| 2026-01-20 | 13F | Harbor Capital Advisors, Inc. | 10.457 | 208,10 | 1 | |||||
| 2025-11-12 | 13F | 111 Capital | 0 | -100,00 | 0 | -100,00 | ||||
| 2026-04-15 | 13F | Bayforest Capital Ltd | 143 | 14 | ||||||
| 2026-02-05 | 13F | Td Private Client Wealth Llc | 4.534 | -31,09 | 609 | -31,38 | ||||
| 2026-02-17 | 13F | Two Sigma Advisers, Lp | 13.900 | 1.867 | ||||||
| 2025-11-14 | 13F | SummitTX Capital, L.P. | 0 | -100,00 | 0 | |||||
| 2026-02-11 | 13F | Capital World Investors | 653.718 | 24,59 | 87.801 | 24,15 | ||||
| 2026-02-12 | 13F | Hrt Financial Lp | 16.518 | -68,77 | 2 | -71,43 | ||||
| 2026-02-13 | 13F | Smartleaf Asset Management LLC | 818 | 35,88 | 111 | 33,73 | ||||
| 2026-02-13 | 13F | Charles Schwab Investment Management Inc | 302.022 | 3,99 | 40.565 | 3,62 | ||||
| 2026-02-13 | 13F | Kestra Advisory Services, LLC | 1.199 | 161 | ||||||
| 2026-02-13 | 13F | MAI Capital Management | 41 | -36,92 | 6 | -37,50 | ||||
| 2026-02-10 | 13F | Smith Group Asset Management, LLC | 2.984 | 401 | ||||||
| 2026-02-11 | 13F | Deutsche Bank Ag\ | 3.765 | -20,08 | 506 | -20,35 | ||||
| 2026-02-17 | 13F | Ameriprise Financial Inc | 240.797 | -7,35 | 32.342 | -7,59 | ||||
| 2026-04-24 | 13F | UMA Financial Services, Inc. | 0 | -100,00 | 0 | |||||
| 2026-02-13 | 13F | Centerpoint Advisors, LLC | 163 | 35,83 | 0 | |||||
| 2026-02-17 | 13F | XTX Topco Ltd | 17.126 | 827,23 | 2.300 | 827,42 | ||||
| 2026-02-17 | 13F | Janus Henderson Group Plc | 801.997 | 19,53 | 107.731 | 19,14 | ||||
| 2026-02-17 | 13F | Artisan Partners Limited Partnership | 288.827 | -9,21 | 38.792 | -9,53 | ||||
| 2026-01-23 | 13F | Rsm Us Wealth Management Llc | 1.595 | 217 | ||||||
| 2026-02-11 | 13F | GW&K Investment Management, LLC | 249.673 | 34 | ||||||
| 2026-02-12 | 13F | Fuller & Thaler Asset Management, Inc. | 60.401 | 39,18 | 8.113 | 38,69 | ||||
| 2026-02-17 | 13F | Twinbeech Capital Lp | 0 | -100,00 | 0 | |||||
| 2026-04-07 | 13F | Signaturefd, Llc | 640 | 28,77 | 64 | -4,55 | ||||
| 2025-11-06 | 13F | Illinois Municipal Retirement Fund | 0 | -100,00 | 0 | |||||
| 2026-02-13 | 13F | Verition Fund Management LLC | 0 | -100,00 | 0 | |||||
| 2025-11-14 | 13F | Capitolis Liquid Global Markets LLC | 0 | -100,00 | 0 | |||||
| 2026-02-12 | 13F | Nuveen, LLC | 176.018 | 132,93 | 23.641 | 132,11 | ||||
| 2026-01-28 | 13F | Klp Kapitalforvaltning As | 9.400 | 6,82 | 1.267 | 6,39 | ||||
| 2026-02-17 | 13F | Aster Capital Management (DIFC) Ltd | 190 | -40,44 | 26 | -40,48 | ||||
| 2026-02-10 | 13F | Natixis Advisors, L.p. | 77.226 | 528,98 | 10 | 900,00 | ||||
| 2026-02-11 | 13F | Rise Advisors, LLC | 0 | -100,00 | 0 | -100,00 | ||||
| 2026-02-04 | 13F | Pacer Advisors, Inc. | 0 | -100,00 | 0 | |||||
| 2026-01-23 | 13F | Optima Capital Llc | 4 | 1 | ||||||
| 2026-02-03 | 13F | Sequoia Financial Advisors, LLC | 3.414 | 459 | ||||||
| 2026-02-17 | 13F/A | Laurion Capital Management LP | 3.000 | -5,96 | 403 | -6,29 | ||||
| 2026-01-14 | 13F | Spire Wealth Management | 0 | -100,00 | 0 | |||||
| 2026-01-28 | 13F | Teacher Retirement System Of Texas | 0 | -100,00 | 0 | |||||
| 2026-02-13 | 13F | National Bank Of Canada /fi/ | 5.704 | -73,98 | 765 | -74,14 | ||||
| 2026-02-13 | 13F | Caitong International Asset Management Co., Ltd | 0 | -100,00 | 0 | |||||
| 2026-02-17 | 13F | Engle Capital Management, L.P. | 50.000 | 6.716 | ||||||
| 2026-02-04 | 13F | LRI Investments, LLC | 0 | -100,00 | 0 | |||||
| 2026-02-13 | 13F | Pathstone Holdings, LLC | 19.516 | -4,21 | 2.621 | -4,55 | ||||
| 2026-02-17 | 13F | Balyasny Asset Management Llc | 756.148 | 117,83 | 101.558 | 117,05 | ||||
| 2026-02-10 | 13F | Td Asset Management Inc | 24.400 | -15,82 | 3.277 | -16,10 | ||||
| 2026-01-22 | 13F | Massachusetts Financial Services Co /ma/ | 286.699 | 6.649,03 | 38.507 | 6.631,82 | ||||
| 2026-01-29 | 13F | Dunhill Financial, LLC | 1 | 0 | ||||||
| 2026-02-10 | 13F | Nomura Asset Management Co Ltd | 98 | -96,65 | 13 | -96,70 | ||||
| 2026-02-17 | 13F | Blair William & Co/il | 28.150 | -4,90 | 3.781 | -5,24 | ||||
| 2026-02-02 | 13F | Cornerstone Planning Group LLC | 198 | 0,51 | 29 | 31,82 | ||||
| 2026-02-13 | 13F | Rhumbline Advisers | 105.862 | -0,67 | 14.218 | -1,02 | ||||
| 2026-02-09 | 13F | Huntington National Bank | 522 | -3,69 | 70 | -4,11 | ||||
| 2026-02-17 | 13F | Price T Rowe Associates Inc /md/ | 100.379 | 116,37 | 13 | 116,67 | ||||
| 2025-11-06 | 13F | Whipplewood Advisors, LLC | 0 | -100,00 | 0 | -100,00 | ||||
| 2026-02-12 | 13F | Skopos Labs, Inc. | 3.536 | 486 | ||||||
| 2026-01-27 | 13F | Lecap Asset Management Ltd | 0 | -100,00 | 0 | |||||
| 2026-02-13 | 13F | BNP Paribas Asset Management Holding S.A. | 230.494 | 64,31 | 31 | 66,67 | ||||
| 2026-02-17 | 13F | Schonfeld Strategic Advisors LLC | 2.134 | -59,74 | 287 | -59,94 | ||||
| 2026-04-13 | 13F | IFP Advisors, Inc | 97 | -39,75 | 10 | -57,14 | ||||
| 2026-02-12 | 13F | Voya Investment Management Llc | 3.628 | -8,68 | 487 | -8,97 | ||||
| 2026-02-06 | 13F | HighTower Advisors, LLC | 2.775 | -10,08 | 373 | -10,58 | ||||
| 2026-02-17 | 13F | Voloridge Investment Management, Llc | 300.780 | 27,21 | 40.398 | 26,76 | ||||
| 2026-02-17 | 13F | State Of Wisconsin Investment Board | 2.257 | -40,04 | 303 | -40,24 | ||||
| 2025-11-03 | 13F | Hussman Strategic Advisors, Inc. | 0 | -100,00 | 0 | |||||
| 2026-02-17 | 13F | Dark Forest Capital Management Lp | 16.797 | 272,44 | 2.256 | 271,66 | ||||
| 2026-02-10 | 13F | Intech Investment Management Llc | 35.084 | -39,03 | 4.712 | -39,25 | ||||
| 2026-01-29 | 13F | Cornerstone Investment Partners, LLC | 3.364 | 452 | ||||||
| 2026-02-05 | 13F | Thrivent Financial For Lutherans | 22.210 | 126,31 | 3 | 100,00 | ||||
| 2026-02-17 | 13F | Wellington Management Group Llp | 301.697 | -72,34 | 40.521 | -72,44 | ||||
| 2026-04-20 | 13F | LVW Advisors, LLC | 2.787 | 20,60 | 277 | -10,65 | ||||
| 2026-02-11 | 13F | Clearbridge Investments, LLC | 662.922 | 0,07 | 89.037 | -0,29 | ||||
| 2026-02-17 | 13F | Public Employees Retirement System Of Ohio | 44.563 | -1,23 | 5.985 | -1,58 | ||||
| 2025-11-14 | 13F | WealthTrak Capital Management LLC | 0 | -100,00 | 0 | |||||
| 2026-02-13 | 13F | Dynamic Technology Lab Private Ltd | 2.770 | 372 | ||||||
| 2026-02-11 | 13F | Erste Asset Management GmbH | 8.904 | 1.196 | ||||||
| 2026-02-11 | 13F | Vestcor Inc | 1.043 | 0,00 | 0 | |||||
| 2025-10-27 | 13F | Smith Shellnut Wilson Llc /adv | 0 | -100,00 | 0 | |||||
| 2026-01-28 | 13F | WPG Advisers, LLC | 4 | -91,11 | 1 | -100,00 | ||||
| 2026-02-13 | 13F | Stifel Financial Corp | 77.905 | -12,63 | 10.463 | -12,94 | ||||
| 2026-02-10 | 13F/A | Northwestern Mutual Wealth Management Co | 120 | 29,03 | 16 | 33,33 | ||||
| 2026-02-05 | 13F | Requisite Capital Management, LLC | 0 | -100,00 | 0 | |||||
| 2026-02-13 | 13F | Ubs Asset Management Americas Inc | 83.315 | -8,57 | 11.190 | -8,89 | ||||
| 2026-02-17 | 13F | Bamco Inc /ny/ | 2.113 | 284 | ||||||
| 2026-02-17 | 13F | Select Equity Group, L.P. | 219.322 | 29.457 | ||||||
| 2026-02-09 | 13F | Legal & General Group Plc | 82.772 | -9,09 | 11.117 | -9,41 | ||||
| 2026-02-10 | 13F | Marshall & Sterling Wealth Advisors Inc. | 0 | -100,00 | 0 | -100,00 | ||||
| 2026-02-13 | 13F | Prudential Financial Inc | 3.170 | -1,86 | 431 | -1,15 | ||||
| 2026-02-17 | 13F | Canada Pension Plan Investment Board | 93.700 | 62,11 | 12.585 | 61,54 | ||||
| 2026-02-23 | 13F | Virtu Financial LLC | 0 | -100,00 | 0 | |||||
| 2025-11-14 | 13F | Cubist Systematic Strategies, LLC | 83.678 | 11.279 | ||||||
| 2026-02-12 | 13F | Bank Of Montreal /can/ | 4.027 | -48,36 | 541 | -48,62 | ||||
| 2026-02-13 | 13F | Hudson Bay Capital Management LP | 3.790 | 509 | ||||||
| 2026-02-03 | 13F | SBI Securities Co., Ltd. | 5 | 0,00 | 1 | |||||
| 2026-02-12 | 13F | Federation des caisses Desjardins du Quebec | 3.211 | 24,17 | 431 | 23,85 | ||||
| 2026-02-18 | 13F | Caitlin John, LLC | 2.618 | -69,84 | 352 | -69,97 | ||||
| 2026-02-17 | 13F | North Capital, Inc. | 0 | -100,00 | 0 | |||||
| 2026-02-13 | 13F | Bullseye Asset Management LLC | 54.028 | 0,00 | 7 | 0,00 | ||||
| 2026-02-12 | 13F | Davy Global Fund Management Ltd | 0 | -100,00 | 0 | -100,00 | ||||
| 2026-02-05 | 13F | Bessemer Group Inc | 198.020 | -2,45 | 27 | -3,70 | ||||
| 2026-02-12 | 13F | Quadrant Capital Group Llc | 870 | 52,36 | 117 | 52,63 | ||||
| 2026-04-15 | 13F | Norden Group Llc | 2.443 | -3,06 | 243 | -28,40 | ||||
| 2025-11-14 | 13F | Texas Permanent School Fund | 0 | -100,00 | 0 | |||||
| 2026-02-13 | 13F | Natixis | 0 | -100,00 | 0 | |||||
| 2026-02-12 | 13F | Swiss National Bank | 82.200 | 7,87 | 11.040 | 7,50 | ||||
| 2026-01-29 | 13F | Comerica Bank | 19.055 | 2,33 | 2.559 | 1,99 | ||||
| 2026-04-21 | 13F | PharVision Advisers, LLC | 0 | -100,00 | 0 | |||||
| 2026-01-08 | 13F | True Wealth Design, LLC | 0 | -100,00 | 0 | |||||
| 2026-02-04 | 13F | Oregon Public Employees Retirement Fund | 8.124 | -0,55 | 1.091 | -0,91 | ||||
| 2026-01-23 | 13F | Diversify Advisory Services, LLC | 8.532 | 17,12 | 1.304 | 55,68 | ||||
| 2026-02-13 | 13F | Mml Investors Services, Llc | 5.497 | 9,57 | 738 | 9,17 | ||||
| 2026-02-17 | 13F | Df Dent & Co Inc | 0 | -100,00 | 0 | |||||
| 2026-02-13 | 13F | Victory Capital Management Inc | 9.336 | 12,84 | 1.254 | 12,38 | ||||
| 2026-02-13 | 13F | Van Eck Associates Corp | 73.137 | 8,44 | 10 | 0,00 | ||||
| 2026-01-29 | 13F | Vanguard Group Inc | 3.696.904 | -0,57 | 496.531 | -0,93 | ||||
| 2026-04-07 | 13F | Retirement Wealth Solutions LLC | 61 | -54,14 | 6 | -64,71 | ||||
| 2026-02-17 | 13F | Capital Fund Management S.a. | 43.857 | 166,28 | 5.890 | 165,43 |
Other Listings
| DE:1M0 | 86,50 € |