Grundlæggende statistik
| Institutionelle ejere | 230 total, 230 long only, 0 short only, 0 long/short - change of 13,24% MRQ |
| Gennemsnitlig porteføljeallokering | 0.5819 % - change of 5,79% MRQ |
| Institutionelle aktier (lange) | 118.894.312 (ex 13D/G) - change of 8,60MM shares 7,80% MRQ |
| Institutionel værdi (lang) | $ 3.099.549 USD ($1000) |
Institutionelt ejerskab og aktionærer
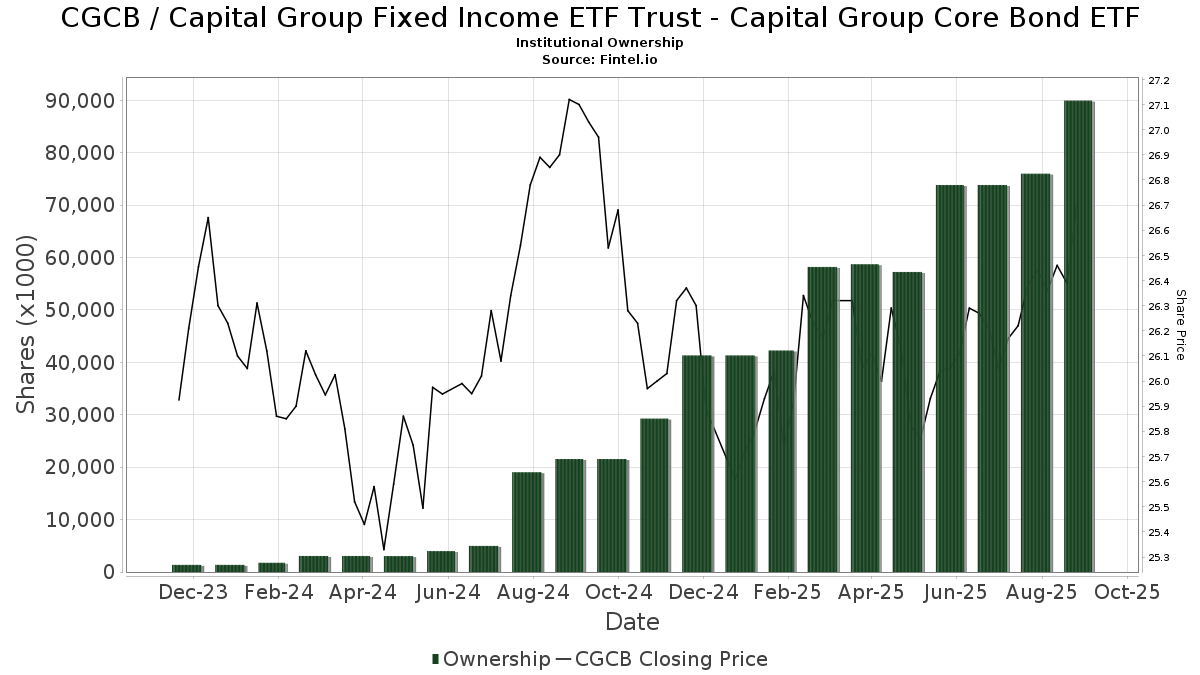
Capital Group Fixed Income ETF Trust - Capital Group Core Bond ETF (US:CGCB) har 230 institutionelle ejere og aktionærer, der har indsendt 13D/G- eller 13F-formularer til Securities Exchange Commission (SEC). Disse institutioner har i alt 118,894,312 aktier. Største aktionærer omfatter Capital International Investors, LPL Financial LLC, Morgan Stanley, Envestnet Asset Management Inc, Northwestern Mutual Wealth Management Co, Cetera Investment Advisers, Raymond James Financial Inc, Wells Fargo & Company/mn, Bank Of America Corp /de/, and Advisor Group Holdings, Inc. .
Capital Group Fixed Income ETF Trust - Capital Group Core Bond ETF (ARCA:CGCB) institutionel ejerskabsstruktur viser aktuelle positioner i virksomheden efter institutioner og fonde, samt seneste ændringer i positionsstørrelse. Større aktionærer kan omfatte individuelle investorer, investeringsforeninger, hedgefonde eller institutioner. Skema 13D angiver, at investoren besidder (eller besidder) mere end 5 % af virksomheden og har til hensigt (eller har til hensigt at) aktivt at forfølge en ændring i forretningsstrategi. Skema 13G indikerer en passiv investering på over 5%.
The share price as of March 13, 2026 is 26,34 / share. Previously, on March 17, 2025, the share price was 26,21 / share. This represents an increase of 0,50% over that period.
Fondens stemningsscore
Fund Sentiment Score (fka Ownership Accumulation Score) finder de aktier, der bliver mest købt af fonde. Det er resultatet af en sofistikeret, multi-faktor kvantitativ model, der identificerer virksomheder med de højeste niveauer af institutionel akkumulering. Scoringsmodellen bruger en kombination af den samlede stigning i oplyste ejere, ændringerne i porteføljeallokeringer i disse ejere og andre målinger. Tallet går fra 0 til 100, hvor højere tal indikerer et højere niveau af akkumulering for sine jævnaldrende, og 50 er gennemsnittet.
Opdateringsfrekvens: Dagligt
Se Ownership Explorer, som giver en liste over højest rangerende virksomheder.
AI+ Ask Fintel’s AI assistant about Capital Group Fixed Income ETF Trust - Capital Group Core Bond ETF.
Select a question to share a public post with an AI-crafted answer.
Thinking of good questions…
Institutionel Put/Call-forhold
Ud over at indberette standardaktie- og gældsudstedelser skal institutter med mere end 100 mill. aktiver under forvaltning også oplyse deres put- og call-optionsbeholdninger. Da salgsoptioner generelt indikerer negativ stemning, og købsoptioner indikerer positiv stemning, kan vi få en fornemmelse af den overordnede institutionelle stemning ved at plotte forholdet mellem put og kald. Diagrammet til højre viser det historiske put/call-forhold for dette instrument.
Brug af Put/Call Ratio som en indikator for investorernes stemning overvinder en af de vigtigste mangler ved at bruge totalt institutionelt ejerskab, som er, at en betydelig mængde af aktiver under forvaltning investeres passivt for at spore indekser. Passivt forvaltede fonde køber typisk ikke optioner, så indikatoren for put/call-forholdet følger mere nøje følelsen af aktivt forvaltede fonde.
13F og NPORT arkivering
Detaljer om 13F-arkivering er gratis. Detaljer om NP-ansøgninger kræver et premium-medlemskab. Grønne rækker angiver nye positioner. Røde rækker angiver lukkede positioner. Klik på linket ikon for at se den fulde transaktionshistorik.
Opgrader
for at låse premium-data op og eksportere til Excel ![]() .
.
| Fil dato | Kilde | Investor | Type | Gennemsnitlig pris (Øst) |
Aktier | Δ Aktier (%) |
Rapporteret Værdi ($1000) |
Δ Værdi (%) |
Port Alloc (%) |
|
|---|---|---|---|---|---|---|---|---|---|---|
| 2026-02-10 | 13F | Marshall & Sterling Wealth Advisors Inc. | 0 | -100,00 | 0 | |||||
| 2026-02-13 | 13F | Kestra Advisory Services, LLC | 0 | -100,00 | 0 | |||||
| 2026-01-26 | 13F | Valmark Advisers, Inc. | 1.127.960 | 22,17 | 29.914 | 21,89 | ||||
| 2026-01-29 | 13F | Aprio Wealth Management, LLC | 969.678 | 25.716 | ||||||
| 2026-02-13 | 13F | SRS Capital Advisors, Inc. | 365 | -96,59 | 10 | -96,60 | ||||
| 2026-01-12 | 13F | Spinnaker Investment Group, LLC | 998.951 | 4,77 | 26.492 | 4,53 | ||||
| 2026-02-02 | 13F | Eq Wealth Advisors, Llc | 24.439 | 10,08 | 648 | 9,83 | ||||
| 2026-02-13 | 13F | Integrated Wealth Concepts LLC | 104.355 | 39,52 | 2.767 | 39,19 | ||||
| 2026-02-10 | 13F | Rothschild Investment Llc | 107.747 | 0,28 | 2.857 | 0,07 | ||||
| 2026-02-02 | 13F | Benjamin Edwards Inc | 189.658 | 50,95 | 5.030 | 50,61 | ||||
| 2026-01-26 | 13F | Heritage Wealth Management, Inc. | 71.682 | 500,55 | 1.901 | 499,37 | ||||
| 2026-01-28 | 13F | Dentgroup LLC | 158.371 | -5,08 | 4.200 | -5,30 | ||||
| 2026-01-07 | 13F | Panoramic Capital Partners, LLC | 751.213 | 18,12 | 19.922 | 17,85 | ||||
| 2026-01-13 | 13F | Regatta Capital Group, Llc | 79.124 | -89,53 | 2.098 | -89,55 | ||||
| 2026-01-23 | 13F | Assetmark, Inc | 66.784 | 85,87 | 1.771 | 85,45 | ||||
| 2026-02-06 | 13F | Mach-1 Financial Group, Inc. | 0 | -100,00 | 0 | |||||
| 2026-01-30 | 13F | Boyer Financial Services, Inc. | 188.231 | 4.984 | ||||||
| 2026-02-05 | 13F | TrueWealth Financial Partners | 82.263 | 2.182 | ||||||
| 2026-02-13 | 13F | Resources Investment Advisors, LLC. | 35.850 | 2,31 | 951 | 2,04 | ||||
| 2026-01-20 | 13F | AdvisorNet Financial, Inc | 63.479 | 153,69 | 1.683 | 153,08 | ||||
| 2026-02-12 | 13F | Steward Partners Investment Advisory, Llc | 512.122 | 6,35 | 13.581 | 6,11 | ||||
| 2026-02-17 | 13F | VestGen Advisors, LLC | 53.036 | -72,02 | 1.407 | -72,09 | ||||
| 2026-01-12 | 13F | Bill Few Associates, Inc. | 47.671 | 0,00 | 1.264 | -0,24 | ||||
| 2026-02-09 | 13F | Kingsview Wealth Management, LLC | 294.911 | 10,21 | 7.821 | 9,97 | ||||
| 2026-01-27 | 13F | Richards, Merrill & Peterson, Inc. | 85.903 | 16,21 | 2.278 | 15,99 | ||||
| 2026-02-11 | 13F | LPL Financial LLC | 22.259.688 | 30,45 | 590.327 | 30,15 | ||||
| 2026-02-13 | 13F | Advyzon Investment Management, LLC | 10.081 | 267 | ||||||
| 2026-01-20 | 13F | Sovran Advisors, LLC | 367.885 | 12,42 | 9.782 | 11,85 | ||||
| 2026-01-29 | 13F | Quadcap Wealth Management, LLC | 796.801 | 21.121 | ||||||
| 2026-02-06 | 13F | Cullen/frost Bankers, Inc. | 150.009 | 42,20 | 3.978 | 41,92 | ||||
| 2026-02-17 | 13F | Advisory Services Network, LLC | 9.711 | 0,00 | 258 | -0,39 | ||||
| 2026-02-17 | 13F | WFA of San Diego, LLC | 0 | -100,00 | 0 | |||||
| 2026-01-28 | 13F | Barrett & Company, Inc. | 3.050 | 0,00 | 81 | -1,23 | ||||
| 2026-02-06 | 13F | Envestnet Portfolio Solutions, Inc. | 130.989 | 20,02 | 3.474 | 19,76 | ||||
| 2026-02-13 | 13F | Smartleaf Asset Management LLC | 324.724 | -7,13 | 8.628 | -7,10 | ||||
| 2026-01-27 | 13F | PFG Advisors | 23.617 | 11,46 | 626 | 11,19 | ||||
| 2026-02-05 | 13F | Compton Financial Group, LLC | 11.904 | 316 | ||||||
| 2026-02-17 | 13F | Wiley Bros.-aintree Capital, Llc | 631.505 | 70,94 | 16.750 | 69,81 | ||||
| 2026-02-17 | 13F | Summit Global Investments | 13.568 | 8,65 | 0 | |||||
| 2026-01-21 | 13F | Capital Investment Advisory Services, LLC | 0 | -100,00 | 0 | |||||
| 2026-01-27 | 13F | Cannon Wealth Management Services, LLC | 252.216 | 12,40 | 6.689 | 12,14 | ||||
| 2026-01-15 | 13F | Saxony Capital Management, LLC | 121.302 | 49,61 | 3.217 | 49,23 | ||||
| 2026-01-30 | 13F | Sigma Planning Corp | 26.063 | 2,22 | 691 | 2,07 | ||||
| 2026-02-12 | 13F | Renaissance Technologies Llc | 0 | -100,00 | 0 | |||||
| 2026-02-17 | 13F | Citadel Advisors Llc | 124.474 | -37,67 | 3.301 | -37,81 | ||||
| 2026-02-13 | 13F | Sei Investments Co | 1.872.505 | 60,13 | 49.659 | 59,76 | ||||
| 2026-03-02 | 13F | Clearwave Capital, LLC | 22.643 | 600 | ||||||
| 2026-02-13 | 13F | Aptus Capital Advisors, LLC | 2.000 | 0,00 | 53 | 0,00 | ||||
| 2026-01-27 | 13F | Keystone Financial Services, LLC | 174.665 | 2,44 | 4.632 | 2,23 | ||||
| 2026-02-11 | 13F | Capital Group Private Client Services, Inc. | 34.905 | 88,02 | 926 | 87,63 | ||||
| 2026-02-18 | 13F | Vermillion & White Wealth Management Group, LLC | 4.063 | 4,77 | 108 | 3,88 | ||||
| 2026-01-07 | 13F | Sagespring Wealth Partners, Llc | 16.564 | 9,78 | 439 | 9,48 | ||||
| 2026-02-05 | 13F | Cambridge Investment Research Advisors, Inc. | 1.423.012 | 12,87 | 38 | 12,12 | ||||
| 2026-01-16 | 13F | Balboa Wealth Partners | 13.249 | 30,85 | 351 | 30,48 | ||||
| 2026-01-22 | 13F | Fiduciary Alliance LLC | 129.814 | 4,81 | 3.443 | 4,59 | ||||
| 2026-02-06 | 13F | Orca Wealth Management, LLC | 9.766 | 0,00 | 258 | -0,39 | ||||
| 2026-02-17 | 13F | IHT Wealth Management, LLC | 12.891 | 46,46 | 342 | 46,35 | ||||
| 2026-02-20 | 13F | Sunbelt Securities, Inc. | 32.781 | 309,81 | 869 | 309,91 | ||||
| 2025-11-12 | 13F | Huntington National Bank | 54 | |||||||
| 2026-02-12 | 13F | Commonwealth Equity Services, Llc | 989.899 | 34,62 | 26.252 | 138.068,42 | ||||
| 2026-02-05 | 13F | AlphaCore Capital LLC | 19.579 | 0,07 | 519 | -0,19 | ||||
| 2026-02-18 | 13F | GWM Advisors LLC | 0 | -100,00 | 0 | |||||
| 2026-01-06 | 13F | Freedom Financial Partners LLC | 252.509 | 2,92 | 6.697 | 2,68 | ||||
| 2026-02-17 | 13F | Captrust Financial Advisors | 748.872 | 6,37 | 19.860 | 6,13 | ||||
| 2026-02-11 | 13F | Endeavor Private Wealth, Inc. | 133.278 | 5,78 | 3.535 | 5,52 | ||||
| 2026-02-05 | 13F | Cornerstone Wealth Management, LLC | 34.552 | 19,34 | 916 | 19,12 | ||||
| 2026-02-05 | 13F | Mission Wealth Management, Lp | 136.954 | 96,00 | 3.632 | 95,58 | ||||
| 2026-02-10 | 13F | Goldman Sachs Group Inc | 17.629 | 468 | ||||||
| 2026-01-26 | 13F | Private Trust Co Na | 12.946 | 144,36 | 343 | 145,00 | ||||
| 2026-01-16 | 13F | Perigon Wealth Management, LLC | 15.242 | 41,76 | 404 | 41,75 | ||||
| 2025-09-26 | 13F | Capital A Wealth Management, LLC | 0 | -100,00 | 0 | |||||
| 2026-02-12 | 13F | Jane Street Group, Llc | 36.202 | 960 | ||||||
| 2026-01-23 | 13F | Sunpointe, LLC | 200.827 | 142,76 | 5.326 | 142,27 | ||||
| 2026-02-06 | 13F | Gutierrez Wealth Advisory, LLC | 19.795 | 1,18 | 525 | 0,77 | ||||
| 2026-02-12 | 13F | Colonial Trust Co / SC | 2.375 | 0,00 | 63 | 0,00 | ||||
| 2026-01-30 | 13F | Exencial Wealth Advisors, Llc | 20.145 | 534 | ||||||
| 2025-11-14 | 13F | Guardian Wealth Advisors, Llc / Nc | 0 | -100,00 | 0 | |||||
| 2026-01-15 | 13F | Lodestone Wealth Management LLC | 90.615 | 2,47 | 2.403 | 2,26 | ||||
| 2026-02-09 | 13F | MSH Capital Advisors LLC | 29.944 | 13,72 | 794 | 13,59 | ||||
| 2026-01-29 | 13F | D.a. Davidson & Co. | 839.077 | 7,17 | 22.252 | 6,93 | ||||
| 2026-02-10 | 13F | Vigil Wealth Management, LLC | 177.325 | 4.703 | ||||||
| 2026-01-29 | 13F | Ashton Thomas Private Wealth, LLC | 9.332 | 0,00 | 247 | -0,40 | ||||
| 2026-02-02 | 13F | Fifth Third Bancorp | 3.678 | 98 | ||||||
| 2026-02-11 | 13F | Gateway Wealth Partners, LLC | 54.328 | 53,79 | 1.441 | 53,52 | ||||
| 2026-02-02 | 13F | Sun Financial Inc | 49.062 | 1.301 | ||||||
| 2026-01-21 | 13F | Hunter Associates Investment Management Llc | 9.130 | 0,00 | 0 | |||||
| 2026-02-12 | 13F | Great Valley Advisor Group, Inc. | 78.608 | -4,40 | 2.085 | -4,62 | ||||
| 2026-02-11 | 13F | Janney Montgomery Scott LLC | 155.925 | 95,31 | 4 | 100,00 | ||||
| 2026-02-13 | 13F | Mml Investors Services, Llc | 1.329.947 | 18,69 | 35.270 | 18,43 | ||||
| 2026-02-13 | 13F | Morgan Stanley | 7.751.877 | 13,18 | 205.580 | 12,93 | ||||
| 2026-01-27 | 13F | Keeler & Nadler Financial Planning & Wealth Management | 31.024 | -43,31 | 823 | -43,47 | ||||
| 2026-02-06 | 13F | Signature Estate & Investment Advisors Llc | 183.483 | 16,99 | 4.866 | 16,72 | ||||
| 2026-02-10 | 13F | Natixis Advisors, L.p. | 30.194 | 81,54 | 1 | |||||
| 2026-02-17 | 13F | Advisor Group Holdings, Inc. | 2.129.348 | 12,84 | 56.475 | 12,87 | ||||
| 2026-01-29 | 13F | Concurrent Investment Advisors, LLC | 354.966 | 102,02 | 9.414 | 101,56 | ||||
| 2026-02-02 | 13F | Truist Financial Corp | 101.488 | 43,84 | 2.691 | 43,52 | ||||
| 2026-01-20 | 13F | Stratos Wealth Partners, LTD. | 167.404 | 10,13 | 4.440 | 9,88 | ||||
| 2026-02-13 | 13F | Flow Traders U.s. Llc | 52.494 | 1 | ||||||
| 2025-10-24 | 13F | Bay Colony Advisory Group, Inc d/b/a Bay Colony Advisors | 0 | -100,00 | 0 | |||||
| 2026-02-17 | 13F | Jones Financial Companies Lllp | 814.776 | 50,29 | 21.608 | 49,94 | ||||
| 2026-02-12 | 13F | Principal Securities, Inc. | 0 | -100,00 | 0 | |||||
| 2026-02-17 | 13F | Snowden Capital Advisors LLC | 11.695 | 0,00 | 310 | 0,00 | ||||
| 2025-11-13 | 13F | M Holdings Securities, Inc. | 0 | -100,00 | 0 | |||||
| 2026-01-26 | 13F | Prosperity Financial Group, Inc. | 42.720 | 1.133 | ||||||
| 2026-02-17 | 13F | Raymond James Financial Inc | 3.002.360 | 35,69 | 79.623 | 35,39 | ||||
| 2026-01-06 | 13F | Advance Capital Management, Inc. | 158.731 | -97,65 | 4.210 | -97,66 | ||||
| 2026-02-17 | 13F | Royal Bank Of Canada | 1.707.253 | 9,26 | 45.276 | 9,01 | ||||
| 2025-11-12 | 13F | Ameriflex Group, Inc. | 0 | -100,00 | 0 | |||||
| 2026-02-12 | 13F | Bank Of Montreal /can/ | 5.300 | 0,00 | 141 | 0,00 | ||||
| 2026-02-17 | 13F | Lantern Wealth Advisors, LLC | 9.807 | 7,72 | 260 | 7,88 | ||||
| 2026-02-09 | 13F | Atlantic Trust, LLC | 0 | -100,00 | 0 | |||||
| 2026-01-16 | 13F | Tempus Wealth Planning, LLC | 26.709 | 6,60 | 708 | 6,47 | ||||
| 2026-02-17 | 13F | Old Mission Capital Llc | 11.578 | -58,85 | 307 | -58,90 | ||||
| 2026-02-06 | 13F | EverSource Wealth Advisors, LLC | 90 | -96,41 | 2 | -96,97 | ||||
| 2026-02-10 | 13F | Clear Point Advisors Inc. | 55.614 | 89,28 | 1.475 | 71,40 | ||||
| 2026-02-13 | 13F | Blueprint Financial Advisors LLC | 44.289 | 31,55 | 1.175 | 31,32 | ||||
| 2026-01-22 | 13F | HHM Wealth Advisors, LLC | 848 | 0,00 | 22 | 0,00 | ||||
| 2026-02-10 | 13F | IFG Advisory, LLC | 60.124 | 1.594 | ||||||
| 2026-02-10 | 13F | Swisher Financial Concepts, Inc. | 7.737 | 0,12 | 205 | 0,00 | ||||
| 2026-02-13 | 13F | Alchemi Wealth, LLC | 28.551 | 757 | ||||||
| 2026-02-06 | 13F | HighTower Advisors, LLC | 121.015 | 163,72 | 3.209 | 163,25 | ||||
| 2026-02-10 | 13F | Sittner & Nelson, Llc | 26.374 | 701 | ||||||
| 2026-01-14 | 13F | Johnson Bixby & Associates, LLC | 2.044.780 | 14.622,30 | 54.228 | 14.595,66 | ||||
| 2026-01-28 | 13F | Rather & Kittrell, Inc. | 9.455 | 0,00 | 251 | -0,40 | ||||
| 2026-01-08 | 13F | Asempa Wealth Advisors | 7.601 | 202 | ||||||
| 2026-02-12 | 13F | Saiph Capital, LLC | 0 | -100,00 | 0 | |||||
| 2026-02-17 | 13F | Ancora Advisors, LLC | 118.842 | -0,64 | 3.152 | -0,88 | ||||
| 2026-02-17 | 13F | Bank Of America Corp /de/ | 2.678.145 | 34,40 | 71.024 | 34,10 | ||||
| 2026-02-09 | 13F | Prospera Financial Services Inc | 45.472 | 8,91 | 1.206 | 8,75 | ||||
| 2026-01-26 | 13F | United Advisor Group, LLC | 95.247 | 3,99 | 2.526 | 3,74 | ||||
| 2026-02-11 | 13F | Capital International Investors | 23.650.039 | 24,42 | 627.199 | 24,14 | ||||
| 2026-02-17 | 13F | Evergreen Wealth Solutions, LLC | 578.823 | 590,13 | 15.350 | 588,65 | ||||
| 2026-02-17 | 13F | Cetera Investment Advisers | 3.341.147 | 17,27 | 88.607 | 17,01 | ||||
| 2026-02-09 | 13F | Rhl Group, Llc | 50 | 1 | ||||||
| 2025-11-14 | 13F | Nbc Securities, Inc. | 0 | -100,00 | 0 | |||||
| 2025-11-14 | 13F | XTX Topco Ltd | 0 | -100,00 | 0 | -100,00 | ||||
| 2026-01-09 | 13F | Dynamic Advisor Solutions LLC | 135.199 | -31,77 | 3.585 | -31,92 | ||||
| 2026-02-02 | 13F | KPP Advisory Services LLC | 86.629 | 16,09 | 2.297 | 15,83 | ||||
| 2026-02-12 | 13F | Rossby Financial, LCC | 287 | 0,00 | 8 | 0,00 | ||||
| 2026-02-19 | 13F | Birchwood Financial Partners, Inc. | 27.527 | 730 | ||||||
| 2026-02-05 | 13F | True Blue Financial, LLC | 82.263 | 2.182 | ||||||
| 2026-02-09 | 13F | Integrity Advisory Solutions, LLC | 7.782 | -1,98 | 206 | -2,37 | ||||
| 2026-01-14 | 13F | Smith Thornton Advisors LLC | 220.793 | 3,22 | 5.855 | 2,99 | ||||
| 2026-02-13 | 13F | Venture Visionary Partners LLC | 77.989 | 203,52 | 2.068 | 203,23 | ||||
| 2026-01-15 | 13F | Hartmann Taylor Wealth Management, LLC | 11.404 | 42,55 | 302 | 42,45 | ||||
| 2026-02-13 | 13F | Mosaic Family Wealth Partners, Llc | 190.429 | 5.050 | ||||||
| 2026-02-12 | 13F | Kovack Advisors, Inc. | 25.845 | 218,13 | 526 | 144,65 | ||||
| 2026-02-02 | 13F | Oppenheimer & Co Inc | 12.245 | 325 | ||||||
| 2026-02-06 | 13F | Creative Financial Designs Inc /adv | 12.806 | 18,28 | 340 | 18,12 | ||||
| 2025-10-28 | 13F | Silverlake Wealth Management Llc | 0 | -100,00 | 0 | |||||
| 2026-02-04 | 13F | Pensionmark Financial Group, Llc | 82.539 | 148,47 | 2.188 | 147,96 | ||||
| 2026-01-28 | 13F | Financial Perspectives, Inc | 21.052 | 52,66 | 558 | 52,46 | ||||
| 2026-02-02 | 13F | CENTRAL TRUST Co | 100 | 3 | ||||||
| 2026-02-09 | 13F | William Mack & Associates, Inc. | 32.139 | 0,77 | 852 | 0,59 | ||||
| 2026-02-10 | 13F | COFG Advisors, LLC | 115.714 | 3.069 | ||||||
| 2026-02-11 | 13F | J.w. Cole Advisors, Inc. | 11.234 | 24,68 | 298 | 24,27 | ||||
| 2026-01-29 | 13F | Comerica Bank | 28.989 | 38,98 | 769 | 38,63 | ||||
| 2026-01-07 | 13F | Harbor Investment Advisory, Llc | 20.399 | 0,00 | 541 | -0,37 | ||||
| 2026-01-09 | 13F | Peterson Wealth Advisors, LLC | 8.131 | -6,82 | 216 | -7,33 | ||||
| 2026-02-09 | 13F | Harbour Investments, Inc. | 219.502 | 133,89 | 5.821 | 133,40 | ||||
| 2026-02-13 | 13F | MAI Capital Management | 659 | 17 | ||||||
| 2026-01-29 | 13F | Kestra Private Wealth Services, Llc | 46.360 | 43,67 | 1.229 | 43,41 | ||||
| 2026-02-05 | 13F | Stephens Inc /ar/ | 692.236 | 18,83 | 18.358 | 18,56 | ||||
| 2026-01-26 | 13F | Cwm, Llc | 2.640 | -20,63 | 0 | |||||
| 2026-02-02 | 13F | Ashton Thomas Securities, Llc | 5.603 | 0,00 | 149 | 0,00 | ||||
| 2025-11-12 | 13F | Creekmur Asset Management LLC | 329.558 | -4,44 | 8.760 | -3,43 | ||||
| 2026-02-14 | 13F | Rockefeller Capital Management L.P. | 208.343 | 31,25 | 5.527 | 30,98 | ||||
| 2026-02-03 | 13F | RFG Advisory, LLC | 276.293 | 9,68 | 7.327 | 9,44 | ||||
| 2026-02-12 | 13F | Timmons Wealth Management, LLC | 199.343 | 5.287 | ||||||
| 2026-01-12 | 13F | Freestate Advisors LLC | 20.282 | 30,98 | 538 | 30,66 | ||||
| 2026-02-10 | 13F | Madison Wealth Partners, Inc | 10.188 | -7,14 | 270 | -7,22 | ||||
| 2026-02-06 | 13F | Keystone Financial Group | 13.301 | 353 | ||||||
| 2026-02-17 | 13F | Capital Planning Advisors, LLC | 64.296 | 1.705 | ||||||
| 2026-01-27 | 13F | Berger Financial Group, Inc | 97.535 | 15,33 | 2.587 | 15,09 | ||||
| 2026-02-02 | 13F | Mutual Advisors, LLC | 106.618 | 1,70 | 2.827 | 0,53 | ||||
| 2025-11-13 | 13F | Herold Advisors, Inc. | 0 | -100,00 | 0 | -100,00 | ||||
| 2026-02-10 | 13F | Vantus Wealth LLC | 10.081 | 267 | ||||||
| 2026-02-10 | 13F | Envestnet Asset Management Inc | 5.425.750 | 24,03 | 143.891 | 23,75 | ||||
| 2026-01-14 | 13F | ORG Partners LLC | 13.220 | 29,23 | 351 | 13,64 | ||||
| 2026-01-22 | 13F | Apollon Wealth Management, LLC | 148.221 | 0,80 | 3.931 | 0,56 | ||||
| 2026-02-13 | 13F | Jacobi Capital Management LLC | 29.075 | 37,59 | 771 | 37,43 | ||||
| 2026-01-26 | 13F | Nations Financial Group Inc, /ia/ /adv | 10.586 | 281 | ||||||
| 2026-01-14 | 13F | AA Financial Advisors, LLC | 56.876 | 41,48 | 1.508 | 41,20 | ||||
| 2026-02-06 | 13F | GPS Wealth Strategies Group, LLC | 0 | -100,00 | 0 | |||||
| 2026-02-02 | 13F | Pines Wealth Management, LLC | 39.085 | 2,32 | 1.037 | 2,07 | ||||
| 2026-02-04 | 13F | Strategic Family Wealth Counselors, L.L.C. | 297.636 | 45,86 | 7.875 | 45,21 | ||||
| 2026-01-28 | 13F | Geneos Wealth Management Inc. | 6.870 | 35,48 | 182 | 35,82 | ||||
| 2026-02-10 | 13F/A | Northwestern Mutual Wealth Management Co | 3.889.956 | 2,60 | 103.162 | 2,37 | ||||
| 2026-02-12 | 13F | Richmond Investment Services, LLC | 60.817 | 58,33 | 1.613 | 58,04 | ||||
| 2026-02-17 | 13F | Equitable Holdings, Inc. | 143.328 | 6,82 | 3.801 | 6,59 | ||||
| 2026-02-13 | 13F | Mariner, LLC | 147.647 | 23,54 | 3.916 | 23,27 | ||||
| 2026-02-11 | 13F | Capital Analysts, Inc. | 9.349 | -5,01 | 0 | |||||
| 2026-02-13 | 13F | Wells Fargo & Company/mn | 2.905.361 | 92,48 | 77.050 | 92,04 | ||||
| 2026-02-04 | 13F | Meridian Wealth Management, LLC | 98.958 | 41,31 | 2.624 | 41,00 | ||||
| 2026-02-06 | 13F | CWS Financial Advisors, LLC | 68.892 | 123,97 | 1.827 | 123,62 | ||||
| 2026-02-13 | 13F | Morgan Dempsey Capital Management Llc | 5.622 | 0,00 | 149 | 0,00 | ||||
| 2026-01-07 | 13F | Cyndeo Wealth Partners, LLC | 0 | -100,00 | 0 | |||||
| 2026-01-23 | 13F | Farther Finance Advisors, LLC | 35.413 | 543,76 | 939 | 543,15 | ||||
| 2026-02-03 | 13F | American Financial Advisors, LLC | 710.970 | -0,42 | 18.855 | -0,65 | ||||
| 2026-02-12 | 13F | Carson Advisory Inc. | 11.655 | 309 | ||||||
| 2026-01-30 | 13F | Strategic Blueprint, LLC | 0 | -100,00 | 0 | |||||
| 2026-02-12 | 13F | Gerber Kawasaki Wealth & Investment Management | 24.561 | 651 | ||||||
| 2026-01-28 | 13F | Confluence Wealth Services, Inc. | 62.433 | 0,00 | 1.656 | -0,24 | ||||
| 2026-02-13 | 13F | Baird Financial Group, Inc. | 77.235 | 1,32 | 2.048 | 1,09 | ||||
| 2026-02-17 | 13F | Ameriprise Financial Inc | 18.017 | 478 | ||||||
| 2026-03-05 | 13F | Gunpowder Capital Management, LLC dba Oliver Wealth Management | 1.636 | 43 | ||||||
| 2026-01-22 | 13F | Trilogy Capital Inc. | 12.660 | 0,29 | 336 | 0,00 | ||||
| 2026-02-04 | 13F | Cannon Financial Strategists, Inc. | 509.554 | 2,56 | 13.513 | 2,33 | ||||
| 2026-02-05 | 13F | Western Wealth Management, LLC | 121.364 | 4,80 | 3.219 | 4,55 | ||||
| 2026-01-20 | 13F | Greenbush Financial Group, LLC | 440.814 | 14,39 | 11.690 | 14,13 | ||||
| 2026-01-27 | 13F | Werba Rubin Papier Wealth Management | 298.429 | 1,57 | 7.914 | 1,34 | ||||
| 2026-02-13 | 13F | Visionary Wealth Advisors | 453.583 | 2,00 | 12.029 | 1,78 | ||||
| 2026-01-23 | 13F | U.S. Capital Wealth Advisors, LLC | 64.349 | 13,92 | 1.707 | 13,66 | ||||
| 2026-01-15 | 13F | Brookstone Capital Management | 9.575 | -26,44 | 254 | -26,67 | ||||
| 2026-01-13 | 13F | LongView Wealth Management | 92.723 | 18,64 | 2.462 | 18,49 | ||||
| 2026-02-13 | 13F | Stifel Financial Corp | 483.497 | 18,75 | 12.822 | 18,48 | ||||
| 2026-02-06 | 13F | Synergy Investment Management, LLC | 66.795 | 35,91 | 1.771 | 35,60 | ||||
| 2026-02-03 | 13F | We Are One Seven, LLC | 9.436 | 250 | ||||||
| 2026-02-10 | 13F | Godfrey Financial Associates, Inc. | 2.745 | 3 | ||||||
| 2026-01-27 | 13F | Security Financial Services, INC. | 13.730 | 11,27 | 364 | 11,31 | ||||
| 2026-01-09 | 13F | Leverty Financial Group, LLC | 1.581.937 | 0,96 | 41.953 | 0,73 | ||||
| 2026-02-10 | 13F | NewCorp Financial Services, Inc. | 21.893 | 581 | ||||||
| 2026-02-12 | 13F | Titleist Asset Management, Llc | 9.130 | 0,85 | 242 | 0,83 | ||||
| 2026-02-04 | 13F | Ameritas Advisory Services, LLC | 30.481 | 2.214,43 | 808 | 2.208,57 | ||||
| 2026-02-12 | 13F | Wood Tarver Financial Group, LLC | 67.548 | -2,35 | 2 | 0,00 | ||||
| 2026-01-21 | 13F | BIP Wealth, LLC | 508.681 | 13.490 | ||||||
| 2026-02-03 | 13F | Koshinski Asset Management, Inc. | 19.203 | 100,26 | 509 | 100,39 | ||||
| 2026-01-20 | 13F | Arvest Investments, Inc. | 976 | 0,00 | 26 | 0,00 | ||||
| 2026-02-04 | 13F | Midwest Heritage Bank, FSB | 10.796 | 286 | ||||||
| 2026-01-13 | 13F | NerdWallet Wealth Partners, LLC | 347.118 | 20,88 | 9.204 | 20,62 | ||||
| 2026-01-22 | 13F | Vicus Capital | 7.868 | 209 | ||||||
| 2026-02-02 | 13F | Holistic Planning, LLC | 214.333 | 248,79 | 5.684 | 248,07 | ||||
| 2026-02-05 | 13F | Cauble & Harre Wealth Management, Inc. | 45.942 | 1.218 | ||||||
| 2026-01-07 | 13F | Private Client Services, Llc | 10.858 | 0,00 | 288 | -0,35 | ||||
| 2026-01-29 | 13F | UBS Group AG | 344.151 | 63,51 | 9.127 | 63,14 | ||||
| 2026-02-12 | 13F | IFC & Insurance Marketing, Inc. | 407 | 0 | ||||||
| 2026-01-26 | 13F | Merit Financial Group, LLC | 2.035.628 | 5,15 | 53.985 | 4,91 | ||||
| 2026-02-11 | 13F | Jpmorgan Chase & Co | 146.111 | -50,38 | 3.875 | -50,50 | ||||
| 2026-01-08 | 13F | Wealth Enhancement Advisory Services, Llc | 607.996 | 24,93 | 16.136 | 24,55 | ||||
| 2026-02-10 | 13F | Continuum Advisory, LLC | 1.026.504 | 12,44 | 27.223 | 12,18 | ||||
| 2026-02-17 | 13F | Perennial Investment Advisors, LLC | 35.257 | 54,55 | 935 | 54,13 | ||||
| 2026-02-12 | 13F | Brinker Capital Investments, LLC | 58.828 | 19,78 | 1.560 | 19,54 | ||||
| 2026-02-06 | 13F | Global Retirement Partners, LLC | 289.676 | 65,23 | 7.682 | 64,89 | ||||
| 2026-02-04 | 13F | Tsfg, Llc | 245.362 | -8,42 | 7 | -14,29 | ||||
| 2026-01-23 | 13F | Diversify Advisory Services, LLC | 48.276 | 1.281 | ||||||
| 2026-01-22 | 13F | Financial Consulate, Inc | 79 | 2 | ||||||
| 2026-01-21 | 13F | Capital Management Associates, Inc | 32.555 | 127,21 | 863 | 127,11 | ||||
| 2026-02-17 | 13F | Blueprint Investment Partners LLC | 44.289 | 31,55 | 1.175 | 31,32 | ||||
| 2026-02-17 | 13F | Private Advisor Group, LLC | 557.996 | 47,64 | 14.798 | 47,32 | ||||
| 2026-02-06 | 13F | IFP Advisors, Inc | 4.834 | 353,47 | 128 | 357,14 | ||||
| 2026-01-14 | 13F | InTrack Investment Management Inc | 111.737 | 34,54 | 2.963 | 34,25 | ||||
| 2026-01-12 | 13F | Aurdan Capital Management, LLC | 32.048 | 2,49 | 850 | 2,17 | ||||
| 2026-01-16 | 13F | Armstrong, Fleming & Moore, Inc | 7.595 | 0,00 | 201 | 0,00 |