Grundlæggende statistik
| Institutionelle aktier (lange) | 316.306.613 - 68,69% (ex 13D/G) - change of -0,89MM shares -0,28% MRQ |
| Institutionel værdi (lang) | $ 10.568.341 USD ($1000) |
Institutionelt ejerskab og aktionærer
Brookfield Infrastructure Partners L.P. - Limited Partnership (US:BIP) har 357 institutionelle ejere og aktionærer, der har indsendt 13D/G- eller 13F-formularer til Securities Exchange Commission (SEC). Disse institutioner har i alt 316,308,572 aktier. Største aktionærer omfatter Royal Bank Of Canada, Principal Financial Group Inc, Capital World Investors, Bank Of Montreal /can/, PMBMX - MidCap Fund (f/k/a MidCap Blend Fund) R-3, AMECX - INCOME FUND OF AMERICA Class A, 1832 Asset Management L.P., CIBC Asset Management Inc, Scotia Capital Inc., and Neuberger Berman Group LLC .
Brookfield Infrastructure Partners L.P. - Limited Partnership (NYSE:BIP) institutionel ejerskabsstruktur viser aktuelle positioner i virksomheden efter institutioner og fonde, samt seneste ændringer i positionsstørrelse. Større aktionærer kan omfatte individuelle investorer, investeringsforeninger, hedgefonde eller institutioner. Skema 13D angiver, at investoren besidder (eller besidder) mere end 5 % af virksomheden og har til hensigt (eller har til hensigt at) aktivt at forfølge en ændring i forretningsstrategi. Skema 13G indikerer en passiv investering på over 5%.
The share price as of March 19, 2026 is 36,41 / share. Previously, on March 20, 2025, the share price was 28,75 / share. This represents an increase of 26,64% over that period.

Fondens stemningsscore
Fund Sentiment Score (fka Ownership Accumulation Score) finder de aktier, der bliver mest købt af fonde. Det er resultatet af en sofistikeret, multi-faktor kvantitativ model, der identificerer virksomheder med de højeste niveauer af institutionel akkumulering. Scoringsmodellen bruger en kombination af den samlede stigning i oplyste ejere, ændringerne i porteføljeallokeringer i disse ejere og andre målinger. Tallet går fra 0 til 100, hvor højere tal indikerer et højere niveau af akkumulering for sine jævnaldrende, og 50 er gennemsnittet.
Opdateringsfrekvens: Dagligt
Se Ownership Explorer, som giver en liste over højest rangerende virksomheder.
AI+ Ask Fintel’s AI assistant about Brookfield Infrastructure Partners L.P. - Limited Partnership.
Select a question to share a public post with an AI-crafted answer.
Thinking of good questions…
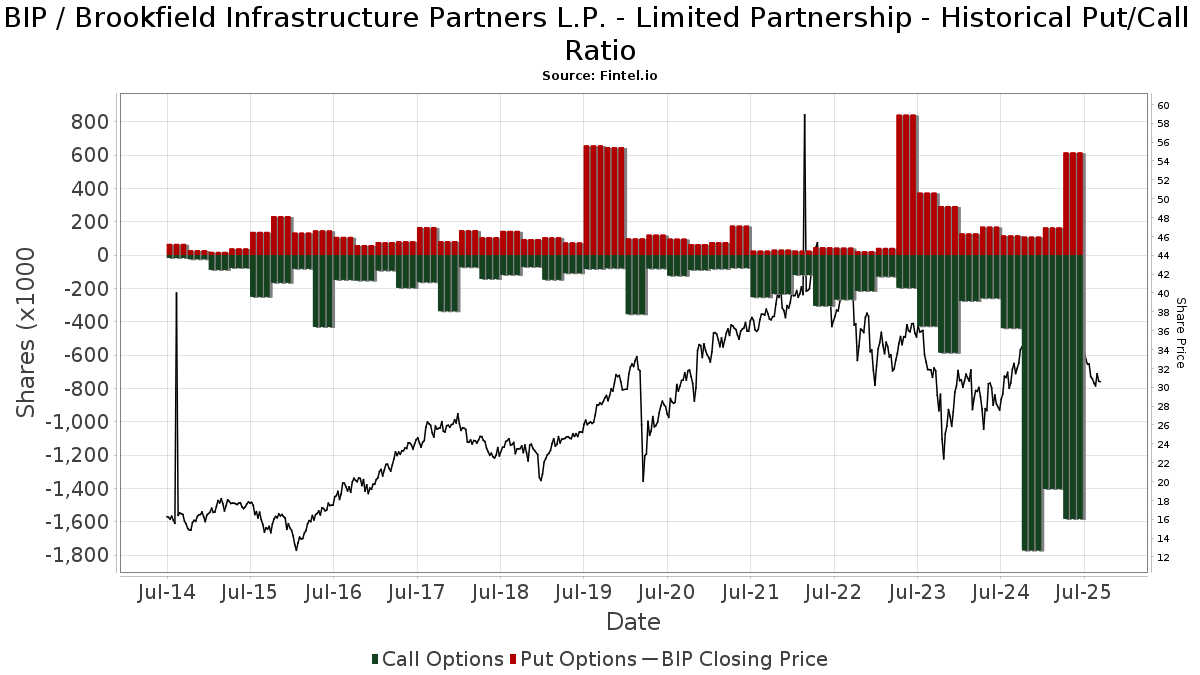
Institutionel Put/Call-forhold
Ud over at indberette standardaktie- og gældsudstedelser skal institutter med mere end 100 mill. aktiver under forvaltning også oplyse deres put- og call-optionsbeholdninger. Da salgsoptioner generelt indikerer negativ stemning, og købsoptioner indikerer positiv stemning, kan vi få en fornemmelse af den overordnede institutionelle stemning ved at plotte forholdet mellem put og kald. Diagrammet til højre viser det historiske put/call-forhold for dette instrument.
Brug af Put/Call Ratio som en indikator for investorernes stemning overvinder en af de vigtigste mangler ved at bruge totalt institutionelt ejerskab, som er, at en betydelig mængde af aktiver under forvaltning investeres passivt for at spore indekser. Passivt forvaltede fonde køber typisk ikke optioner, så indikatoren for put/call-forholdet følger mere nøje følelsen af aktivt forvaltede fonde.
13D/G-arkivering
Vi præsenterer 13D/G ansøgninger separat fra 13F ansøgninger på grund af den forskellige behandling af SEC. 13D/G-ansøgninger kan indgives af grupper af investorer (med én ledende), hvorimod 13F-ansøgninger ikke kan. Dette resulterer i situationer, hvor en investor kan indsende en 13D/G, der rapporterer én værdi for de samlede aktier (der repræsenterer alle de aktier, der ejes af investorgruppen), men derefter indsender en 13F, der rapporterer en anden værdi for de samlede aktier (der udelukkende repræsenterer deres egne) ejendomsret). Det betyder, at aktieejerskab af 13D/G-arkiver og 13F-arkiveringer ofte ikke er direkte sammenlignelige, så vi præsenterer dem separat.
Bemærk: Fra den 16. maj 2021 viser vi ikke længere ejere, der ikke har indsendt en 13D/G inden for det seneste år. Tidligere viste vi den fulde historie af 13D/G-arkiver. Generelt skal enheder, der er forpligtet til at indgive 13D/G-ansøgninger, indgive mindst årligt, før de indsender en afsluttende ansøgning. Dog forlader fonde nogle gange positioner uden at indsende en afsluttende ansøgning (dvs. de afvikler), så visning af den fulde historie resulterede nogle gange i forvirring om det nuværende ejerskab. For at undgå forvirring viser vi nu kun 'aktuelle' ejere - det vil sige - ejere, der har anmeldt inden for det seneste år.
Upgrade to unlock premium data.
| Fil dato | Form | Investor | Forrige Aktier |
Seneste Aktier |
Δ Aktier (Procent) |
Ejendomsret (Procent) |
Δ Ejerskab (Procent) |
|
|---|---|---|---|---|---|---|---|---|
| 2025-11-06 | PRINCIPAL GLOBAL INVESTORS | 26,675,618 | 31,975,602 | 19.87 | 6.90 | 18.97 | ||
| 2025-07-31 | 1832 Asset Management L.P. | 17,141,574 | 15,451,475 | -9.86 | 3.35 | -9.96 |
13F og NPORT arkivering
Detaljer om 13F-arkivering er gratis. Detaljer om NP-ansøgninger kræver et premium-medlemskab. Grønne rækker angiver nye positioner. Røde rækker angiver lukkede positioner. Klik på linket ikon for at se den fulde transaktionshistorik.
Opgrader
for at låse premium-data op og eksportere til Excel ![]() .
.
| Fil dato | Kilde | Investor | Type | Gennemsnitlig pris (Øst) |
Aktier | Δ Aktier (%) |
Rapporteret Værdi ($1000) |
Δ Værdi (%) |
Port Alloc (%) |
|
|---|---|---|---|---|---|---|---|---|---|---|
| 2026-01-23 | 13F | Valley National Advisers Inc | 45 | 0,00 | 0 | |||||
| 2026-02-17 | 13F | Guardian Partners Inc. | 0 | -100,00 | 0 | |||||
| 2026-02-17 | 13F | Private Advisor Group, LLC | 28.648 | 0,49 | 995 | 6,19 | ||||
| 2026-02-03 | 13F | Tranquility Partners, LLC | 83.345 | -0,18 | 2.895 | 5,43 | ||||
| 2026-02-13 | 13F | Virtus ETF Advisers LLC | 5.921 | 85,03 | 206 | 95,24 | ||||
| 2025-09-24 | NP | NLSAX - Neuberger Berman Long Short Fund Class A | 3.074.131 | 0,00 | 95.913 | 3,97 | ||||
| 2026-02-13 | 13F | Vontobel Holding Ltd. | 23.501 | -1,74 | 816 | 3,82 | ||||
| 2026-01-16 | 13F | Louisbourg Investments Inc. | 5.128 | 3,43 | 179 | 9,20 | ||||
| 2026-02-06 | 13F | ProShare Advisors LLC | 26.769 | 5,57 | 930 | 11,52 | ||||
| 2026-02-09 | 13F | Atlantic Trust, LLC | 29.913 | -17,71 | 1.039 | -13,05 | ||||
| 2025-11-14 | 13F | Strategic Wealth Partners, Ltd. | 15.624 | 6,40 | 514 | 4,48 | ||||
| 2026-01-30 | 13F | Urban Wealth Management, LLC | 0 | -100,00 | 0 | -100,00 | ||||
| 2026-01-08 | 13F | Wealth Enhancement Advisory Services, Llc | 25.189 | 2,03 | 867 | 1,52 | ||||
| 2026-02-11 | 13F | O'shaughnessy Asset Management, Llc | 134.382 | -6,34 | 4.671 | -1,16 | ||||
| 2026-02-10 | 13F | State of Wyoming | 9.401 | 66,68 | 327 | 76,22 | ||||
| 2026-02-10 | 13F | Peapack Gladstone Financial Corp | 37.727 | -2,42 | 1 | 0,00 | ||||
| 2025-09-26 | NP | PASIX - PACE Alternative Strategies Investments Class A | 10.870 | 17,90 | 339 | 22,83 | ||||
| 2026-02-17 | 13F | Clear Street Markets Llc | 0 | -100,00 | 0 | -100,00 | ||||
| 2026-01-06 | 13F | Investors Research Corp | 30 | 0,00 | 1 | |||||
| 2026-01-20 | 13F | Stratos Wealth Advisors, LLC | 9.558 | 0,22 | 332 | 6,07 | ||||
| 2026-02-17 | 13F | Ninepoint Partners LP | 85.637 | 2.975 | ||||||
| 2026-02-17 | 13F | United Capital Financial Advisers, Llc | 12.796 | 6,33 | 445 | 12,41 | ||||
| 2026-02-10 | 13F | Cbre Clarion Securities Llc | 417.500 | -44,41 | 14.504 | -41,28 | ||||
| 2026-01-29 | 13F | Verdence Capital Advisors LLC | 7.126 | 0,44 | 248 | 2,07 | ||||
| 2026-02-10 | 13F | Lido Advisors, LLC | 10.262 | 0,20 | 338 | 0,60 | ||||
| 2026-02-11 | 13F | Prestige Wealth Management Group LLC | 355 | 0,00 | 12 | 9,09 | ||||
| 2026-02-13 | 13F | Evelyn Partners Investment Management LLP | 0 | -100,00 | 0 | |||||
| 2026-02-06 | 13F | Callahan Advisors, LLC | 25.376 | 0,00 | 882 | 5,64 | ||||
| 2026-02-06 | 13F | Pathway Financial Advisers, LLC | 36.783 | -0,04 | 1.278 | 5,62 | ||||
| 2026-01-27 | 13F | Belpointe Asset Management LLC | 6.882 | 0,00 | 239 | 5,75 | ||||
| 2026-02-10 | 13F | Acadian Asset Management Llc | 58.564 | 900,41 | 2 | |||||
| 2026-01-09 | 13F | Diversified Trust Co | 0 | -100,00 | 0 | -100,00 | ||||
| 2025-09-26 | NP | PFM - Invesco Dividend Achievers ETF | 13.287 | -0,98 | 415 | 2,99 | ||||
| 2026-02-06 | 13F | IFP Advisors, Inc | 2.880 | 17,50 | 100 | 25,00 | ||||
| 2026-01-16 | 13F | Formidable Asset Management, LLC | 22.633 | -5,71 | 786 | -0,38 | ||||
| 2026-02-17 | 13F | Advisor Group Holdings, Inc. | 57.748 | -2,53 | 2.006 | 6,25 | ||||
| 2026-02-17 | 13F | Wiley Bros.-aintree Capital, Llc | 44.022 | -1,36 | 1.524 | 3,89 | ||||
| 2026-01-14 | 13F | Jfs Wealth Advisors, Llc | 57 | 2 | ||||||
| 2026-02-12 | 13F | Steward Partners Investment Advisory, Llc | 35.358 | 1,83 | 1.228 | 7,62 | ||||
| 2026-02-03 | 13F | Summerhill Capital Management lnc. | 232.424 | -0,45 | 8.075 | 4,95 | ||||
| 2026-02-17 | 13F | Qube Research & Technologies Ltd | 38.600 | -15,35 | 1.342 | -10,72 | ||||
| 2026-02-10 | 13F | Novak & Powell Financial Services, Inc. | 17.450 | -6,06 | 606 | -0,66 | ||||
| 2026-02-17 | 13F | Quantinno Capital Management LP | 10.941 | -4,50 | 380 | 1,06 | ||||
| 2026-02-04 | 13F | First Foundation Advisors | 69.402 | -9,16 | 2.411 | -4,02 | ||||
| 2026-02-11 | 13F | Group One Trading, L.p. | Put | 0 | -100,00 | 0 | -100,00 | |||
| 2026-02-13 | 13F | Aviso Financial Inc. | 0 | -100,00 | 0 | |||||
| 2026-02-17 | 13F | Hancock Whitney Corp | 6.409 | 223 | ||||||
| 2026-01-28 | 13F | Geneos Wealth Management Inc. | 562 | 0,00 | 20 | 5,56 | ||||
| 2026-02-10 | 13F | Bowen Hanes & Co Inc | 742.523 | 0,61 | 26 | -99,90 | ||||
| 2026-02-12 | 13F | Hyperion Capital Advisors LP | 96.019 | 0,00 | 3.336 | 5,60 | ||||
| 2026-02-06 | 13F | Global Retirement Partners, LLC | 20.640 | 939,80 | 717 | 1.003,08 | ||||
| 2026-02-12 | 13F | Bahl & Gaynor Inc | 0 | -100,00 | 0 | |||||
| 2026-02-03 | 13F | Credit Industriel Et Commercial | 187.313 | 7,07 | 6.507 | 13,11 | ||||
| 2026-02-13 | 13F | Manufacturers Life Insurance Company, The | 0 | -100,00 | 0 | |||||
| 2026-01-20 | 13F | American National Bank | 15.075 | 0,00 | 524 | 5,66 | ||||
| 2026-02-17 | 13F | Mercer Global Advisors Inc /adv | 22.827 | 8,28 | 793 | 14,43 | ||||
| 2026-02-12 | 13F | CIBC Private Wealth Group, LLC | 484.294 | -4,83 | 16.824 | 0,53 | ||||
| 2025-09-24 | NP | PMBMX - MidCap Fund (f/k/a MidCap Blend Fund) R-3 | 26.224.270 | 4,65 | 818.197 | 8,80 | ||||
| 2026-02-10 | 13F | Bnp Paribas Arbitrage, Sa | 253.990 | 8,18 | 8.824 | 14,27 | ||||
| 2026-02-04 | 13F | Mascoma Wealth Management LLC | 75 | 0,00 | 3 | 0,00 | ||||
| 2026-02-13 | 13F | Arkadios Wealth Advisors | 12.464 | 0,02 | 433 | 5,62 | ||||
| 2026-01-30 | 13F | Laurel Wealth Advisors LLC | 1.200 | 42 | ||||||
| 2026-02-05 | 13F | Bessemer Group Inc | 34.793 | 1,04 | 1 | 0,00 | ||||
| 2026-02-11 | 13F | Deltroit Asset Management (UK) LLP | 208.290 | 7.236 | ||||||
| 2026-02-17 | 13F | Investment Management Corp of Ontario | 56.530 | 230,58 | 1.964 | 249,29 | ||||
| 2026-02-13 | 13F | Stifel Financial Corp | 16.204 | -3,37 | 563 | 2,00 | ||||
| 2026-02-10 | 13F | One Capital Management, LLC | 8.851 | 307 | ||||||
| 2026-02-11 | 13F | Simplex Trading, Llc | 2.434 | -68,88 | 85 | |||||
| 2026-02-12 | 13F | Commonwealth Equity Services, Llc | 64.472 | 27,52 | 2.240 | 223.800,00 | ||||
| 2026-01-20 | 13F | Stratos Wealth Partners, LTD. | 13.788 | 17,04 | 479 | 23,77 | ||||
| 2026-02-11 | 13F | Simplex Trading, Llc | Call | 1.700 | -75,00 | 59 | ||||
| 2026-02-11 | 13F | Simplex Trading, Llc | Put | 19.900 | -5,69 | 691 | ||||
| 2026-02-17 | 13F | Evercore Wealth Management, LLC | 6.896 | 0,00 | 240 | 5,75 | ||||
| 2025-11-14 | 13F | OMERS ADMINISTRATION Corp | 0 | -100,00 | 0 | |||||
| 2026-02-10 | 13F/A | Guinness Atkinson Asset Management Inc | 320 | 11 | ||||||
| 2026-02-17 | 13F | Captrust Financial Advisors | 71.652 | 1,50 | 2.489 | 7,24 | ||||
| 2026-02-19 | 13F | Birchwood Financial Partners, Inc. | 333 | 12 | ||||||
| 2026-02-17 | 13F | SIG North Trading, ULC | 45.864 | -82,72 | 1.593 | -81,75 | ||||
| 2026-02-10 | 13F | Arcadia Investment Management Corp/mi | 1.875 | 0,00 | 65 | 6,56 | ||||
| 2026-02-17 | 13F | SIG North Trading, ULC | Put | 797.100 | -3,30 | 27.691 | 2,14 | |||
| 2026-02-17 | 13F | Susquehanna Advisors Group, Inc. | 0 | -100,00 | 0 | |||||
| 2026-02-09 | 13F | Harbour Investments, Inc. | 2.661 | 0,42 | 92 | 5,75 | ||||
| 2026-02-17 | 13F | SIG North Trading, ULC | Call | 705.400 | 85,19 | 24.506 | 95,62 | |||
| 2026-01-14 | 13F | Spire Wealth Management | 558 | 1,27 | 19 | 5,56 | ||||
| 2026-02-12 | 13F | Principal Securities, Inc. | 0 | -100,00 | 0 | |||||
| 2026-02-04 | 13F | Atlantic Union Bankshares Corp | 225 | -92,07 | 8 | -92,47 | ||||
| 2026-02-04 | 13F | Pandora Wealth, Inc. | 2.700 | 0,00 | 94 | 5,68 | ||||
| 2026-02-13 | 13F | Avenir Corp | 0 | -100,00 | 0 | |||||
| 2026-02-13 | 13F | Ubs Asset Management Americas Inc | 3.869 | 134 | ||||||
| 2026-02-11 | 13F | Parallel Advisors, LLC | 0 | -100,00 | 0 | |||||
| 2026-01-21 | 13F | Woodmont Investment Counsel Llc | 57.738 | -1,78 | 2.006 | 3,72 | ||||
| 2026-02-09 | 13F | Geode Capital Management, Llc | 20.166 | 305,75 | 962 | 323,79 | ||||
| 2026-01-27 | 13F | Baskin Financial Services Inc. | 320.741 | -1,71 | 11 | 10,00 | ||||
| 2026-02-11 | 13F | Gilpin Wealth Management, Llc | 166 | 6 | ||||||
| 2026-01-12 | 13F | DAVENPORT & Co LLC | 149.416 | -0,02 | 5.197 | 5,44 | ||||
| 2026-02-06 | 13F | GPS Wealth Strategies Group, LLC | 300 | -63,86 | 10 | -62,96 | ||||
| 2026-02-17 | 13F | Susquehanna International Group, Llp | Put | 0 | -100,00 | 0 | ||||
| 2025-10-15 | 13F | Mb, Levis & Associates, Llc | 0 | -100,00 | 0 | |||||
| 2026-02-06 | 13F | Ironwood Investment Counsel, LLC | 6.558 | 1,16 | 228 | 6,57 | ||||
| 2026-02-12 | 13F | BlackRock, Inc. | 2.209 | 1.238,79 | 77 | 1.420,00 | ||||
| 2026-01-21 | 13F | Newbridge Financial Services Group, Inc. | 1.171 | 0,00 | 41 | 5,26 | ||||
| 2026-02-11 | 13F | Capital World Investors | 31.104.057 | 0,28 | 1.081.181 | 5,78 | ||||
| 2026-01-27 | 13F | TD Waterhouse Canada Inc. | 1.665.061 | 6,98 | 57.802 | 11,68 | ||||
| 2026-02-11 | 13F | Tiaa Trust, National Association | 18.552 | 0,00 | 644 | 5,57 | ||||
| 2026-01-20 | 13F | Sanibel Captiva Trust Company, Inc. | 106.424 | 0,00 | 3.697 | 5,63 | ||||
| 2026-02-10 | 13F | Foundations Investment Advisors, LLC | 6.236 | 217 | ||||||
| 2026-02-13 | 13F | Peak6 Llc | Call | 75.000 | 284,62 | 2.606 | 306,40 | |||
| 2026-02-17 | 13F | Blair William & Co/il | 74.118 | 1,96 | 2.575 | 7,70 | ||||
| 2026-02-10 | 13F | Hillsdale Investment Management Inc. | 1.288 | 45 | ||||||
| 2026-02-13 | 13F | Alberta Investment Management Corp | 185.950 | 6.464 | ||||||
| 2026-02-09 | 13F | Avalon Trust Co | 186.980 | 0,00 | 6.496 | 5,63 | ||||
| 2026-02-09 | 13F | Hartland & Co., LLC | 75.678 | -1,81 | 2.629 | 3,75 | ||||
| 2026-02-03 | 13F | Sequoia Financial Advisors, LLC | 493.220 | -2,31 | 17.134 | 3,18 | ||||
| 2026-02-14 | 13F | Rockefeller Capital Management L.P. | 165.425 | 1,08 | 5.747 | 6,76 | ||||
| 2026-01-29 | 13F | Concord Wealth Partners | 1.450 | 50 | ||||||
| 2026-02-17 | 13F | Citadel Advisors Llc | Put | 26.100 | -44,11 | 907 | -40,98 | |||
| 2026-01-28 | 13F | Chicago Partners Investment Group LLC | 492.770 | -3,51 | 17.370 | -1,84 | ||||
| 2026-02-17 | 13F | Citadel Advisors Llc | 113.791 | -60,11 | 3.953 | -57,86 | ||||
| 2026-02-17 | 13F | Citadel Advisors Llc | Call | 52.100 | -6,46 | 1.810 | -1,20 | |||
| 2026-02-13 | 13F | Truvestments Capital Llc | 1.500 | 0,00 | 52 | 6,12 | ||||
| 2026-02-17 | 13F | Ameriprise Financial Inc | 43.540 | -19,17 | 1.513 | -14,62 | ||||
| 2026-02-13 | 13F | National Bank Of Canada /fi/ | Put | 122 | 144,00 | 424 | 158,54 | |||
| 2026-02-13 | 13F | Umb Bank N A/mo | 28.441 | 0,00 | 988 | 5,67 | ||||
| 2025-09-29 | NP | VRAI - Virtus Real Asset Income ETF | 5.274 | -2,71 | 165 | 1,23 | ||||
| 2026-02-13 | 13F | Heritage Wealth Advisors | 950 | 0,00 | 33 | 6,45 | ||||
| 2026-02-06 | 13F | Harbor Advisory Corp /ma/ | 250.071 | -2,62 | 8.687 | 2,85 | ||||
| 2026-02-11 | 13F | Gwn Securities Inc. | 7.053 | 245 | ||||||
| 2026-02-18 | 13F | GWM Advisors LLC | 8.758 | 4,79 | 304 | 10,95 | ||||
| 2026-01-26 | 13F | PFG Investments, LLC | 7.375 | 256 | ||||||
| 2026-02-13 | 13F | Natixis | 376.000 | 359,66 | 13.062 | 385,58 | ||||
| 2026-01-28 | 13F | Financial Perspectives, Inc | 6.154 | 0,00 | 214 | 5,45 | ||||
| 2026-01-06 | 13F | Tucker Asset Management Llc | 0 | -100,00 | 0 | |||||
| 2026-02-17 | 13F | XTX Topco Ltd | 26.833 | -26,23 | 932 | -22,07 | ||||
| 2026-01-09 | 13F | IFS Advisors, LLC | 675 | 0,00 | 23 | 4,55 | ||||
| 2026-02-17 | 13F | Mirabella Financial Services Llp | 50.400 | 1.751 | ||||||
| 2026-02-17 | 13F | First Manhattan Co | 1.878.459 | -1,75 | 65.258 | 3,77 | ||||
| 2026-02-17 | 13F | FIL Ltd | 2.720.906 | -1,87 | 94.579 | 3,51 | ||||
| 2026-01-07 | 13F | Northside Capital Management, LLC | 76.373 | -2,99 | 2.653 | 2,47 | ||||
| 2026-02-02 | 13F | Chapman Financial Group, Llc | 27.407 | -0,32 | 952 | 5,31 | ||||
| 2026-02-13 | 13F | Brookfield Asset Management Inc. | 4.686.497 | 0,00 | 162.809 | 5,62 | ||||
| 2026-02-05 | 13F | Avantax Planning Partners, Inc. | 17.189 | 0,00 | 597 | 5,66 | ||||
| 2026-02-17 | 13F | Cetera Investment Advisers | 63.191 | 6,06 | 2.195 | 12,05 | ||||
| 2026-02-11 | 13F | Cerity Partners LLC | 142.539 | 0,01 | 4.952 | 5,63 | ||||
| 2026-02-19 | 13F | CI Private Wealth, LLC | 26.105 | 2,76 | 907 | 8,50 | ||||
| 2026-02-03 | 13F | K.J. Harrison & Partners Inc | 19.181 | -15,24 | 668 | -11,66 | ||||
| 2026-02-12 | 13F | Scotia Capital Inc. | 7.610.855 | 3,30 | 264.166 | 9,17 | ||||
| 2026-02-17 | 13F | Ancora Advisors, LLC | 625 | 0,00 | 22 | 5,00 | ||||
| 2026-01-12 | 13F | Focus Financial Network, Inc. | 9.340 | 19,13 | 324 | 26,07 | ||||
| 2026-02-13 | 13F | Gen-Wealth Partners Inc | 13.316 | 382,81 | 463 | 413,33 | ||||
| 2026-03-04 | 13F | Rehmann Capital Advisory Group | 6.774 | 0,00 | 235 | 5,86 | ||||
| 2026-01-23 | 13F | Tandem Capital Management Corp /adv | 38.430 | -6,51 | 1.335 | -1,18 | ||||
| 2026-02-03 | 13F | We Are One Seven, LLC | 8.771 | 305 | ||||||
| 2026-02-17 | 13F | Two Sigma Advisers, Lp | 693.300 | 579,04 | 24.085 | 617,24 | ||||
| 2026-02-19 | 13F | Rare Wolf Capital LLC | 9.412 | 327 | ||||||
| 2026-02-17 | 13F | Creegan & Nassoura Financial Group, LLC | 6.860 | 0,00 | 238 | 5,78 | ||||
| 2025-11-14 | 13F | Larson Financial Group LLC | 0 | -100,00 | 0 | |||||
| 2026-02-18 | 13F | Guardian Capital Lp | 611.953 | -3,73 | 21.282 | 1,57 | ||||
| 2026-01-23 | 13F | First PREMIER Bank | 7.582 | 0,00 | 0 | |||||
| 2026-02-13 | 13F | Beutel, Goodman & Co Ltd. | 14.977 | -3,85 | 1 | |||||
| 2026-01-16 | 13F | PFS Partners, LLC | 273 | 1,11 | 9 | 12,50 | ||||
| 2026-01-28 | 13F | Cornerstone Advisory, LLC | 11.291 | 392 | ||||||
| 2026-02-10 | 13F | SCS Capital Management LLC | 16.511 | 0,96 | 574 | 6,70 | ||||
| 2026-01-06 | 13F | Walnut Private Equity Partners, Llc | 102.000 | 0,00 | 3.543 | 5,64 | ||||
| 2026-02-13 | 13F | Public Sector Pension Investment Board | 0 | -100,00 | 0 | |||||
| 2026-02-03 | 13F | Wulff, Hansen & Co. | 51.106 | -1,49 | 1.775 | 4,04 | ||||
| 2026-02-13 | 13F | Quattro Advisors LLC | 185 | 6 | ||||||
| 2025-10-30 | 13F | WFA Asset Management Corp | 1.141 | 0,00 | 40 | 25,81 | ||||
| 2026-02-17 | 13F | Two Sigma Investments, Lp | 1.104.277 | 38,82 | 38.363 | 46,63 | ||||
| 2025-10-31 | 13F | Whittier Trust Co | 0 | -100,00 | 0 | -100,00 | ||||
| 2026-01-28 | 13F | Davis-rea Ltd. | 69.605 | 7,58 | 2.418 | 13,63 | ||||
| 2025-09-26 | NP | PID - Invesco International Dividend Achievers ETF This fund is a listed as child fund of Invesco Ltd. and if that institution has disclosed ownership in this security, then these positions will not be double counted when calculating total shares and total value | 843.572 | 0,54 | 26.319 | 4,52 | ||||
| 2025-11-14 | 13F | Gluskin Sheff & Assoc Inc | 0 | -100,00 | 0 | -100,00 | ||||
| 2026-02-09 | 13F | Guinness Asset Management LTD | 3.357 | 36,91 | 117 | 43,21 | ||||
| 2026-02-13 | 13F | Pathstone Holdings, LLC | 9.996 | 0,00 | 347 | 5,79 | ||||
| 2026-02-17 | 13F | Tower Research Capital LLC (TRC) | 1.412 | 79,19 | 49 | 96,00 | ||||
| 2026-02-13 | 13F | BRITISH COLUMBIA INVESTMENT MANAGEMENT Corp | 2.382.890 | 12,28 | 82.831 | 18,47 | ||||
| 2026-02-17 | 13F | Ewing Morris & Co. Investment Partners Ltd. | 11.626 | 0,48 | 409 | 7,35 | ||||
| 2026-01-15 | 13F | Jamison Private Wealth Management, Inc. | 57.053 | 0,00 | 1.982 | 5,65 | ||||
| 2026-01-16 | 13F | Crewe Advisors LLC | 2.277 | 0,00 | 79 | 6,76 | ||||
| 2026-02-17 | 13F | Cresset Asset Management, LLC | 23.797 | -2,01 | 827 | 3,51 | ||||
| 2026-02-17 | 13F | Advisory Services Network, LLC | 0 | -100,00 | 0 | |||||
| 2026-02-05 | 13F | Cardinal Point Capital Management, ULC | 35.226 | -1,30 | 1.226 | 4,34 | ||||
| 2026-02-09 | 13F | Choate Investment Advisors | 8.325 | -1,77 | 289 | 3,96 | ||||
| 2026-02-12 | 13F | Hrt Financial Lp | 372.860 | 20,97 | 13 | 20,00 | ||||
| 2026-02-12 | 13F | JT Stratford LLC | 34.850 | -52,96 | 1.211 | -50,33 | ||||
| 2026-02-05 | 13F | Intrua Financial, LLC | 6.287 | 218 | ||||||
| 2025-09-26 | NP | GYLD - Arrow Dow Jones Global Yield ETF | 5.326 | 19,10 | 166 | 24,06 | ||||
| 2026-02-03 | 13F | McIlrath & Eck, LLC | 250 | 0,00 | 9 | 0,00 | ||||
| 2026-01-30 | 13F | North Star Investment Management Corp. | 250 | 0,00 | 9 | 0,00 | ||||
| 2026-02-18 | 13F | Beacon Pointe Advisors, LLC | 63.381 | -2,16 | 2.202 | 3,33 | ||||
| 2026-02-06 | 13F | Vestmark Advisory Solutions, Inc. | 47.783 | 1.660 | ||||||
| 2026-02-12 | 13F | Colonial Trust Co / SC | 2.025 | 0,00 | 70 | 6,06 | ||||
| 2026-01-12 | 13F | Gilman Hill Asset Management, LLC | 6.319 | 220 | ||||||
| 2026-02-12 | 13F | Mount Yale Investment Advisors, LLC | 52.140 | 30,66 | 1.811 | 38,03 | ||||
| 2026-02-10 | 13F | PCJ Investment Counsel Ltd. | 183.780 | 8,68 | 6.386 | 14,73 | ||||
| 2026-01-23 | 13F | Smallwood Wealth Investment Management, LLC | 64 | 0,00 | 2 | 0,00 | ||||
| 2026-02-17 | 13F | Cahill Financial Advisors Inc | 73.352 | -2,20 | 2.548 | 3,33 | ||||
| 2025-11-14 | 13F | Two Sigma Securities, Llc | 0 | -100,00 | 0 | -100,00 | ||||
| 2026-01-29 | 13F | Nbc Securities, Inc. | 2.893 | 3,03 | 101 | 8,70 | ||||
| 2026-01-21 | 13F | Flagship Harbor Advisors, Llc | 112 | 4 | ||||||
| 2026-02-19 | 13F | Invesco Ltd. | 2.088.744 | -8,55 | 72.563 | -3,41 | ||||
| 2026-02-02 | 13F | Sawyer & Company, Inc | 3.750 | 0,00 | 130 | |||||
| 2026-02-17 | 13F | Herold Advisors, Inc. | 92.511 | -4,26 | 3.214 | 1,10 | ||||
| 2026-02-17 | 13F/A | Northwest & Ethical Investments L.P. | 131.580 | -5,21 | 4.575 | -0,26 | ||||
| 2026-01-20 | 13F | AdvisorNet Financial, Inc | 2.160 | 0,00 | 75 | 5,63 | ||||
| 2026-02-04 | 13F | Ameritas Advisory Services, LLC | 0 | -100,00 | 0 | |||||
| 2026-01-23 | 13F | Tyche Wealth Partners LLC | 6.756 | 0,00 | 235 | 5,41 | ||||
| 2026-02-13 | 13F | Wells Fargo & Company/mn | 334.208 | -19,45 | 11.610 | -14,91 | ||||
| 2026-02-09 | 13F | Kingsview Wealth Management, LLC | 8.262 | 16,06 | 287 | 22,65 | ||||
| 2026-02-13 | 13F | Mariner, LLC | 53.779 | 51,30 | 1.868 | 59,79 | ||||
| 2025-11-05 | 13F | SOUTH STATE Corp | 0 | -100,00 | 0 | |||||
| 2026-01-23 | 13F | Farther Finance Advisors, LLC | 7.666 | -6,69 | 266 | -1,48 | ||||
| 2026-02-13 | 13F | Brown Advisory Inc | 374.176 | 1,11 | 12.999 | 6,79 | ||||
| 2026-01-28 | 13F | Boston Trust Walden Corp | 6.050 | 210 | ||||||
| 2026-01-23 | 13F | Carnegie Capital Asset Management, LLC | 6.325 | 220 | ||||||
| 2026-02-13 | 13F | SRS Capital Advisors, Inc. | 808 | 0,00 | 28 | 7,69 | ||||
| 2026-02-10 | 13F/A | Northwestern Mutual Wealth Management Co | 2.919 | 0,10 | 101 | 6,32 | ||||
| 2026-02-17 | 13F | Royal Bank Of Canada | Put | 2.912.800 | 106,17 | 101.191 | 117,77 | |||
| 2025-11-25 | 13F | Briaud Financial Planning, Inc | 0 | -100,00 | 0 | |||||
| 2026-02-17 | 13F | North Capital, Inc. | 0 | -100,00 | 0 | |||||
| 2026-01-07 | 13F | Epiq Partners, Llc | 82.998 | -19,74 | 2.883 | -15,23 | ||||
| 2026-01-21 | 13F | SC&H Financial Advisors, Inc. | 8.182 | 0,00 | 284 | 5,58 | ||||
| 2026-01-30 | 13F | Citizens National Bank Trust Department | 10.309 | 0,00 | 358 | 5,60 | ||||
| 2026-02-11 | 13F | Capital Analysts, Inc. | 4.400 | 0,00 | 0 | |||||
| 2026-02-11 | 13F | Strategic Advocates LLC | 700 | 0,00 | 24 | 4,35 | ||||
| 2026-02-17 | 13F | Prosperity Consulting Group, LLC | 19.227 | 0,00 | 668 | 5,54 | ||||
| 2025-10-22 | 13F | Compass Planning Associates Inc | 0 | -100,00 | 0 | |||||
| 2026-02-13 | 13F | Citigroup Inc | 328.429 | 167,50 | 11.410 | 182,54 | ||||
| 2026-01-26 | 13F | Private Trust Co Na | 7.606 | 0,00 | 264 | 5,60 | ||||
| 2026-02-11 | 13F | Westerkirk Capital Inc. | 1.340 | -93,11 | 47 | -92,80 | ||||
| 2026-02-02 | 13F | Qrg Capital Management, Inc. | 9.126 | 317 | ||||||
| 2026-01-29 | 13F | Quent Capital, LLC | 113 | 0,00 | 4 | 0,00 | ||||
| 2025-11-17 | 13F | Silicon Valley Capital Partners | 0 | -100,00 | 0 | -100,00 | ||||
| 2026-02-17 | 13F | Virtus Investment Advisers, Inc. | 4.651 | -15,90 | 162 | -11,05 | ||||
| 2026-01-30 | 13F | Lincluden Management Ltd | 643.160 | 31 | ||||||
| 2026-02-11 | 13F | LPL Financial LLC | 207.294 | 5,58 | 7.201 | 11,52 | ||||
| 2026-01-20 | 13F | Nvwm, Llc | 3.075 | 0,00 | 107 | 4,95 | ||||
| 2026-02-17 | 13F | Royal Bank Of Canada | Call | 2.192.800 | 55,95 | 76.178 | 64,72 | |||
| 2026-02-17 | 13F | Royal Bank Of Canada | 44.647.806 | 3,77 | 1.551.064 | 9,60 | ||||
| 2025-11-07 | 13F | Cidel Asset Management Inc | 0 | -100,00 | 0 | -100,00 | ||||
| 2026-02-13 | 13F | Dixon Mitchell Investment Counsel Inc. | 2.448.770 | -2,10 | 85.231 | 3,36 | ||||
| 2026-01-08 | 13F | Gryphon Financial Partners LLC | 33.900 | 0,00 | 1.178 | 5,66 | ||||
| 2026-02-02 | 13F | Intact Investment Management Inc. | 2.395.384 | 1,26 | 83.261 | 6,80 | ||||
| 2026-02-12 | 13F | Leith Wheeler Investment Counsel Ltd. | 347.863 | -3,38 | 12.085 | 2,04 | ||||
| 2026-02-11 | 13F | Tacita Capital Inc | 143.021 | 0,53 | 4.974 | 6,03 | ||||
| 2025-09-25 | NP | AMECX - INCOME FUND OF AMERICA Class A | 22.376.603 | 0,00 | 695.554 | 3,96 | ||||
| 2026-02-11 | 13F | Jpmorgan Chase & Co | 518.495 | 2,64 | 18.013 | 8,41 | ||||
| 2026-02-17 | 13F | ArrowMark Colorado Holdings LLC | 210.000 | -17,32 | 7.295 | -12,68 | ||||
| 2026-02-11 | 13F | Clearbridge Investments, LLC | 301.968 | 6,56 | 10.490 | 12,55 | ||||
| 2026-01-29 | 13F | Huntleigh Advisors, Inc. | 11.022 | 0,44 | 383 | 6,11 | ||||
| 2025-11-12 | 13F | Creekmur Asset Management LLC | 20.639 | -31,79 | 679 | -33,07 | ||||
| 2026-02-13 | 13F | K2 Principal Fund, L.p. | 124.900 | 4.339 | ||||||
| 2025-11-14 | 13F | First Western Trust Bank | 0 | -100,00 | 0 | |||||
| 2026-02-12 | 13F | Bank Of Nova Scotia Trust Co | 75.366 | 53,50 | 2.618 | 62,21 | ||||
| 2026-02-17 | 13F | Russell Investments Group, Ltd. | 90.716 | 72,92 | 3.157 | 82,59 | ||||
| 2026-02-26 | 13F | Anchor Investment Management, LLC | 4.725 | 0,00 | 164 | 5,81 | ||||
| 2026-02-05 | 13F | Cambridge Investment Research Advisors, Inc. | 15.004 | -70,31 | 1 | -100,00 | ||||
| 2026-02-05 | 13F | Allworth Financial LP | 7.653 | 8,51 | 266 | 14,72 | ||||
| 2026-01-30 | 13F | Sigma Planning Corp | 9.250 | 0,63 | 321 | 6,29 | ||||
| 2026-01-23 | 13F | Assetmark, Inc | 1.256 | 544,10 | 44 | 616,67 | ||||
| 2025-11-12 | 13F | Forge First Asset Management Inc. | 0 | -100,00 | 0 | |||||
| 2026-02-13 | 13F | Neuberger Berman Group LLC | 7.303.348 | 2,00 | 253.719 | 7,74 | ||||
| 2026-02-11 | 13F | Group One Trading, L.p. | Call | 800 | -85,45 | 28 | -85,00 | |||
| 2025-11-14 | 13F | Cubist Systematic Strategies, LLC | 0 | -100,00 | 0 | -100,00 | ||||
| 2026-01-29 | 13F | Montrusco Bolton Investments Inc. | 0 | -100,00 | 0 | |||||
| 2026-02-10 | 13F | Connor, Clark & Lunn Investment Management Ltd. | 3.937.332 | 97,88 | 136.865 | 108,79 | ||||
| 2025-11-14 | 13F | Verity Asset Management, Inc. | 0 | -100,00 | 0 | |||||
| 2025-11-12 | 13F | CIBC Bancorp USA Inc. | 511.931 | 16.917 | ||||||
| 2026-02-09 | 13F | Buckhead Capital Management Llc | 10.867 | -0,78 | 378 | 4,72 | ||||
| 2026-01-22 | 13F | CCLA Investment Management Ltd | 4.710.064 | 5,70 | 164 | 11,64 | ||||
| 2025-09-29 | NP | AWYIX - CIBC ATLAS EQUITY INCOME FUND Institutional Class Shares | 109.577 | 0,00 | 3.419 | 3,95 | ||||
| 2026-02-09 | 13F | Hantz Financial Services, Inc. | 760 | 3,12 | 0 | |||||
| 2026-02-17 | 13F | SageView Advisory Group, LLC | 169 | 6 | ||||||
| 2025-09-26 | NP | Templeton Global Income Fund | Short | -1.959 | -61 | |||||
| 2026-02-17 | 13F | Creative Planning | 66.270 | -35,96 | 2.302 | -32,35 | ||||
| 2026-02-12 | 13F | Advisors Asset Management, Inc. | 8.290 | -42,19 | 288 | -39,07 | ||||
| 2025-10-07 | 13F | Thurston, Springer, Miller, Herd & Titak, Inc. | 0 | -100,00 | 0 | |||||
| 2026-01-29 | 13F | UBS Group AG | 150.432 | -10,98 | 5.226 | -5,97 | ||||
| 2026-01-21 | 13F | Canton Hathaway, LLC | 16.350 | -0,35 | 568 | 5,00 | ||||
| 2025-11-05 | 13F | Koesten, Hirschmann & Crabtree, INC. | 0 | -100,00 | 0 | |||||
| 2026-02-09 | 13F | Glenview Trust Co | 6.000 | 208 | ||||||
| 2026-02-09 | 13F | MRP Capital Investments, LLC | 28.175 | 19,51 | 979 | 23,95 | ||||
| 2026-02-10 | 13F | Td Asset Management Inc | 7.015.901 | 3,83 | 244.192 | 9,65 | ||||
| 2025-10-21 | 13F | Optimum Investment Advisors | 1.125 | 0,00 | 37 | 0,00 | ||||
| 2026-02-02 | 13F | Truist Financial Corp | 26.067 | 10,34 | 906 | 16,47 | ||||
| 2026-02-10 | 13F | NINE MASTS CAPITAL Ltd | 31.549 | 1.096 | ||||||
| 2026-02-17 | 13F | Warren Averett Asset Management, LLC | 118.409 | -0,13 | 4.114 | 5,49 | ||||
| 2026-01-05 | 13F | GoalVest Advisory LLC | 1.697 | 0,00 | 59 | 5,45 | ||||
| 2026-01-22 | 13F | City Holding Co | 0 | -100,00 | 0 | -100,00 | ||||
| 2026-02-13 | 13F | Colony Group, LLC | 37.597 | 20,57 | 1.303 | 27,12 | ||||
| 2026-01-09 | 13F | SG Americas Securities, LLC | 70.614 | 106,28 | 2 | 100,00 | ||||
| 2026-01-21 | 13F | Westfuller Advisors, LLC | 1.343 | 1,21 | 47 | 6,98 | ||||
| 2026-02-02 | 13F | Principal Financial Group Inc | 31.407.038 | -1,78 | 1.091.081 | 3,75 | ||||
| 2026-02-03 | 13F | Washington Trust Advisors, Inc. | 10.083 | 0,00 | 350 | 5,74 | ||||
| 2026-02-09 | 13F | Delta Asset Management Llc/tn | 3.767 | 0,00 | 131 | 5,69 | ||||
| 2026-02-10 | 13F | Goldman Sachs Group Inc | 3.243.218 | 68,43 | 112.669 | 77,90 | ||||
| 2026-02-12 | 13F | Summit Financial, LLC | 12.842 | 0,00 | 446 | 5,69 | ||||
| 2026-02-02 | 13F | Fifth Third Bancorp | 415 | 0,00 | 14 | 7,69 | ||||
| 2026-01-14 | 13F | Wealthcare Advisory Partners LLC | 24.585 | -4,97 | 854 | 0,47 | ||||
| 2026-02-12 | 13F | Ci Investments Inc. | 2.889.580 | 0,13 | 100.384 | 106.691,49 | ||||
| 2026-02-09 | 13F | Huntington National Bank | 804 | 0,00 | 28 | 3,85 | ||||
| 2026-02-12 | 13F | Empower Advisory Group, LLC | 6.521 | 0,00 | 227 | 5,61 | ||||
| 2026-02-13 | 13F | Integrated Wealth Concepts LLC | 0 | -100,00 | 0 | |||||
| 2026-02-24 | 13F | Bell Investment Advisors, Inc | 461 | 0,00 | 16 | 6,67 | ||||
| 2026-02-02 | 13F | Montag A & Associates Inc | 160 | 0,00 | 6 | 0,00 | ||||
| 2026-02-18 | 13F | Mackenzie Financial Corp | 3.069.402 | -42,06 | 106.526 | -38,96 | ||||
| 2025-11-04 | 13F | Guerra Advisors Inc | 2 | 0 | ||||||
| 2026-01-09 | 13F | Pacifica Partners Inc. | 2.023 | 1.248,67 | 69 | 1.625,00 | ||||
| 2026-01-13 | 13F | Bank & Trust Co | 1.125 | 0,00 | 39 | 5,41 | ||||
| 2025-11-14 | 13F | Virtu Financial LLC | 0 | -100,00 | 0 | |||||
| 2026-02-17 | 13F | Susquehanna International Group, Llp | 15.391 | 39,80 | 535 | 47,51 | ||||
| 2026-01-22 | 13F | HHM Wealth Advisors, LLC | 3.762 | -12,25 | 131 | -7,80 | ||||
| 2026-02-17 | 13F | Susquehanna International Group, Llp | Call | 46.100 | 179,39 | 1.602 | 195,39 | |||
| 2025-10-27 | 13F | First Horizon Corp | 0 | -100,00 | 0 | |||||
| 2026-02-13 | 13F | Financial Network Wealth Advisors LLC | 424 | 0,00 | 15 | 7,69 | ||||
| 2026-01-27 | 13F | Sterling Investment Counsel, LLC | 6.711 | 213 | ||||||
| 2026-02-13 | 13F | Resources Management Corp /ct/ /adv | 450 | 0,00 | 0 | |||||
| 2026-02-17 | 13F | Jones Financial Companies Lllp | 13.212 | 8,23 | 459 | 13,37 | ||||
| 2026-02-17 | 13F | Agf Management Ltd | 904.943 | -57,50 | 31.456 | -55,17 | ||||
| 2026-01-20 | 13F | Toth Financial Advisory Corp | 50 | 0,00 | 2 | 0,00 | ||||
| 2026-01-29 | 13F | TBH Global Asset Management, LLC | 9.297 | 0,00 | 323 | 5,57 | ||||
| 2026-02-13 | 13F | Barclays Plc | 6.599 | 2.107,02 | 229 | 2.444,44 | ||||
| 2025-10-23 | 13F | Caldwell Trust Co | 0 | -100,00 | 0 | |||||
| 2026-02-17 | 13F | Voleon Capital Management Lp | 287.661 | 159,99 | 9.993 | 174,68 | ||||
| 2026-02-04 | 13F | Birchbrook, Inc. | 340 | 0,00 | 12 | 0,00 | ||||
| 2026-02-17 | 13F | Northern Trust Corp | 236.224 | -0,67 | 8.206 | 4,92 | ||||
| 2026-01-22 | 13F | Addenda Capital Inc. | 795.755 | -0,79 | 37.965 | 3,21 | ||||
| 2026-01-09 | 13F | Clear Trail Advisors, LLC | 6.994 | 243 | ||||||
| 2026-02-12 | 13F | Empire Financial Management Company, LLC | 40.792 | 1,00 | 1.417 | 6,70 | ||||
| 2026-01-23 | 13F | Nbt Bank N A /ny | 450 | 0,00 | 16 | 7,14 | ||||
| 2026-02-04 | 13F | Western Pacific Wealth Management, LP | 887 | 0,00 | 31 | 3,45 | ||||
| 2026-02-13 | 13F | Mml Investors Services, Llc | 7.039 | 2,88 | 245 | 8,44 | ||||
| 2026-02-03 | 13F | Broadwater Capital Management Llc | 1.170 | 0,00 | 41 | 5,26 | ||||
| 2026-02-24 | 13F | MidFirst Bank | 9.750 | 339 | ||||||
| 2026-02-13 | 13F | Acumen Wealth Advisors, LLC | 757 | 26 | ||||||
| 2026-01-23 | 13F | Sage Investment Counsel LLC | 37.803 | 0,00 | 1.313 | 5,63 | ||||
| 2026-02-03 | 13F | Morse Asset Management, Inc | 8.000 | 0,00 | 278 | 5,32 | ||||
| 2026-01-20 | 13F | Princeton Global Asset Management LLC | 972 | 0,00 | 34 | 6,45 | ||||
| 2026-02-12 | 13F | Bank Of Montreal /can/ | Call | 100.000 | 3.474 | |||||
| 2026-02-12 | 13F | Bank Of Montreal /can/ | 27.925.960 | -1,29 | 970.148 | 4,27 | ||||
| 2026-02-12 | 13F | Groupe la Francaise | 58.914 | 2.047 | ||||||
| 2026-01-27 | 13F | Regions Financial Corp | 13.501 | 0,00 | 469 | 5,63 | ||||
| 2026-01-22 | 13F | Apollon Wealth Management, LLC | 45.259 | 0,31 | 1.572 | 6,00 | ||||
| 2026-02-10 | 13F | Envestnet Asset Management Inc | 0 | -100,00 | 0 | |||||
| 2026-02-13 | 13F | Vivaldi Capital Management, LLC | 11.250 | 0,00 | 391 | 5,41 | ||||
| 2026-01-30 | 13F | Archer Investment Corp | 146 | 31,53 | 5 | 66,67 | ||||
| 2026-01-08 | 13F | Versant Capital Management, Inc | 11 | 0,00 | 0 | |||||
| 2026-01-26 | 13F | Cwm, Llc | 8.884 | -5,82 | 0 | |||||
| 2026-02-12 | 13F | Schneider Downs Wealth Management Advisors, LP | 15.057 | 0,00 | 523 | 5,66 | ||||
| 2025-11-14 | 13F | Horizon Kinetics Asset Management Llc | 0 | -100,00 | 0 | -100,00 | ||||
| 2026-02-12 | 13F | Jane Street Group, Llc | 508.001 | 704,05 | 17.648 | 749,64 | ||||
| 2026-02-12 | 13F | Jane Street Group, Llc | Put | 13.300 | -46,59 | 462 | -43,52 | |||
| 2026-02-12 | 13F | Jane Street Group, Llc | Call | 68.200 | 154,48 | 2.369 | 168,90 | |||
| 2026-02-11 | 13F | Franklin Resources Inc | 76.539 | -0,80 | 2.659 | 4,77 | ||||
| 2026-02-17 | 13F | TCG Advisory Services, LLC | 52.199 | -5,24 | 1.813 | 0,11 | ||||
| 2026-01-21 | 13F | Sound Income Strategies, LLC | 1.404 | 45,04 | 49 | 53,13 | ||||
| 2026-01-21 | 13F | Indiana Trust & Investment Management CO | 562 | 0,00 | 20 | 5,56 | ||||
| 2026-02-02 | 13F | Chung Wu Investment Group, LLC | 300 | 0,00 | 10 | 11,11 | ||||
| 2026-02-13 | 13F | Morgan Stanley | 3.343.528 | 61,39 | 116.154 | 70,47 | ||||
| 2026-02-04 | 13F | MONECO Advisors, LLC | 11.982 | 1,55 | 416 | 7,22 | ||||
| 2026-02-17 | 13F | Raymond James Financial Inc | 870.427 | 0,70 | 30.239 | 6,36 | ||||
| 2026-02-06 | 13F | HighTower Advisors, LLC | 93.526 | -1,37 | 3.249 | 4,20 | ||||
| 2026-01-30 | 13F | Us Bancorp \de\ | 3.215 | 43,21 | 112 | 52,05 | ||||
| 2026-02-06 | 13F | Pnc Financial Services Group, Inc. | 59.815 | -11,74 | 2.078 | -6,78 | ||||
| 2026-02-13 | 13F | Smartleaf Asset Management LLC | 975 | 225,00 | 34 | 266,67 | ||||
| 2025-11-13 | 13F | Promus Capital, LLC | 820 | 0,00 | 27 | -3,70 | ||||
| 2026-01-14 | 13F | Mirador Capital Partners LP | 6.832 | -1,61 | 237 | 3,95 | ||||
| 2026-02-06 | 13F | Gsa Capital Partners Llp | 6.725 | -21,30 | 0 | |||||
| 2026-02-11 | 13F | Janney Montgomery Scott LLC | 22.665 | -3,47 | 1 | |||||
| 2026-02-24 | 13F | Chelsea Counsel Co | 39.150 | 0,00 | 1.376 | 6,92 | ||||
| 2026-02-12 | 13F | Counterpoint Mutual Funds LLC | 12.471 | 372 | ||||||
| 2026-02-13 | 13F | MAI Capital Management | 136.117 | 2,74 | 4.729 | 8,52 | ||||
| 2026-01-05 | 13F | GAMMA Investing LLC | 303 | 0,00 | 11 | 11,11 | ||||
| 2026-02-11 | 13F | Empowered Funds, LLC | 549 | 19 | ||||||
| 2026-02-12 | 13F | Federation des caisses Desjardins du Quebec | 1.479.882 | -7,37 | 51.396 | -2,10 | ||||
| 2026-02-17 | 13F | Spears Abacus Advisors LLC | 193.549 | 0,00 | 6.724 | 5,62 | ||||
| 2026-02-17 | 13F | State Of Wisconsin Investment Board | 2.592.339 | 212,37 | 90.058 | 229,94 | ||||
| 2026-01-22 | 13F | Evermay Wealth Management Llc | 3.200 | 0,00 | 111 | 5,71 | ||||
| 2026-01-08 | 13F | Value Partners Investments Inc. | 50.785 | 3,75 | 1.768 | 9,62 | ||||
| 2026-02-12 | 13F | BRYN MAWR TRUST Co | 2.875 | 0,00 | 100 | 5,32 | ||||
| 2026-01-22 | 13F | JCIC Asset Management Inc. | 5.589 | 6,58 | 194 | 12,79 | ||||
| 2026-02-10 | 13F | Texas Yale Capital Corp. | 34.635 | -0,75 | 1.203 | 4,88 | ||||
| 2026-02-10 | 13F | Fort Sheridan Advisors Llc | 56.209 | -7,00 | 1.953 | -1,76 | ||||
| 2026-02-10 | 13F | CIBC World Markets Inc. | 6.688.284 | 0,37 | 232.351 | 6,02 | ||||
| 2026-02-17 | 13F | Scarborough Advisors, LLC | 165 | -3,51 | 6 | 0,00 | ||||
| 2026-02-13 | 13F | National Bank Of Canada /fi/ | 5.307.915 | -5,89 | 183.931 | -0,66 | ||||
| 2026-02-13 | 13F | Rhumbline Advisers | 90 | 0,00 | 3 | 50,00 | ||||
| 2026-02-03 | 13F | Crossmark Global Holdings, Inc. | 15.390 | -24,02 | 535 | -19,82 | ||||
| 2026-02-17 | 13F | Bank Of America Corp /de/ | 547.847 | 39,47 | 19.032 | 47,32 | ||||
| 2026-02-02 | 13F | Oppenheimer & Co Inc | 46.286 | 1,10 | 1.608 | 6,78 | ||||
| 2026-02-11 | 13F | J.w. Cole Advisors, Inc. | 12.289 | 0,07 | 420 | 3,97 | ||||
| 2026-01-26 | 13F | Lakewood Asset Management LLC | 14.369 | 0,00 | 499 | 5,72 | ||||
| 2025-11-14 | 13F | SWAN Capital LLC | 0 | -100,00 | 0 | |||||
| 2025-11-14 | 13F | Stone Run Capital, Llc | 48.930 | 0,02 | 1.609 | -1,77 | ||||
| 2026-02-13 | 13F | Mufg Securities (canada), Ltd. | 702.294 | -7,96 | 24.417 | -2,88 | ||||
| 2026-02-06 | 13F/A | Rathbone Brothers plc | 95.723 | 15,00 | 3.325 | 21,48 | ||||
| 2026-02-10 | 13F | CIBC Asset Management Inc | 8.559.336 | 7,40 | 297.699 | 13,49 | ||||
| 2026-02-17 | 13F | Select Equity Group, L.P. | 62.951 | -78,17 | 2.187 | -76,95 | ||||
| 2025-11-12 | 13F | IFG Advisory, LLC | 0 | -100,00 | 0 | -100,00 | ||||
| 2026-01-14 | 13F | Eastern Bank | 4.499 | 0,00 | 156 | 6,12 | ||||
| 2026-02-17 | 13F | Toronto Dominion Bank | 3.894.974 | 26,10 | 135.389 | 33,04 | ||||
| 2026-02-17 | 13F | Toronto Dominion Bank | Call | 688.300 | -42,43 | 23.926 | -39,26 | |||
| 2026-02-17 | 13F | Toronto Dominion Bank | Put | 203.000 | -1,60 | 7.056 | 3,83 | |||
| 2026-01-28 | 13F | Gold Investment Management Ltd. | 172.723 | 1,84 | 6.004 | 7,43 | ||||
| 2026-02-13 | 13F | Visionary Wealth Advisors | 9.811 | -12,57 | 341 | -7,86 | ||||
| 2026-02-13 | 13F | Bank Of Nova Scotia | 2.197.491 | -23,26 | 76.382 | -19,06 | ||||
| 2026-02-13 | 13F | 1832 Asset Management L.P. | 9.184.457 | -16,06 | 319.068 | -11,34 | ||||
| 2026-02-18 | 13F | Braeburn Wealth Management LLC | 15.823 | 550 | ||||||
| 2026-02-12 | 13F | Wealthspire Advisors, LLC | 0 | -100,00 | 0 | |||||
| 2026-02-11 | 13F | Picton Mahoney Asset Management | 1.842.718 | 4,18 | 64.144 | 110.491,38 | ||||
| 2026-01-30 | 13F | Keybank National Association/oh | 38.399 | 1,45 | 1.334 | 7,15 | ||||
| 2026-02-17 | 13F | Fmr Llc | 34.621 | 48,84 | 1.205 | 57,39 | ||||
| 2026-02-17 | 13F | Ameriflex Group, Inc. | 150 | -50,00 | 5 | -44,44 | ||||
| 2026-02-17 | 13F | Munro Partners | 356.240 | 99,87 | 12.376 | 111,11 | ||||
| 2026-02-18 | 13F | EP Wealth Advisors, Inc. | 13.162 | 19,13 | 457 | 23,51 | ||||
| 2026-01-20 | 13F | Tritonpoint Wealth, Llc | 139.647 | -6,71 | 4.851 | -1,46 | ||||
| 2026-02-18 | 13F | State of Tennessee, Treasury Department | 261.653 | -0,53 | 9.524 | 9,85 | ||||
| 2026-01-26 | 13F | Roof Eidam & Maycock/adv | 6.750 | 0,00 | 234 | 5,41 | ||||
| 2026-02-13 | 13F | Kestra Advisory Services, LLC | 0 | -100,00 | 0 |
Other Listings
| CA:BIP.UN | 50,20 CA$ |